
95% of researchers rate our articles as excellent or good
Learn more about the work of our research integrity team to safeguard the quality of each article we publish.
Find out more
ORIGINAL RESEARCH article
Front. Phys. , 18 September 2023
Sec. Radiation Detectors and Imaging
Volume 11 - 2023 | https://doi.org/10.3389/fphy.2023.1205638
 P. Zambon*C. Amato
We developed an analytical model to evaluate the effect of signal pileup on the recorded energy spectrum in X-ray photon-counting detectors affected by dead time and equipped with retrigger capability. The retrigger function allows the system to work in a specific non-paralyzable counting mode by counting the time-over-threshold of piled-up signals in multiples of a predefined and selectable retrigger time. The model, designed for rectangle-like-shaped signals, allows for arbitrary input energy spectra and can significantly help understand and optimize the behavior of counting detectors with spectral capabilities and retrigger mechanisms in applications involving polychromatic beams, e.g., spectral X-ray imaging and computed tomography (CT), in a time-efficient way. Dedicated numerical simulations were used to validate the model under several conditions of incoming flux and threshold energy, with excellent results.
In the classic configuration of a particle-counting detector, an event is detected as soon as a signal passes a certain threshold level, and for the time-over-threshold period, the system is insensitive to additional signals. At high incoming rates, events undergo pileup, and the resulting signal frequently exceeds the threshold, paralyzing the counting capability. This behavior is well-described for monochromatic signal pulses by the commonly known paralyzable counting mode, where the recorded rate m is related to the incoming rate n—assumed to follow Poisson statistics—with the relation
An additional and equally fundamental problem of pulse pileup is the distortion brought to the energy spectrum recorded by the detector. This has potential implications for all those applications interested in the spectral content of the detected radiation up to high levels of incoming fluxes, e.g., X-ray imaging and CT. In the last decade, it has been demonstrated that photon-counting systems can not only bring a series of potential improvements with respect to traditional energy-integrating systems in the field of X-ray imaging and computed tomography (CT)—such as lower noise, dose efficiency, and higher spatial resolution—but also allow for novel diagnostic techniques based on their uniquely offered spectral-resolving capabilities [8–13]. Understanding the dynamics of pileup-driven spectral distortion is, therefore, crucial for guiding the design and optimization of future photon-counting systems, both from the hardware and image processing/algorithm point of view. Monte Carlo-based numerical tools are a widespread choice to address this kind of problem as they provide an extremely flexible and accurate framework but are often data-intensive and time-consuming routines. Analytical (or semi-analytical) models can significantly help in this respect, providing a deeper understanding of the underlying physics and a better knowledge of the functional dependence of the model parameters.
Examples of counting detectors operating in the classic non-paralyzable1 mode and for triangular-like pulse shapes can be found in [14]; the extension to the case of the classic paralyzable mode is discussed in [15, 16], addressing it in an exact way and for arbitrary pulse shapes. Additionally, [17] addresses both counting modes in a semi-analytical manner, in principle extendable to arbitrary pulse shapes. The peculiar behavior introduced by the retrigger mechanism requires, however, a dedicated form of treatment, which has not yet been addressed. In this work, we present the derivation and validation of an analytical model that relates the recorded rate to the incoming rate in counting systems featuring the retrigger capability for arbitrary input energy spectra. The goal is to provide a simple and time-efficient tool to evaluate the spectral performance of this not-yet-fully explored class of detectors up to high levels of the incoming rate. To achieve this, we extended the previously described model in [6] to the case of the polychromatic input energy spectrum. For the needs of the analytical treatment, signals are assumed to be rectangle-like shaped.
The model is validated through a comparison with Monte Carlo simulations, which mimic the realistic case study of a direct X-ray tube beam impinging on a pixelated cadmium telluride (CdTe) sensor read out by a counting ASIC over a wide range of threshold energies and for values of incoming rates relevant for clinical CT applications.
The paper is organized as follows. In Section 2.1, we resume the working principle of the retrigger mechanism; in Section 2.2, we derive the analytical model, in Section 2.3, we introduce the Monte Carlo simulation framework used for the comparison; and in Section 2.4, we describe the used case study. Validation results are presented and discussed in Section 3.1 in terms of the recorded count rate as a function of the incoming rate and in Section 3.2 in terms of the recorded spectra as a function of the incoming rate. Finally, in Section 3.3, we evaluate the impact of a realistic (non-ideal) pulse shape on the recorded spectra.
To ease the reading, we provide a brief description of the retrigger mechanism principles, which have already been carefully addressed in [3, 6], with the help of Figure 1. In single X-ray photon counting circuitry, an event is detected and counted as soon as the rising edge of the incoming analog signal (shaperout) exceeds a predefined threshold (vth). Without a retrigger mechanism, during the time-over-threshold, the system is “dead” or insensitive to further incoming signals (pileup), leading to paralyzation at high fluxes (count paralyzed). Conversely, with the retrigger mechanism, as soon as the first analog signal exceeds the threshold, an additional internal digital dead time signal (deadgenout) is generated and periodically evaluated—with a configurable period that we call retrigger time τR (tdead). At every evaluation, if the incoming signal is still high, the counter is increased by a unit; if it has fallen below the threshold, the dead time signal is deactivated. Possible threshold crossings during the τR period do not give rise to counts. In this way, a non-paralyzable counting mode is achieved (count retriggered) with a limiting recorded rate of 1/τR in the high flux regime. The value of τR is customarily set slightly longer than the time-over-threshold of the input signal to prevent the system counting individual pulses multiple times.
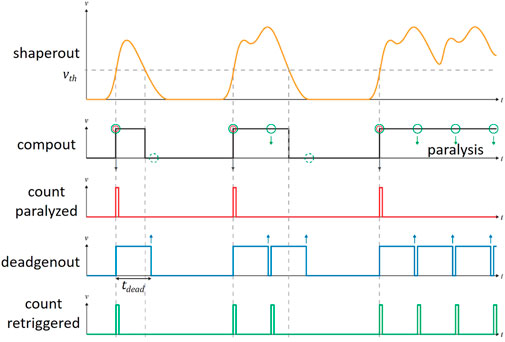
FIGURE 1. Signal waveforms illustrating the retrigger mechanism, obtained from [3].
The model is derived based on the following assumptions:
i. The events’ arrival follows Poisson statistics with an average true incoming rate n.
ii. The signals have the shape of a rectangle with a width τP.
iii. Signals’ amplitudes are mutually independent stochastic variables and are distributed according to a probability function that corresponds to the energy spectrum sE(ϵ).
iv. The retrigger time is longer than the pulse width, i.e., τR > τP 2
As for the monochromatic case described in [6], to the purpose of an analytical treatment of the problem, it is easier to focus on the rate loss n − m. This can be expressed for convenience as the sum of four separate contributions that we call l1, l2, l3, and l4 such that
l1 and l2 deal with the rate loss occurring in the “dead time” period after the detection of a signal or after an evaluation of the retrigger signal; l3 deals with the possibility of an incoming event being undetected in the first place; and l4 deals with the rate loss occurring during the time periods in between detected events.
In the following list, we describe the derivation of l1 to l4:
Before making l2 explicit, it is necessary to introduce the following notation. Given sE(ϵ) as the probability density function of the amplitude (which is proportional to its energy) of an individual signal, by definition the corresponding cumulative distribution function, SE(ϵ) is
When i signals pileup, the stochastic variable
from which the corresponding cumulative distribution function can be deduced as
Let us also recall the probability of having i incoming events following the Poisson distribution in the time interval τP.
We can now write l2 as
where Eth is the threshold energy of the counting circuitry. Rearranging the terms, we can write that
Considering that
and since
with the term 1/T arising for normalization purposes. Defining
We can finally substitute the expressions of l1 to l4 of Eqs. 2, 10, 11, and 13, respectively, into Eq. 1, and by solving it for m, we obtain the final relation.
A few remarks were observed. Since the energy spectrum sE(ϵ) is a free parameter of the model that usually lacks an analytical formulation, the terms
To validate the model, we used the numerical results of the custom-developed Monte Carlo model already used in [6, 7], consisting of the following. First, a temporal axis is created, spanning a statistically relevant length of several tens of ms and with a sufficiently small time step, typically on the order of ns. a number pulse-like events, computed according to the chosen value of the incoming rate, are distributed across the temporal axis, following a Poisson distribution. This resulting signal, which corresponds to the input of the detector system, is then convolved with the pulse shape of the analog front-end electronics, which is, in principle, arbitrary but is assumed to be a rectangle function in this context. To mimic the behavior of the counting electronics, a count is recorded for every rising edge crossing a specified threshold. If the retrigger capability is enabled, a count is also added for every time interval of length τR for which the signal lies above the threshold. The total recorded counts are then normalized to the overall temporal axis length to obtain the recorded rate. The entire operation is repeated for several values of the incoming rate and as a function of the threshold energy. The simulation error is estimated by subdividing the total time span into a set of smaller intervals of equal size, computing the variance over their ensemble, and scaling it to the overall interval time (see Appendix A).
The amplitudes of the incoming signals are randomly and independently extracted from a probability distribution function that corresponds to the specified energy spectrum. The energy spectrum was obtained as the convolution of the direct spectrum of an X-ray tube, computed with the model described in [18], with the response function of a pixelated counting detector, estimated based on the numerical results from FLUKA3—a Monte Carlo particle transport and interaction suite [19, 20]—and a custom-developed pixelization and counting routine. Specifically, the FLUKA code computes, for a large number of incoming X-ray photons, the individual energy depositions in the sensor volume at the microscopic level, including all secondary effects like fluorescence and escape. The pixelization routine translates deposited energy into electric charge, which is drift-diffused toward the collecting electrodes. Signals collected at the pixel side (comprehensive of charge sharing effects) are added to a Gaussian random signal representing the electronic noise and subsequently histogrammed to obtain the sought energy spectrum.
The predictions of the analytical model were compared with the results of Monte Carlo simulations for a realistic case study consisting of a direct beam from an X-ray tube with a W-anode, an acceleration voltage of 120 kVp, and 6.8 mm Al filtering, detected using a CdTe sensor with a pixel size of 330 μm and a thickness of 1500 μm, and read out by a counting ASIC. The spectrum and the threshold energy were sampled with a step of 1 keV. The front-end electronics was assumed to introduce a noise of 1 keV rms. The pulse time was τP = 80 ns, and the retrigger time was τR = 100 ns. Incoming fluxes n were investigated up to 108 ph/s/pix, which corresponds to roughly 109 ph/s/mm2 for the used pixel size, a value that can be considered the upper boundary in clinical CT applications. Figure 2 shows the energy spectrum as detected by the pixelated detector and used as input for both the model and Monte Carlo simulations. The spectrum of the original direct X-ray tube beam is also shown as a reference.
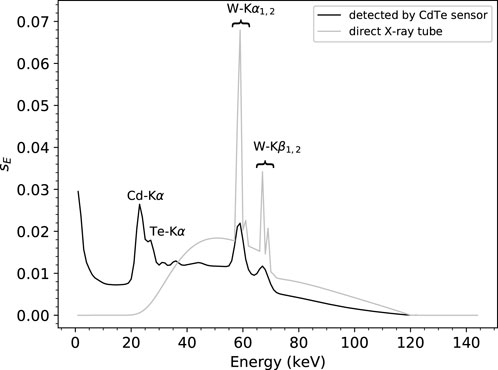
FIGURE 2. Energy spectrum detected using a CdTe sensor with a pixel size of 330 μm and a thickness of 1500 μm, used as input for both the model and the Monte Carlo simulations. The direct X-ray tube beam spectrum (W-anode, an acceleration voltage of 120 kVp, and 6.8 mm Al filtering) is shown as a reference, and the main fluorescence peaks originated from the W-anode of the X-ray tube and the CdTe sensor.
Figure 3 shows the comparison between the count rate curves predicted by the model and simulated with the Monte Carlo tool for incoming rates up to 108 ph/s/pix and several values of threshold energies ranging from 5 keV to 140 keV. The rate curve corresponding to the total counts—intended as the ideal (no pileup and no electronic noise) rate obtained with a threshold energy of 0 keV—is also shown as a reference. For increasing threshold energies, the deviation of the recorded curves from one of the total counts, even at low incoming rates, becomes larger as the obvious consequence of losing an increasing fraction of low-energy events. On the other hand, all the recorded curves saturate for increasing incoming rates to the limit 1/τR, set by the retrigger mechanism. As a quantitative measure of the agreement between predicted and simulated results, we chose the L2 relative error norm (L2REN), which is defined as follows:
where NoP is the number of analyzed points. The values are reported in Table 1. An excellent match on the sub-percent level is obtained up to the last threshold energy (90 keV in this case), whose value lies below the highest energy actually contained in the input spectrum, i.e., 120 keV. For threshold energies higher than that, only pure piled-up events are detected, and the increase in L2REN seems to suggest that the accuracy of the approximations used in the derivation of the model (in particular, the term l4) begins, in these conditions, to fade.
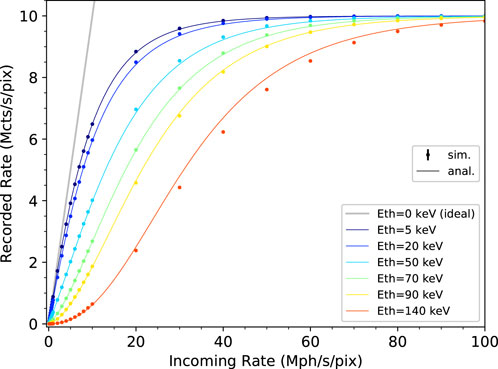
FIGURE 3. Count rate curves predicted by the model and simulated with the Monte Carlo tool for different values of threshold energy, including the ideal (no pileup and no electronic noise) rate at the threshold energy of 0 keV. Error bars of the simulated data are smaller than the used graphical symbol.
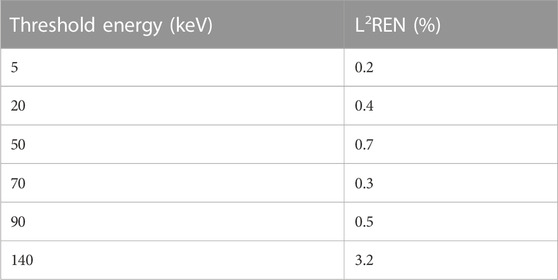
TABLE 1. L2REN of the count rate curves.
Figure 4 (top) shows the comparison between the recorded integral energy spectra predicted by the model and simulated with the Monte Carlo tool as a function of the threshold energy and for increasing values of incoming rates ranging from n = 105 ph/s/pix to n = 108 ph/s/pix. Figure 4 (bottom) shows the corresponding deviations expressed in percentage. Looking at the integral spectra, it is possible to observe how, for increasing incoming rates, events of energy higher than the highest one contained in the input spectrum, i.e., 120 keV, and, therefore due to pure pileup effects, are detected with increasing probability. At the same time, the integral spectra tend to the limit set by the retrigger mechanism 1/τR, in a monotonic (i.e., non-paralyzable) way at all values of threshold energy. The relative deviation is in the order of a few percent up to the notable value of 120 keV (between −8% and +4%), a result that we can consider excellent considering the several orders of magnitudes spanned by the spectra across this threshold energy range. For threshold energies higher than this limit and high input rates (above 2⋅107 ph/s/pix), the deviation slightly increases. As previously mentioned, this could be due to the approximations used in the derivation of the model starting to lose their validity. It is nevertheless worth noting that, in a realistic X-ray imaging/CT scenario, the threshold energy is not set above a certain fraction of the X-ray tube acceleration voltage. Therefore, a discrepancy in this extreme energy range is not of practical concern. For this reason, we limited the computation of the L2REN figure of merit to the threshold energy interval of 1 keV–120 keV. The values, reported in Table 2, show the agreement that lies at the (sub-)percent level.
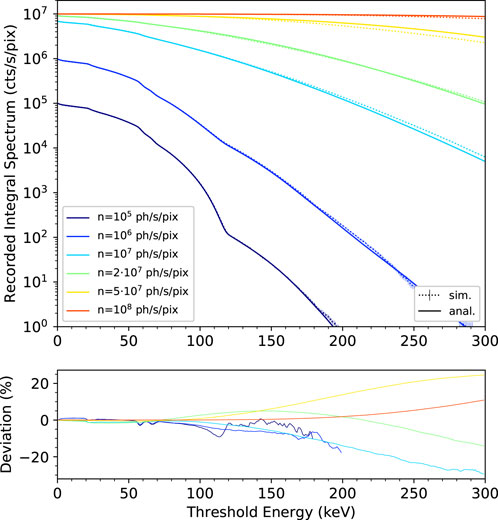
FIGURE 4. Recorded integral energy spectra predicted by the model (solid lines) and simulated with the Monte Carlo tool (dotted lines plus error bars) for increasing values of the incoming rate (top). Corresponding relative deviation in percentage (bottom).

TABLE 2. L2REN of the recorded integral spectra in the energy range of 1–120 keV.
Figure 5 shows the comparison between the recorded differential energy spectra obtained by numerical derivation of the integral spectra of Figure 4 (top) with respect to the threshold energy and the corresponding relative deviations. The L2REN metrics, computed in the threshold energy interval of 1–120 keV, are reported in Table 3. Although higher values of deviation as compared to the recorded integral spectra have to be expected due to the “amplification” caused by the derivative operation, they nevertheless lie below 10% up to incoming rates of 2⋅107 ph/s/pix and at most 20% for higher incoming rates, which are anyway rather extreme as they basically lead to an almost complete count rate saturation.
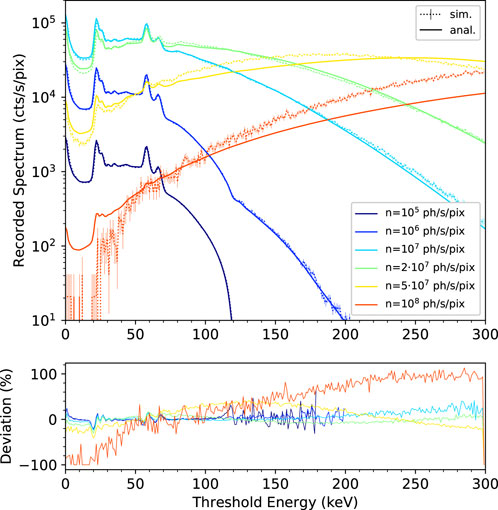
FIGURE 5. Recorded differential energy spectra obtained by deriving the curves of Figure 4 (top) with respect to the threshold energy. Corresponding relative deviation in percentage (bottom).

TABLE 3. L2REN of the recorded spectra in the energy range of 1–120 keV.
Based on these results, we can conclude that the predictions of the presented analytical model faithfully represent the expectations obtained by numerical tools.
Real-world analog signals have shapes that significantly differ from the ideal rectangle. Apart from few other special cases (e.g., pulses with a triangular shape in [14] or with a decreasing exponential shape in [16]), a general analytical solution for arbitrary shapes remains, at the moment, more complex, if not out of sight.
To evaluate the impact of this non-ideality on the recorded spectra, we simulated a case study intentionally violating assumption ii. In particular, we used a more realistic pulse shape consisting of an asymmetric Gaussian-like function, as shown in Figure 6. The curve was created by using, as a rising edge, a Gaussian function with a standard deviation of 36 ns and, as a falling edge, a Gaussian function with a standard deviation of 134 ns. The overall FWHM is 80 ns, matching one of the ideal rectangles. The retrigger time was increased to
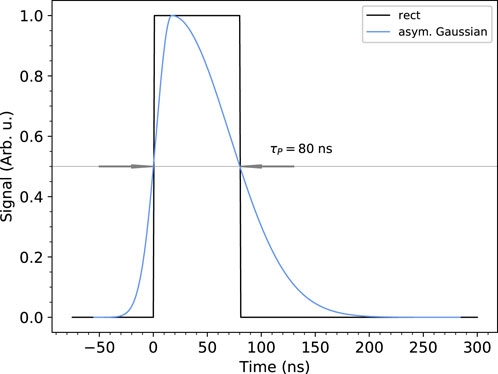
FIGURE 6. Asymmetric Gaussian-like function used as a realistic pulse shape. The rising edge consists of a Gaussian function with a standard deviation of 36 ns and a falling edge but with a standard deviation of 134 ns. The ideal rectangle function is shown for comparison.
Figure 7 and Figure 8 show, respectively, the resulting integral and differential energy spectra (top) and corresponding relative deviations (bottom). Analytical data were recomputed with the new value of retrigger time. What emerges from the comparison is that while the overall trends are respected, significant deviations arise for values of incoming flux n ≥ 107 ph/s/pix and threshold energies Eth < 10 keV. This is due to the fact that the model does not take into account the possibility that individual signals can have a time-over-threshold longer than the chosen retrigger time due to the longer pulse tail. The values of L2REN computed in the energy range of 10–120 keV for the recorded integral spectra vary in the range of 0.6%–6.4% (see Table 4), while for the recorded differential spectra, they monotonically increase from 8% to 106% with increasing incoming fluxes (see Table 5).
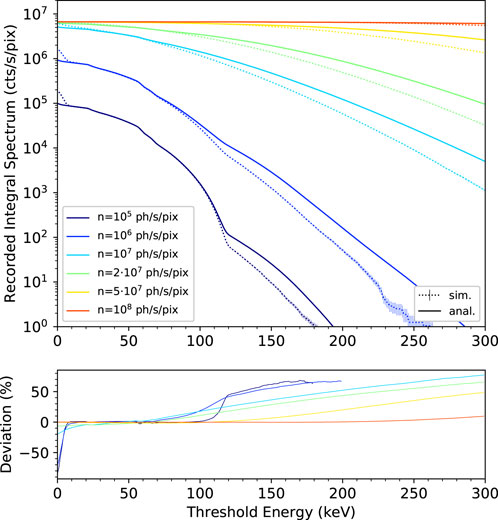
FIGURE 7. Recorded integral energy spectra predicted by the model (solid lines) and simulated with the Monte Carlo tool (dotted lines plus error bars) using the asymmetric Gaussian-like pulse shape of Figure 6 (top). The retrigger time was increased to
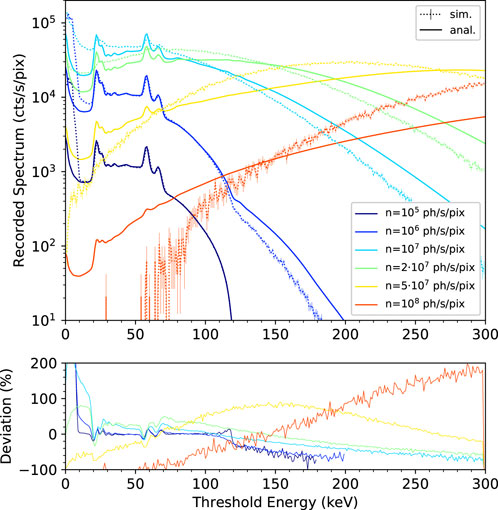
FIGURE 8. Recorded differential energy spectra obtained by deriving the curves of Figure 7 (top) with respect to the threshold energy. Corresponding relative deviation in percentage (bottom).
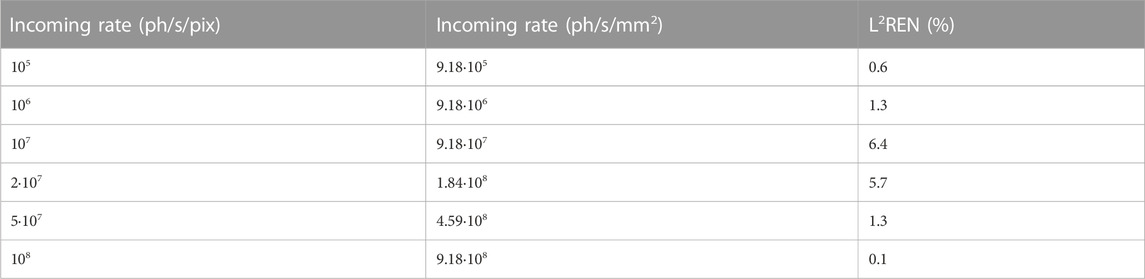
TABLE 4. L2REN of the recorded integral spectra in the energy range of 1–120 keV using the asymmetric Gaussian-like pulse shape.
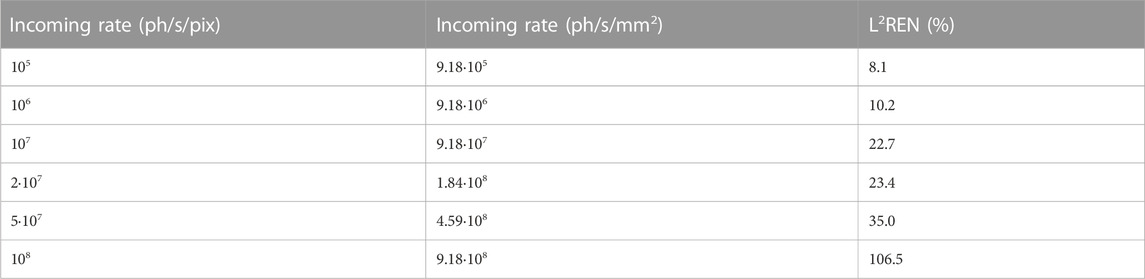
TABLE 5. L2REN of the recorded spectra in the energy range of 1–120 keV using the asymmetric Gaussian-like pulse shape.
It is also legit to question whether the general discrepancy could be “compensated” by the use of an effective pulse time τPeff, as described in [6]. Unfortunately, as shown in the reference, τPeff would be a function of the threshold energy (to be empirically found, moreover) and, therefore, not compatible with the model presented in this work.
We presented the derivation of an analytical model to evaluate the effect of pulse pileup on the recorded energy spectrum measured by X-ray photon-counting detectors affected by dead time and featuring the retrigger capability—a circuital mechanism that allows the detector to work in a specific non-paralyzable counting mode. The model is valid for arbitrary incoming energy spectra and derived for the case of a rectangle-like pulse shape.
We compared the analytical predictions with the results of Monte Carlo simulations obtained with a custom-developed numerical code for the realistic clinical CT case study of a direct X-ray tube beam with an acceleration voltage of 120 kVp, impinging on a CdTe sensor with a pixel size of 330 μm and a thickness of 1500 μm, and read out by a counting ASIC. The investigated quantities (count rate curves and recorded energy spectra) showed an excellent level of agreement, quantified in terms of L2REN, over a wide range of incoming rates relevant for X-ray CT applications, i.e., up to 108 ph/s/pix, which corresponds to approximately 109 ph/s/mm2 with our pixel size, and over a wide range of threshold energies. Slight deviations, possibly ascribable to approximations used in the model derivation, were progressively found for the concurrence of increasing threshold energies above the highest energy contained in the incoming spectrum and mid-high incoming rates (
Despite the simplification of rectangle-like shaped signals needed for the analytical treatment of the problem, having an analytical expression for the recorded count rate for such a class of detectors can significantly help better understand the yet unexplored impact of the retrigger mechanism on the spectral response and optimize the system design and parameters, all in a time-efficient way, with potential benefits in particular in the field of spectral X-ray imaging and CT applications allowed by modern multi-threshold photon-counting systems.
The raw data supporting the conclusion of this article will be made available by the authors, without undue reservation.
PZ: conception, theory, data analysis, and writing. CA: conception, Monte Carlo simulations, and proof-reading. All authors contributed to the article and approved the submitted version.
Authors PZ and CA were employed by DECTRIS Ltd.
All claims expressed in this article are solely those of the authors and do not necessarily represent those of their affiliated organizations, or those of the publisher, the editors, and the reviewers. Any product that may be evaluated in this article, or claim that may be made by its manufacturer, is not guaranteed or endorsed by the publisher.
The Supplementary Material for this article can be found online at: https://www.frontiersin.org/articles/10.3389/fphy.2023.1205638/full#supplementary-material
1The classic non-paralyzable counting mode exhibits a relation
2This condition prevents counting single events multiple times, which is usually an undesired effect in a retriggered system, unless it is intentionally operated in a time-over-threshold mode, as shown in [21].
3v. 4–2.1. The physics was set to multiple Coulomb scattering with a cutoff energy of 1 keV for electrons and 100 eV for photons. Fluorescence was enabled, and no biasing was used.
1. Kraft P, Bergamaschi A, Broennimann C, Dinapoli R, Eikenberry EF, Henrich B, et al. Performance of single-photon-counting PILATUS detector modules. J Synchrotron Radiat (2009) 16:368–75. doi:10.1107/s0909049509009911
2. Knoll GF. Radiation detection and measurement. 3rd ed. New Jersey United States: John Wiley and Sons, Inc. (2000). 119–22. Chapter 3.
3. Loeliger T, Broennimann C, Donath T, Schneebeli M, Schnyder R, Trueb P. The new PILATUS3 ASIC with instant retrigger capability. In: IEEE Nuclear Science Symposium and Medical Imaging Conference Record (NSS/MIC) N6-2 (2012). p. 610–5. doi:10.1109/NSSMIC.2012.6551180
4. Bochenek M, Bottinelli S, Broennimann C, Livi P, Loeliger T, Radicci V, et al. Ibex: Versatile readout asic with spectral imaging capability and high count rate capability. IEEE Trans Nucl Sci (2018) 65:1285–91. doi:10.1109/TNS.2018.2832464
5. Zambon P, Bottinelli S, Schnyder R, Musarra D, Boye D, Dudina A, et al. Kite: High frame rate, high count rate pixelated electron counting ASIC for 4D STEM applications featuring high-Z sensor. Nucl Inst. Methods Phys Res A (2023) 1048(2023):167888. doi:10.1016/j.nima.2022.167888
6. Zambon P. Dead time model for X-ray photon counting detectors with retrigger capability. Nucl Inst. Methods Phys Res A (2021) 994:165087. doi:10.1016/j.nima.2021.165087
7. Zambon P. Temporal and spatial variance in pixelated counting detectors with dead time and retrigger capability. Nucl Inst. Methods Phys Res A (2022) 1032:166625. doi:10.1016/j.nima.2022.166625
8. Taguchi K, Iwanczyk JS. Vision 20/20: Single photon counting x-ray detectors in medical imaging. Med Phys (2013) 40:100901. doi:10.1118/1.4820371
9. Symons R, Krauss B, Sahbaee P, Cork TE, Lakshmanan MN, Bluemke DA, et al. Photon-counting CT for simultaneous imaging of multiple contrast agents in the abdomen: An in vivo study. Med Phys (2017) 44(10):5120–7. doi:10.1002/mp.12301
10. Willemink MJ, Persson M, Pourmorteza A, Pelc NJ, Fleischmann D. Photon-counting CT: Technical principles and clinical prospects. Radiology (2018) 289:293–312. doi:10.1148/radiol.2018172656
11. Mannil M, Hickethier T, von Spiczak J, Baer M, Henning A, Hertel M, et al. Photon-counting CT high-resolution imaging of coronary stents. Invest Radiol (2018) 53:143–9. doi:10.1097/RLI.0000000000000420
12. Flohr T, Petersilka M, Henning A, Ulzheimer S, Ferda J, Schmidt B. Photon-counting CT review. Physica Med (2020) 79:126–36. doi:10.1016/j.ejmp.2020.10.030
13. Lell MM, Kachelrieß M. Recent and upcoming technological developments in computed tomography. Invest Radiol (2020) 55:8–19. doi:10.1097/RLI.0000000000000601
14. Taguchi K, Frey EC, Wang X, Iwanczyk JS, Barber WC. An analytical model of the effects of pulse pileup on the energy spectrum recorded by energy resolved photon counting x-ray detectors. Med Phys (2010) 37:3957–69. doi:10.1118/1.3429056
15. Taguchi K, Zhang M, Frey EC, Wang X, Iwanczyk JS, Nygard E, et al. Modeling the performance of a photon counting x-ray detector for CT: Energy response and pulse pileup effects. Med Phys (2011) 38:1089–102. doi:10.1118/1.3539602
16. Roessl E, Daerr H, Proksa R. A Fourier approach to pulse pile-up in photon-counting x-ray detectors. Med Phys (2016) 43(3):1295–8. doi:10.1118/1.4941743
17. Cammin J, Kappler S, Weidinger T, Taguchi K. Evaluation of models of spectral distortions in photon-counting detectors for computed tomography. J Med Imag (2016) 3(2):023503. doi:10.1117/1.JMI.3.2.023503
18. Tucker DM, Barnes GT, Chakraborty DP. Semiempirical model for generating tungsten target x-ray spectra. Med Phys (1991) 18:211–8. doi:10.1118/1.596709
19. Ferrari A, Sala PR, Fasso A, Ranft J. Fluka: A multi-particle transport code (2005). Program version 2005 [INFN-TC-05-11].
20. Böhlen T, Cerutti F, Chin M, Fassò A, Ferrari A, Ortega P, et al. The FLUKA code: Developments and challenges for high energy and medical applications. Nucl Data Sheets (2014) 120:211–4. doi:10.1016/j.nds.2014.07.049
21. Bergamaschi A, Dinapoli R, Greiffenberg D, Henrich B, Johnson I, Mozzanica A, et al. Time-over-threshold readout to enhance the high flux capabilities of single-photon-counting detectors. J Synchrotron Radiat (2011) 18:923–9. doi:10.1107/S0909049511034480
Let T be the total simulated time interval, M be the total number of recorded events in this time interval, and m be the recorded rate, then we obtain m = M/T. By dividing the total interval T into N sub-intervals of equal size (large enough to maintain a relevant statistics), we obtain Mi independent recorded counts for each sub-interval such that
Given that Mi shares the same probability space, the variance of m can be inferred using the basic properties of random variables as follows:
Keywords: counting detector, non-paralyzable, retrigger, dead time, pulse pileup, spectral distortion
Citation: Zambon P and Amato C (2023) Pulse pileup model for spectral resolved X-ray photon-counting detectors with dead time and retrigger capability. Front. Phys. 11:1205638. doi: 10.3389/fphy.2023.1205638
Received: 14 April 2023; Accepted: 22 August 2023;
Published: 18 September 2023.
Edited by:
Xianfei Wen, The University of Tennessee, United StatesReviewed by:
Giovanni Di Domenico, University of Ferrara, ItalyCopyright © 2023 Zambon and Amato. This is an open-access article distributed under the terms of the Creative Commons Attribution License (CC BY). The use, distribution or reproduction in other forums is permitted, provided the original author(s) and the copyright owner(s) are credited and that the original publication in this journal is cited, in accordance with accepted academic practice. No use, distribution or reproduction is permitted which does not comply with these terms.
*Correspondence: P. Zambon, pietro.zambon@dectris.com
Disclaimer: All claims expressed in this article are solely those of the authors and do not necessarily represent those of their affiliated organizations, or those of the publisher, the editors and the reviewers. Any product that may be evaluated in this article or claim that may be made by its manufacturer is not guaranteed or endorsed by the publisher.
Research integrity at Frontiers
Learn more about the work of our research integrity team to safeguard the quality of each article we publish.