 Fabricio Moreira Reis*
 Maryanne Zilli Canedo da Silva
 Nayrana Soares do Carmo Reis
 Fabiana Lourenço Costa
 Caroline Ferreira da Silva Mazeto Pupo da Silveira
 Pasqual Barretti
 Luis Cuadrado Martin
 Silméia Garcia Zanati Bazan
- Department of Internal Medicine, Botucatu Medical School-UNESP, São Paulo State University, Botucatu, Brazil
Introduction: The phase angle (PhA) has been used as a nutritional marker and predictor of mortality in patients on peritoneal dialysis (PD). The coronary artery calcium (CAC) score has shown to predict the incidence of acute myocardial infarction and death from cardiovascular disease in these patients. However, the association between PhA and CAC score in patients with PD is not well-established, which is the objective of this study.
Materials and methods: Cross-sectional study with patients on PD, followed up at a University Hospital, between March 2018 and August 2019. PhA was evaluated by unifrequency bioimpedance (BIA). The CAC score was calculated based on cardiovascular computed tomography, considering positive when greater than or equal to 100 Agatston and negative when less than 100 Agatston.
Results: We evaluated 44 patients on dialysis, with a mean age of 56 years and median time on dialysis therapy was 11.7 months. In the statistical analysis, a significant association was only observed between the CAC score and the PhA.
Conclusion: The PhA is associated with a positive CAC score in patients with PD, and despite other factors, may be useful as a risk marker for coronary artery disease in this population.
Introduction
It is known that 23–76% of patients on dialysis are malnourished, and 6–8% have severe malnutrition (1). Malnutrition is a risk factor for mortality (2, 3) and its causes are multifactorial, including hemodynamic, hormonal, inflammatory changes, and water overload, leading to protein energy wasting (PEW) (4).
Bioelectrical impedance (BIA) has been used to assess body composition (5–8). Its application is based on the electrical properties of the biological tissue (9, 10), evaluating their conductivity to an alternating electrical current, and has two components: resistance and reactance. The first determines the hydration status of the tissue (11–14) and the second represents the energy reserve of the cell membrane (which indirectly reflects the number of cells) (15). The angle formed by the vector sum of reactance and resistance is called the phase angle (PhA) (11–14), a composite marker influenced by hydration and integrity of the body cell membrane (16) that can be used as an index of nutritional assessment (15).
In patients with end-stage chronic kidney disease (CKD), coronary artery disease (CAD) is a major cause of morbidity and mortality. These patients are usually asymptomatic until the event of acute myocardial infarction (AMI) or sudden cardiac death (17). The evaluation of coronary calcification through coronary artery calcium (CAC) score, measured by computed tomography with multiple detectors, is a marker for atherosclerotic plaque burden and has shown to predict the incidence of AMI and death from cardiovascular disease (18).
In 2017, a study showed that PhA was a predictor of vascular calcification and arterial stiffness in patients on peritoneal dialysis (PD) (16). In 2021, a Chinese study that evaluated patients on hemodialysis found a relationship between PhA and coronary calcification (15). This relationship is not yet well-established, but it seems to involve the malnutrition-inflammation-atherosclerosis syndrome (13, 14, 19).
In this study, our objective was to evaluate the relationship between PhA and coronary calcification in patients with PD.
Materials and methods
This cross-sectional study was approved by our Institutional Ethics and Research Committee (CAAE 80051517.1.0000.5411) and involved patients with CKD on PD of the Clinical Hospital of the Botucatu Medical School-UNESP, between March 2018 and August 2019.
Prevalent PD patients aged between 18 and 75 years, without previous coronary artery disease (CAD) or other overt atherosclerotic disease were included. Individuals with active or recent infections (< 7 days), autoimmune diseases, malignancy, or unstable heart disease (acute coronary syndrome, decompensated heart failure, and unstable arrhythmias) were not included in this study.
The registration of demographic and clinical data and the following complementary tests were performed with a maximum interval of 2 weeks: biochemical tests, nutritional assessment by bioimpedance (BIA), and anthropometry, calculation of dialysis adequacy (Kt/V), blood pressure measurement in upper extremities, ultrasound of carotid arteries, pulse wave velocity (PWV), ankle-brachial index (ABI), and CAC score.
Nutritional assessment
Nutritional status was assessed by uni-and multifrequency bioimpedance (BIA). Unifrequency BIA was performed with a Biodynamic device (model 450) and multifrequency BIA with Fresenius Medical Care device–Body Composition Monitor (BCM) model.
In the unifrequency BIA, the values of PhA, total body water (TBW), intra and extracellular water, fat, and lean mass were considered. These values were determined by the device, and the formulas used to calculate total body water and intracellular water are based on those proposed by Kushner and Schoeller (20) and Cohn et al. (21). In the evaluation of the body composition monitor (BCM), the values of the hyperhydration index (overhydration-OH) were considered. This device measures the electrical response of 50 different types of frequencies from 5 to 1,000 kHz. An OH index > 1.1L were considered volume overload, according to Wizemann et al. (22).
The patient was instructed not to perform physical exercises within 24 h of the examination; to urinate, when with residual renal function, at least 30 min before the exam; not to drink alcohol in the 48 h before the test; and, during the examination, remain in the supine position. BIA measurements were performed with no dialysate in the peritoneal cavity, and with the patient in the supine position on a non-conductive surface.
Coronary artery calcium score
The CAC score calculation was performed after a cardiovascular tomography scan (Multi slice, 64 channels, Optima, GE Medical Systems, Waukesha, WI, United States). Calcification consisted of a hyperattenuating lesion above the threshold of 130 Hounsfield units (HU) in an area of two or more adjacent pixels, observed in the coronary pathway. The product of the total area of calcium by a factor derived from the maximum attenuation (Maximal Computer Tomographic Number) is the calcium score published by Agatston et al. (23) and whose unit bears his name. The reported sensitivity and specificity in detecting this score are 98.7 and 100%, respectively (24). The images, including their quality and accuracy, were analyzed by a single examiner specializing in cardiovascular tomography, being “blinded” to the patient’s clinical, laboratory, and other complementary exam information. CAC score was considered positive when greater than or equal to 100 Agatston and negative when less than 100 Agatston.
Statistical analysis
The sample size was calculated in 40 patients to detect a difference in the proportion of 30% between the groups, divided according to the median of the PhA, considering an error α of 5% and β of 20%.
Statistical analysis was performed using the SPSS version 23.0 (SPSS Inc., Chicago, IL, United States). Data were expressed as frequencies, mean ± SD or median and interquartile range, when appropriate. Statistical comparisons between the study groups (PhA ≤ 5.5° and > 5.5°) were performed using Student’s t-test for continuous variables and the chi-square test for categorical variables. Through a multivariate logistic regression model, associations were made between the study variables. The positive and negative predictive values, sensitivity, specificity, and accuracy, between the PhA and the CAC score were analyzed through the ROC curve (Receiver Operating Characteristic) and the calculated area under the ROC curve (AUC). The significance level adopted was p < 0.05.
Results
A total of 76 patients were on PD at the inclusion period, and 59 were eligible. Of these, 11 refused to participate. Therefore, 48 patients were included; however, four withdrew their consent in the middle of the study. Thus, 44 patients were analyzed (Figure 1).
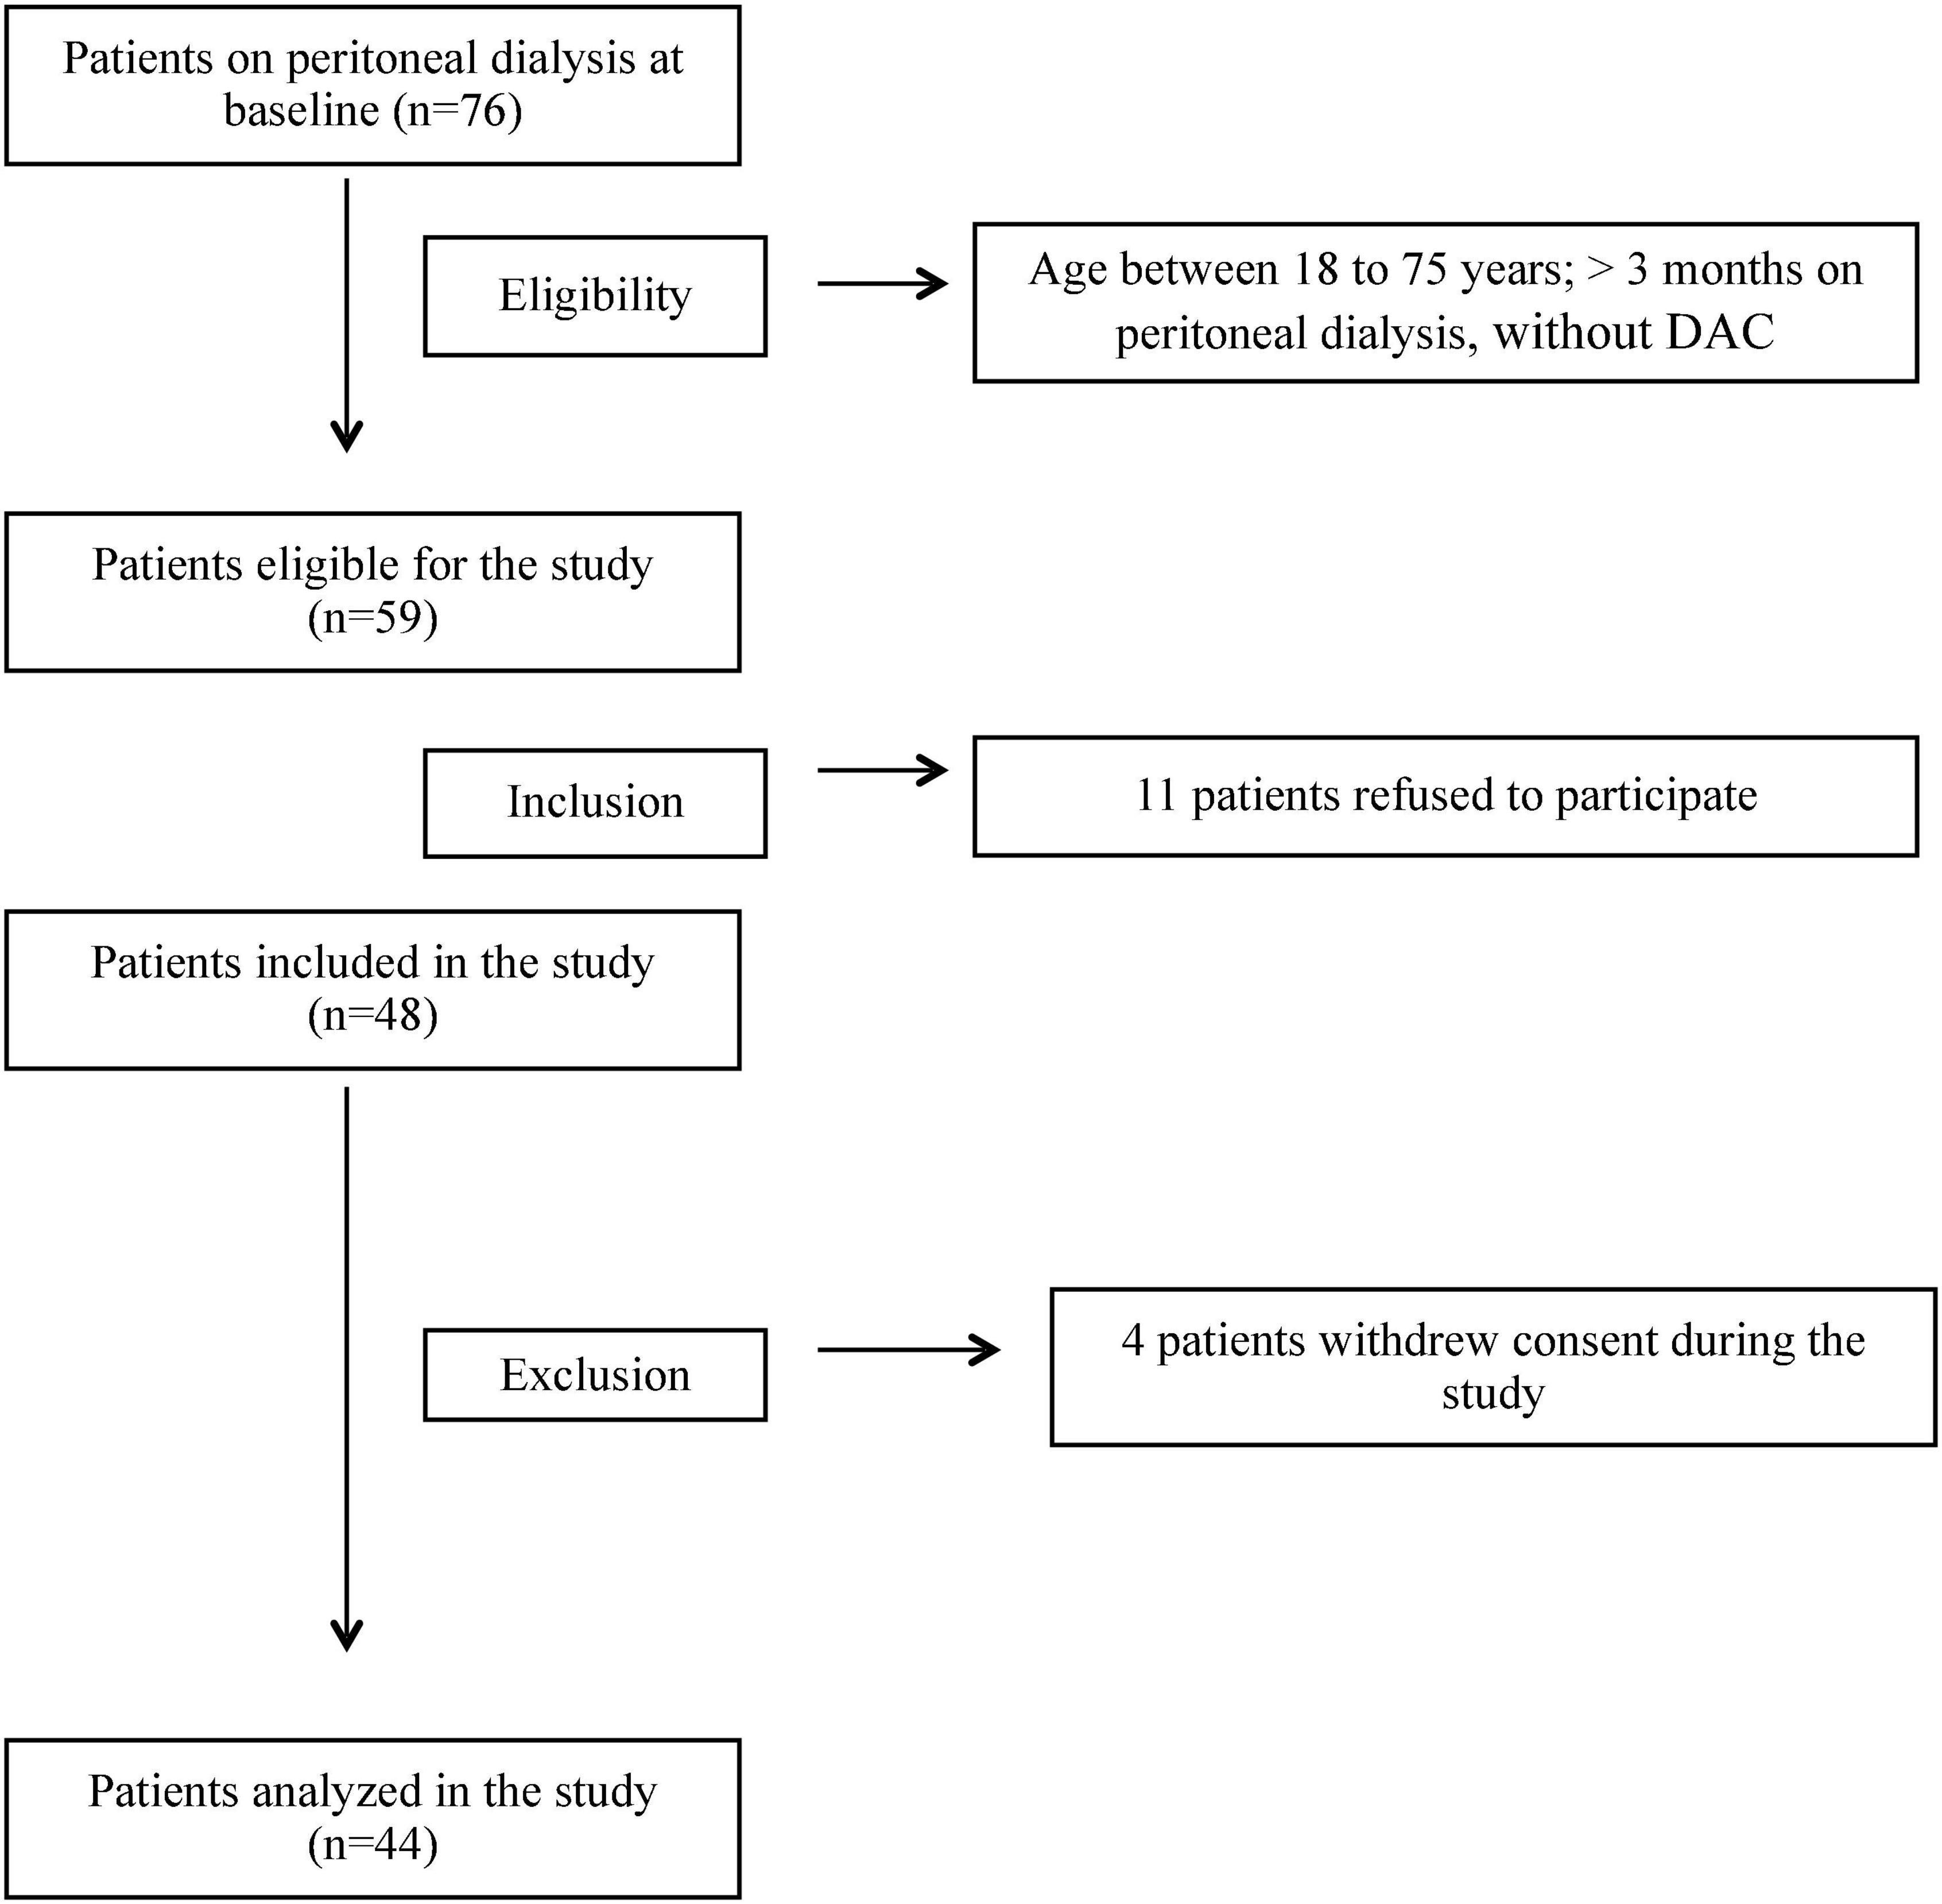
Figure 1. Flowchart of inclusion of patients in the study.
The median age of patients was 56 years, most of them male, white, and with less than 9 years of schooling. Most patients were hypertensive and dyslipidemic. Patients with lower PhA (≤5.5°) were older (59, 56–68 years vs. 53, 38–62 years), had more diabetes (60 vs. 31%), and lower BMI (26.3 ± 3.3 kg/m2 vs. 28.7 ± 5.4 kg/m2), smoked more (13.3 vs. 6.9%) and were more sedentary (80 vs. 65.5%) when compared to the group with the highest PhA. However, none of these factors showed a statistically significant difference between the groups (Table 1).
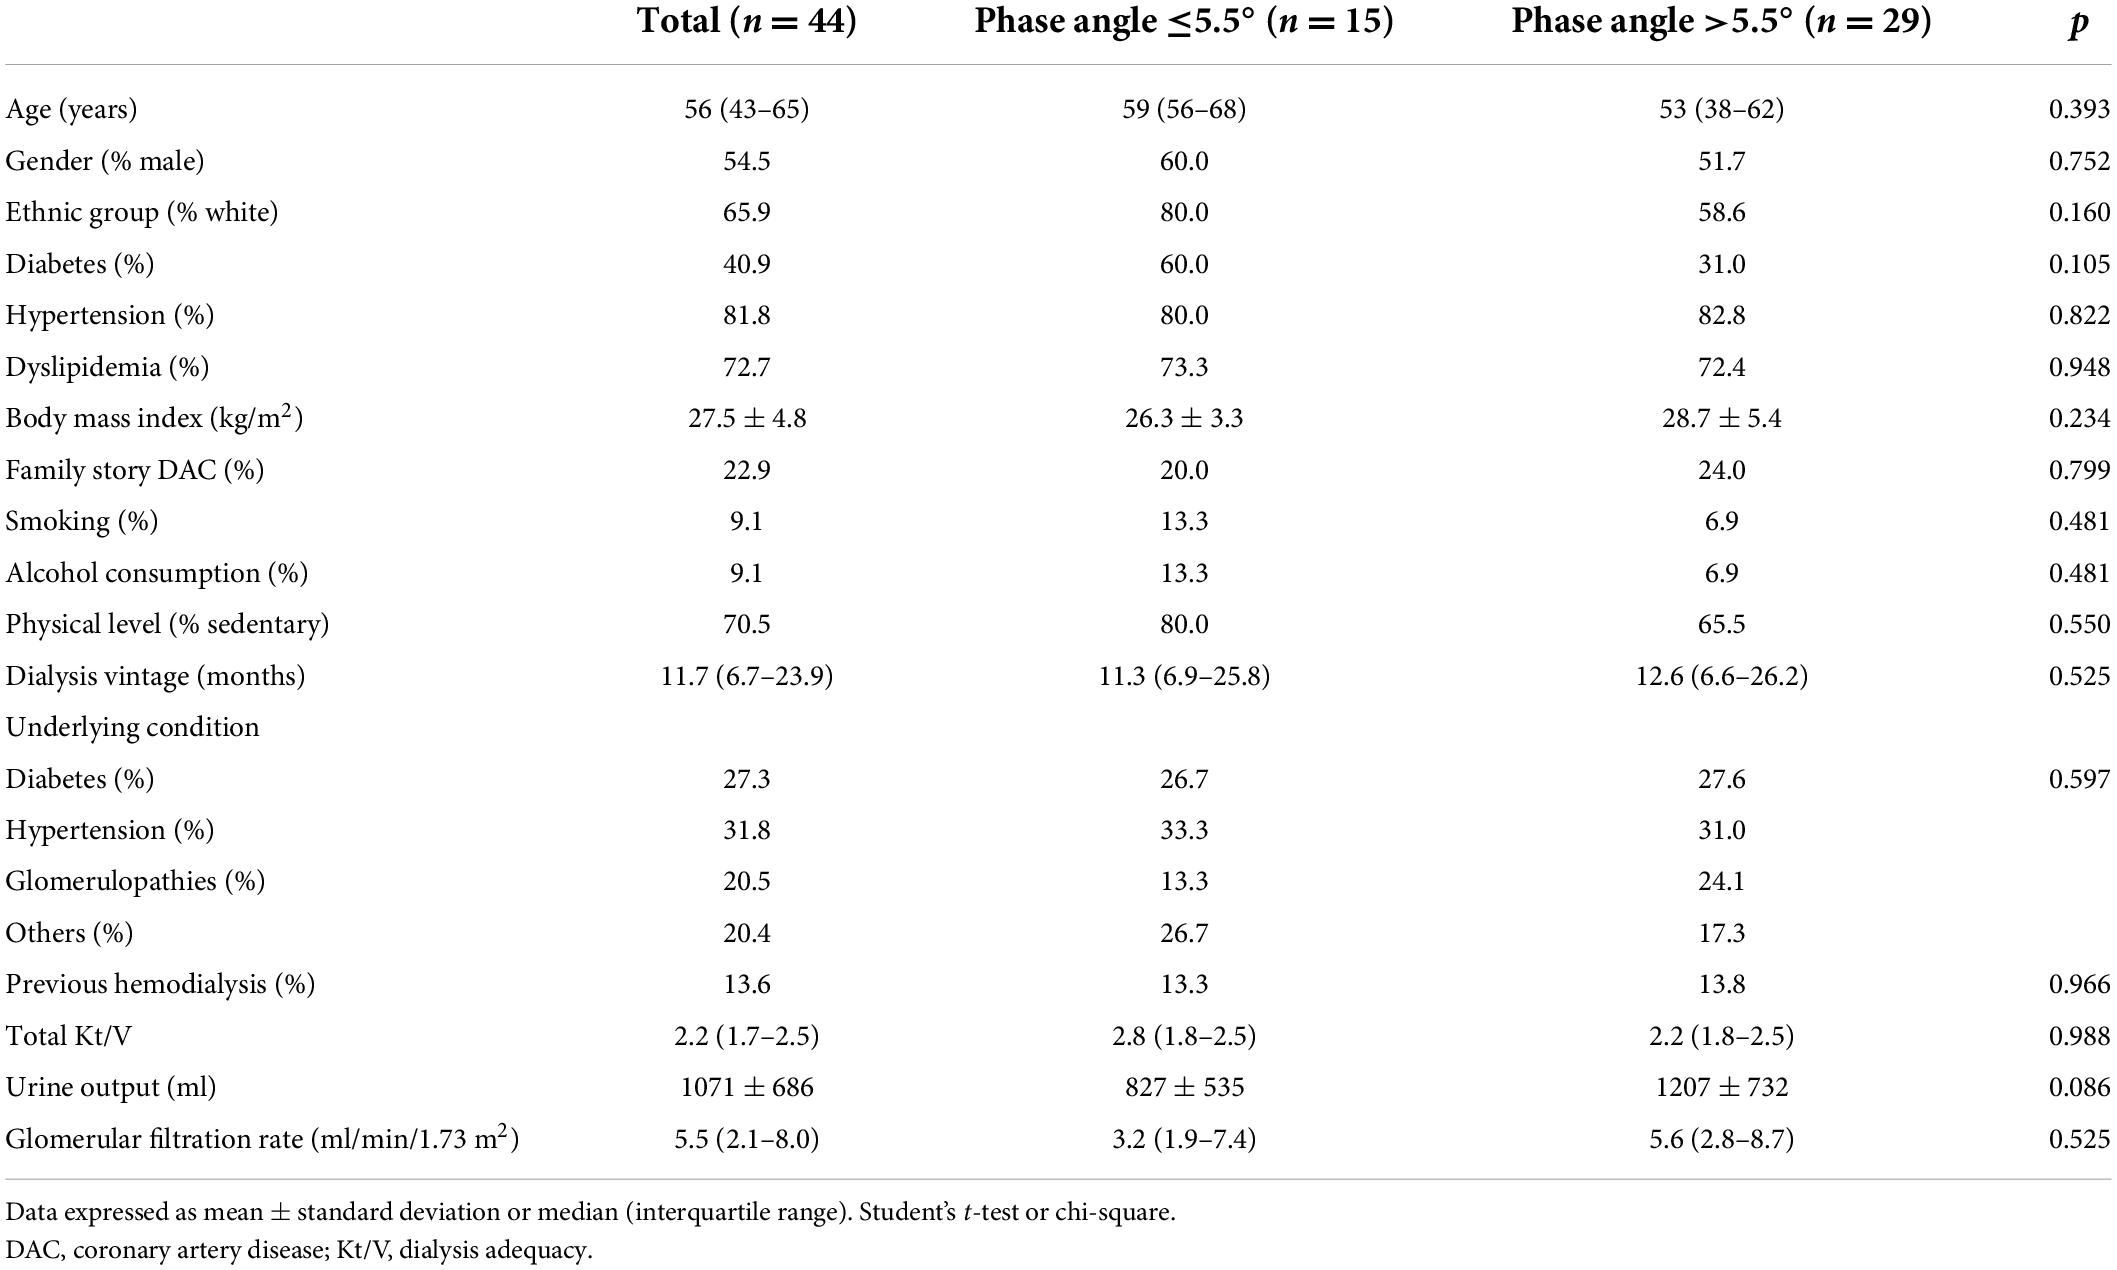
Table 1. General characteristics of peritoneal dialysis (PD) patients.
Almost a third (31.8%) of patients had hypertension as the underlying disease for CKD, followed by diabetes (27.3%). The median dialysis vintage was 11.7 (6.7–23.9) months. The groups PhA ≤ 5.5° and > 5.5° were similar in terms of these variables, except for the urinary output that was higher in the group with PhA > 5.5 (1,207 vs. 827 ml), almost reaching statistical significance (Table 1).
In the evaluation of unifrequency BIA and OH parameters, patients with PhA ≤ 5.5° presented higher percentages of extracellular water and OH index and a lower percentage of intracellular water. The percentages of lean mass, fat mass, and total body water were similar between the groups (Table 2).
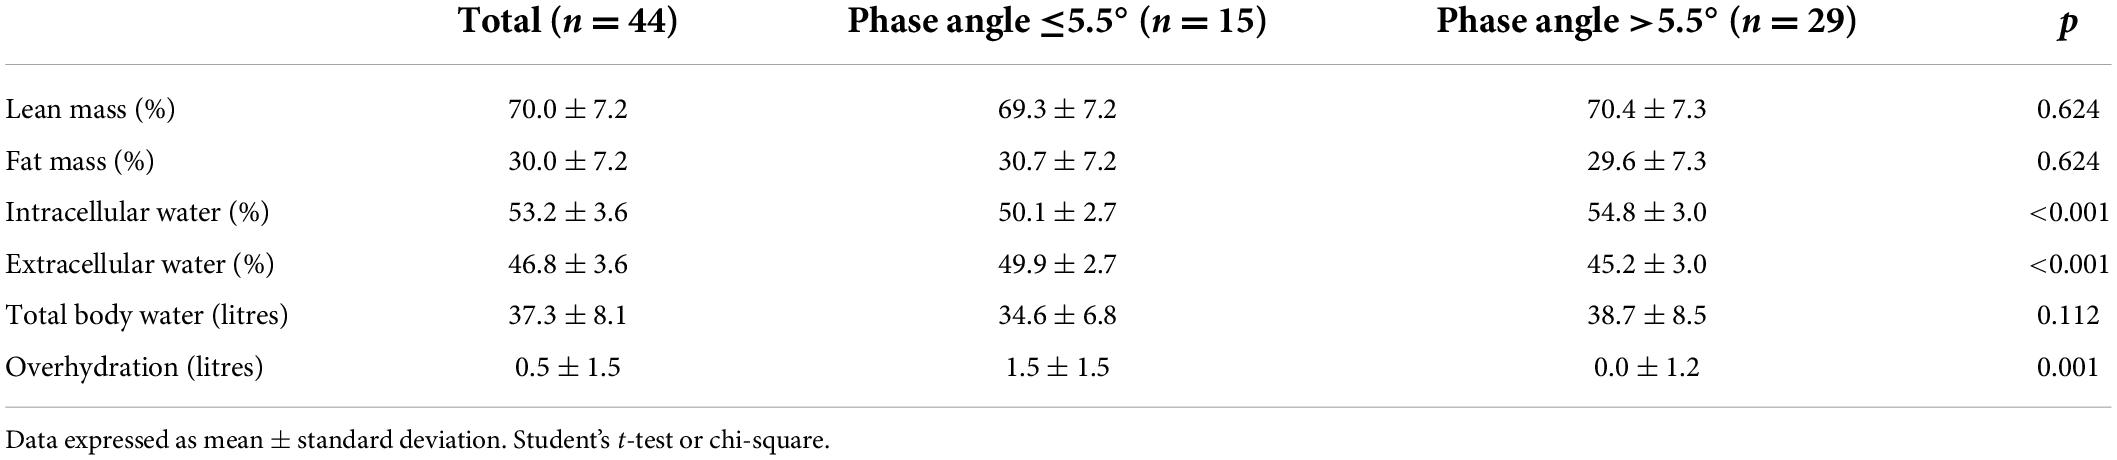
Table 2. Bioimpedance parameters of peritoneal dialysis (PD) patients.
When analyzing the laboratory tests, the groups PhA ≤ 5.5° and > 5.5° were similar (Table 3). As for the atherosclerosis markers, only the percentage of positive CAC score (73.3 vs. 20.7%) showed a significant difference between the PhA ≤ 5.5° and > 5.5° groups (Table 4).
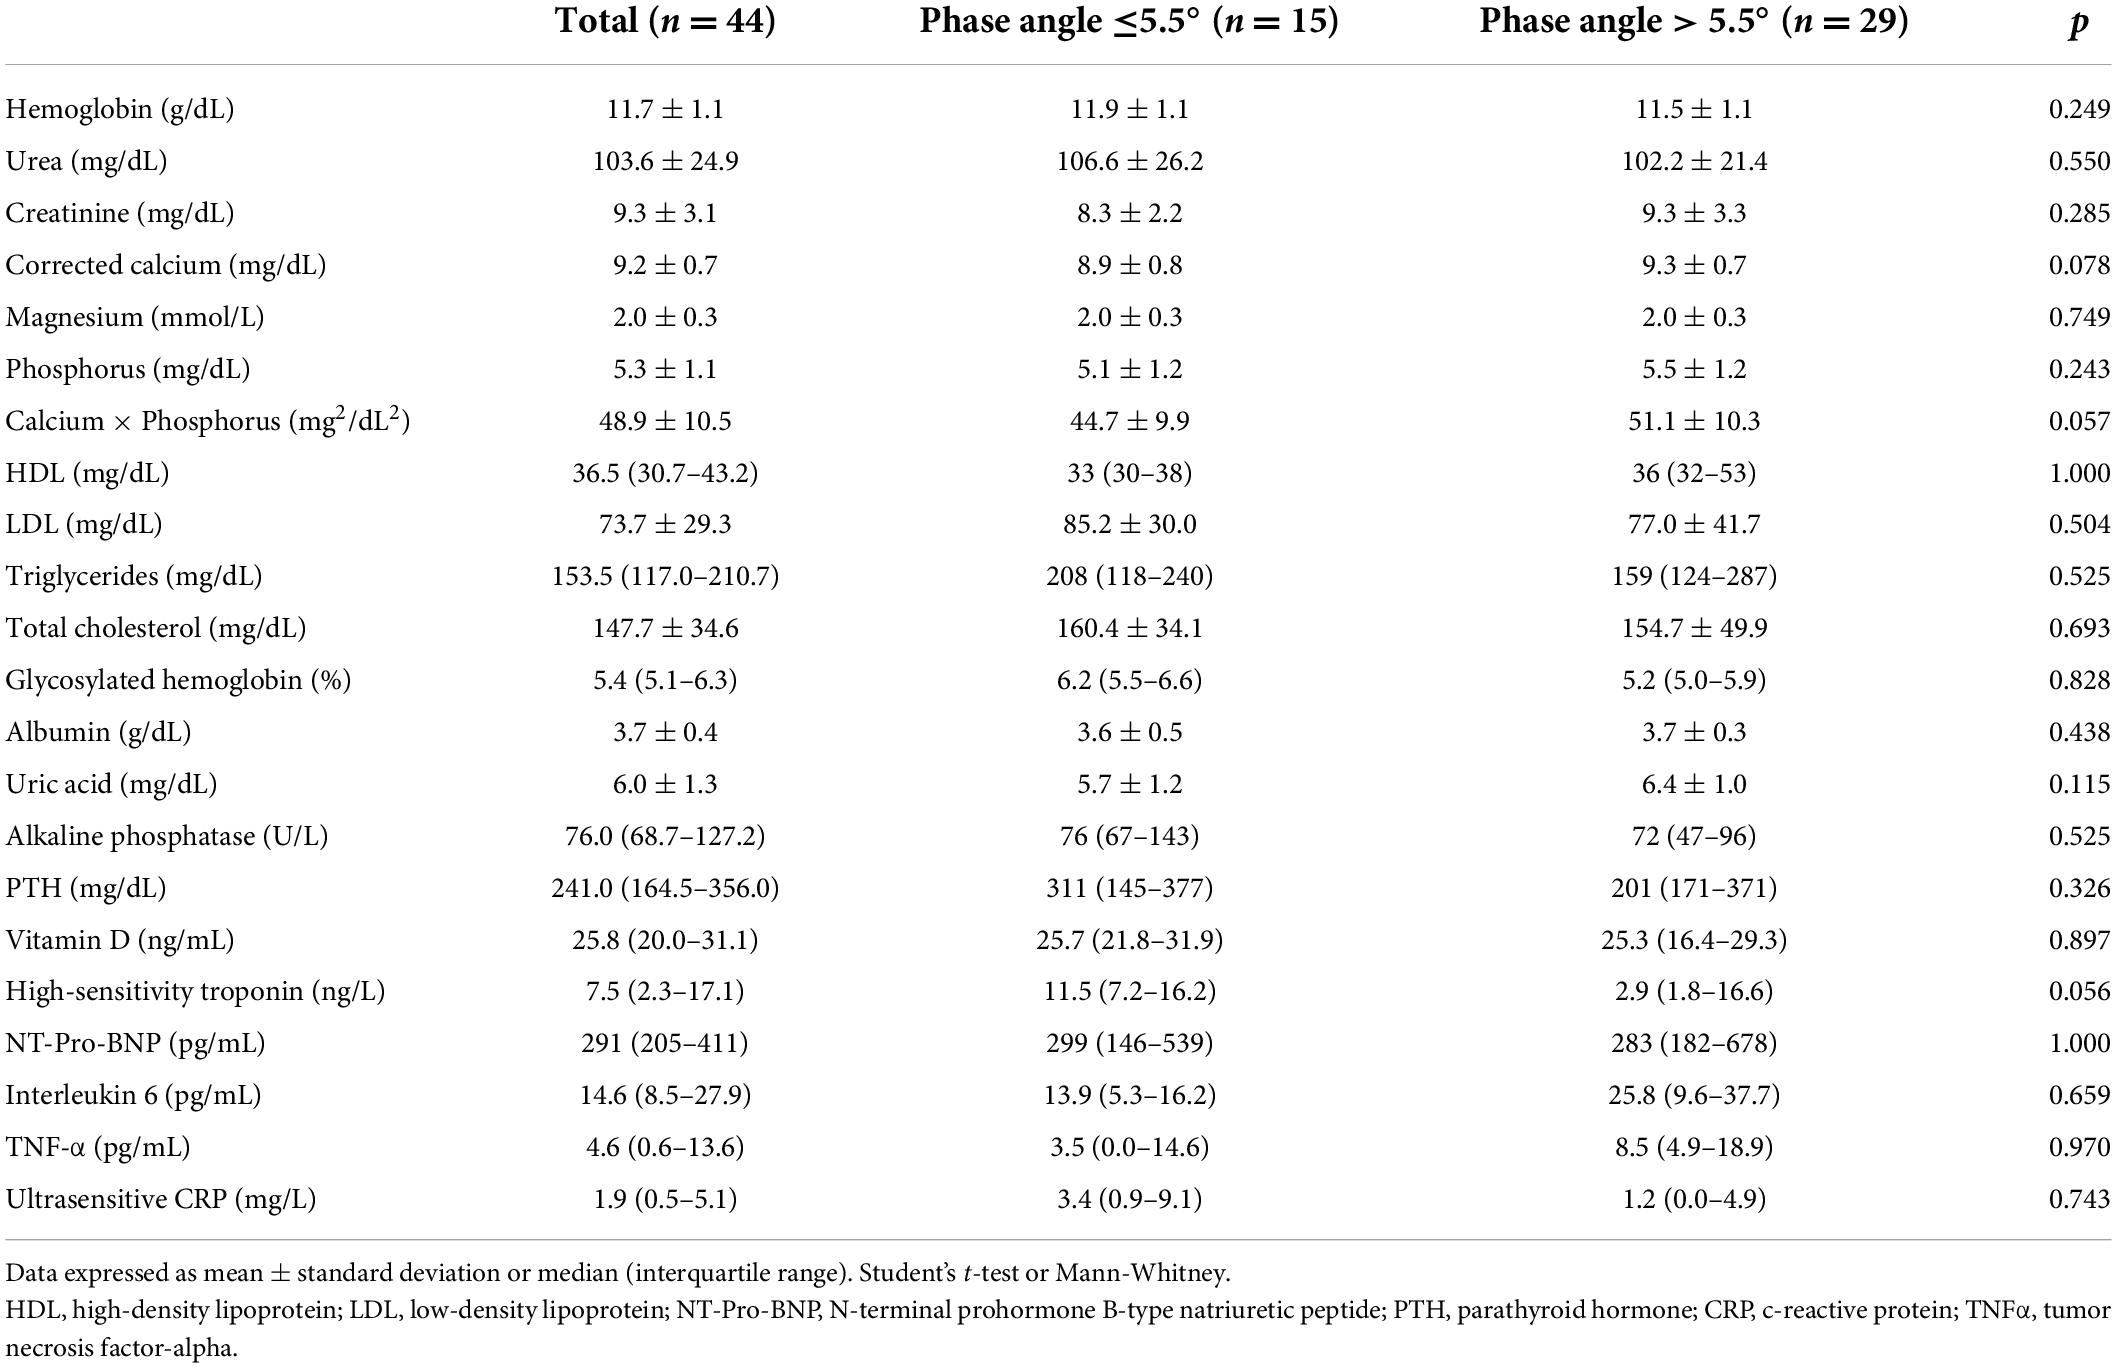
Table 3. Laboratory tests of peritoneal dialysis (PD) patients.
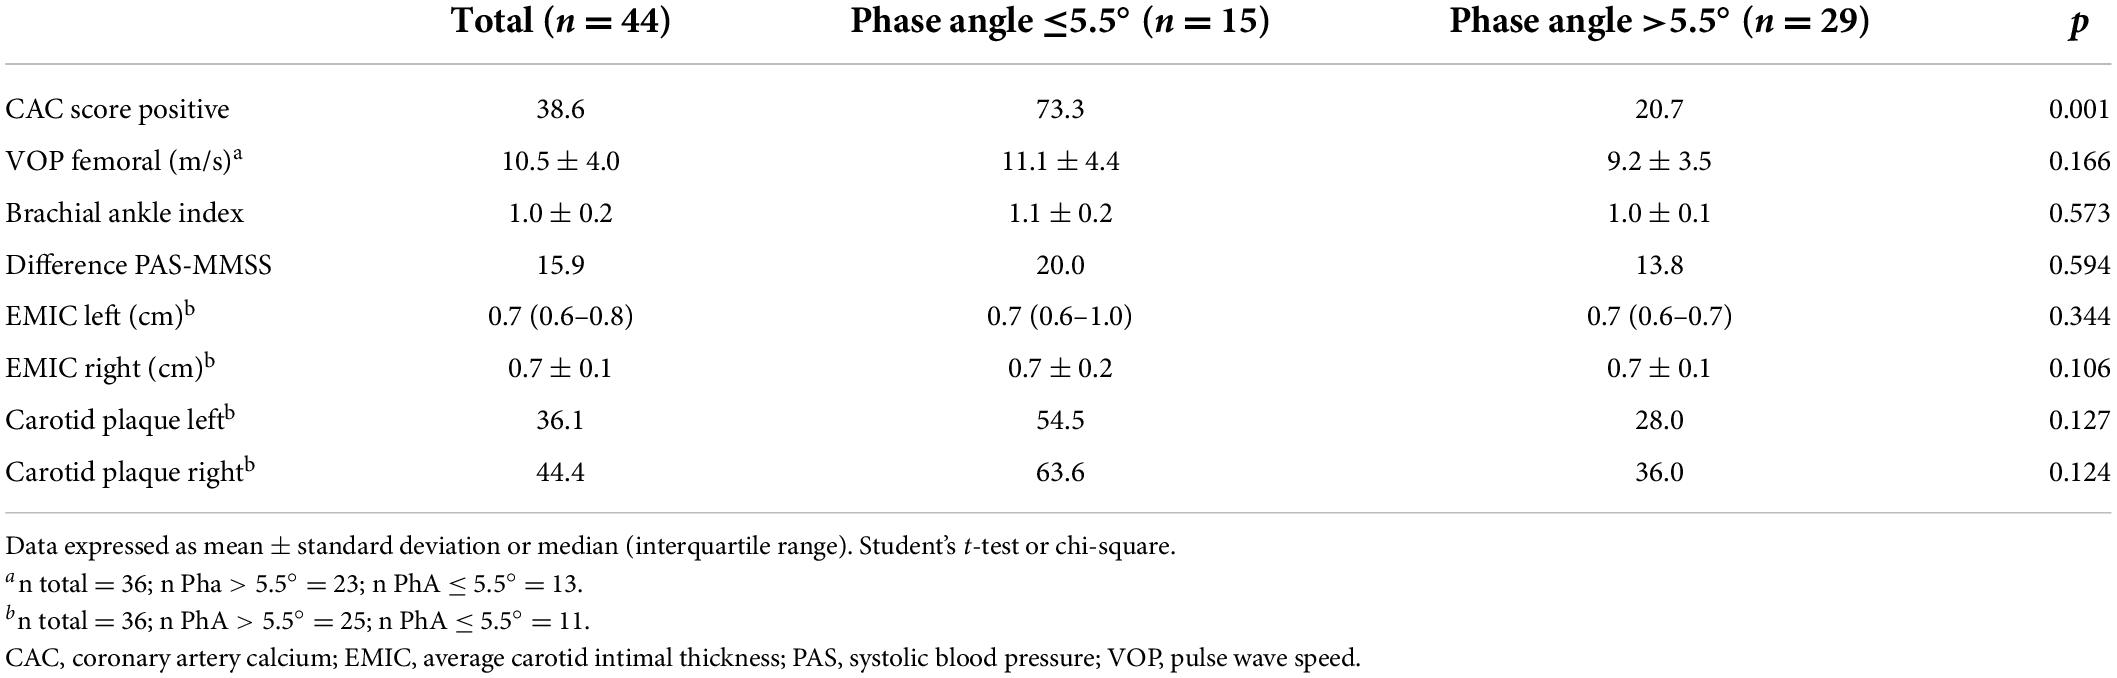
Table 4. Atherosclerosis markers of peritoneal dialysis (PD) patients.
As some variables are known to be associated with PhA, such as age, sex, diabetes, glomerular filtration rate, BMI, hemoglobin, physical activity, calcium x phosphorus, PTH, and ultrasensitive CRP a hierarchical multiple logistic regression was performed to predict positive CAC score. In this evaluation, only PhA remained an independent predictor for positive CAC scores (Table 5).
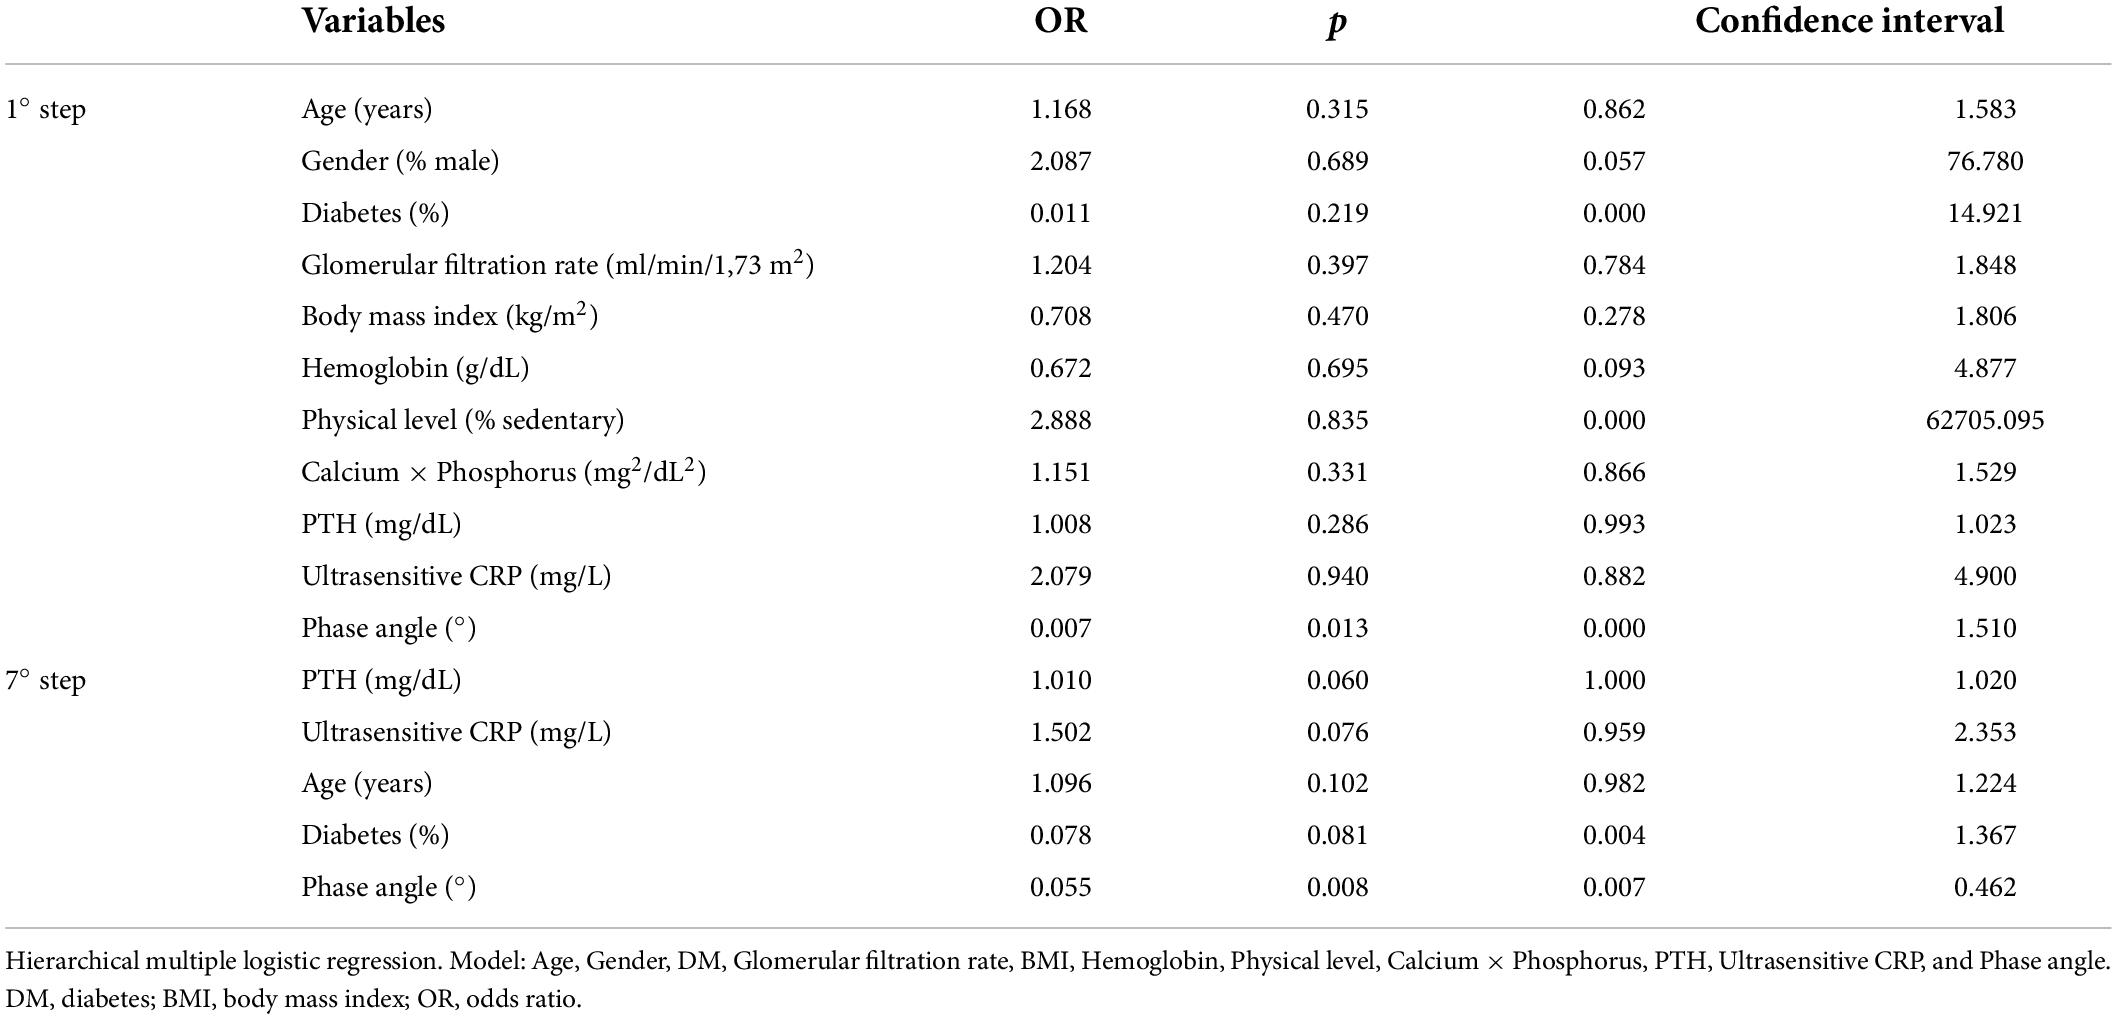
Table 5. Hierarchical multiple logistic regression with some variables related to the phase angle to predict positive ECAC.
In the analysis of the ROC curve for the diagnosis of a positive CAC score from the PhA, the area under the curve was.81 (CI: 0.68–0.94; p < 0.01). The best cut-off point was with PhA ≤ 5.5°, which showed a sensitivity of 64.7% and a specificity of 85.2%. Also, when the PhA was ≤ 7.2°, the sensitivity was 100% (Figure 2).
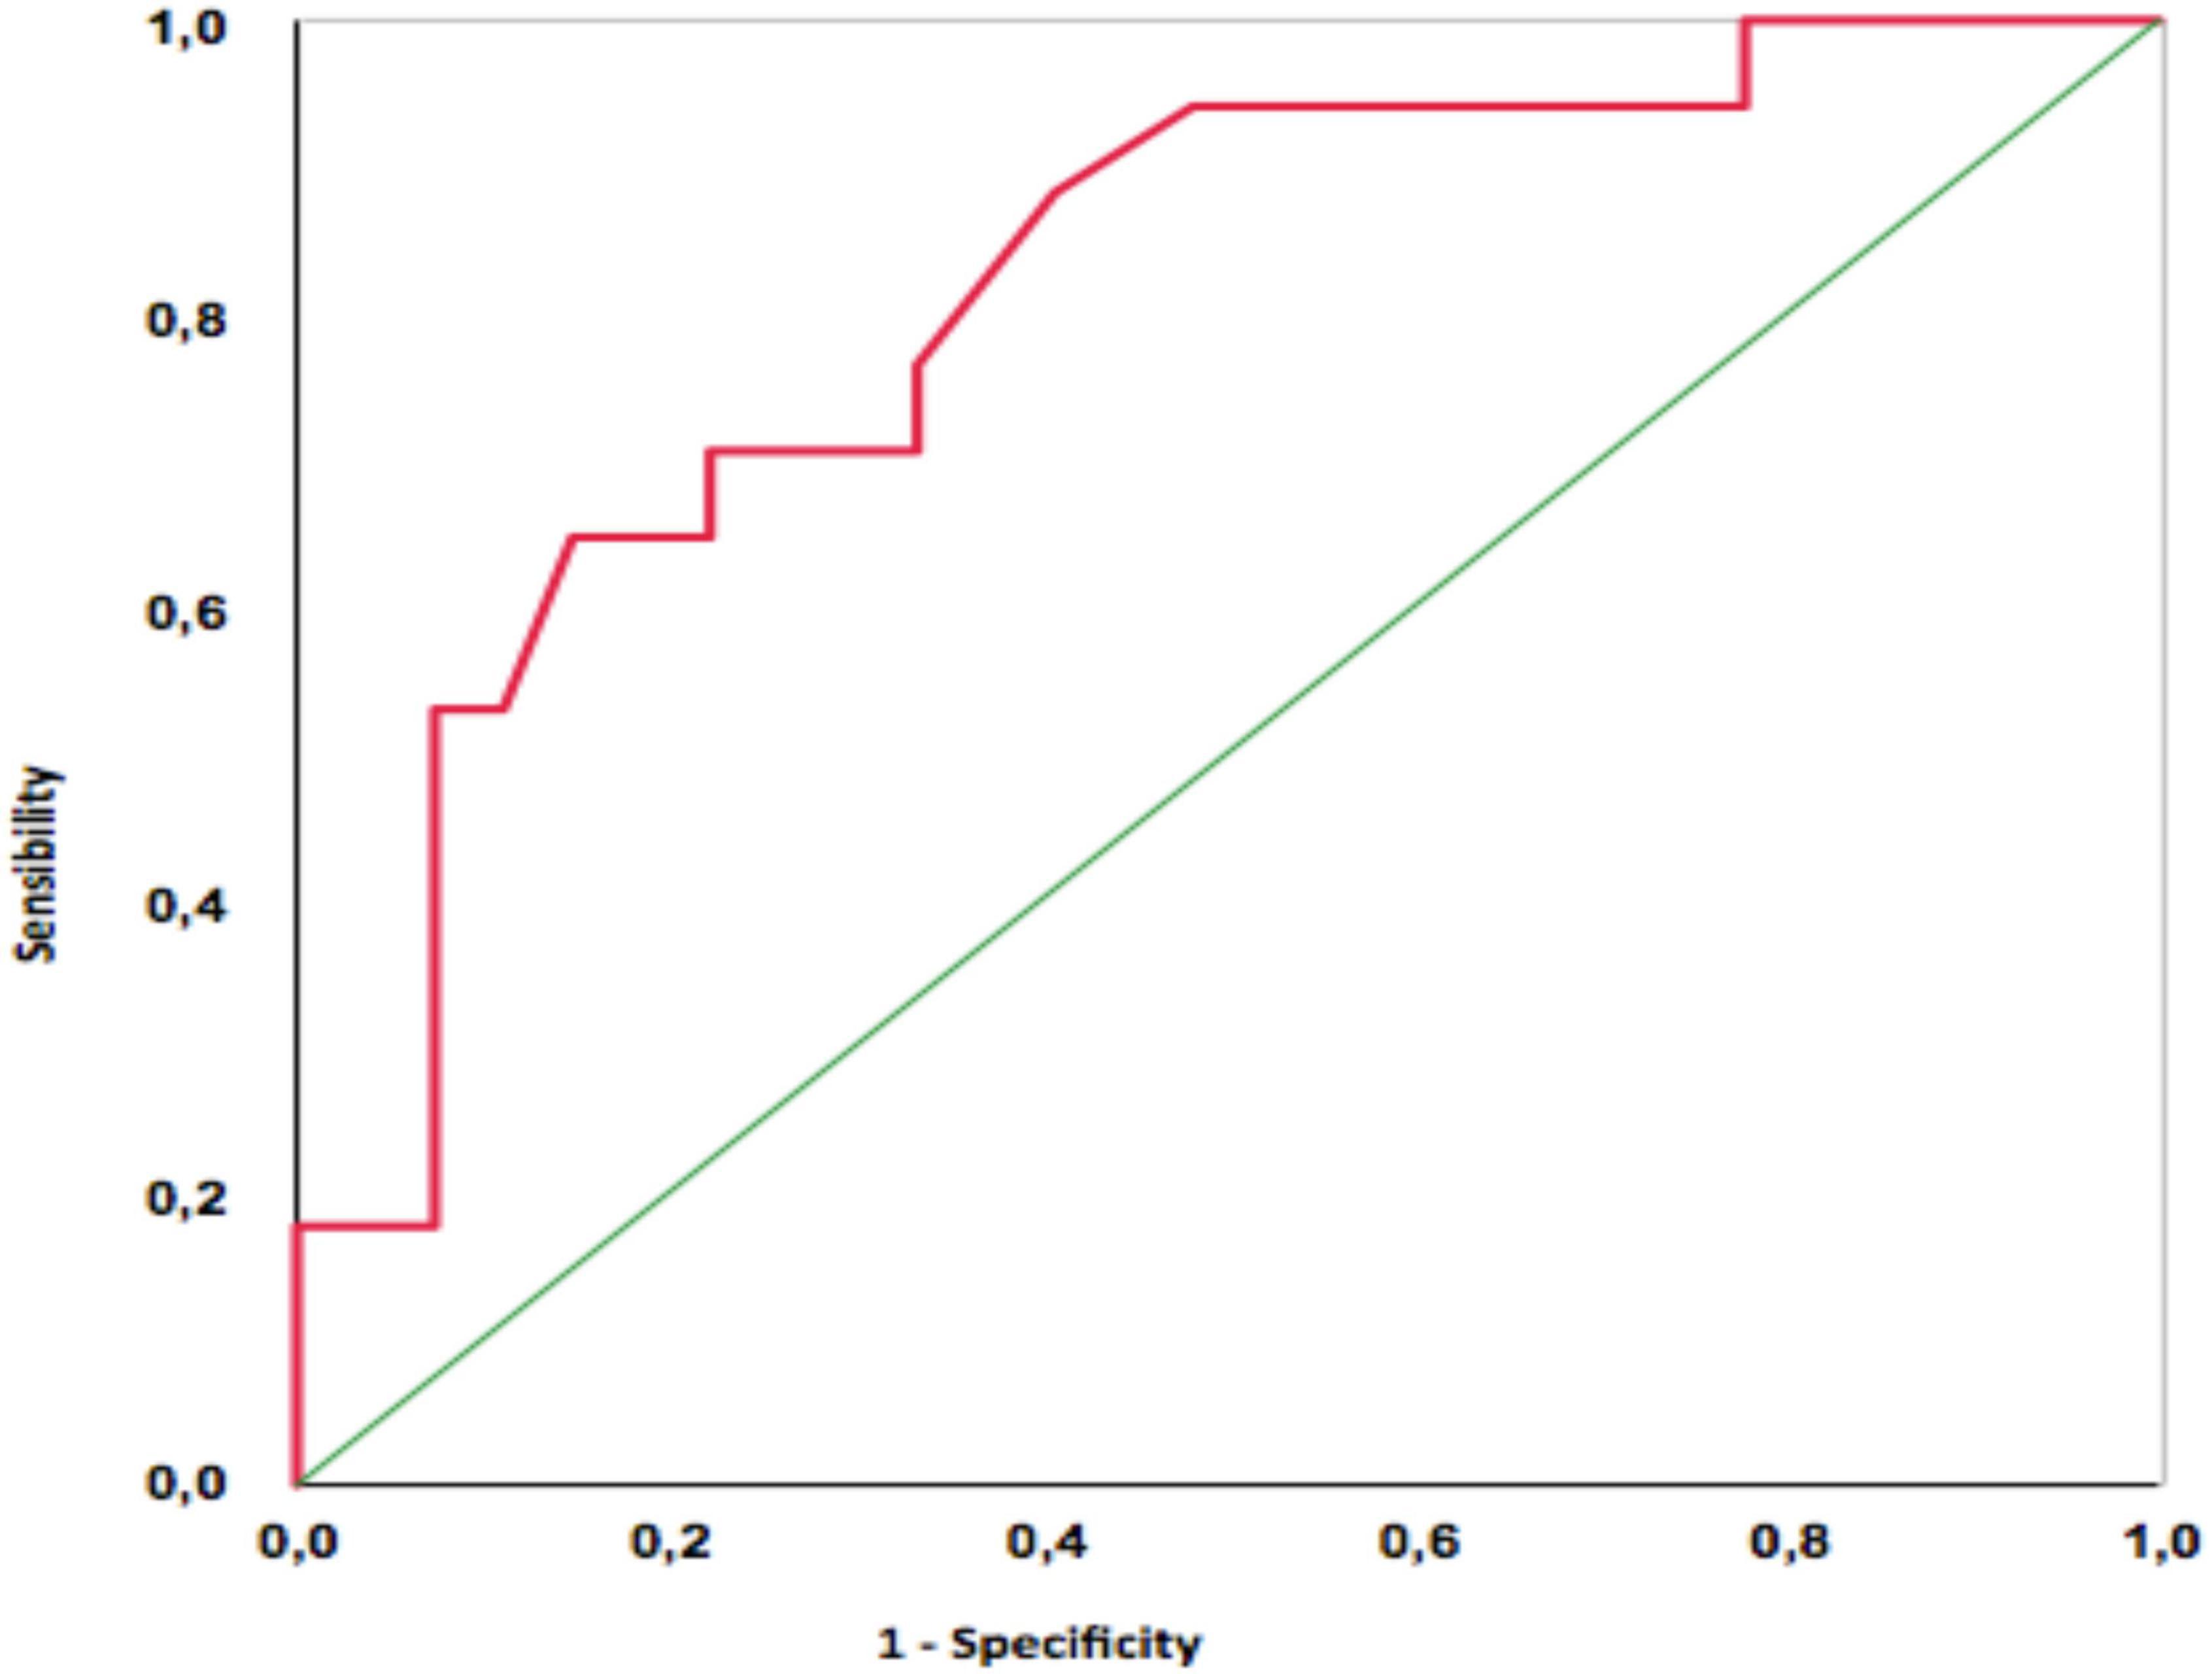
Figure 2. ROC curve for diagnosis of positive CAC score from the phase angle information.
Discussion
This study showed that there is an inverse correlation between the PhA and CAC score in patients on PD, even after adjusting for several variables such as age, sex, diabetes, glomerular filtration rate, BMI, hemoglobin, physical activity, calcium x phosphorus, PTH, and ultrasensitive CRP.
The best cut-off point was with a PhA ≤ 5.5°, which had a sensitivity of 64.7% and a specificity of 85.2% to predict a positive CAC score. Also, when the PhA was ≤ 7.2°, the sensitivity was 100%.
A recent study (15) found the same result in hemodialysis patients. Sarmento-Dias et al. (16) studying patients with PD showed that the PhA predicts arterial stiffness and vascular calcification. However, we did not find any study in the literature relating the phase angle with coronary calcification in PD patients.
One of the hypotheses for the relationship between PhA and CAC score is that the first reflects the nutritional status (25) and malnutrition plays an important role in the development of cardiovascular diseases, due to the malnutrition-inflammation-atherosclerosis syndrome (26). Saitoh et al. (27) showed a correlation positive between the PhA with the percentage of lean mass and BMI, and negative with protein-energy malnutrition. Leal-Alegre et al. (28) found 29% of PEW in patients with vascular calcification undergoing PD. In 2021 (15), a study showed that the nutritional status of hemodialysis patients with vascular calcification was worse than those without calcification. In our study, there was no relationship between inflammatory markers (CRP, interleukins, and TNF-alpha) and PhA. However, some authors report that malnutrition may be a risk factor for cardiovascular mortality, independent of inflammation (29), and may have other still unknown mechanisms involved.
Another hypothesis is that the PhA is influenced by the hydration state (16), and the smaller the PhA, the higher the level of extracellular fluid. Excess extracellular fluid (ECF) results in pathological mechanical stimuli in vascular endothelium and smooth muscle cells. Such stimuli release angiotensin II, increase superoxide production, and reduce nitric oxide bioavailability, leading to atherosclerosis, and vascular calcification (30). In this study, higher levels of ECF and OH index showed a direct relationship with lower PhA and positive CAC scores.
The strengths of this study are the multivariate and hierarchical regression analysis for variables that could influence the CAC score in the population studied, and a large number of variables analyzed, enabling a better understanding of the relationship studied. Limitations include the cross-sectional study design, which does not allow establishing a causal relationship between the PhA and CAC score variables. Also, the small sample size, even though just peritoneal dialysis patients without overt atherosclerotic disease were included, and the fact that it was performed in a single center.
Data availability statement
The raw data supporting the conclusions of this article will be made available by the authors, without undue reservation.
Ethics statement
The studies involving human participants were reviewed and approved by the research Ethics Committee of Botucatu Medical School. The patients/participants provided their written informed consent to participate in this study.
Author contributions
FR was responsible for the research idea and study design. FR, FC, and MS performed data acquisition. FR, MS, NR, LM, FC, and CS performed data analysis and interpretation, involved in statistical analysis, and drafted the manuscript. PB, LM, and SB were responsible for supervision and mentorship. All authors provided intellectual content to the work and gave final approval of the version to be published.
Acknowledgments
We thank the patients and health care staff from the Dialysis Unit of the Clinics Hospital of Botucatu Medical School.
Conflict of interest
The authors declare that the research was conducted in the absence of any commercial or financial relationships that could be construed as a potential conflict of interest.
Publisher’s note
All claims expressed in this article are solely those of the authors and do not necessarily represent those of their affiliated organizations, or those of the publisher, the editors and the reviewers. Any product that may be evaluated in this article, or claim that may be made by its manufacturer, is not guaranteed or endorsed by the publisher.
References
1. Koppe L, Fouque D, Kalantar-Zadeh K. Kidney cachexia or protein-energy wasting in chronic kidney disease: facts and numbers. J Cachexia Sarcopenia Muscle. (2019) 10:479–84. doi: 10.1002/jcsm.12421
2. Qureshi AR, Alvestrand A, Divino-Filho JC, Gutierrez A, Heimbürger O, Lindholm B, et al. Inflammation, mal- nutrition, and cardiac disease as predictors of mortality in hemodialysis patients. J Am Soc Nephrol. (2002) 13:28–36. doi: 10.1681/ASN.V13suppl_1s28
3. Konings CJ, Kooman JP, Schonck M, Dammers R, Cheriex E. Fluid status, blood pres- sure and cardiovascular abnormalities in patients on peritoneal dialy- sis. Perit Dial Int. (2002) 22:477–87. doi: 10.1177/089686080202200406
4. Garg AX, Blake PG, Clark WF, Clase CM, Haynes RB, Moist LM. Association between renal insufficiency and malnutrition in older adults: results from the NHANES III. Kidney Int. (2001) 60:1867–74. doi: 10.1046/j.1523-1755.2001.00001.x
5. Plum J, Schoenicke G, Kleophas W, Kulas W, Steffens F, Azem A, et al. Comparison of body fluid distribution between chronic haemodialysis and peritoneal dia- lysis patients as assessed by biophysical and biochemical methods. Nephrol Dial Transplant. (2001) 16:2378–85. doi: 10.1093/ndt/16.12.2378
6. Asghar RB, Green S, Engel B, Davies SJ. Relationship of demographic, dietary, and clinical factors to the hydration status of patients on peri- toneal dialysis. Perit Dial Int. (2004) 24:231–9. doi: 10.1177/089686080402400305
7. Avila-Díaz M, Ventura MD, Valle D, Vicenté-Martínez M, García-González Z, Cisneros A, et al. Inflammation and extracellular volume expansion are related to sodium and water removal in patients on peritoneal dialysis. Perit Dial Int. (2006) 26:574–80. doi: 10.1177/089686080602600510
8. Mendall MA, Patel P, Ballam L, Strachan D, Northfield TC. C-reactive protein and its relation to cardiovascular risk factors: a population based cross sectional study. BMJ. (1996) 312:1061–5. doi: 10.1136/bmj.312.7038.1061
9. Kyle UG, Bosaeus I, de Lorenzo AD, Deurenberg P, Elia M, Gómez JM, et al. Bioelectrical impedance analysis–part I: review of principles and methods. Clin Nutr. (2004) 23:1226–43. doi: 10.1016/j.clnu.2004.06.004
10. Kyle UG, Bosaeus I, de Lorenzo AD, Deurenberg P, Elia M, Manuel Gómez J, et al. Bioelectrical impedance analysis-part II: utilization in clinical practice. Clin Nutr. (2004) 23:1430–53. doi: 10.1016/j.clnu.2004.09.012
11. Kalantar-Zadeh K, Ikizler TA, Block G, Avram MM, Kopple JD. Malnutrition-inflammation complex syndrome in dialysis patients: causes and consequences. Am J Kidney Dis. (2003) 42:864–81. doi: 10.1016/j.ajkd.2003.07.016
12. Stenvinkel P, Heimbürger O, Paultre F, Diczfalusy U, Wang T, Berglund L, et al. Strong association between malnutrition, inflammation, and atherosclerosis in chronic renal failure. Kidney Int. (1999) 55:1899–911. doi: 10.1046/j.1523-1755.1999.00422.x
13. Vicenté-Martínez M, Martínez-Ramírez L, Muñoz R, Avila M, Ventura MD, Rodríguez E, et al. Inflammation in patients on peritoneal dialysis is associated with increased extracellular fluid volume. Arch Med Res. (2004) 35:220–4. doi: 10.1016/j.arcmed.2004.01.003
14. Woodrow G, Oldroyd B, Wright A, Coward A, Turney JH, Brownjohn AM, et al. Abnormalities of body composition in peritoneal dialysis patients. Perit Dial Int. (2004) 24:169–75. doi: 10.1177/089686080402400208
15. Huang Y, Zhang Z, Quan Y, Zhang C, Zhang Z, Xu N, et al. Elucidating the relationship between nutrition indices and coronary artery calcification in patients undergoing maintenance hemodialysis. Ther Apher Dial. (2022) 26:71–84. doi: 10.1111/1744-9987.13693
16. Sarmento-Dias M, Santos-Araújo C, Poínhos R, Sousa M, Simões-Silva L, Soares-Silva I, et al. Phase angle predicts arterial stiffness and vascular calcification in peritoneal dialysis patients. Perit Dial Int. (2017) 37:451–7. doi: 10.3747/pdi.2015.00276
17. Kim JK, Kim SG, Kim HJ, Song YR. Cardiac risk assessment by gated single-photon emission computed tomography in asymptomatic end-stage renal disease patients at the start of dialysis. J Nucl Cardiol. (2012) 19:438–47. doi: 10.1007/s12350-011-9497-2
18. Kurabayashi M. Bone and calcium update; diagnosis and therapy of bone metabolism disease update. Calcification of atherosclerotic plaques: mechanism and clinical significance. Clin Calcium. (2011) 21:43–50.
19. Clerico A, Recchia FA, Passino C, Emdin M. Cardiac endocrine function is an essential component of the homeostatic regulation network: physi- ological and clinical implications. Am J Physiol Heart Circ Physiol. (2006) 290:17–29. doi: 10.1152/ajpheart.00684.2005
20. Kushner RF, Schoeller DA. Estimation of total body water by bioelectrical impedance analysis. Am J Clin Nutr. (1986) 44:417–24.
21. Cohn SH, Brennan BL, Yasumura S, Vartsky D, Vaswani AN, Ellis KJ. Evaluation of body composition and nitrogen content of renal patients on chronic dialysis as determined by total body neutron activation. Am Soc Clin Nutr. (1983) 38:52–8. doi: 10.1093/ajcn/38.1.52
22. Wizemann V, Wabel P, Chamney P, Zaluska W, Moissl U, Rode C, et al. The mortality risk of overhydration in haemodialysis patients. Nephrol Dial Transplant. (2009) 24:1574–9.
23. Agatston AS, Janowitz WR, Hildner FJ, Zusmer NR, Viamonte M Jr, Detrano R. Quantification of coronary artery calcium using ultrafast computed tomography. J Am Coll Cardiol. (1990) 15:827–32.
24. Horiguchi J, Yamamoto H, Akiyama Y, Marukawa K, Hirai N, Ito K. Coronary artery calcium scoring using 16-MDCT and a retrospective ECG-gating reconstruction algorithm. AJR Am J Roentgenol. (2004) 183:103–8. doi: 10.2214/ajr.183.1.1830103
25. Lomashvili KA, Garg P, Narisawa S, Millan JL, O’Neill WC. Upregulation of alkaline phosphatase and pyrophosphatehydrolysis: potential mechanism for uremic vascularcalcification. Kidney Int. (2008) 73:1024–30. doi: 10.1038/ki.2008.26
26. Beberashvili I, Sinuani I, Azar A, Shapiro G, Feldman L, Stav K, et al. Serum uric acid as a clinically useful nutritional marker and predictor of outcome in maintenance hemodialysis patients. Nutrition. (2015) 31:138–47. doi: 10.1016/j.nut.2014.06.012
27. Saitoh M, Ogawa M, Kondo H, Suga K, Takahashi T, Itoh H, et al. Bioelectrical impedance analysis-derived phase angle as a determinant of protein-energy wasting and frailty in maintenance hemodialysis patients: retrospective cohort study. BMC Nephrol. (2020) 21:438. doi: 10.1186/s12882-020-02102-2
28. Leal-Alegre G, Lerma C, Leal-Escobar G, Moguel-González B, Martínez-Vázquez KB, Cano-Escobar KB. Relationship between vascular calcification, protein-energy wasting syndrome, and sarcopenia in maintenance automated peritoneal dialysis. Life. (2021) 11:666. doi: 10.3390/life11070666
29. Kotanko P, Levin NW, Zhu F. Current state of bioimpedance technologies in dialysis. Nephrol Dial Transplant. (2008) 23:808–12. doi: 10.1093/ndt/gfm889
Keywords: bioelectrical impedance, phase angle, coronary artery calcium score, peritoneal dialysis, nutrition
Citation: Reis FM, da Silva MZC, Reis NSC, Costa FL, da Silveira CFSMP, Barretti P, Martin LC and Bazan SGZ (2022) Association between phase angle and coronary artery calcium score in patients on peritoneal dialysis. Front. Nutr. 9:912642. doi: 10.3389/fnut.2022.912642
Received: 04 April 2022; Accepted: 11 July 2022;
Published: 04 August 2022.
Edited by:
Annabel Biruete, Indiana University–Purdue University Indianapolis, United StatesReviewed by:
Chunyan Yi, The First Affiliated Hospital of Sun Yat-sen University, ChinaYi-Cheng Hou, Taipei Tzu Chi Hospital, Taiwan
Copyright © 2022 Reis, da Silva, Reis, Costa, da Silveira, Barretti, Martin and Bazan. This is an open-access article distributed under the terms of the Creative Commons Attribution License (CC BY). The use, distribution or reproduction in other forums is permitted, provided the original author(s) and the copyright owner(s) are credited and that the original publication in this journal is cited, in accordance with accepted academic practice. No use, distribution or reproduction is permitted which does not comply with these terms.
*Correspondence: Fabricio Moreira Reis, ZmFicmljaW8ucmVpc0B1bmVzcC5icg==