 Xiaoqing Li1,2
94% of researchers rate our articles as excellent or good
Learn more about the work of our research integrity team to safeguard the quality of each article we publish.
Find out more
ORIGINAL RESEARCH article
Front. Mol. Biosci. , 26 February 2025
Sec. Molecular Diagnostics and Therapeutics
Volume 12 - 2025 | https://doi.org/10.3389/fmolb.2025.1536477
Background: Numerous studies have reported that dysregulation of fatty acid metabolic pathways is associated with the pathogenesis of vitiligo, in which arachidonic acid metabolism (AAM) plays an important role. However, the molecular mechanisms of AAM in the pathogenesis of vitiligo have not been clarified. Therefore, we aimed to identify the biomarkers and molecular mechanisms associated with AAM in vitiligo using bioinformatics methods.
Methods: The GSE75819 and GSE65127 datasets were used in this study as the training and validation sets, respectively, along with 58 AAM-related genes (AAM-RGs). The differentially expressed genes (DEGs) between the lesional and control groups in the training set were identified through differential expression analysis. A biomarker-based nomogram was constructed to predict the risk of vitiligo.
Results: 15 overlapping candidate genes were obtained between the DEGs and AAM-RGs. Machine-learning algorithms were used to identify six key genes as PTGDS, PNPLA8, FAAH, ABHD12, PTGS1, and MGLL. In both the training and validation sets, PTGDS, PNPLA8, and MGLL. In both the training and validation sets, PTGDS, PNPLA8, and MGLL were regarded as biomarkers. A nomogram based on these biomarkers showed potential for predicting the risk of vitiligo. Functional enrichment, immune cell infiltration, and regulatory network analyses were used to elucidate the molecular mechanisms.
Conclusion: In conclusion, PTGDS, PNPLA8, and MGLL were implicated in AAM to influence the pathogenesis of vitiligo. These findings offer insights into vitiligo treatment, although further research is needed for a comprehensive understanding.
Vitiligo is a localized or generalized depigmentation skin disorder characterized by decreased color, increased whiteness, and distinct boundaries (Lyu and Sun, 2022). The pathogenesis of vitiligo is unclear and may be related to factors such as immune dysfunction, oxidative stress, melanocyte dysfunction, and intestinal flora disturbance (Post et al., 2023). At present, there are very few treatment methods for vitiligo and different degrees of limitations that do not meet the demands of patients (Cunningham and Rosmarin, 2023). Therefore, further exploration of safer, more efficient, and inexpensive treatment strategies is an urgent problem in vitiligo research.
Polyunsaturated fatty acids are essential substances needed for maintaining human health and mainly include the ω-3 and ω-6 types (Duan et al., 2023). Arachidonic acid (AA) is an essential fatty acid in the human body belonging to the ω-6 type of polyunsaturated fatty acids. AA and its metabolites have important biological activities in inflammatory responses, immune regulation, and signal transmission, which are involved in the occurrence and development of various diseases (Zhang et al., 2023). Growing evidence suggests that arachidonic acid metabolism (AAM) is closely associated with autoimmune diseases, such as psoriasis, systemic lupus erythematosus, and rheumatoid arthritis (Chaaba et al., 2023; Tu et al., 2023; Ye et al., 2021; Turolo et al., 2021). Moreover, it has been reported that the incidence of metabolic syndrome in patients with vitiligo is significantly higher than in healthy controls (Liang et al., 2022). Studies have shown that dysregulation of the fatty acid metabolic pathways is associated with the pathogenesis of vitiligo (Ni et al., 2020; Ye et al., 2022). However, there are no relevant studies on how AAM participates in the occurrence and development of vitiligo. Therefore, in-depth exploration of vitiligo based on metabolic disorders is needed.
In the present study, the weighted gene coexpression network analysis (WGCNA) tool and machine learning were used to explore the key genes related to AAM in vitiligo. Based on bioinformatics analysis of the biological pathways and immune microenvironments of the key genes, the molecular regulatory mechanisms of these genes were further explored to provide a new reference for the clinical diagnosis and treatment of vitiligo.
The GSE75819 dataset (platform: GPL6884), which includes 15 lesions and 15 control skin tissues from vitiligo patients (Supplementary Table S1), was downloaded from the Gene Expression Omnibus (GEO) database (https://www.ncbi.nlm.nih.gov/geo/) for use as the training set. The validation set GSE65127 (platform: GPL570) contained 10 lesions and 20 control skin tissue samples. A total of 58 AAM-related genes (AAM-RGs) were also downloaded from MSigDB (https://www.gsea-msigdb.org/gsea/msigdb).
The limma package (v3.54.0) (Ritchie et al., 2015) was used to analyze the differentially expressed genes (DEGs) of the lesional and control groups from the training set with |log2FC|>0.5 and adj. P < 0.05. The volcano plot was used to visualize the DEGs using the ggplot2 package (v3.4.1). The top-10 upregulated and downregulated DEGs were labeled in the volcano plot, and their expression heatmap was obtained using the circlize package (v0.4.15) (Gu et al., 2014). Furthermore, the intersection between the DEGs and AAM-RGs was obtained to identify the candidate genes. To probe the functions of these candidate genes, the gene ontology (GO) and Kyoto Encyclopedia Of Genes And Genomes (KEGG) enrichment analyses were conducted using the clusterProfiler package (v4.2.2) (Wu et al., 2021) with a threshold of adj. P < 0.05. To further explore the relationships between the proteins encoded by the candidate genes and understand their potential functions, the protein–protein interaction (PPI) network was constructed based on the protein interaction information in the STRING database by setting a medium confidence level >0.4.
The least absolute shrinkage and selection operator (LASSO) and support vector machine recursive feature elimination (SVM-RFE) algorithms were employed on the training set to screen the feature genes based on the candidate genes. LASSO regression analysis was then performed using the glmnet package (v4.1-4) (Friedman et al., 2010), where the optimal lambda value (Lambda.min) was obtained through 10-fold cross-validation to minimize the model error rate. At this stage, the feature genes 1 whose regression coefficients were not penalized to 0 were selected. Meanwhile, the SVM-RFE was implemented using the caret package (v6.0-93, https://cran.r-project.org/web/packages/caret/index.html) to obtain feature genes 2. Subsequently, the feature genes from the two machine learning algorithms were combined to yield the key genes. The expression levels of these key genes in the lesional and control groups from the training and validation sets were analyzed separately, and those with significant expression differences and consistent trends in both datasets were considered biomarkers for further analyses. To explore the performances of the biomarkers in differentiating vitiligo samples from the control samples, the “pROC” package (v1.18.0) was used on the training set GSE75819 to draw the receiver operating characteristics (ROC) curves of the candidate key genes and to calculate the area under the curve (AUC). An AUC value greater than 0.7 indicated that the corresponding gene had relatively good diagnostic performance.
To predict the risk of vitiligo, the rms package (https://CRAN.R-project.org/package=rms) was applied to create a nomogram based on the biomarkers identified from the training set with lesional status as the outcome. Then, the predictive ability of the nomogram was evaluated using the calibration curve, decision curve analysis (DCA), and clinical impact curves (CICs).
To investigate the biological pathways involved with the biomarkers, GSEA was performed on the biomarkers from the training set using the clusterProfiler package, and the Spearman correlation coefficient of each biomarker with all the other genes was computed using “c2cp.kegg.v7.5.1.symbols.gmt” as the reference set of genes. The genes were then sorted in descending order to produce a list of related genes corresponding to each biomarker for the GSEA.
We used the GSVA package (v1.42.0) (Hänzelmann et al., 2013) to compute the enrichment scores of 28 immune infiltrating cells for all samples in the training set based on the ssGSEA algorithm. Then, these enrichment scores were displayed in a box plot to identify the differential immune cells between the lesional and control groups. For the training set, the correlations between the differential immune infiltrating cells were analyzed using the corrplot package (v0.92), and the relationships between the biomarkers and differential immune cells were assessed by the Spearman correlation analysis to explore the immune microenvironment characteristics specific to vitiligo.
The distribution of biomarkers on the chromosomes was initially visualized using Circos (http://circos.ca/) with the training set. The GeneMania network was then constructed (http://www.genemania.org/) to predict other genes related to the biomarker functions and biological pathways. The transcription factors (TFs) regulating the biomarkers were retrieved from the Network Analyst database (https://www.networkanalyst.ca/), and the upstream miRNAs of the biomarkers were predicted for the training set using the ENCORI and miRWalk databases. Then, the miRNAs from the two databases were overlapped to obtain the intersecting miRNAs. Finally, the miRNA–mRNA–TF regulatory network was constructed using Cytoscape software.
Skin tissues from vitiligo patients (generally from the lower back) who were diagnosed as having advanced non-segmental vitiligo, including two men and two women aged 19–52 years, were obtained from the Department of Dermatology of Shaanxi Provincial People’s Hospital. The exclusion criteria were as follows: participants had other related skin or autoimmune diseases in the past 6 months or had received systemic therapy with glucocorticoids and immunosuppressive drugs. The skin tissues of healthy people were obtained from the plastic surgery department of Shaanxi Provincial People’s Hospital; these people had no genetic history, no systemic immune diseases, and no acute or chronic history and included two men and two women aged 21–56 years. This study was conducted in accordance with the guidelines of the Declaration of Helsinki. The Ethics Committee of Shaanxi Provincial People’s Hospital approved the study, and all patients provided written informed consent. Total RNA was extracted from the tissue samples using the Total RNA kit (Omega Bio-tec, Inc.). Then, the total RNA was transcribed into cDNA using the PrimeScript™ RT kit (TaKaRa, Dalian, China). RT-PCR was then performed using the PCR Master Mix (Thermo Fisher). The primers were designed using primer premier 5.0 software, and the sequences were as follows: PNPLA8 forward: 5′-AGCCTACAAGTCCTTCTGCGATAC-3′; PNPLA8 reverse: 5′-TCCGTGGGACGAGAAAGAAAGTTAG-3′; PTGDS forward: 5′-GGTCTCCGTGCAGCCCAAC-3′; PTGDS reverse: 5′-TGGACAACGCCGCCTTCTTC-3′; MGLL forward: 5′-TCCAACTGCTGAATGCCGTCTC-3′; MGLL reverse: 5′-TTGTCCTGGCTCTTGGCTAACTC-3′; β-actin forward: 5′-CTGGAACGGTGAAGGTGACA-3′; β-actin reverse: 5′-AAGGGACTTCCTGTAACAATGCA-3′. The PCR thermocycling conditions consisted of an initial 5 min of denaturation at 95°C, followed by 30 cycles at 95°C for 30 s, 54°C for 30 s, and 72°C for 40 s. The change in transcript abundance was calculated using the 2−ΔΔCT method.
R software (v4.2.2) was used for the statistical analyses. The differences between groups were analyzed by Wilcoxon’s test, and P < 0.05 was set as the statistical significance.
A total of 4,253 DEGs (2,473 upregulated and 1,780 downregulated) were obtained from the lesional and control groups of the training set (Figure 1A). The expressions of the top-10 upregulated and downregulated DEGs in the two groups are shown as a heatmap in Figure 1B. By overlapping the 4,253 DEGs with the 58 AAM-RGs, 15 candidate genes were obtained for subsequent analyses (Figure 1C). These 15 candidate genes were enriched in 221 GO items (e.g., AAM process, long-chain fatty acid metabolic process, and unsaturated fatty acid metabolic process) (Figure 1D; Supplementary Table S2) and 52 KEGG pathways (e.g., AAM, glutathione metabolism, and VEGF signaling pathway) (Figure 1E; Supplementary Table S3). The enrichment analysis results showed that the DEGs were widely involved in the AAM pathway associated with the synthesis of lipid molecules such as prostaglandins and leukotrienes that play key roles in various physiological processes, including inflammation and immunity. Furthermore, the PPI network showed 21 interactions between 14 proteins (GPX4-PTGS2, MGLL-FAAH, PTGS1-PTGDS etc.), of which ALOXE3 was an isolated target with no protein interactions with the other genes (Figure 1F).
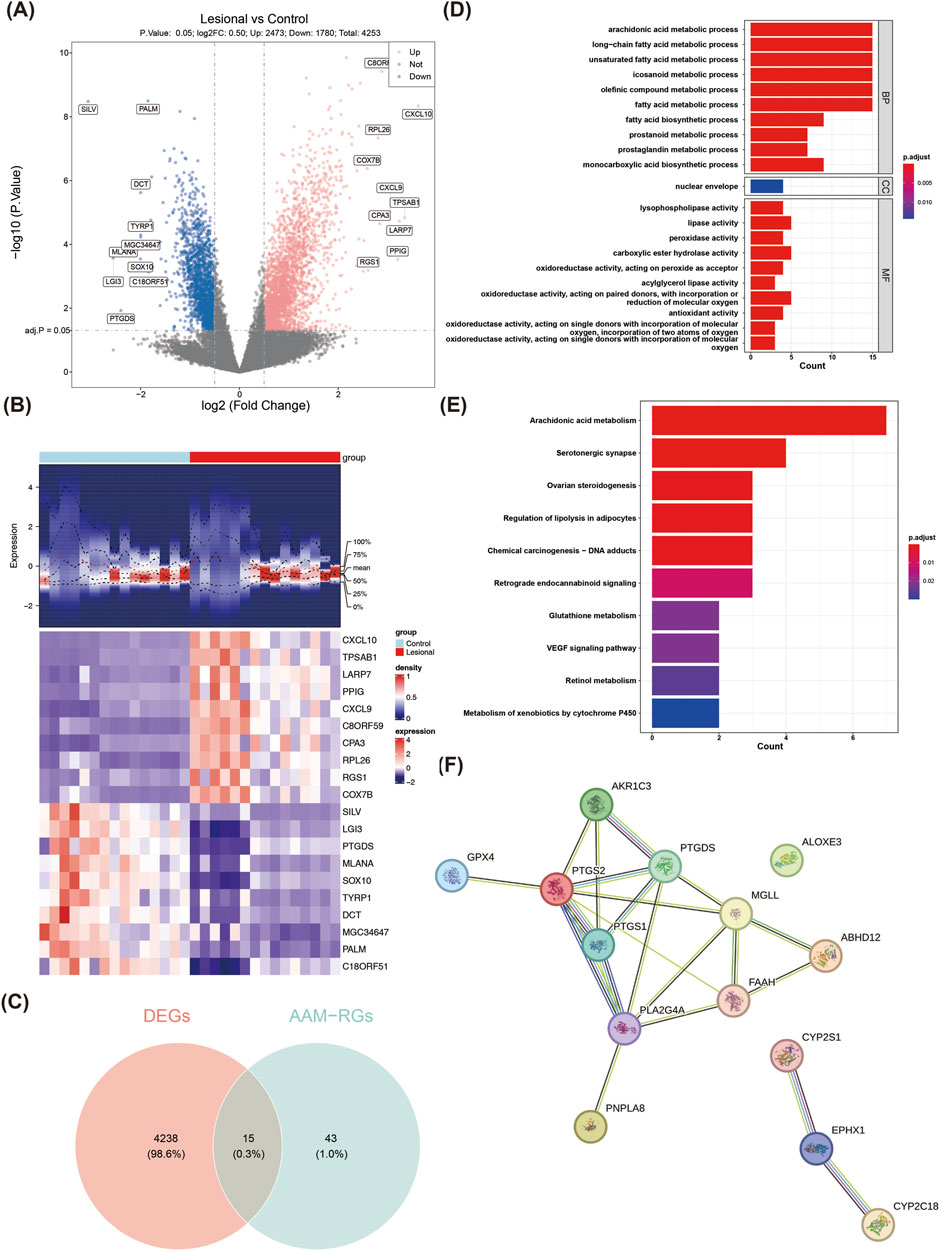
Figure 1. Identification and enrichment analyses of the candidate genes in normal and vitiligo samples. (A) Volcano plot of the differentially expressed genes (DEGs). The red dots represent the significantly upregulated genes, and the blue dots represent the significantly downregulated genes. (B) Heatmap of the DEGs. The top part is a density heatmap of the expression levels of the upregulated and downregulated genes in the samples showing the lines of the quartile means; the lower part is the expression heatmap of the top-10 upregulated and downregulated genes in the samples. Each square represented a sample, with red representing upregulation and purple representing downregulation. (C) Venn diagram of the interacting targets. (D) GO enrichment analysis results. (E) KEGG pathway enrichment analysis results. (F) PPI network of the candidate genes.
Based on the 15 candidate genes identified from the training set, six key genes (PTGDS, PNPLA8, FAAH, ABHD12, PTGS1, and MGLL) were screened through intersection with seven feature genes 1 produced by the LASSO algorithm (lambda.min = 0.005445) and 10 feature genes 2 produced by the SVM-RFE algorithm (Figures 2A–C). In the training set, PNPLA8 was found to be significantly overexpressed in the lesion group, while the other key genes were significantly underexpressed (Figure 2D). In the validation set, PNPLA8 and PTGS1 were significantly overexpressed, while PTGDS and MGLL were significantly underexpressed in the lesion group (Figure 2E). FAAH and ABHD12 showed no significant differences between the lesional and control groups. Therefore, PTGDS, PNPLA8, and MGLL were selected as biomarkers. The subsequent ROC results showed that the AUC values of PTGDS, PNPLA8, and MGLL were all greater than 0.7, indicating that these biomarkers had good diagnostic performances (Figure 2F).
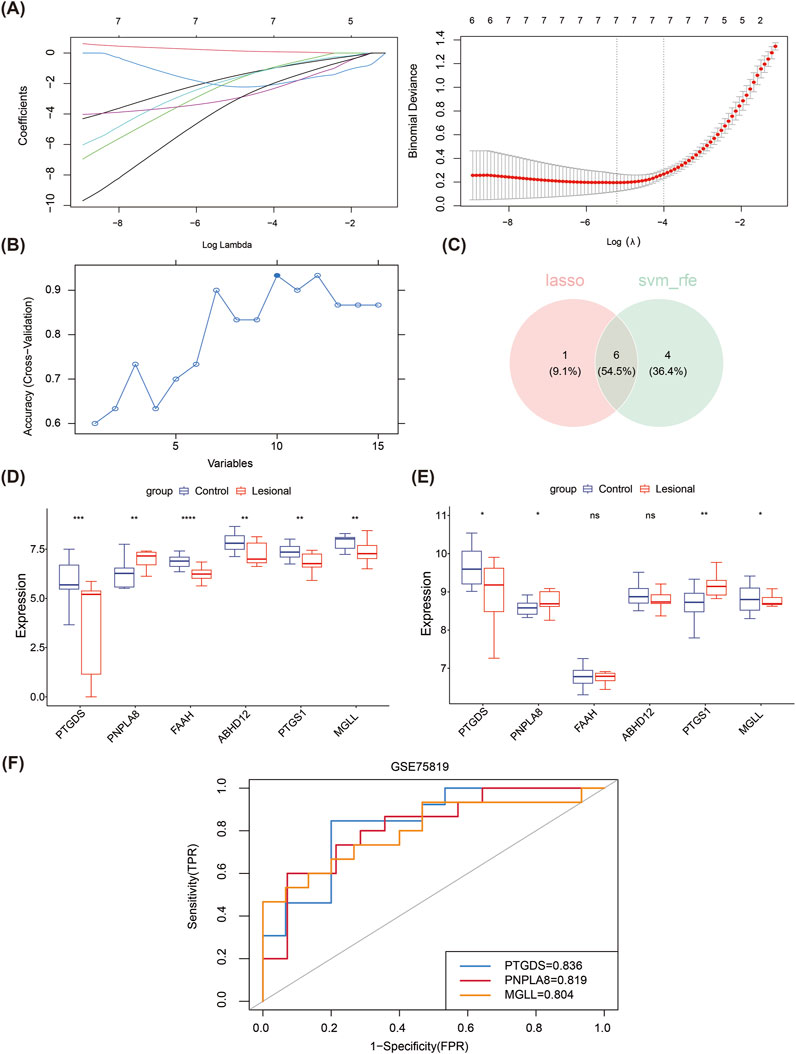
Figure 2. Machine learning approach for screening biomarkers. (A) LASSO logistic regression to screen candidate genes. (B) SVM-RFE for screening the candidate genes. (C) Venn diagrams of the hub genes between LASSO and SVM-RFE. (D) Expressions of the six hub genes in the training dataset. (E) Expressions of the six hub genes in the validation dataset. (F) The receiver operating characteristic curves of the three identified biomarkers show that the area under each curve is >0.7, as indicated in the inset legend.
The total points were computed based on the expressions of the three biomarkers to create a nomogram model for vitiligo prediction (Figure 3A). In the calibration curve for the nomogram, the P value of the Hosmer–Lemeshow test was greater than 0.05 (P = 0.496), indicating that there was no notable difference between the predicted and true values and that the model had a high predictive accuracy (Figure 3B). The DCA suggested that the net benefit of the nomogram model was higher than the extreme curves (Figure 3C). The CICs also indicated that the model might have high clinical validity (Figure 3D).
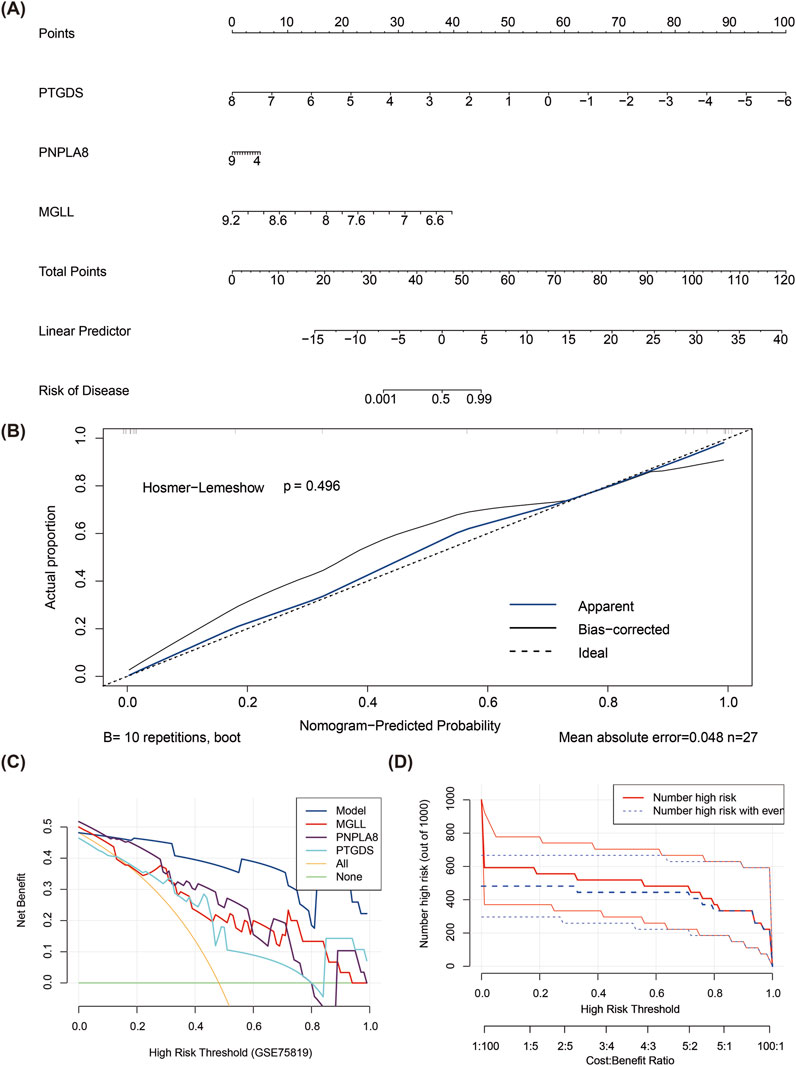
Figure 3. Construction of nomogram model for vitiligo prediction. (A) Nomogram model of PTGDS, MGLL, and PNPLA8. (B) Calibration curve for evaluating the predictive ability of the column chart mode. (C) Decision curve analysis for evaluating the predictive ability of the column chart model. (D) Clinical impact curve for evaluating the predictive ability of the column chart model.
According to the GSEA, PTGDS and PNPLA8 were significantly enriched in the ribosome, proteasome, cell cycle, and other pathways; MGLL was significantly enriched in the lysosome, endocytosis, Fc gamma R mediated phagocytosis, and other pathways (Figures 4A–C).
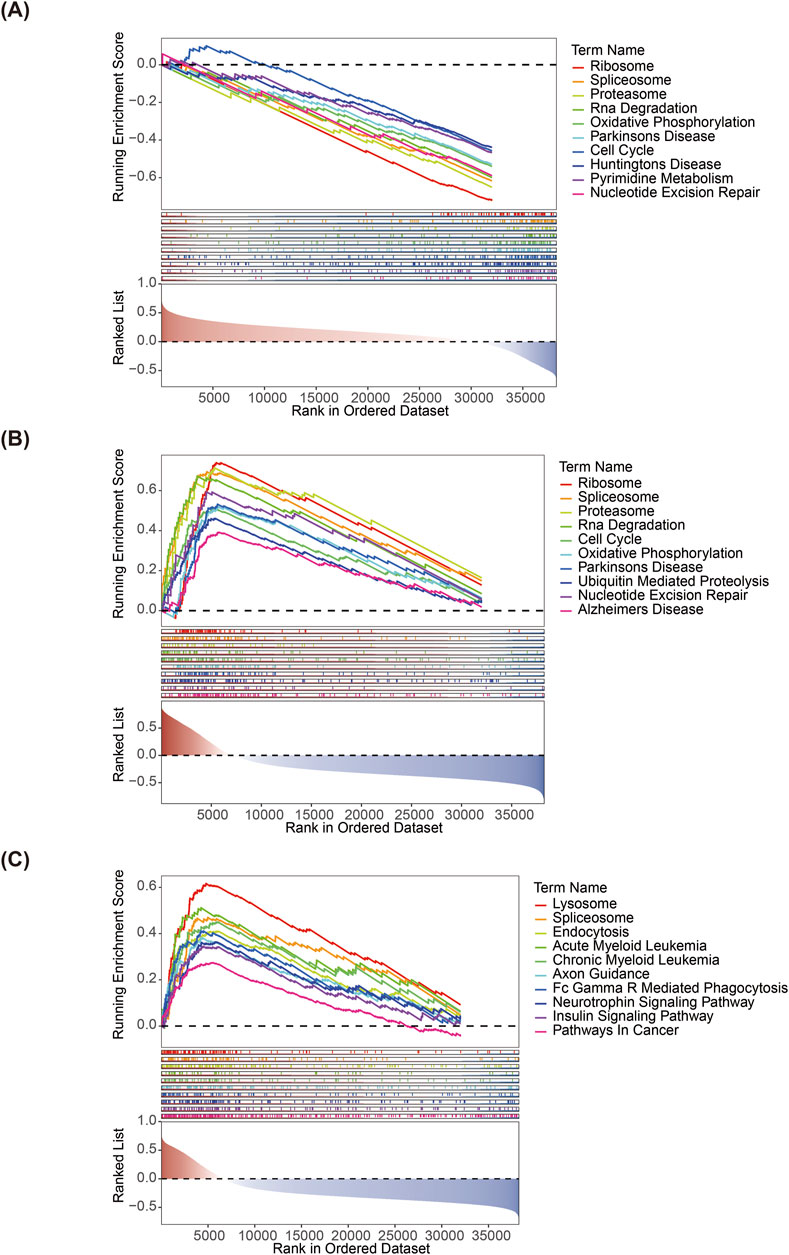
Figure 4. Gene set enrichment analyses of (A) PTGDS, (B) PNPLA8, and (C) MGLL.
Immune infiltration analysis was performed on 28 immune cells and three biomarkers. Initially, the heatmap showed the distribution of the enrichment scores of the 28 immune infiltrating cells between the lesion and control samples (Figure 5A). It was noted that the enrichment scores of 19 immune infiltrating cells, such as activated CD8 T cells, activated CD4 T cells, and effector memory CD4 T cells, were significantly different between the two groups (P < 0.05) (Figure 5B). Figure 5C shows the correlations between the 19 differential immune cells. There was an extremely significant negative correlation between monocytes and immature dendritic cells (cor = −0.86), while there was an extremely significant positive correlation between the activated CD4 T cells and effector memory CD4 T cells (cor = 0.85). The relationships between the immune cells and biomarkers showed that PTGDS and MGLL were both significantly negatively correlated with immune cells such as activated CD4 T cells, effector memory CD4 T cells, immature dendritic cells, and memory B cells as well as significantly positively correlated with central memory CD8 T cells, monocytes, plasmacytoid dendritic cells, and other cells. However, PNPLA8 had the opposite correlations as the above two genes, suggesting that PNPLA8 might play an opposite role to those of PTGDS and MGLL in the regulation of immune cells (Figure 5D).

Figure 5. Analysis of immune infiltration. (A) Heatmap of the distribution of immune infiltrating cells between lesional and control samples. (B) Box plot of the 28 immune cell expressions between the sample groups. (C) Heatmap of correlations between the immune cells. (D) Analysis of correlations between the three key genes and distinct immune cells. (*P < 0.05, **P < 0.01, ***P < 0.001).
The chromosomal localization analysis revealed that PTGDS was located on chromosome 9, PNPLA8 on chromosome 7, and MGLL on chromosome 3 (Figure 6A). A total of 20 genes related to biomarker functions were analyzed using GeneMania, and the functions of these genes were mainly related to lipid metabolic processes (Figure 6B). The results of TF predictions showed that 11 TFs could regulate the expression of MGLL while 4 TFs could regulate the expression of PTGDS. Among these TFs, TFAP2A was identified as a regulator of both biomarkers. In addition, the TF-miRNA-mRNA network showed the intersecting miRNAs and TFs corresponding to each of the three biomarkers (Figure 6C).
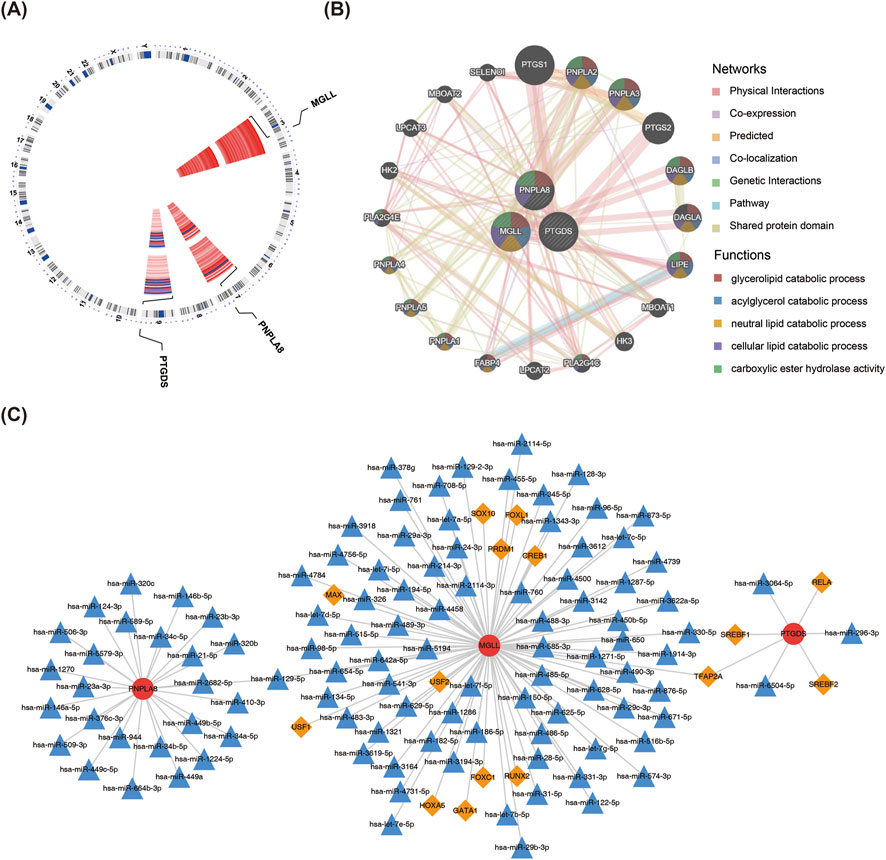
Figure 6. TF–miRNA–mRNA regulatory network. (A) Chromosome localization analysis of the three key genes. (B) GeneMania analysis of the key genes. (C) Analysis of the transcription factors and miRNAs regulatory network of the key genes. The red circles are the key genes, orange diamonds are the transcription factors, and blue triangles are the miRNAs.
The RT-PCR results showed that compared with the control group, the expressions of PTGDS and MGLL in the skin tissues of vitiligo patients were significantly downregulated, whereas the expression of PNPLA8 was significantly upregulated (Figure 7). These results were consistent with the findings of the bioinformatics analysis, confirming that the target genes may play crucial roles in vitiligo.
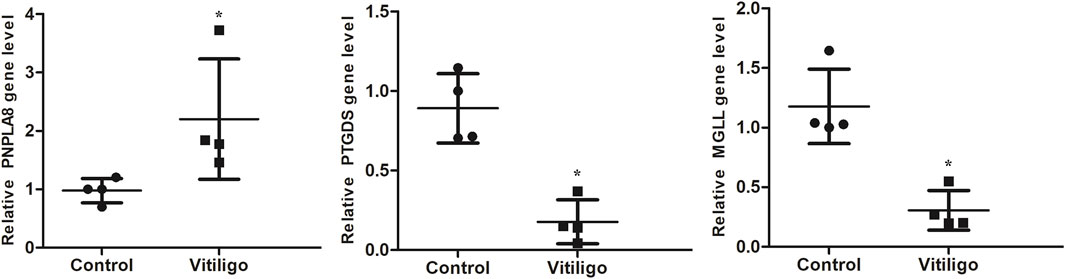
Figure 7. RT-PCR validation of the identified biomarkers. Skin tissues of four patients with vitiligo and four normal controls were collected for RT-PCR. (*P < 0.05).
Vitiligo is a depigmentation skin disorder caused by many factors, including autoimmune, metabolic, or their combination. The incidence of metabolic syndrome was reported to be significantly higher in patients with vitiligo than healthy controls (Tanacan and Atakan, 2020). The metabolic pathways of fatty acids, including arachidonic acid, are significantly associated with the development of vitiligo (Ni et al., 2020), but their action mechanisms in vitiligo have not been studied.
Machine learning algorithms are widely used in bioinformatics and genomics. In the present study, LASSO and SVM-RFE algorithms were used to screen the key genes related to AAM in vitiligo. The genes selected by LASSO focus on linear relationships, while the genes selected by SVM-RFE focus on classification performance. Combining the two algorithms can thus reduce the risk of overfitting due to the limitations of a single algorithm (Liang et al., 2022). The selected key genes were not only based on linear relationships and classification performance but also more representative and stable. In terms of biomarker prediction, this key gene set can more accurately reflect the characteristics of the biomarkers and improve prediction accuracy.
In this study, we first obtained six AAM-RGs in vitiligo by searching the transcriptome dataset in the GEO database along with difference analysis and machine learning; then, PTGDS, PNPLA8, and MGLL were verified as the three key genes through the validation set. Prostaglandin D synthase (PTGDS) is an important enzyme in the AAM pathway that is responsible for the synthesis of prostaglandin D2 (PGD2) and plays a critical role in the transportation of fat-soluble substances (Hu et al., 2022). PGD2 has anti-inflammatory and immunomodulatory functions and plays important roles in regulating the immune responses and maintaining immune homeostasis (Xu et al., 2024). Therefore, PTGDS may play a role in the immunomodulatory mechanism of vitiligo through its metabolite PGD2. In addition, the change in PTGDS expression may affect the normal functions of cells by regulating the oxidative stress level, which is related to the pathogenesis of vitiligo (Li et al., 2024). Monoacylglycerol lipase (MGLL) is a primary enzyme responsible for the hydrolysis of 2-arachidonoylglycerol (2-AG) for breaking down monoglycerides into glycerol and fatty acids (Gil-Ordóñez et al., 2018); it plays a crucial role in various pathological processes, including pain, inflammation, and oxidative stress (Fan et al., 2024). By hydrolyzing 2-AG, MGLL affects the levels of AA and its metabolites, which play important roles in immune regulation and inflammation, i.e., regulating T cell proliferation and cytokine secretion (Cisar et al., 2018; Deng and Li, 2020). Therefore, MGLL may participate in the immune response process of vitiligo by regulating the activation and functions of immune cells. PNPLA8 is a lipase 8 containing patatin-like phospholipase domains and is involved in regulating the production of fatty acids, such as AA, as well as regulation of melanin production and cell functions through activation of the PI3K/Akt/Gsk3β and MAPK signaling pathways (Tan et al., 2023; Mosca et al., 2021). In addition, PNPLA8 enhances the production of AA through various subclasses of phosphatidylethanolamine and phosphatidylcholine to increase the production of prostaglandin E2 (PGE 2), which is beneficial for cell growth (Ramanadham et al., 2015). Knockdown of PNPLA8 has been reported to increase lipid peroxidation and trigger the intrinsic apoptotic pathways (Moon et al., 2012). However, the specific roles of MGLL and PNPLA8 in vitiligo are not directly reported; thus, future studies may further explore the roles of these enzymes in vitiligo and their potential clinical applications. Our study also showed that the three key genes PTGDS, PNPLA8, and MGLL are biomarkers for predictive models of vitiligo. Although the diagnosis of vitiligo is relatively clear through clinical observations and the Wood’s lamp examination, AA and other unsaturated fatty acids can help determine the inflammatory and autoimmune statuses (Kuda et al., 2018; Schwarz et al., 2017).
We further conducted immune infiltration analysis of the key genes to understand the relationships between them and vitiligo as well as its pathological mechanism. This analysis showed that there were 19 different immune cells between the lesion and control groups and that the proportions of activated CD8 T cells, activated CD4 T cells, and effector memory CD4 T cells were higher in the lesion group. CD8 T lymphocytes play an important role in the pathogenesis of vitiligo and are responsible for the destruction of melanocytes (van den Boorn et al., 2009). These cytotoxic CD8 T cells are present in greater numbers in the blood of vitiligo patients compared to healthy controls and are associated with vitiligo activity (Strassner et al., 2017). CD4 T cell dysfunction is often observed in autoimmune diseases, and these cells also play an important role in the autoimmune pathogenesis of vitiligo. Early reports have shown that the CD4 and CD8 T cells in vitiligo primarily produce IFN-γ and TNF-α, which are characteristic of Th1/Tc1 cell polarization (Wańkowicz-Kalińska et al., 2003). Studies using transgenic mouse models of melanocyte-specific T cell receptors have shown that CD4 T cells are involved in skin decolorization (Lambe et al., 2006). In addition, our results show that PTGDS, PNPLA8, and MGLL are significantly associated with changes in multiple immune cells; here, PTGDS and MGLL have similar correlations with the immune cells, whereas PNPLA8 has the opposite correlation of the other two genes. These results suggest that PTGDS, PNPLA8, and MGLL may be involved in the pathogenesis of vitiligo through immune responses.
The results of TF predictions show that 11 TFs could regulate the expression of MGLL and 4 TFs could regulate the expression of PTGDS. TFAP2A was identified as a common transcriptional regulator of the biomarkers PTGDS and MGLL; TFAP2A can bind to DNA and plays an important role in regulating cell proliferation, differentiation, and apoptosis. Several TFs, including TFAP2A, have been identified in the skin samples of psoriasis patients and have been associated with the development of skin lesions in psoriasis (Alena et al., 2017). The role of TFAP2A in vitiligo needs further exploration and experimental evidence. We also constructed a TF–miRNA–mRNA network, which is conducive to further exploration of the mechanisms of these biomarkers in the occurrence and development of vitiligo.
There are some limitations to our present study. First, although we verified the expression patterns of the key genes, the specific biological roles of the related genes in vitiligo have not been explored deeply. Future studies are thus needed for functional validation in combination with in vivo and in vitro models to confirm the roles of these genes in vitiligo. Second, given the small sample sizes and limited sources, the statistical power of the results presented herein may be inadequate. Therefore, increasing the sample size and adding multicenter samples can help improve the reliability and broader applicability of our findings. In addition, although the biomarkers identified herein show potential for the diagnosis of vitiligo, there may be limitations in distinguishing the different stages or subtypes of vitiligo. Future studies should thus consider including samples of patients with different subtypes and stages of vitiligo to better evaluate the application of the proposed approach in clinical typing.
In summary, our results suggest that AAM may be closely related to vitiligo and that the AAM-RGs can be used as diagnostic biomarkers of vitiligo. The different expression patterns of these genes can provide more information for the diagnosis and treatment of vitiligo. By analyzing the expression characteristics of these genes, we can better predict the responses of patients to different treatment schemes, provide a scientific basis for the development of personalized treatment regimens, and dynamically monitor the effects during treatment to improve the treatment effects as well as quality of life of the patients.
The datasets presented in this study can be found in online repositories. The names of the repositories and accession numbers can be found in the article/Supplementary Material.
The studies involving humans were approved by the Ethics Committee of Shaanxi Provincial People’s Hospital. The studies were conducted in accordance with all local legislation and institutional requirements. The participants provided their written informed consent to participate in this study.
XL: data curation, investigation, and writing–original draft. LY: data curation, methodology, and writing–review and editing. LZ: data curation, funding acquisition, and writing–review and editing. JS: validation and writing–review and editing. CX: methodology and writing–review and editing. LS: conceptualization, funding acquisition, investigation, and writing–original draft.
The authors declare that financial support was received for the research, authorship, and/or publication of this article. This research was supported by the National Natural Science Foundation of China (no. 81903218) and Open Funds for Shaanxi Provincial Key Laboratory of Infection and Immune Diseases (no. 2023-KFQN-1).
The authors declare that the research was conducted in the absence of any commercial or financial relationships that could be construed as a potential conflict of interest.
The authors declare that no Generative AI was used in the creation of this manuscript.
All claims expressed in this article are solely those of the authors and do not necessarily represent those of their affiliated organizations, or those of the publisher, the editors and the reviewers. Any product that may be evaluated in this article, or claim that may be made by its manufacturer, is not guaranteed or endorsed by the publisher.
The Supplementary Material for this article can be found online at: https://www.frontiersin.org/articles/10.3389/fmolb.2025.1536477/full#supplementary-material
Alena, Z., Evgeny, C., Mehta, R., Baranova, A., Tatarinova, T. V., and Bruskin, S. (2017). Identification of transcriptional regulators of psoriasis from RNA-seq experiments. Methods Mol. Biol. 1613, 355–370. doi:10.1007/978-1-4939-7027-8_14
Chaaba, R., Bouaziz, A., Ben Amor, A., Mnif, W., Hammami, M., and Mehri, S. (2023). Fatty acid profile and genetic variants of proteins involved in fatty acid metabolism could Be considered as disease predictor. Diagn. (Basel) 13 (5), 979. doi:10.3390/diagnostics13050979
Cisar, J. S., Weber, O. D., Clapper, J. R., Blankman, J. L., Henry, C. L., Simon, G. M., et al. (2018). Identification of ABX-1431, a selective inhibitor of monoacylglycerol lipase and clinical candidate for treatment of neurological disorders. J. Med. Chem. 61 (20), 9062–9084. doi:10.1021/acs.jmedchem.8b00951
Cunningham, K. N., and Rosmarin, D. (2023). Vitiligo treatments: review of current therapeutic modalities and JAK inhibitors. Am. J. Clin. Dermatol 24 (2), 165–186. doi:10.1007/s40257-022-00752-6
Deng, H., and Li, W. (2020). Monoacylglycerol lipase inhibitors: modulators for lipid metabolism in cancer malignancy, neurological and metabolic disorders. Acta Pharm. Sin. B 10 (4), 582–602. doi:10.1016/j.apsb.2019.10.006
Duan, H., Song, W., Zhao, J., and Yan, W. (2023). Polyunsaturated fatty acids (PUFAs): sources, digestion, absorption, application and their potential adjunctive effects on visual fatigue. Nutrients 15 (11), 2633. doi:10.3390/nu15112633
Fan, C., Du, J., Yu, Z., Wang, J., Yao, L., Ji, Z., et al. (2024). Inhibition of MAGL attenuates intervertebral disc degeneration by delaying nucleus pulposus senescence through STING. Int. Immunopharmacol. 20 (131), 111904. doi:10.1016/j.intimp.2024.111904
Friedman, J., Hastie, T., and Tibshirani, R. (2010). Regularization paths for generalized linear models via coordinate descent. J. Stat. Softw. 33 (1), 1–22. doi:10.18637/jss.v033.i01
Gil-Ordóñez, A., Martín-Fontecha, M., Ortega-Gutiérrez, S., and López-Rodríguez, M. L. (2018). Monoacylglycerol lipase (MAGL) as a promising therapeutic target. Biochem. Pharmacol. 157, 18–32. doi:10.1016/j.bcp.2018.07.036
Gu, Z., Gu, L., Eils, R., Schlesner, M., and Brors, B. (2014). Circlize Implements and enhances circular visualization in R. Bioinformatics 30 (19), 2811–2812. doi:10.1093/bioinformatics/btu393
Hänzelmann, S., Castelo, R., and Guinney, J. (2013). GSVA: gene set variation analysis for microarray and RNA-seq data. BMC Bioinforma. 16 (14), 7. doi:10.1186/1471-2105-14-7
Hu, S., Cai, S. R. Y., Cai, Y., Liu, J., Han, Y., Zhao, Y., et al. (2022). Glycoprotein PTGDS promotes tumorigenesis of diffuse large B-cell lymphoma by MYH9-mediated regulation of Wnt-β-catenin-STAT3 signaling. Cell Death Differ. 29 (3), 642–656. doi:10.1038/s41418-021-00880-2
Kuda, O., Rossmeisl, M., and Kopecky, J. (2018). Omega-3 fatty acids and adipose tissue biology. Mol. Asp. Med. 64, 147–160. doi:10.1016/j.mam.2018.01.004
Lambe, T., Leung, J. C. H., Bouriez-Jones, T., Silver, K., Makinen, K., Crockford, T. L., et al. (2006). CD4 T cell-dependent autoimmunity against a melanocyte neoantigen induces spontaneous vitiligo and depends upon Fas-Fas ligand interactions. J. Immunol. 177, 3055–3062. doi:10.4049/jimmunol.177.5.3055
Li, W., Yao, T., Zhang, X., and Weng, X. (2024). Oxylipin profiling analyses reveal that ω-3 PUFA is more susceptible to lipid oxidation in sheep testis under oxidative stress. Anim. Reprod. Sci. 268, 107567. doi:10.1016/j.anireprosci.2024.107567
Liang, Y., Lin, F., and Huang, Y. (2022). Identification of biomarkers associated with diagnosis of osteoarthritis patients based on bioinformatics and machine learning. J. Immunol. Res. 13, 5600190. doi:10.1155/2022/5600190
Lyu, C., and Sun, Y. (2022). Immunometabolism in the pathogenesis of vitiligo. Front. Immunol. 10 (13), 1055958. doi:10.3389/fimmu.2022.1055958
Moon, S. H., Jenkins, C. M., Kiebish, M. A., Sims, H. F., Mancuso, D. J., and Gross, R. W. (2012). Genetic ablation of calcium-independent phospholipase A(2)γ (iPLA(2)γ) attenuates calcium-induced opening of the mitochondrial permeability transition pore and resultant cytochrome c release. J. Biol. Chem. 287, 29837–29850. doi:10.1074/jbc.M112.373654
Mosca, S., Cardinali, G., Flori, E., Briganti, S., Bottillo, I., Mileo, A. M., et al. (2021). The PI3K pathway induced by αMSH exerts a negative feedback on melanogenesis and contributes to the release of pigment. Pigment. Cell Melanoma Res. 34 (1), 72–88. doi:10.1111/pcmr.12910
Ni, Q., Ye, Z., Wang, Y., Chen, J., Zhang, W., Ma, C., et al. (2020). Gut microbial dysbiosis and plasma metabolic profile in individuals with vitiligo. Front. Microbiol. 11, 592248. doi:10.3389/fmicb.2020.592248
Post, N. F., Ginski, G., Peters, R., Van Uden, N. O. P., Bekkenk, M. W., Wolkerstorfer, A., et al. (2023). Trained immunity in the pathogenesis of vitiligo. Pigment. Cell Melanoma Res. 36 (5), 348–354. doi:10.1111/pcmr.13101
Ramanadham, S., Ali, T., Ashley, J. W., Bone, R. N., Hancock, W. D., and Lei, X. (2015). Calcium-independent phospholipases A 2 and their roles in biological processes and diseases. J. Lipid Res. 56 (9), 1643–1668. doi:10.1194/jlr.R058701
Ritchie, M. E., Phipson, B., Wu, D., Hu, Y., Law, C. W., Wei, S., et al. (2015). Limma powers differential expression analyses for RNA-sequencing and microarray studies. Nucleic Acids Res. 43 (7), e47. doi:10.1093/nar/gkv007
Schwarz, A., Bruhs, A., and Schwarz, T. (2017). The short-chain fatty acid sodium butyrate functions as a regulator of the skin immune system. J. Invest. Dermatol 137, 855–864. doi:10.1016/j.jid.2016.11.014
Strassner, J. P., Rashighi, M., Ahmed, R. M., Richmond, J. M., and Harris, J. E. (2017). Suction blistering the lesional skin of vitiligo patients reveal useful biomarkers of disease activity. J. Am. Acad. Dermatol 76, 847–855. doi:10.1016/j.jaad.2016.12.021
Tan, Z., Deme, P., Boyapati, K., Claes, B. S. R., Duivenvoorden, A. A. M., Heeren, R. M. A., et al. (2023). Key regulator PNPLA8 drives phospholipid reprogramming induced proliferation and migration in triple-negative breast cancer. Breast Cancer Res. 25 (1), 148. doi:10.1186/s13058-023-01742-0
Tanacan, E., and Atakan, N. (2020). Higher incidence of metabolic syndrome components in vitiligo patients: a prospective cross-sectional study. Bras. Dermatol 95, 165–172. doi:10.1016/j.abd.2019.07.006
Tu, B., Fang, R., Zhu, Z., Chen, G., Peng, C., and Ning, R. (2023). Comprehensive analysis of arachidonic acid metabolism-related genes in diagnosis and synovial immune in osteoarthritis: based on bulk and single-cell RNA sequencing data. Inflamm. Res. 72 (5), 955–970. doi:10.1007/s00011-023-01720-4
Turolo, S., Edefonti, A., Mazzocchi, A., Syren, M. L., Morello, W., Agostoni, C., et al. (2021). Role of arachidonic acid and its metabolites in the biological and clinical manifestations of idiopathic nephrotic syndrome. Int. J. Mol. Sci. 22 (11), 5452. doi:10.3390/ijms22115452
van den Boorn, J. G., Konijnenberg, D., Dellemijn, T. A., van der Veen, J. P. W., Bos, J. D., Melief, C. J. M., et al. (2009). Autoimmune destruction of skin melanocytes by perilesional T cells from vitiligo patients. J. Invest. Dermatol 129, 2220–2232. doi:10.1038/jid.2009.32
Wańkowicz-Kalińska, A., van den Wijngaard, RMJGJ, Tigges, B. J., Westerhof, W., Ogg, G. S., Cerundolo, V., et al. (2003). Immunopolarization of CD4+ and CD8+ T cells to Type-1-like is associated with melanocyte loss in human vitiligo. Lab. Investig. J. Tech. Methods Pathol. 83, 683–695. doi:10.1097/01.lab.0000069521.42488.1b
Wu, T., Hu, E., Xu, S., Chen, M., Guo, P., Dai, Z., et al. (2021). clusterProfiler 4.0: a universal enrichment tool for interpreting omics data. Innov. (Camb) 2 (3), 100141. doi:10.1016/j.xinn.2021.100141
Xu, J., Xu, Y., Hou, L., He, X., Li, Y., Zhao, J., et al. (2024). Molecular basis of lipid and ligand regulation of prostaglandin receptor DP2. Proc. Natl. Acad. Sci. U. S. A. 121 (51), e2403304121. doi:10.1073/pnas.2403304121
Ye, Z., Chen, J., Du, P., Ni, Q., Li, B., Zhang, Z., et al. (2022). Metabolomics signature and potential application of serum polyunsaturated fatty acids metabolism in patients with vitiligo. Front. Immunol. 13, 839167. doi:10.3389/fimmu.2022.839167
Ye, Z., Shen, Y., Jin, K., Qiu, J., Hu, B., Jadhav, R. R., et al. (2021). Arachidonic acid regulated calcium signaling in T cells from patients with rheumatoid arthritis promotes synovial inflammation. Nat. Commun. 12, 907. doi:10.1038/s41467-021-21242-z
Keywords: vitiligo, arachidonic acid metabolism, key genes, machine learning, biomarker
Citation: Li X, Yang L, Zhu L, Sun J, Xu C and Sun L (2025) Identifying potential biomarkers and molecular mechanisms related to arachidonic acid metabolism in vitiligo. Front. Mol. Biosci. 12:1536477. doi: 10.3389/fmolb.2025.1536477
Received: 29 November 2024; Accepted: 30 January 2025;
Published: 26 February 2025.
Edited by:
Xin Zhang, Jiangmen Central Hospital, ChinaCopyright © 2025 Li, Yang, Zhu, Sun, Xu and Sun. This is an open-access article distributed under the terms of the Creative Commons Attribution License (CC BY). The use, distribution or reproduction in other forums is permitted, provided the original author(s) and the copyright owner(s) are credited and that the original publication in this journal is cited, in accordance with accepted academic practice. No use, distribution or reproduction is permitted which does not comply with these terms.
*Correspondence: Cuixiang Xu, xucuixiang1129@163.com; Lijun Sun, lijun200206@163.com
Disclaimer: All claims expressed in this article are solely those of the authors and do not necessarily represent those of their affiliated organizations, or those of the publisher, the editors and the reviewers. Any product that may be evaluated in this article or claim that may be made by its manufacturer is not guaranteed or endorsed by the publisher.
Research integrity at Frontiers
Learn more about the work of our research integrity team to safeguard the quality of each article we publish.