Abstract
Riparian vegetation always grows on both sides of a natural river during a dam-break event, while the river typically retains some water instead of completely drying out. The RNG k-ϵ turbulence model is employed to examine the evolutionary characteristics of the dam-break flow in the downstream vegetated channel. This model facilitates the analysis of water-level fluctuations, velocity distributions, and the retardation effects of vegetation on the dam-break flow by varying the initial water depth (IWD) in the downstream channel. Results indicates that as the water depth in the downstream channel increases, the dam-break wave tends to form more readily, possesses a larger amplitude, and the duration of rapid congestion in the dam-break current decreases. Hence, the surface velocity gradually declines and shows an intermittent distribution. Vegetation impedes the flow evolution in the vegetated area, an effect that diminishes progressively with increasing IWD. In contrast, vegetation hastens the evolution of water flow in the main channel, which remains minimally affected by the IWD.
1 Introduction
Landslide lakes are natural lakes with a defined reservoir capacity formed by solid materials such as avalanches, landslides, mudflows, and other debris-blocking channels or river valleys. These lakes are predominantly found in the mountainous areas of southwestern China (Costa and Schuster, 1988). Landslide lakes represent valuable resources, and their rational development and utilization can generate substantial wealth for humanity. However, they also pose considerable safety risks due to the immense potential energy they contain. In the event of a breach, the resulting dam-break water flow can sharply increase downstream water-levels and velocity, resulting in severe property damage and loss of life (Liu et al., 2020; Zhong et al., 2021; Li et al., 2024). Thus, it is crucial to understand the evolutionary characteristics of landslide dam-break floods on a wet-bed to mitigate flood risk and develop downstream emergency evacuation strategies.
The dam-break wave, generated by the high-speed landslide dam-break flow changes, adversely affects the downstream structure and environment during its movement. Scholars have extensively studied landslide dam-break flow due to its significance and complexity, producing numerous related research findings (Ye and Zhao, 2017; Seyedashraf et al., 2018; Yang et al., 2019, 2022; Li et al., 2023). Analysis of 352 landslide dams with life statistics revealed that 29.8% of landslide dams breached within one day of formation, 68.2% within one month, and 84.4% within one year (Shen et al., 2020). Evolutionary characteristics of landslide lake dam-break flows have primarily been investigated through mathematical modeling tests and numerical calculations. The effects of boundary roughness, channel slope, and changes in channel cross-section on the evolution of dam-break floods in downstream channels were investigated using a flat-bottomed rectangular flume and a sloping-bottomed rectangular flume (Lauber and Hager, 1998). Soares-Frazão and Zech (2007) analyzed the evolution of dam-break floods in the presence of obstacles in the channel, demonstrating that how obstacles alter the flow direction and create a wake zone. Temporal changes in water surface elevation at the gate location, quantified from high-speed video recording images, can be divided into three stages: a sharp decline, a relatively stable period, and a gradual decline (Liu et al., 2017). The theory of wave evolution during dam-break flow movement has been extensively studied by many scholars. Ritter (1892) investigated the characteristics of dam-break flow evolution on a frictionless horizontal dry riverbed by applying the Saint-Venant equation using the eigenline method. Building on Ritter’s solution, subsequent studies have considered the effects of riverbed friction and slope on the propagation of dam-break flow (Dressler, 1952; Whitham, 1955; Chanson, 2009; Mungkasi and Roberts, 2010). Stoker extended Ritter’s solution to wet beds using the eigenline method. However, due to the invalidity of its wavefront assumptions, Stoker’s solution fails to accurately describe the fluctuation evolution process and the corresponding wavefront surface profile (Yang et al., 2019). Wang et al. (2017) derived an analytical solution for the propagation of dam-break waves in an inclined dry riverbed with arbitrary cross-sectional shapes using the cross-sectional shape parameter separation method and the eigenline method. An analytical solution for the propagation of dam-break waves in an inclined wet riverbed was gradually developed in subsequent studies (Wang et al., 2020).
In nature, riparian vegetation always consistently along both sides of the channel, remaining the initial water at the bottom. The drag force exerted by the vegetation significantly impacts the water flow field structure, altering the dam-break wave’s movement process. This force also affects sediment transport at the bottom of the bed (Liu et al., 2024). The effect of vegetation on outburst water has increasingly attracted the attention of scholars both domestically and internationally (Hu and Zhang, 2022; Liu et al., 2022; Shan et al., 2023; Zhang and Hu, 2023). Zhang (2013) developed a two-dimensional dam-break numerical model based on an unstructured quadtree network and the finite volume method, integrating shallow water dynamics, riverbed deformation, and sediment transport equations. This model numerically simulated the dam-break water motion characteristics in a vegetated floodplain, and the computational results were consistent with model tests. Nadaoka and Yagi (1998) and Zhang et al. (2013) established two-dimensional and three-dimensional numerical models to simulate the behavior of irregular waves and water in a flume influenced by vegetation, revealing the variations in wave height and water surface within the vegetated channel. However, in-depth research on riparian vegetation’s obstructive effect on the movement of dam-break wave is lacking.
Based on existing research, the RNG k - ϵ turbulence model is employed to conduct a numerical investigation of the evolution characteristics of dam-break water under varying downstream channel depth conditions in a vegetated rectangular channel. This analysis aims to provide a theoretical reference for further studies on the evolution of dam-break water in landslide lakes by examining water-level fluctuations, velocity distributions, and the retardation effect of vegetation.
2 Model layout
2.1 Numerical model
The computational fluid dynamics (CFD) commercial computational software Flow-3D is employed to develop the computational model. The dimensions of the model flume are consistent with the experimental flume described in Yang et al. (2022). This computational model enhances Yang’s flume model by positioning cylinders on both sides to represent the natural riparian vegetation to examine the evolution characteristics of dam-break water with riparian vegetation on both sides of the downstream channel. The computational model’s dimensions are 10.72 m in length, 1.48 m in width, and 0.5 m in height. The length of the upstream reservoir area is 4.58 m, and the distance from the reservoir dam to the front end of the vegetation area is 2 m, ensuring that the dam-break water has fully reaches by the time it entered the vegetation area. Three rows of cylinders are placed within a 30 cm distance on both sides of the channel, and the longitudinal distance of the vegetation zone is set to 3 m. The details of the computational model are illustrated in Figure 1. Various initial depths of the downstream channel are set to explore the effect of the initial water depth (IWD) of the channel on the evolution characteristics of the dam-break flood when riparian vegetation present on both sides of the downstream channel, as depicted in Table 1.
Figure 1

Calculation model layout (A) 3D model; (B) 2D Layout.
Table 1
| cases | L (m) | B (m) | BV (m) | hu (m) | hd (m) |
|---|---|---|---|---|---|
| case1 | 10.72 | 1.49 | 0 | 0.5 | 0 |
| case2 | 0.1 | ||||
| case3 | 0.2 | ||||
| case4 | 0.3 | ||||
| case5 | 10.72 | 1.49 | 0.3 | 0.5 | 0 |
| case6 | 0.1 | ||||
| case7 | 0.2 | ||||
| case8 | 0.3 |
Operating parameters in different cases.
2.2 Governing equations
In this study, the RNG k - ϵ turbulence model proposed by Yakhot and Orszag (1986) is adopted, which can effectively simulate complex hydraulic conditions (Hu and Zhang, 2023; Shen et al., 2022). Such direct numerical simulations (DNS) and large eddy simulation (LES) (Kang and Sotiropoulos, 2011) can provide more accurate calculations, but have high requirements regarding the grid resolution and computational costs, especially in this paper. Thus, the RNG k - ϵ turbulence model, which is less resource intensive, can also meet research and calculation needs. The governing equations of turbulent kinetic energy (k) and turbulent dissipation rate (ϵ) are as follows:
k equation:
ϵ equation:
where VF is the flowable volume fraction; Ax, Ay, and Az are the area fractions, respectively; x, y, and z axes corresponded to the streamwise, lateral and vertical directions, respectively; u, v, and w are the velocity of the x, y, and z axes, respectively; PT is the term for generating k due to the velocity gradient; and Diff is the diffusion term.
The PT expression is:
where R = 1, ξ = 0; CSPRO is the turbulence parameter and defaults to 0; GT is the turbulence energy generation term due to buoyancy, and for incompressible fluids GT = 0.
The Diff described as follows:
where νT and μ are the kinematic and dynamic viscosity coefficients, respectively, calculated as follows:
2.3 Set and boundary conditions
The two-phase flow is modeled using the VOF model proposed by Hirt and Nichols (1981), which determines the free liquid level by investigating the fluid-to-grid volume ratio function F in the grid cells. The transfer function for F is as follows:
where FDIff is the diffusive fluid fraction; F is the transport function.
The initial and boundary conditions in this study are as follows:
-
1. Initial conditions: The initial range of the water body is designed based on the test conditions. Initially, the water body is stationary without velocity, and is positioned in the downstream channel at the required depth.
-
2. Export Boundary Conditions: A free outflow boundary (Outflow) is selected as the boundary condition for the river outlet, ensuring that the dam-break water at the outlet’s end does not reflect back into the water upstream. Simultaneously, a specific barrage is set at the outlet to maintain a certain IWD in the downstream channel.
-
3. Free Liquid Surface Boundary Conditions: The specified pressure boundary is chosen as the boundary condition for the free liquid surface, with the pressure set to standard atmospheric pressure.
-
4. Wall boundary: The channel walls are established as solid wall boundaries (Wall) with no penetration and no-slip, and the water on the walls had no vectorial velocity. The roughness height (n) of both sidewalls and bed is 6 mm.
2.4 Grids
High-quality meshes are essential for speed and accuracy in numerical simulation calculations due to their impact on the precision of results. A structured mesh is utilized in this computational model. In Flow-3D, the infinite approximation method constructs the morphology of different structures. In this model, the sink displays a regular morphology, allowing the mesh to align closely with the edge wall of the sink. The model is divided by a uniform grid of 0.02 m, totaling approximately 1.3 million grids. When a cylinder is placed within the sink, the circular vegetation inside requires local grid refinement to bring grid nodes infinitely close to the cylinder, thus enabling accurate simulation of the cylinder’s morphology. The non-vegetated area maintains a grid scale of 0.02 m, while the vegetated area is locally refined to a minimum grid cell size of 0.008 m. The number of grids in the model approaches 4.3 million. The grid distribution of the computational model with vegetation is depicted in Figure 2.
Figure 2

Grids of the numerical model.
2.5 Model validation
The accuracy of the turbulence model in dam-break water calculations must be analyzed before conducting a detailed study to ensure the study’s accuracy and credibility. In this study, the accuracy of the RNG k - ϵ turbulence model is verified by calculating for case 3 and case 4 and comparing the results with the experimental data of Yang (2022). A point at x = 8.68 m and y = 1.12 m, downstream of the channel, is selected, and its time-dependent wave height curves are analyzed, as depicted in Figure 3. The time-dependent water-level process at both locations closely matches the experimental values, with minimal discrepancies between the peak and trough locations. The overall relative error mean values are 0.7% and 0.48%, respectively. Therefore, the RNG k - ϵ turbulence model can accurately simulate the evolution of the dam-break flow in vegetated rivers, indicating that the results of this study are credible and reasonable.
Figure 3
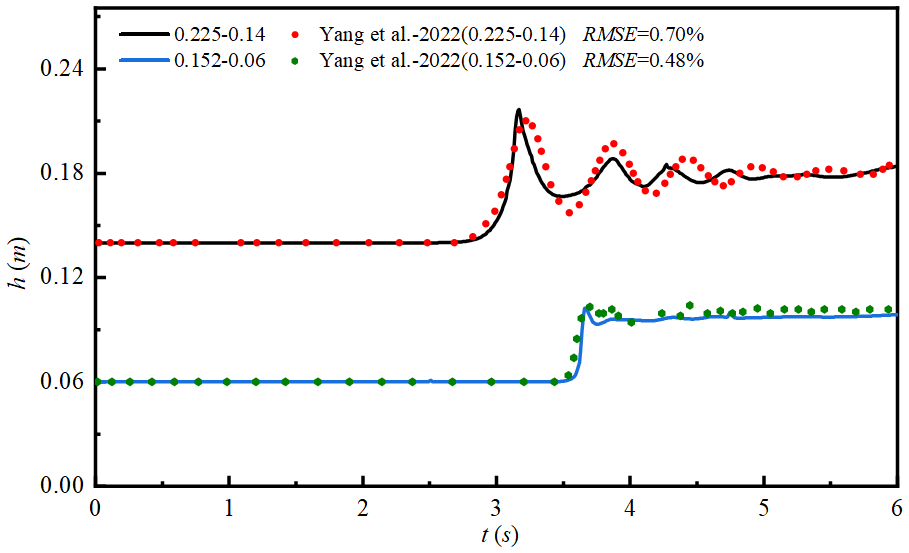
Comparison of numerical simulation and experimental data.
3 Result and discussion
3.1 Analysis of water-level fluctuations
The water-level evolution process at 15 characteristic points was analyzed to investigate the influence of the IWD in the vegetated channel on the evolution process of the dam-break flood. These points were selected upstream, and downstream of the vegetated area, in the longitudinal direction, at the middle position of the vegetated area, and the middle position of the main channel in the transverse direction (Figure 1). The time-course curves of water-level change at the characteristic points on the left and right bank sides were almost identical; thus, only one side of the water-level change process was considered in subsequent analysis. The time-course curves of water-levels at characteristic points in the middle of the channel and on the riparian side upstream of the vegetated area are shown in Figure 4.
Figure 4
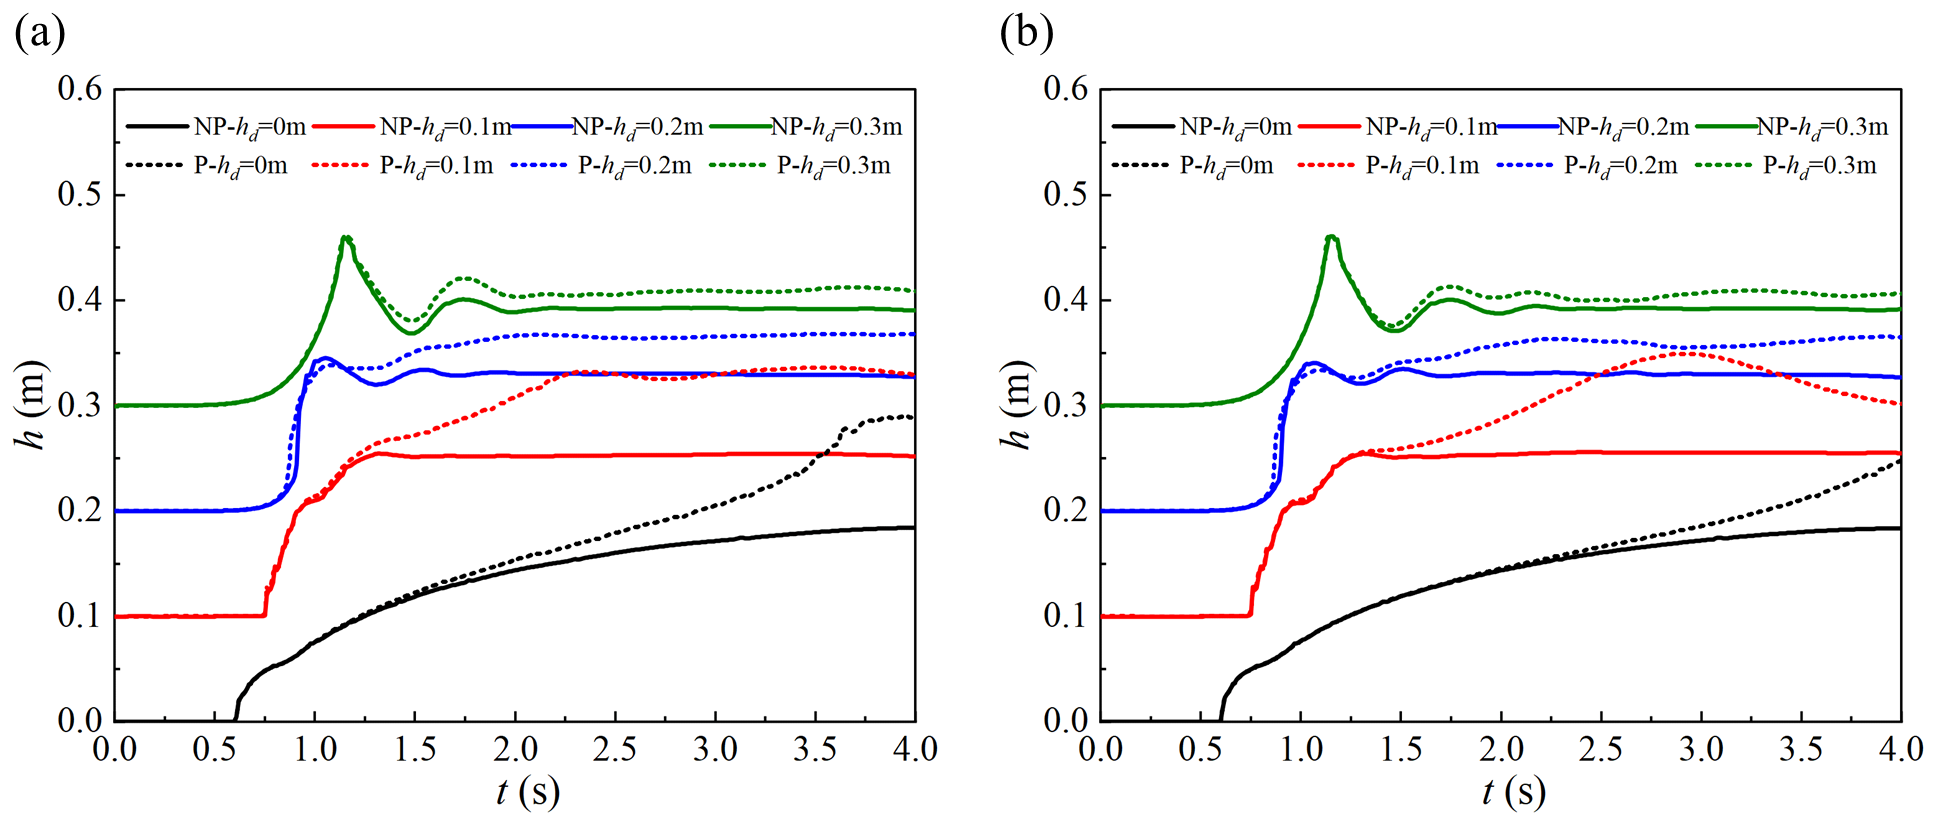
Time-course curve of water-levels at characteristic points upstream of the vegetated area (A) 1-1; (B) 1-2.
With the increase in the downstream channel’s initial water depth (IWD), the surface velocity gradually decreases, and the distribution range of higher velocities also gradually decreases. The reason is that the routed water, after entering the channel, is influenced by the IWD, gradually transferring its kinetic energy to the channel’s initial water. Simultaneously, the water-level of the downstream channel rises, and the potential energy increases, further reducing the water body’s kinetic energy and causing the downstream channel’s flow rate to decrease. The velocity distribution from the foremost to the upstream velocity during the evolution of the dam-break water shows an intermittent distribution rather than a linear change influenced by the IWD of the channel. Without IWD in the downstream channel, the surface velocity shows linear changes, and the velocity distribution’s intermittent characteristics become more pronounced with an increase in IWD. The arrival times of the dam-breaking water to the designated locations under different conditions were 1.05, 1.45, 1.56, and 1.62 s. Thus, with the gradual increase of the IWD in the downstream channel, the arrival time of the dam-breaking water progressively lengthens.
In the vegetated channel, the effect of vegetation is not apparent until the dam-break flow reaches the vegetated area. However, the water-level shows significant congestion after reaching the characteristic point. This congestion occurs because riparian vegetation reduces the lateral effective overland flow area of the channel. Based on the principle of conservation of cross-section velocity, the cross-section’s overland velocity or vertical height adjusts accordingly. Although vegetation alters the overland flow area, its drag force effect slows the velocity in the vegetated area, causing the water-level to rise. Vegetation negatively affects wave formation, with significant waves occurring only at hd = 0.3 m. The pattern of water-level change along the centerline of the river is similar to that along the riverbanks.
The process of water-level change within the vegetated area and at the characteristic points downstream of the vegetated area was explore to further analyze the influence of vegetation and IWD on dam-break water evolution (Figure 5).
Figure 5
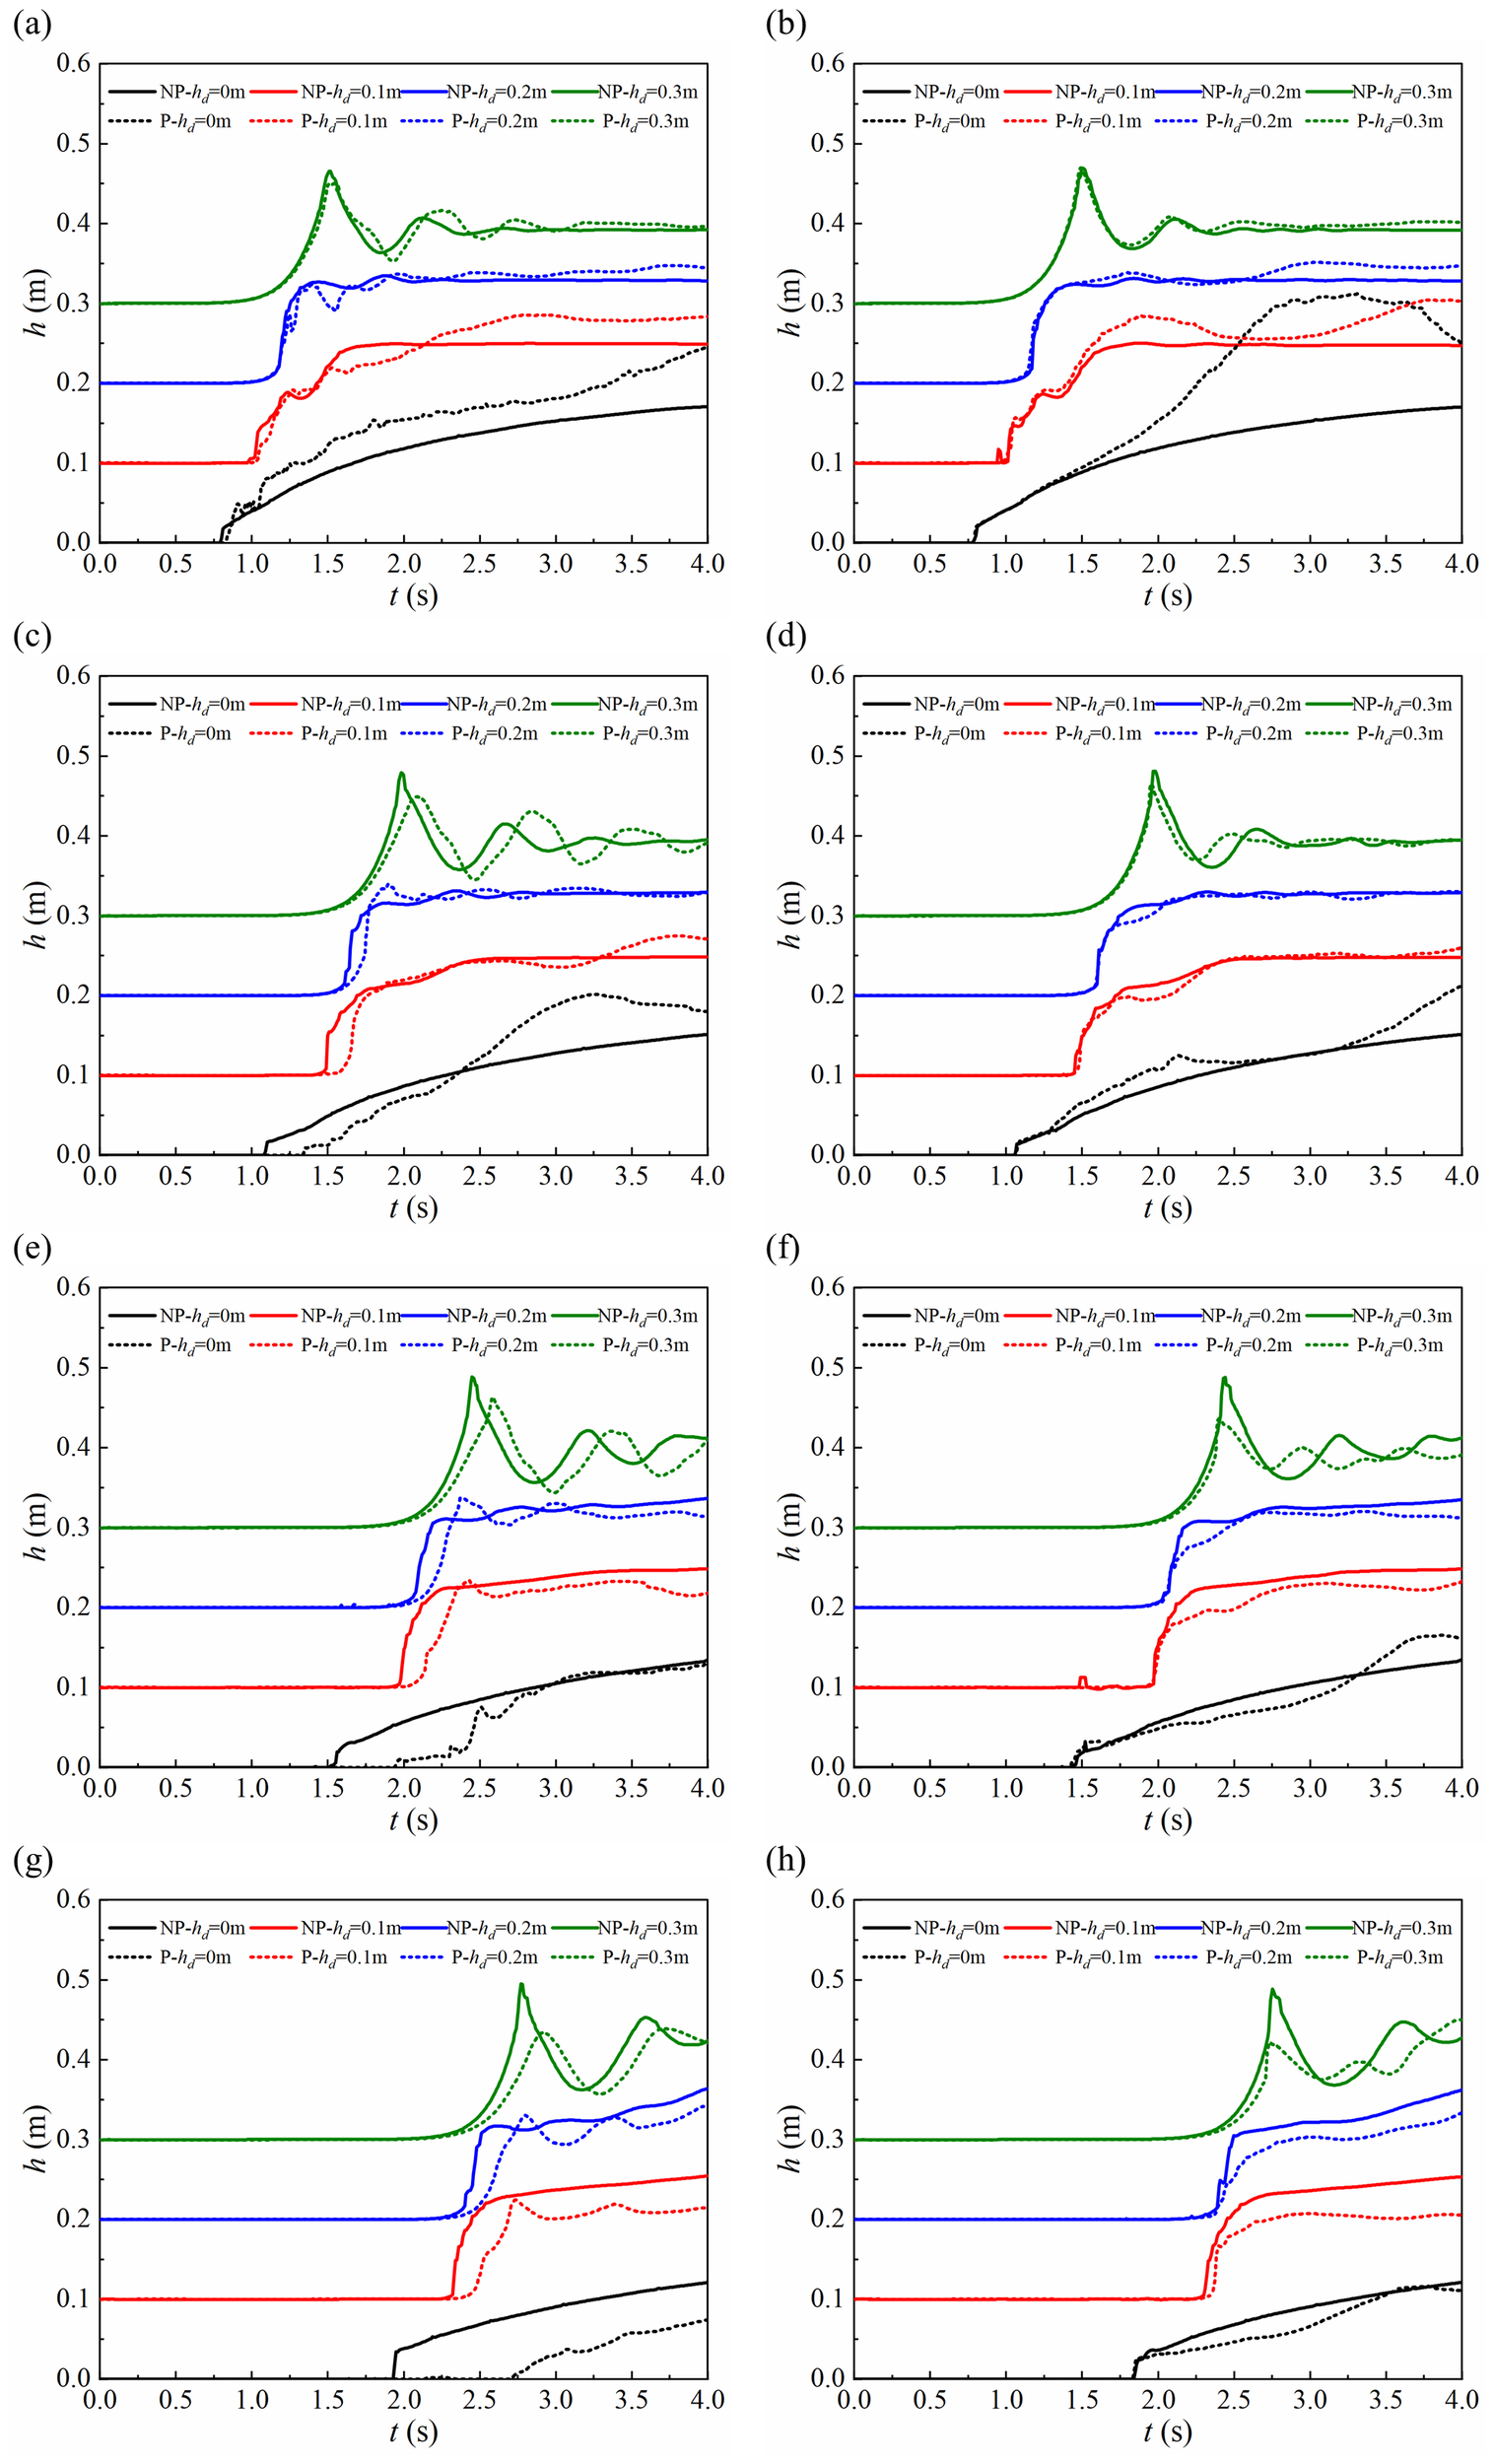
Time-course curves of water-levels in vegetated areas and downstream characterization points, (A) 2-1; (B) 2-2; (C) 3-1; (D) 3-2; (E) 4-1; (F) 4-2; (G) 5-1; (H) 5-2.
The water-level fluctuation law of dam-break flow resembles the patterns observed upstream of the vegetated area once it enters this zone. Both scenarios demonstrate that the dam-break wave intensifies with an increase in the IWD within the channel. A downstream channel water cushion layer of 0.3 m becomes noticeable as the wave peak emerges. As the IWD in the downstream channel increases, the duration required for the dam-break water to reach the characteristic point lengthens while the congestion time shortens. A similar pattern of change manifests along the centerline of the main channel and the vegetated area. Figures 5A, C, E, G reveal that the dam-break wave becomes more pronounced as the characteristic point moves downstream, particularly during the second and third wave peaks following the initial wave. Riparian vegetation also influences the evolution of dam-break waves, especially in the vegetated area. The congestion timing in the vegetated area occurs later than in areas devoid of vegetation, becoming progressively more noticeable as feature points near the downstream. In the main channel, congestion timing is primarily influenced by IWD rather than vegetation, although vegetation primarily affects the amplitude of water-level fluctuations.
3.2 Analysis of dam-break water velocity distribution
The surface velocity of the dam-break flow effectively reflects its motion characteristics. In this work, the surface flow field structure when the water reaches the characteristic position (position 3-2 on the centerline of the river) is analyzed under varying conditions (Figure 6).
Figure 6
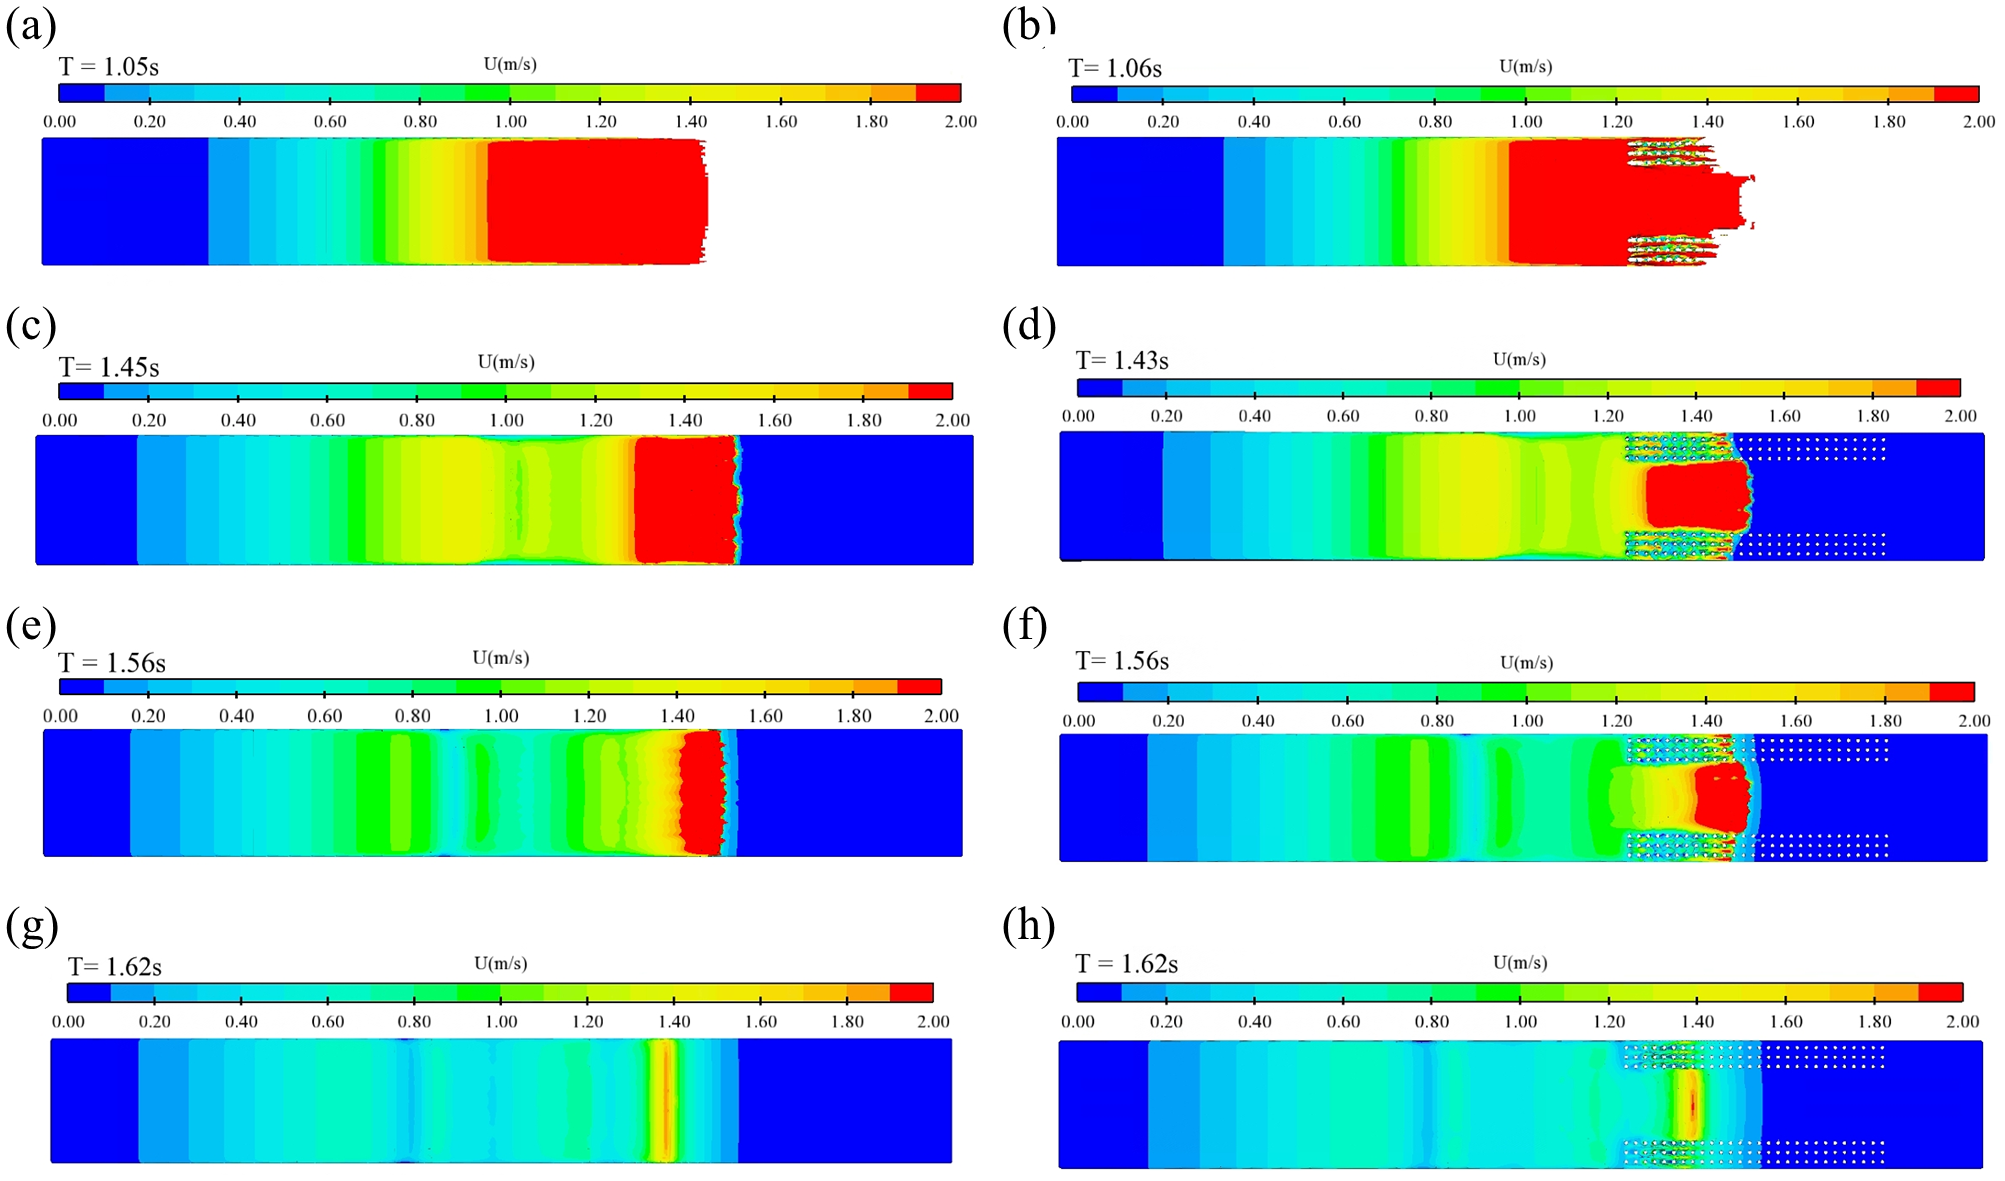
Cloud view of surface velocity distribution as the dam-break water reaches the characteristic lo-cation, (A) case1; (B) case2; (C) case3; (D) case4; (E) case5; (F) case6; (G) case7; (H) case8.
As the channel’s IWD increases, the surface velocity gradually decreases, and the distribution range of higher velocities also decreases. This reduction occurs as the dam-break water flows into the downstream channel, transferring the kinetic energy to the bedding layer. In addition, a rise in water level, influenced by the bedding layer, increases the potential energy, further reducing the water body’s kinetic energy and leading to a gradual decrease in downstream velocity. The velocity distribution from the front end to the upstream during the dam-break water evolution exhibits an intermittent distribution and nonlinear change influenced by the channel’s IWD. In the absence of IWD, the downstream channel displays linear changes in surface velocity. However, with increased IWD, the intermittent characteristics of velocity distribution become more pronounced. The arrival times of the dam-break flow at designated locations under different conditions were 1.05, 1.45, 1.56, and 1.62 s. As the downstream channel’s IWD increases, the dam-break flow’s arrival time correspondingly lengthens.
When vegetation exists on both sides of the downstream channel, a noticeable fluctuation in velocity upstream of the vegetation zone indicates the formation of a dam-break wave upstream. Weak vertical fluctuations occur as the dam-break water enters the vegetation zone, and the velocity distribution exhibits wave-like changes. Vegetation significantly impacts the velocity within the main channel, demonstrating a nearly linear distribution pattern. This effect is due to the vegetation drag force reducing the velocity within the vegetation area, while the horizontal scale wake vortices produced by the vegetation also influence the water, decreasing the velocity while maintaining a certain degree of volatility. Based on the continuity equation, a decrease in velocity within the vegetation area necessitates an increase in velocity in the main channel to balance the cross-sectional flow. Additionally, the water in the channel is significantly affected by congestion. The arrival times of the dam-break flow at specified locations under various conditions are 1.06, 1.43, 1.56, and 1.62 s, indicating that vegetation in the downstream channel does not significantly affect the arrival time of the dam-break flow.
The evolution of dam-break water velocity and the structure of the surface flow field when the first peak of the water reaches the centerline of the river at position 3-2 (the middle of the longitudinal direction of the vegetated area), are analyzed. The rapid increase phase’s final moments in water level are considered the first peak when the first peak is not apparent. The surface velocity distribution is depicted in Figure 7.
Figure 7
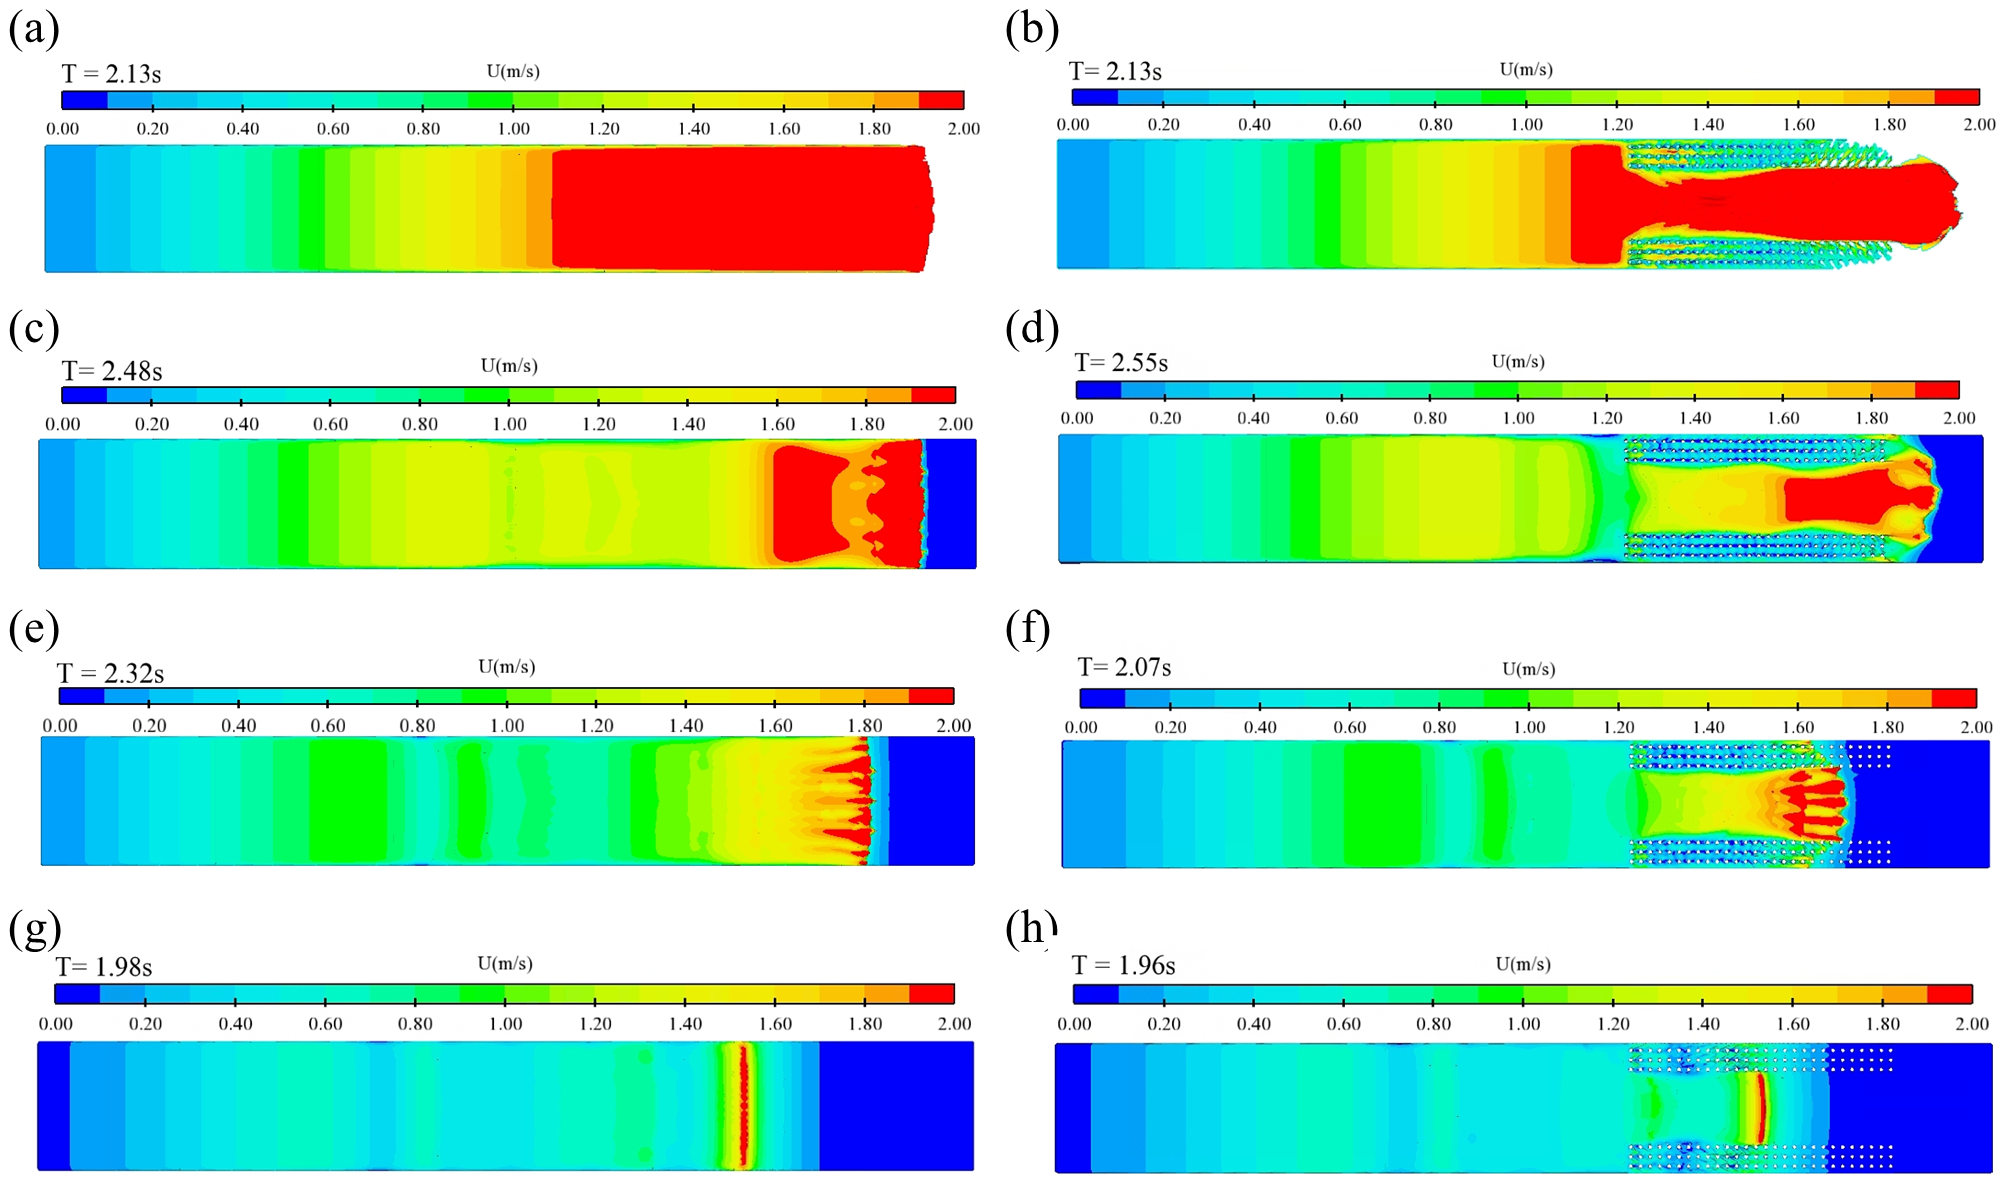
Cloud view of velocity distribution as the first peak reaches the feature location, (A) case1; (B) case2; (C) case3; (D) case4; (E) case5; (F) case6; (G) case7; (H) case8.
When the first peak reaches the characteristic position, some water flows out of the vegetated area. The larger velocity values primarily occur before the first peak, particularly when the downstream channel lacks water. As the IWD gradually increases, the velocity corresponding to the first peak decreases due to the momentum exchange between the downstream water mat and the dam-break water, causing a gradual decrease in longitudinal velocity. The velocity progressively increases from the first peak toward the downstream channel, and the velocity still displays intermittent distribution from the first peak to the upstream reservoir area due to the periodic change of the dam-break wave after the first peak. When vegetation is present in the channel, the observed pattern persists, but the difference is that the velocity distribution in the channel’s center is not uniform and shows a bifurcated distribution. This occurs because the water in the non-vegetated area of the main channel spreads to both sides of the channel after exiting the vegetated area, deflecting the water flow rate.
3.3 Analysis of the temporal characteristics of dam-break water
Based on the preceding analysis, vegetation affects the evolution of dam-break flow, manifesting in variations in the rise and fall times of the dam-break flow within both mainstream and vegetated areas. If the arrival time of the dam-break flow at a measurement point, tsp, in a channel with vegetation exceeds the arrival time at the same location, tsn, without vegetation, vegetation impedes the flow’s evolution at that point. In contrast, a shorter arrival time indicates an accelerating effect on the dam-break flow. The rise time hysteresis coefficient, wst, is introduced to systematically evaluate the effects of vegetation and water depth in the channel substrate on the dam-break water’s evolution characteristics, as calculated in Equation 10.
where tsp is the time at which the dam-break water reaches a gage point in the downstream channel when vegetation is present; tsn is the time at which the dam-break water reaches the same gage point in the downstream channel when vegetation is not present.
If wst > 0, it indicates that vegetation has a stagnant effect on the dam-break water evolution at that measurement point; if wst < 0, it indicates that vegetation accelerates the dam-break water evolution at that measurement point.
The interior and the back side of the vegetated areas were selected to analyze the retardation effect of vegetation in two typical locations:
As shown in Figure 8, the time required for water to reach a fixed position is generally longer when vegetation on both sides of the channel than without vegetation, especially when no water bedding is present in the downstream channel. This indicates that vegetation along the channel margins obstructs the evolution of dam-break water. In contrast, at the channel’s centerline, the arrival time of dam-break flow amid vegetation is less than without vegetation, indicating an accelerating role in the evolution of the dam-break flow from the centerline of the vegetated channel. This phenomenon occurs because the drag force exerted by the vegetation reduces velocity at the edges and increases it in the middle. Further analysis of the rise time hysteresis coefficient across different cases reveals that it is generally positive in the center of the vegetation area, decreasing as the depth of the channel’s bedding layer increases. This reduction reflects a diminishing hysteresis effect of vegetation, closely related to the channel underlayment, which lessens as the underlayment deepens. At the channel’s centerline, vegetation accelerates the evolution of dam-break water, and the effect is minimal with the change of the downstream channel bedding layer.
Figure 8
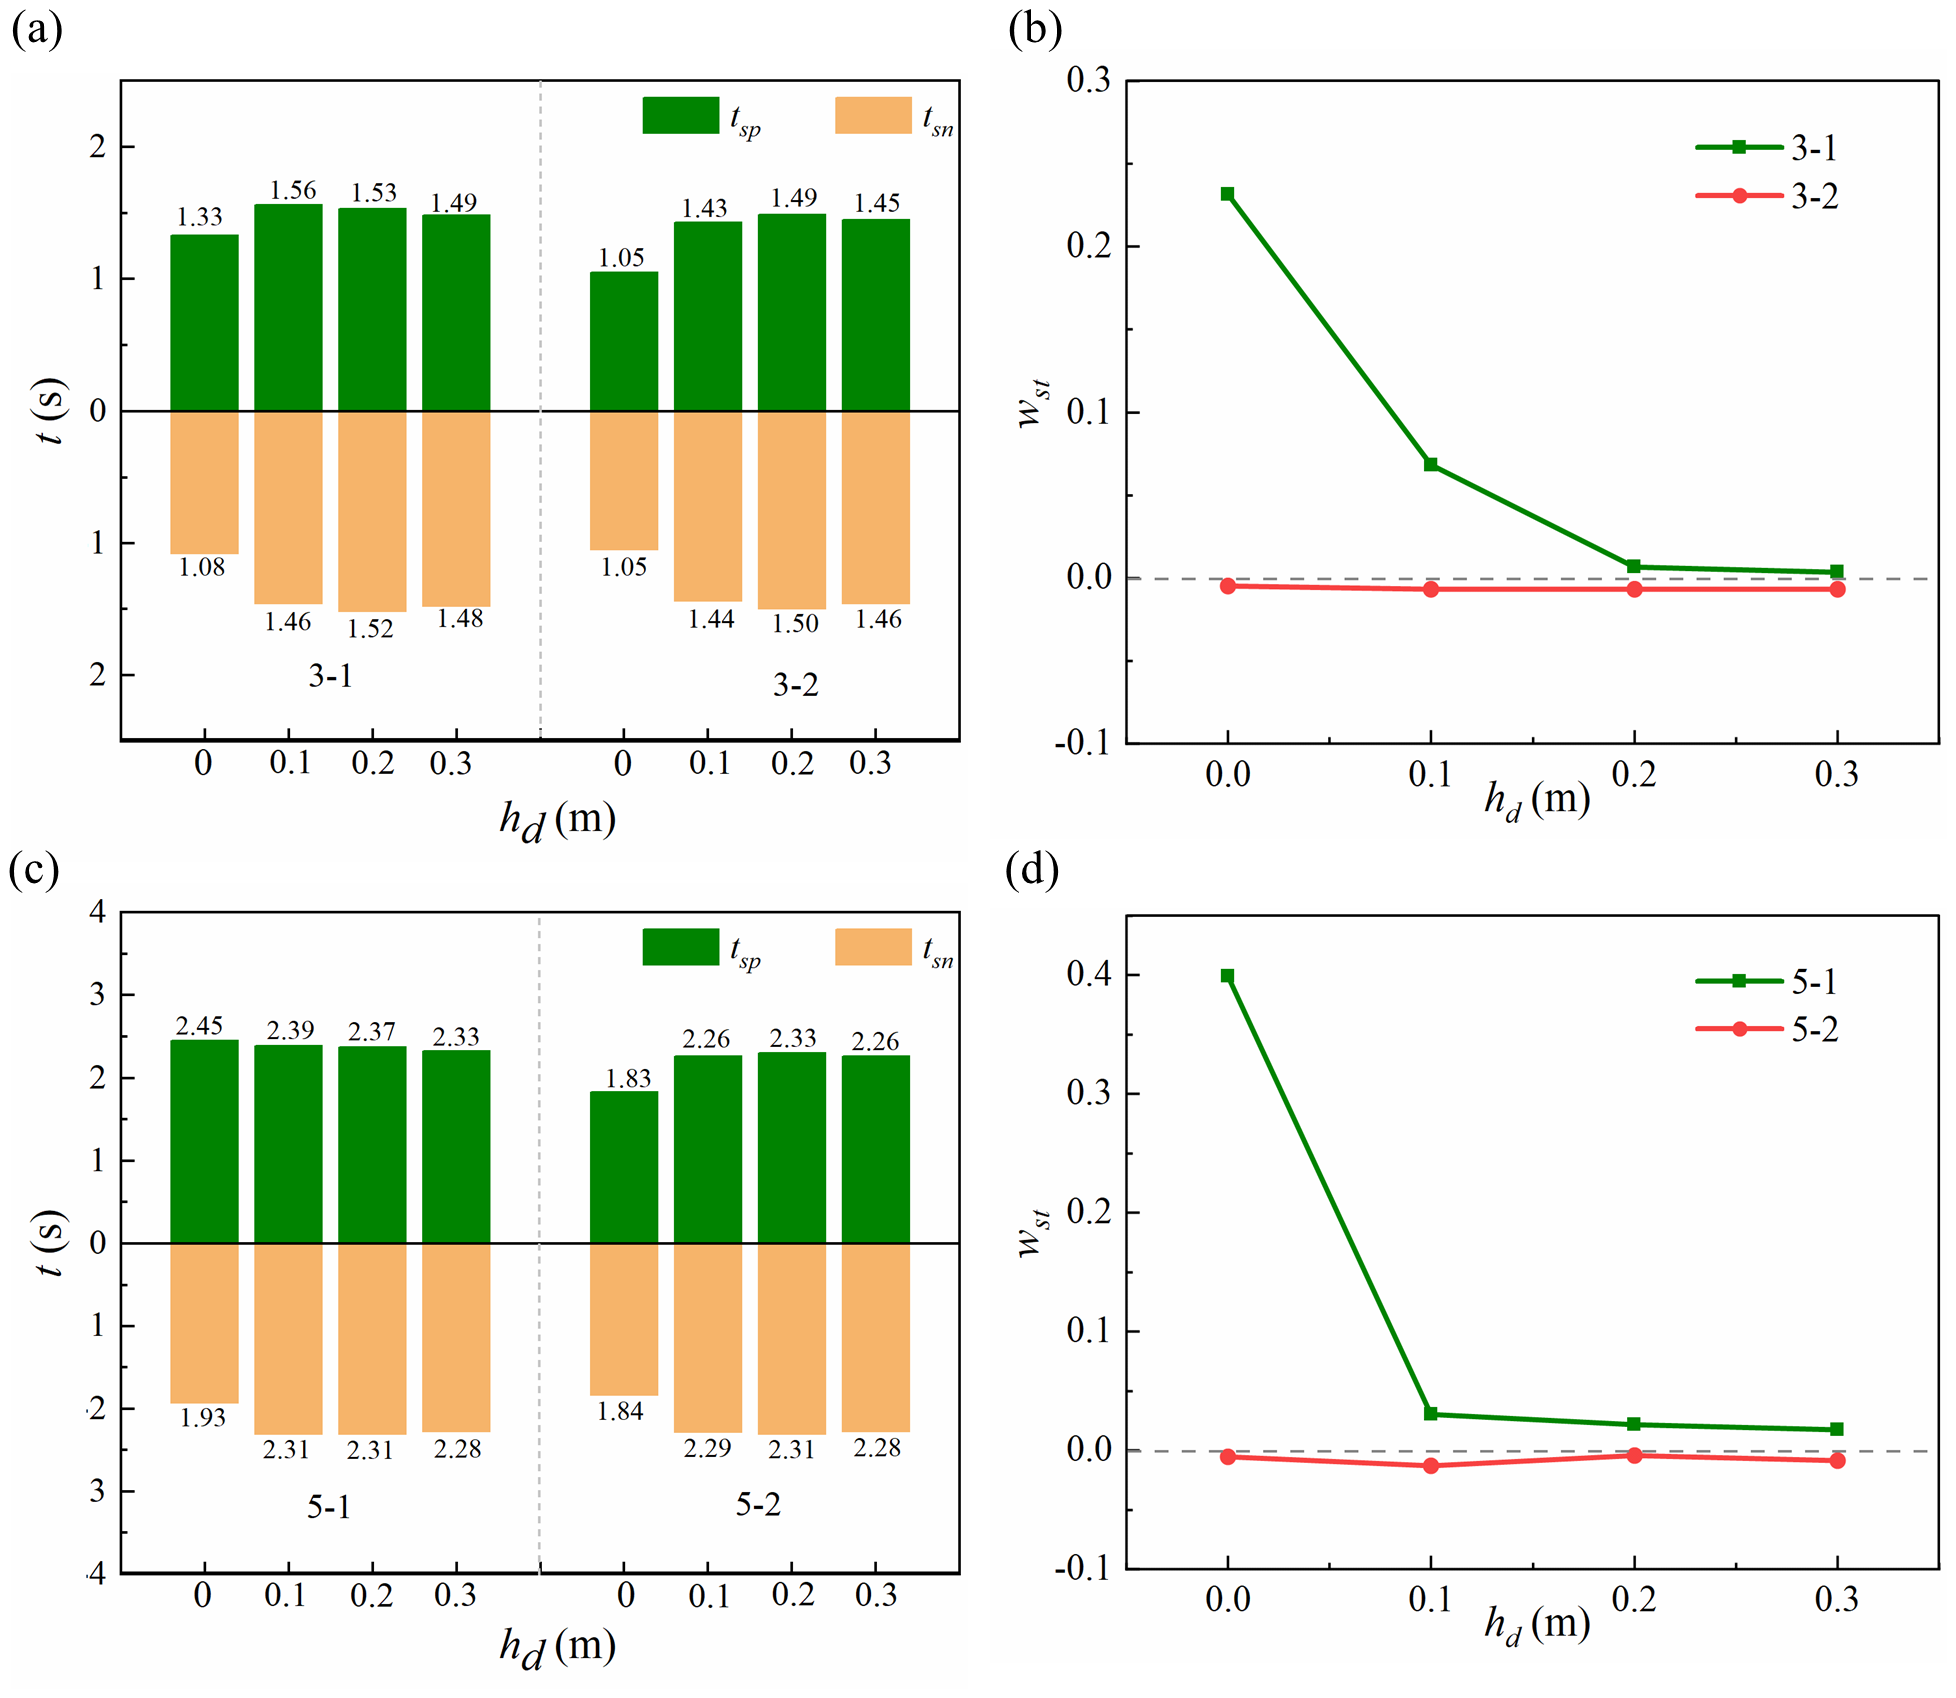
Rise time hysteresis coefficient variation curve, (A) arrival time for 3-1 and 3-2; (B) rise time stopping factor for 3-1 and 3-2; (C) arrival time for 5-1 and 5-2; (D) rise time stopping factor for 5-1 and 5-2.
4 Conclusion
This study employs the RNG k-ϵ turbulence model to characterize the evolution of landslide lake breaching water at varying undercutting depths in a vegetated channel. The conclusions are as follows:
-
1. The water bedding layer substantially affects the evolution of dam-break flow in the downstream channel. As the downstream channel’s IWD increases, the dam-break wave is more likely to form, its amplitude rises, and the time for the rapid congestion of the dam-break flow decreases. Vegetation significantly contributes to congestion in the water-level upstream of the vegetated area and the main channel.
-
2. Surface velocity decreases as the IWD of the downstream channel increases, and the extent of large velocity distribution narrows. When there is no IWD in the downstream channel, the velocity exhibits linear changes. As the IWD in the downstream channel increases, the velocity distribution gradually shows a distinct intermittent pattern.
-
3. Vegetation in the downstream channel slows the evolution of dam-break water in the vegetation zone, and this effect diminishes with increasing IWD in the channel. In contrast, the downstream channel vegetation specifically accelerates the evolution of dam-break water along the centerline of the main channel, and this effect is independent of the lower bedding layer.
This study briefly analyzes the evolutionary process of dam-break flow during the collapse of a landslide lake. However, it does not investigate objects such as sand and gravel carried by the water during the collapse. Therefore, further examination of the evolutionary siltation process in the presence of different types of objects within the water body could be performed subsequently. Although the conclusions of this paper are drawn from a generalized model, they still offer valuable theoretical references for the actual management of landslide lakes.
Statements
Data availability statement
The original contributions presented in the study are included in the article/supplementary material. Further inquiries can be directed to the corresponding author.
Author contributions
GS: Conceptualization, Validation, Writing – original draft, Writing – review & editing. YC: Methodology, Software, Validation, Writing – review & editing. PZ: Formal analysis, Resources, Supervision, Writing – review & editing. HY: Funding acquisition, Supervision, Writing – review & editing.
Funding
The author(s) declare financial support was received for the research, authorship, and/or publication of this article. This research was funded by the Nature Science Foundation of Chongqing City (Grant No. cstc2021jcyj-msxmX1175).
Acknowledgments
The authors appreciate the editor and the reviewers for their constructive suggestions.
Conflict of interest
HY was employed by Chongqing Xike Water Transport Engineering Consulting Co., LTD.
The remaining authors declare that the research was conducted in the absence of any commercial or financial relationships that could be construed as a potential conflict of interest.
Publisher’s note
All claims expressed in this article are solely those of the authors and do not necessarily represent those of their affiliated organizations, or those of the publisher, the editors and the reviewers. Any product that may be evaluated in this article, or claim that may be made by its manufacturer, is not guaranteed or endorsed by the publisher.
References
1
Chanson H. (2009). Application of the method of characteristics to the dam break wave problem. J. Hydraul. Res.47, 41–49. doi: 10.3826/jhr.2009.2865
2
Costa J. E. Schuster R. L. (1988). The formation and failure of natural dams. Geol. Soc Am. Bull.100, 1054–1068. doi: 10.1130/0016-7606(1988)100<1054:TFAFON>2.3.CO;2
3
Dressler R. F. (1952). Hydraulic resistance effect upon the dam-break functions. J. Res. Nat. Bur. Stand.49, 217–225. doi: 10.6028/jres.049.021
4
Hirt C. W. Nichols B. D. (1981). Volume of fluid (VOF) method for the dynamics of free boundaries. J. Comput. Phys.39, 201–225. doi: 10.1016/0021-9991(81)90145-5
5
Hu R. C. Zhang J. M. (2022). Modeling velocity in a compound channel with co-existing emergent and submerged vegetation. Phys. Fluids.34, 105127. doi: 10.1063/5.0121264
6
Hu R. C. Zhang J. M. (2023). Numerical study on the outer bank cell of secondary flow in a U-shaped open channel. Ksce. J. Civ. Eng.27, 1558–1567. doi: 10.1007/s12205-023-2104-7
7
Kang S. Sotiropoulos F. (2011). Flow phenomena and mechanisms in a field-scale experimental meandering channel with a pool-riffle sequence: Insights gained via numerical simulation. J. Geophys. Res.116, F03011. doi: 10.1029/2010JF001814
8
Lauber G. Hager W. H. (1998). Experiments to dam break wave: Horizontal channel. J. Hydraul. Res.36, 291–307. doi: 10.1080/00221689809498620
9
Li S. C. Yang J. Ansell A. (2023). Data-driven reduced-order simulation of dam-break flows in a wetted channel with obstacles. Ocean Eng.287, 115826. doi: 10.1016/j.oceaneng.2023.115826
10
Li S. C. Yang J. He X. (2024). Modeling transient flow dynamics around a bluff body using deep learning techniques. Ocean Eng.295, 116880. doi: 10.1016/j.oceaneng.2024.116880
11
Liu C. Shan Y. Q. He L. Li F. J. Liu X. N. Nepf H. D. (2024). Plant morphology impacts bedload sediment transport. Geophys. Res. Lett.51, e2024GL108800. doi: 10.1029/2024GL108800
12
Liu C. Yan C. H. Sun S. C. Lei J. R. Nepf H. D. Shan Y. Q. (2022). Velocity, turbulence, and sediment deposition in a channel partially filled with a Phragmites australis canopy. Water. Resour. Res.58, e2022WR032381. doi: 10.1029/2022WR032381
13
Liu H. Liu H. J. Guo L. H. Lu S. X. (2017). Experimental study on the dam-break hydrographs at the gate location. J. Ocean Univ. China16, 697–702. doi: 10.1007/s11802-017-3470-x
14
Liu W. J. Wang B. Guo Y. K. Zhang J. M. Chen Y. L. (2020). Experimental investigation on the effects of bed slope and tailwater on dam–break flows. J. Hydrol.590, 125256. doi: 10.1016/j.jhydrol.2020.125256
15
Mungkasi S. Roberts S. G. (2010). A new analytical solution for testing debris avalanches numerical models. Anziam. J.52, 349–363. doi: 10.21914/anziamj.v52i0.3785
16
Nadaoka K. Yagi H. (1998). Shallow-water turbulence modeling and horizontal large-eddy computation of river flow. J. Hydraul. Eng.124, 493–500. doi: 10.1061/(ASCE)0733-9429(1998)124:5(493)
17
Ritter A. (1892). Die Fortpflanzung der Wasserwellen (The propagation of water waves). Z. Verein Deutscher Ingenieure36, 947–954.
18
Seyedashraf O. Mehrabi M. Akhtari A. A. (2018). Novel approach for dam break flow modeling using computational intelligence. J. Hydrol.559, 1028–1038. doi: 10.1016/j.jhydrol.2018.03.001
19
Shan Y. Q. Yan C. H. Liu J. T. Liu C. (2023). Predicting velocity and turbulent kinetic energy inside an emergent Phragmites australis canopy with real morphology. Environ. Fluid. Mech.23, 943–963. doi: 10.1007/s10652-023-09942-0
20
Shen D. Y. Shi Z. M. Peng M. Zhang L. M. Jiang M. Z. (2020). Longevity analysis of landslide dams. Landslides17, 1797–1821. doi: 10.1007/s10346-020-01386-7
21
Shen X. Li R. Cai H. J. Feng J. J. Wan H. (2022). Characteristics of secondary flow and separation zone with different junction angle and flow ratio at river confluences. J. Hydrol.614, 128537. doi: 10.1016/j.jhydrol.2022.128537
22
Soares-Frazão S. Zech Y. (2007). Experimental study of dam-break flow against an isolated obstacle. J. Hydraul. Res.45, 27–36. doi: 10.1080/00221686.2007.9521830
23
Wang B. Chen Y. L. Peng Y. Zhang J. M. Guo Y. K. (2020). Analytical solution of shallow water equations for ideal dam-break flood along a wet-bed slope. J. Hydraul. Eng.146, 06019020. doi: 10.1061/(ASCE)HY.1943-7900.0001683
24
Wang B. Chen Y. L. Wu C. Peng Y. Ma X. Song J. J. (2017). Analytical solution of dam-break flood wave propagation in a dry sloped channel with an irregular–shaped cross-section. J. Hydro-Environ. Res.14, 93–104. doi: 10.1016/j.jher.2016.11.003
25
Whitham G. B. (1955). The effects of hydraulic resistance in the dam-break problem. P. R. Soc A-Math. Phy.227, 399–407. doi: 10.1098/rspa.1955.0019
26
Yakhot V. Orszag S. A. (1986). Renormalization group analysis of turbulence: I. Basic Theory. J. Sci. Comput.1, 3–51. doi: 10.1007/BF01061452
27
Yang S.l. Yang W. L. Qin S. Q. Li Q. (2019). Comparative study on calculation methods of dam-break wave. J. Hydraul. Res.57, 702–714. doi: 10.1080/00221686.2018.1494057
28
Yang S. L. Yang W. L. Zhang C. J. Qin S. L. Wei K. Zhang J. R. (2022). Experimental and numerical study on the evolution of wave front profile of dam–break waves. Ocean. Eng.247, 110681. doi: 10.1016/j.oceaneng.2022.110681
29
Ye Z. T. Zhao X. Z. (2017). Investigation of water–water interface in dam break flow with a wet bed. J. Hydrol.548, 104–120. doi: 10.1016/j.jhydrol.2017.02.055
30
Zhang M. L. (2013). Numerical simulation of dam break water and bottom bed deformation with plant influence. Chin. Soc. Ocean Eng., 293–300.
31
Zhang J. M. Hu R. C. (2023). Turbulence structure in an experimental compound channel with varying coverage of riparian vegetation on the floodplain. J. Hydrol.620, 129378. doi: 10.1016/j.jhydrol.2023.129378
32
Zhang M. L. Zhang Y. P. Hao Z. N. Liu W. W. You Y. B. (2013). “Numerical simulation of dam break water and bottom bed deformation with plant influence” in. The Proceedings of the 16th China Ocean Engineering Symposium, ed. Chinese Society of Ocean Engineering (China Ocean Press), 1099–1106.
33
Zhong Q. M. Wang L. Chen S. S. Chen Z. Y. Shan Y. B. Zhang Q. et al . (2021). Breaches of embankment and landslide dams state of the art review. Earth-Sci. Rev.216, 103597. doi: 10.1016/j.earscirev.2021.103597
Summary
Keywords
riparian vegetation, dam-break wave, velocity, initial water depth, water-level
Citation
Song G, Chen Y, Zhao P and Yuan H (2024) Numerical investigation on the evolutionary characteristics of landslide dam-break flow in a wet-bed channel with riparian vegetation. Front. Mar. Sci. 11:1462760. doi: 10.3389/fmars.2024.1462760
Received
10 July 2024
Accepted
06 August 2024
Published
27 August 2024
Volume
11 - 2024
Edited by
Chao Liu, Sichuan University, China
Reviewed by
Shicheng Li, Royal Institute of Technology, Sweden
Ruidi Bai, Sichuan University, China
Haonan Peng, Paul Scherrer Institut (PSI), in collaboration with reviewer RB
Updates
Copyright
© 2024 Song, Chen, Zhao and Yuan.
This is an open-access article distributed under the terms of the Creative Commons Attribution License (CC BY). The use, distribution or reproduction in other forums is permitted, provided the original author(s) and the copyright owner(s) are credited and that the original publication in this journal is cited, in accordance with accepted academic practice. No use, distribution or reproduction is permitted which does not comply with these terms.
*Correspondence: Gangyong Song, 714288053@qq.com
Disclaimer
All claims expressed in this article are solely those of the authors and do not necessarily represent those of their affiliated organizations, or those of the publisher, the editors and the reviewers. Any product that may be evaluated in this article or claim that may be made by its manufacturer is not guaranteed or endorsed by the publisher.