 Xin Lin1,2
 Xiao Chen1,2
 Fajin Chen1,2
 Guangzhe Jin1,2*
 Chao Wang1,2
 Machendiranathan Mayakrishnan1,2
 Ziyang Shi1,2
 Xiangcheng Si1,2
- 1Key Laboratory for Coastal Ocean Variation and Disaster Prediction, College of Ocean and Meteorology, Guangdong Ocean University, Zhanjiang, China
- 2Key Laboratory of Climate, Resources and Environment in Continental Shelf Sea and Deep Sea of Department of Education of Guangdong Province, Guangdong Ocean University, Zhanjiang, China
The spatial and temporal variation of submarine groundwater discharge (SGD) has been a topic of interest for researchers in recent years. However, the study of SGD is limited within the scope of Zhanjiang Bay. The Zhanjiang Bay is located in western Guangdong Province, known for its high temperatures and typhoon vulnerability. The present study examined the fluctuation patterns of seawater 222Rn in Zhanjiang Bay during the period from June 2021 to March 2022. This investigation employs the 222Rn tracing technique to establish a mass balance model to compute the SGD rate, and assess the significance of SGD in translocating nutrients into the bay. We conducted a four-month sampling, observing the differences between the rainy and dry seasons. Precipitation exerts a significant influence on the seasonal variations of SGD. The SGD rates of Zhanjiang Bay ranged from 7.14 to 10.75 cm·d-1 in the dry season and from 13.38 to 14.61 cm·d-1 in the rainy season. SGD-derived nutrients also exhibited seasonal fluctuations, the annual input of nutrients it supplies may be comparable to the quantity delivered by rivers, which significantly impacted the trophic status of the bay.
1 Introduction
Submarine groundwater discharge (SGD) is usually defined as all the fluids moving from the seafloor at the edges of continents and islands to the coastal ocean (Burnett et al., 2003; Moore, 2010). These fluids vary in composition and are influenced by diverse factors (Burnett and Dulaiova, 2003; Garcia-Orellana et al., 2021). It has a significant impact on the release of water from coastal regions, which is the most significant process of freshwater transfer aside from river transport and also one of the key interactions between land and sea in coastal areas (Burnett and Dulaiova, 2003; Burnett et al., 2006; Savatier and Rocha, 2021). The two components of SGD are fresh submarine groundwater (SFGD) and recirculating saline groundwater (RSGD). SFGD is driven by hydraulic gradients in coastal aquifers, which occur as long as the water table remains above sea level. SFGD is a key part of SGD and influences the movement of chemicals between land and ocean, and is affected by geological, hydrological, and climate factors (Robinson et al., 2018). RSGD is driven by tidal pumping and wave setup (Santos et al., 2012). The seawater infiltrates the beach face at flood tide and discharges at ebb tide (Robinson et al., 2007; Santos et al., 2010a). RSGD forces seawater to flow through the sediment-water interface and exchange with pore water via tidal or wave pumping (Zhu et al., 2019).
The invisible groundwater transport typically contains higher levels of nutrients, trace metals, and greenhouse gases compared to the visible riverine surface waters (Rengarajan and Sarma, 2015). According to past studies, SGD-derived nutrients can boost primary productivity, fish yield (Liu et al., 2021a), and coral calcification (Silbiger et al., 2020). This enhanced productivity can have significant ecological implications, including changes in species composition, and increased biomass production. However, they are also linked to eutrophication (Valiela et al., 1990; Dulaiova et al., 2010; Liu et al., 2021b), algal blooms (LaRoche et al., 1997; Charette and Buesseler, 2004), and hypoxia (Dai et al., 2021; Santos et al., 2021) in coastal waters. Additionally, SGD contains excess carbon, but there is limited knowledge of the interaction between nutrients and carbon after it enters the oceans (Wang, 2017). Therefore, understanding the role of SGD in supporting primary productivity is essential for predicting ecosystem responses to environmental change (Liu et al., 2021a). Hence, the measurement of SGD holds immense value in determining the state of coastal ecosystems and their susceptibility.
The spatial and temporal variation of SGD has recently become a topic of interest for researchers. Studies have shown that seasonal changes can significantly affect the magnitude and direction of SGD, leading to variations in the distribution of nutrients and other substances discharged into coastal waters (Cho et al., 2021). The seasonal impact on SGD depends on several factors, including the intensity and duration of rainfall, the groundwater source’s location and depth, and the specific characteristics of the coastal aquifer system. During the rainy season, heavy rainfall can induce fluctuations in water levels, pressure gradients, and hydraulic conductivity within the aquifer system, leading to fluctuations in SGD rates (Wang et al., 2020a). These changes can also affect the quality of groundwater discharged into coastal waters, thereby causing variations in salinity, nutrient enrichment, or contamination (Taniguchi et al., 2002; Santos et al., 2021). Therefore, a comprehensive understanding of the spatial and temporal variation of SGD is crucial for effective protecting of near-shore ecosystems.
Natural isotopes of radium (223Ra, 224Ra, 226Ra, 228Ra) and radon isotope (222Rn) have been used as a tracer for SGD (Cable et al., 1996; Porcelli and Swarzenski, 2003; Savatier and Rocha, 2021). The use of natural tracers depends on the concentration of tracers in the sediment pore water being higher than that in the receiving water, these tracers are introduced into the water column when the groundwater permeates and is discharged from the sediment (Tait et al., 2013). 222Rn is a short-lived radioactive isotope with a half-life of 3.8 days, which aligns with the temporal scales of many coastal processes (Tait et al., 2013). It is derived from the decay of uranium and thorium radioisotopes, which are commonly found in a wide range of rocks, presenting in much higher concentrations in groundwater than in surface flow (Ellins et al., 1990; Lamontagne et al., 2008). Besides, it possesses conservative chemical properties (Burnett et al., 2003; Yuan et al., 2015; Zhang et al., 2016). Currently, 222Rn is extensively utilized in tracking land-ocean interactions and determining the mixing rate, apparent age or residence time of inter-oceanic and offshore water (Burnett and Dulaiova, 2003; Wang, 2017; Cho et al., 2021; Murgulet et al., 2022). It is suitable for sites within a few kilometers in size (Hosono et al., 2012). Considering tidal effects, sediment diffusion, river inputs, atmospheric escape, radioactive decay, and mixing with low-concentration near-shore waters, SGD fluxes can be estimated by converting 222Rn activities (Wang et al., 2019). By utilizing radon isotopes as a tracer for SGD, we can gain valuable insights into this complex process and its effects on coastal ecosystems.
In China, previous studies of SGD mainly focused on the estuary of the Yellow River, Yangtze River, and Pearl River; there are few papers related to Zhanjiang Bay (Liu and Guo, 2014). In this study, we aimed to contribute to the current understanding in this research, concerning the influence of submarine groundwater discharge on nutrient alterations in small bays where groundwater is abundant but surface water is scarce. Hence, the present study aims to explore how SGD and nutrient levels correlate the rainy and dry seasons. Shedding light on the importance of understanding SGD dynamics in both the dry and rainy seasons using the 222Rn isotope.
2 Materials and methods
2.1 Study area
Zhanjiang Bay is an important harbor in southern China with a 467.1 km coastline, situated in the northeastern part of the Leizhou Peninsula (Yu et al., 2014). It is a semi-enclosed bay. The coastline is characterized by its intricate and sinuous nature, encompassing an extensive expanse of tidal flats, predominantly featuring sandy shores. The bottom of the bay is widely covered with sandy sediments. The bay covers an area of approximately 172 km2 and has a limited outlet that connects it to the South China Sea. The Suixi River, covering 926.6 km2, is a vital source of water for the bay. It flows at an average speed of 0.25 m/s, and its annual runoff is 1.407×10⁹ m3 (Hao et al., 2022). The estuary can be found nestled between the Nansan and Donghai Islands, measuring about 2.2 km at its narrowest point. The bay has varying water depths, with the deepest point being over 30 m and the shallowest point only 2 m (Han et al., 2021). Zhanjiang Bay represents a classic example of a drowned-valley tidal inlet in this region, characterized by its relatively level terrain (Wang et al., 2021). The bay features irregular semi-diurnal tides (Li et al., 2011). The average tidal range of Zhanjiang Bay is about 3 m. Zhanjiang Bay faces several environmental challenges such as heavy metal pollution and intensive mariculture activities. These activities changes the amount of terrestrial nitrogen in the watershed, potentially impacting the bay’s ecosystem for years (Shi et al., 2020). The study area has a tropical monsoon climate with warm water year-round. Thunderstorms and typhoons frequently occur, and the majority of rainfall concentrates between June and September (Hao et al., 2022).
2.2 Sampling and analytical methods
We conducted fieldwork in the study areas during the rainy season (June and September) and the dry season (December 2021 and March 2022) to collect and measure samples. We set up a total of 19 seawater sampling stations (ZJ1 to ZJ19) and 11 well water sampling stations (GW0 to GW10). To gain a comprehensive understanding of SGD, the research area is divided as four specific zones (Figure 1). Zones ZJ1 to ZJ5, which are vulnerable to runoff, are classified as the estuary zone. Zones ZJ6 to ZJ12, which feature narrow terrain, are classified as the central bay. Zones ZJ13 to ZJ17, the most spacious areas within the bay, are classified as the southern bay. Lastly, Zones ZJ18 and ZJ19 are classified as the outer sea zones due to their location outside the bay. Using the ArcGIS software, the calculated area of the estuarine zone during the study periods is 1.722×10⁷ m2, the central bay is 6.200×10⁷ m2, the southern bay is 1.088×10⁸ m2, and the whole study area of Zhanjiang Bay is 1.880×10⁸ m2.
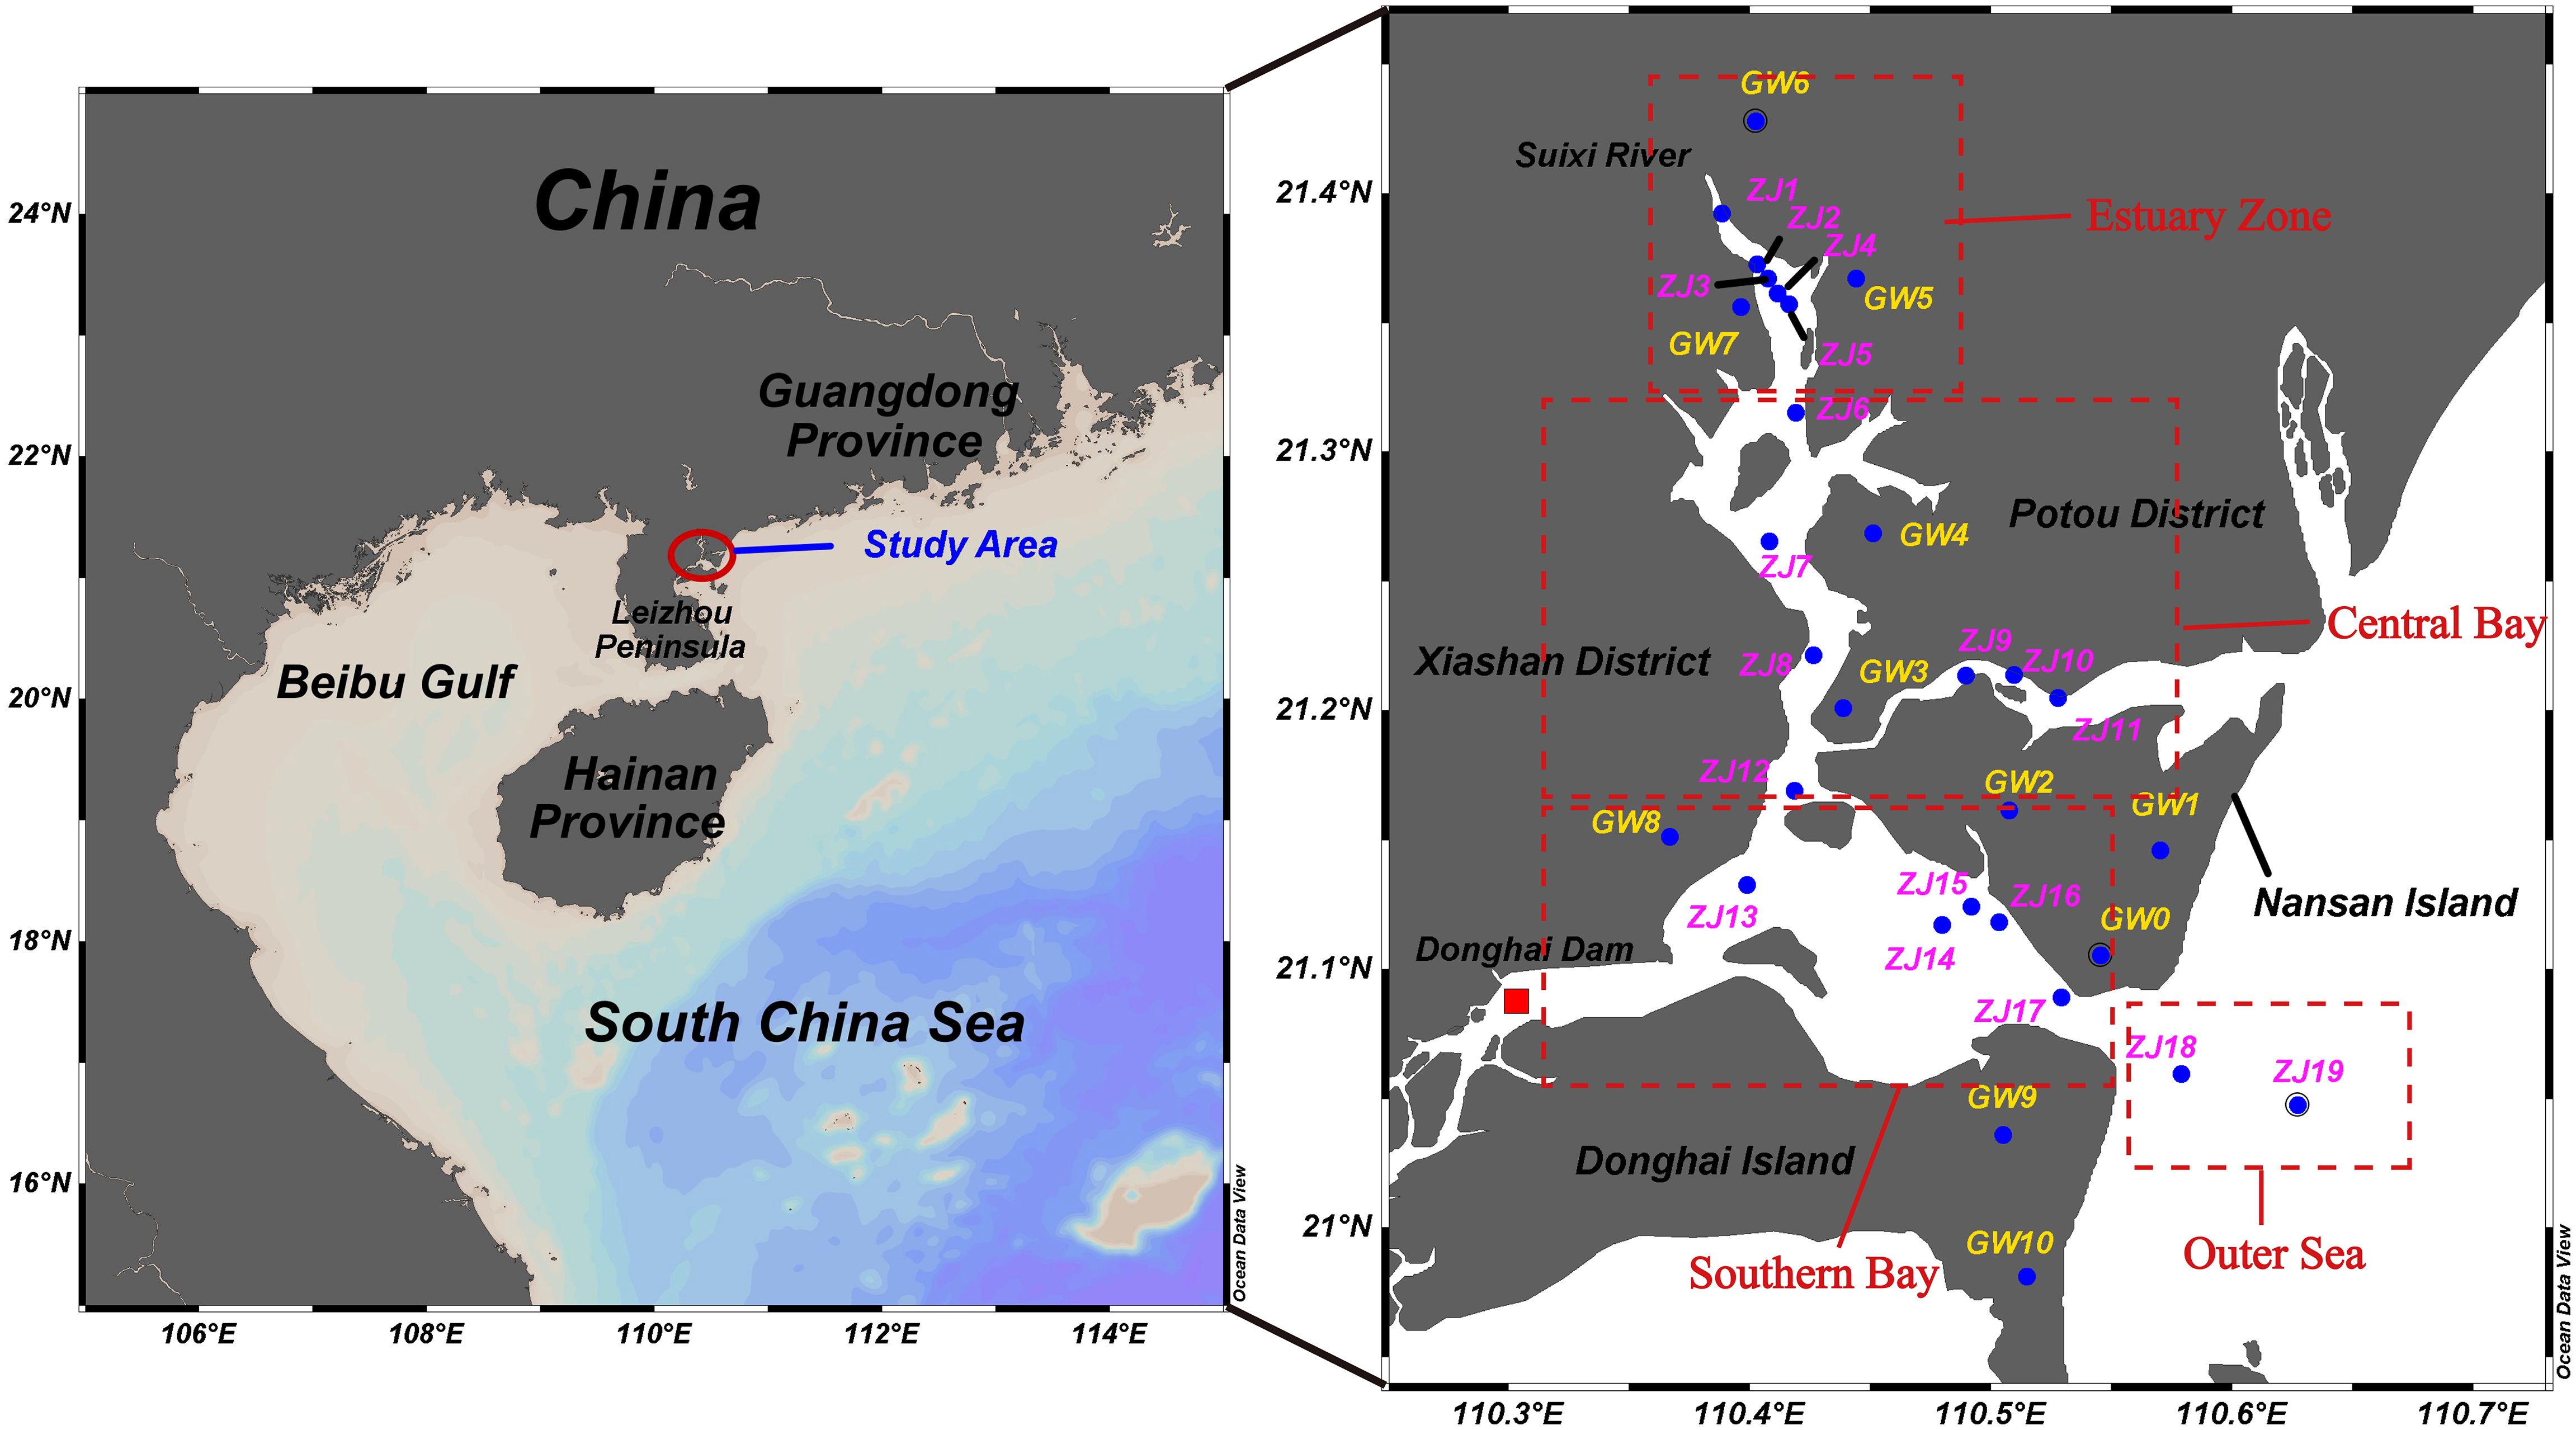
Figure 1. Study area and the sample locations in Zhanjiang Bay (ZJ1-ZJ19 represent seawater sampling sites, while GW0-GW9 represent groundwater sampling sites. A red dashed line box is used to delineate the four areas within the bay).
The measurement of 222Rn concentration was carried out using the alpha energy spectrum radon gas detector RAD7 (Durridge Inc.), which is equipped with the RAD7 H2O accessories. The detection technology of this system involves sending airflow into a radon monitor, that collects and measures the α-emitted daughters 214Po and 218Po to determine the concentrations of 222Rn (Zhang et al., 2016). After placing the sample in a 250mL sample bottle and connecting it to the instrument, it takes approximately 30 minutes for each sample. The laboratory is equipped with two machines, enabling us to measure two samples simultaneously.
Nutrient samples were filtered through 0.45 μm acetate membranes, and then the filtered water samples were stored in polyethylene bottles that had been soaked in 30% hydrochloric acid for 24 hours. Before the measurements, nutrient samples were frozen at −20°C. Nutrient levels were assessed utilizing a San++ Continuous Flow Analyzer (Skalar, The Netherlands), which uses flow injection to determine nutrient concentrations. The detection limits for both NO2- and NO3- were 0.1 μmol·L-1, and for both dissolved inorganic phosphorus (DIP) and dissolved silicate (DSi), they were 0.03 μmol·L-1 (Chen et al., 2022a). The determination of NH4+ was carried out using the sodium hypochlorite oxidation method, with a detection limit of 0.03 μmol·L-1 (Wang et al., 2022b).
Sediment samples were collected from each sampling site using a grabber mud collector for laboratory sediment incubation. The sediment samples were weighed to 200 g and placed into 1000 mL stoppered glass bottles at each station. Additionally, 600 mL of prepared artificial seawater was added to each bottle. These bottles were then placed in a shaker and incubated at 30 rpm for 4 weeks. The incubation continued until the sediment’s pore water radon activity reached equilibrium with the water overlying the sediment (Burnett and Dulaiova, 2003; Chanyotha et al., 2016; Lee and Ko, 2021). A silicone tube was submerged in the prepared artificial seawater and 250 mL of samples were taken through the overflow method. Radon activity in the overlying water was measured by the RAD7 radon meter.
2.3 Radon mass balance model
The levels of 222Rn in the estuary can be attributed to the equilibrium between its sources and sinks. In semi-enclosed bays, the primary sources of 222Rn are sediment diffusion, the decay of the parent 226Ra, and river input. The main losses occur primarily through atmospheric escape, the decay of 222Rn, and seawater mixing losses. To determine the 222Rn flux caused by submarine groundwater discharge (SGD) input at Zhanjiang Bay, we applied a mass balance model of 222Rn. This model was previously utilized in the tropical estuary and lake settings, as described by (Santos et al., 2010a) and (Luo et al., 2016), which is denoted as Equation 1 (Santos et al., 2010b; Luo et al., 2016).
Where, is the activity of 222Rn in groundwater, which is calculated by the average activities of 222Rn in wells. They are 6044 Bq·m-3, 8270 Bq·m-3, 7500 Bq·m-3, and 7483 Bq·m-3 in March, June, September and December, respectively. is the discharge of submarine groundwater (m3·d-1), namely SGD flux. is the 222Rn flux of sediment diffusion (Bq·d-1), V is the volume of bay water (m3), CRa is the 226Ra activity (Bq·m-3) in groundwater, λ222 is the 222Rn decay constant (d-1), and its value is 0.181d-1. Friv is the 222Rn flux input by river water (Bq·d-1), Fin is the 222Rn flux input at high tide (Bq·d-1), Fout is the 222Rn flux output at low tide (Bq·d-1), and Fmix is the 222Rn flux (Bq·d-1) lost by seawater mixing. Fatm is the 222Rn flux (Bq·d-1) lost by atmospheric escape, and Cs is the 222Rn activity (Bq·m-3) in bay water.
2.3.1 Gain of radon
Sediment diffusion flux is calculated according to the Equations 2–5 (Ullman and Aller, 1982; Schulz, 2000; Tse and Jiao, 2008):
Where Ds is the diffusion coefficient of 222Rn in sediment, is the equilibrium activity released by radium into the sediment (Bq·m-3), which is determined by sediment incubation in section 2.2. Dm is the diffusion coefficient of 222Rn in water, ∅ is the sediment tortuosity, n is the sediment porosity, AS is the area of each Zhanjiang Bay partition, and T is the water temperature.
Numerous factors have an impact on the land runoff input flux in Zhanjiang Bay. These factors include but are not limited to the input of the alluvial zone, the sediment diffusion of riverbed, the decay of river water 222Rn, the atmospheric escape, and the input of river tributaries. According to Santos et al. (2010b), the impact of the alluvial zone input and the riverbed sediment diffusion input flux is commonly thought to be insignificant, by a factor of less than two orders of magnitude. Since there is no tributary input in the selected reach, and the inlet time of water at the measuring station is far less than the half-life of 222Rn, this paper mainly considers the river input flux after atmospheric escape, and the calculation formula is as the Equation 6 (Stellato et al., 2008):
Where is the activity of 222Rn in the middle of the river (Bq·m-3), S is the area from the measuring point to the estuary (m2), x is the length from the measuring point to the estuary (m), H is the average depth of the measured reach (m), and v is the wind speed above the river (m·s-1).
The input due to tides is calculated by the Equation 7:
Where ht+Δt-ht (m)is the water level difference caused by tides, We regard it as the maximum tidal range in Zhanjiang Bay; b is the return factor, that is, the ratio of the ebb and flood water volume to the tidal volume in the bay (Cave and Henry, 2011). In this study, we approximate it as the average salinity of surface seawater divided by the near-shore salinity, which is determined by the average salinity of stations Z18 and Z19. is the 222Rn activity near-shore seawater. Given the low radon activity levels in the near-shore waters, we treat the radon activity as negligible, effectively assuming it to be zero for the purposes of this study.
2.3.2 Loss of radon
The flux of seawater mixing loss is based on the Equation 8 (Stellato et al., 2008):
In the formula, is the 222Rn activity of near-shore seawater. The mean value of radon activity in the near-shore area is selected; is the water renewal rate, according to Shi et al. (2020) study, whereas normal circumstances, the water renewal rate stands at 12.0 d-1 and the average water depth in Zhanjiang Bay is 10 m. Although the water renewal time may vary between the dry season and the rainy season, considering the minimal impact of seawater mixing in the estuary region, this particular element has been excluded from the estuary SGD process.
The flux of gas escape was calculated according to Equations 9, 10 (Merlivat and Memery, 1983; Corbett et al., 1998; Tse and Jiao, 2008; Zhang et al., 2016):
where κ is the gas exchange coefficient, which is 5.17 in this study. α is the water-gas exchange coefficient of 222Rn, and is the radon activity above seawater.
The tide-induced output is calculated by the Equation 11:
3 Result
3.1 Radon activities in Zhanjiang Bay
The average 222Rn concentrations of the water in the bay during the year are recorded as 169 Bq·m-3, 231 Bq·m-3, 179 Bq·m-3, and 155Bq·m-3 in spring, summer, autumn and winter, respectively. Classify June and September as the rainy seasons, and December and March as the dry seasons, in Zhanjiang Bay. During the dry season, high levels of 222Rn activity are observed from ZJ9 to ZJ11, ranging from 80-360 Bq·m-3, and the mean value is 158 Bq·m-3. Based on the four seasonal samplings, 222Rn activities in the rainy season exhibits a decreasing trend as one moved from north to south. Conversely, during the dry season, a horizontal trend is observed throughout the entire bay. Moreover, the 222Rn activities during the dry season displays an east-high and west-low trend, with a vertical north-low and south-high trend observed in the entire bay (Figure 2). Low levels of 222Rn activity are observed between station ZJ8 and station ZJ12, ranging from 38~300 Bq·m-3 and the mean value is 142 Bq·m-3 in March and December.
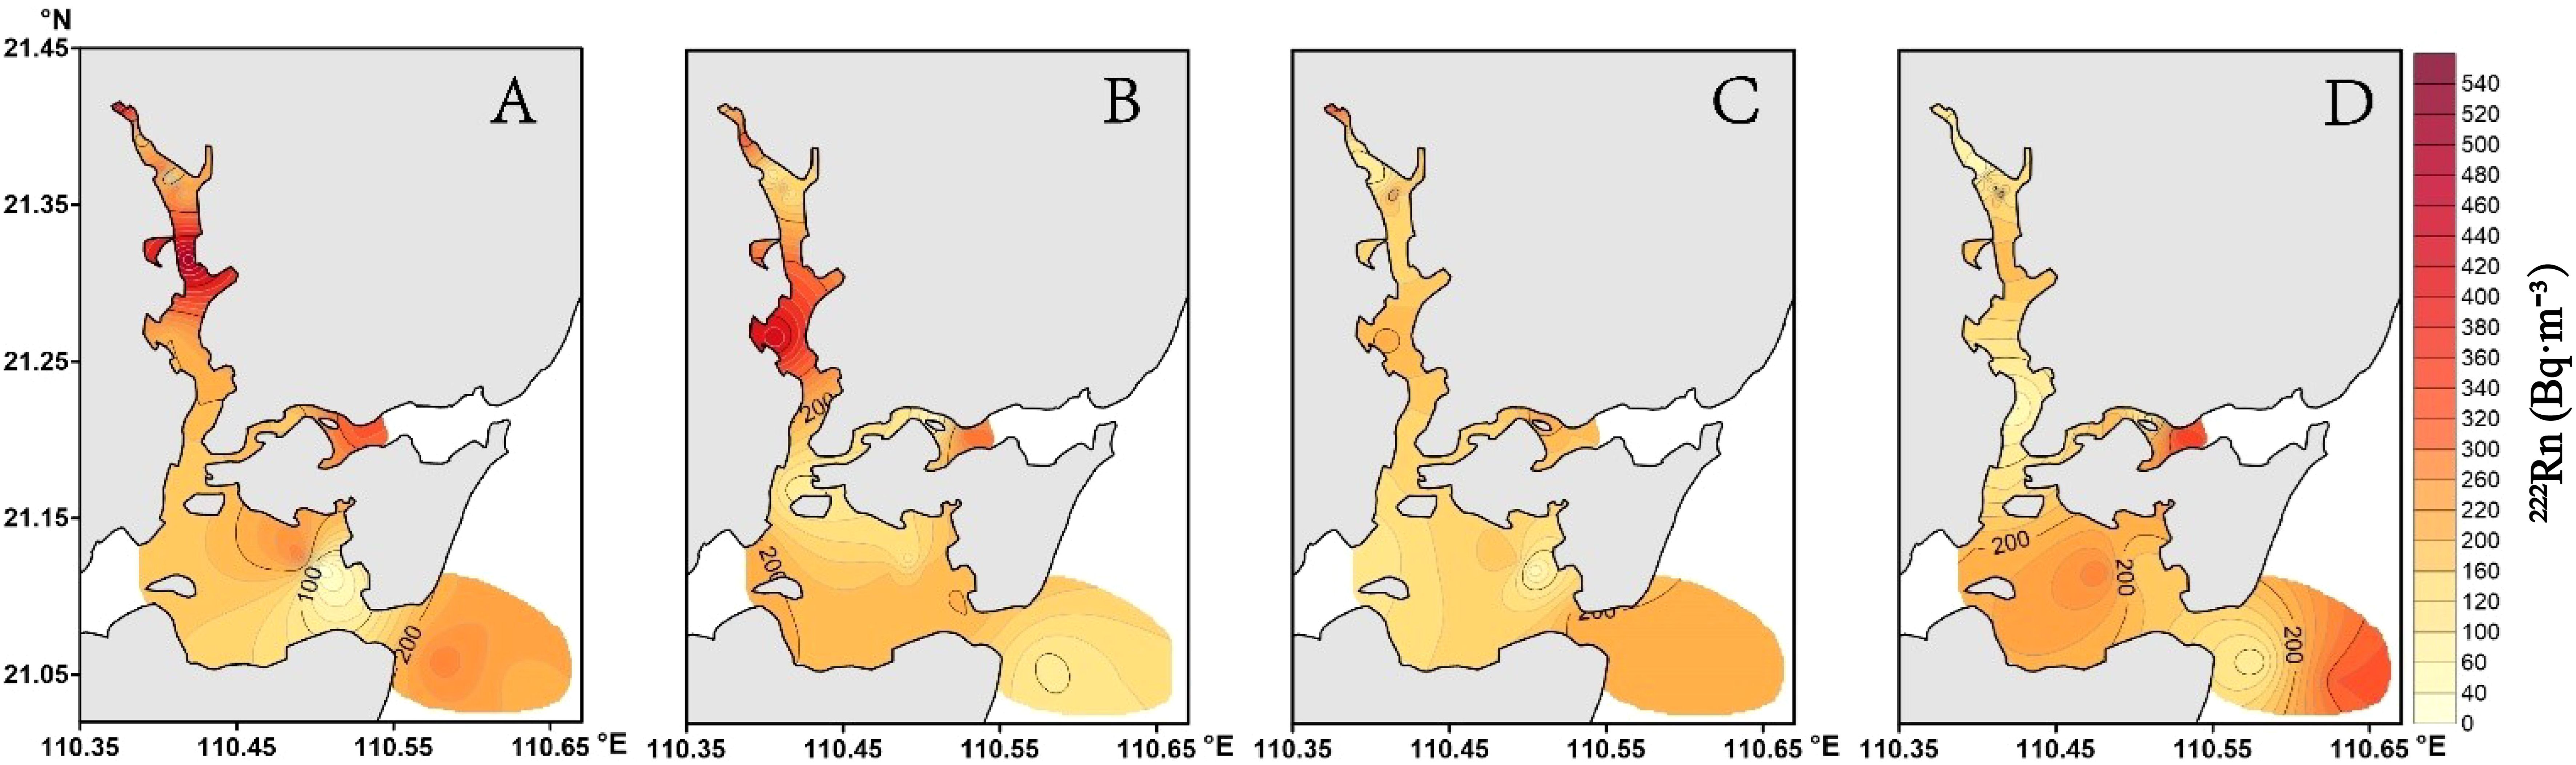
Figure 2. Spatial distribution of 222Rn concentrations in annual water samples from Zhanjiang Bay. (A, B) represent the rainy months of June and September, while (C, D) signify the dry months of December and March.).
The overall trend of radon activity in both the rainy and dry seasons gradually increase from the estuarine zone to the outer sea. The increase in radon activity extends from the outer sea area to the bay. In the summer, the high radon activity shifts from the southern zone of the bay to the north. High levels of 222Rn activity are observed between the ZJ6 and the ZJ8, ranging from 90~500 Bq·m-3. Station ZJ6 has the highest concentration of 500 Bq·m-3. The 222Rn activity distribution in the bay in September is similar to that in summer, the 222Rn activities during the two seasons displays an east-high and west-low trend, with a vertical north-low and south-high trend observed in the entire bay. Throughout the year, the average radon activity in the bay is highest in the summer and the highest value of radon activity appears in the estuarine zone. With the seasonal changes, the high value will move southward from the estuarine zone and decrease along with the average radon activity in the bay until winter, when the radon in the water column of the bay is mixed uniformly, resulting in the lowest value of average radon activity. The high value of radon activity will once again move northward the following spring, along with an increase in the typical 222Rn activity of water bodies (Figure 2).
The nutrient levels in Zhanjiang Bay exhibit significant variation. Overall, the nutrient levels in the bay are higher during the rainy season compared to the dry season. Specifically, from June to December, nitrate concentrations range between 1.47 and 36.12 μmol·L-1, nitrite concentrations range between 0.82 and 4.72 μmol·L-1 in the central bay and southern bay, are all at low levels, which are close to those in the open sea area and show a decreasing trend from north to south (Figure 3). However, during the March, the distribution of nitrate and nitrite concentrations in the region exhibit considerable differences compared to other survey periods. Nitrate and nitrite levels are significantly elevated in the central and southern bays. The average concentration of nitrate in the southern bay reaches 48.31 μmol·L-1, indicating an increase of up to threefold compared to the average concentration found in the open sea. Furthermore, the concentration of nitrite was measured at 6.05 μmol·L-1, representing an upsurge of up to six times the average concentration in the open sea area. Besides, there are extreme values at station ZJ14, with nitrate concentrations as high as 140.2 μmol·L-1 seven times the bay average, and nitrite concentrations as high as 24.78 μmol·L-1 and 21.5 times the bay average for nitrite concentrations. Seasonal sampling shows DIP concentrations vary from 0.03 to 5.89 μmol·L-1 and DSi concentrations range from 0.66 to 112.22 μmol·L-1. The estuary area exhibits a higher overall concentration of nutrients, with a marked increase in the northern region and a decrease in the southern part of the bay. Consistently, the concentrations of DIP and DSi declines in Zhanjiang Bay from June to December. As time progressed, the concentration levels of nitrate, nitrite, DIP and DSi gradually shifts towards the northern region of the bay, and a uniform mixture of the DIP and DSi is observed in both the central and southern areas of the bay in December. The waters of Zhanjiang Bay showed higher nutrient levels in the north and lower levels in the south.
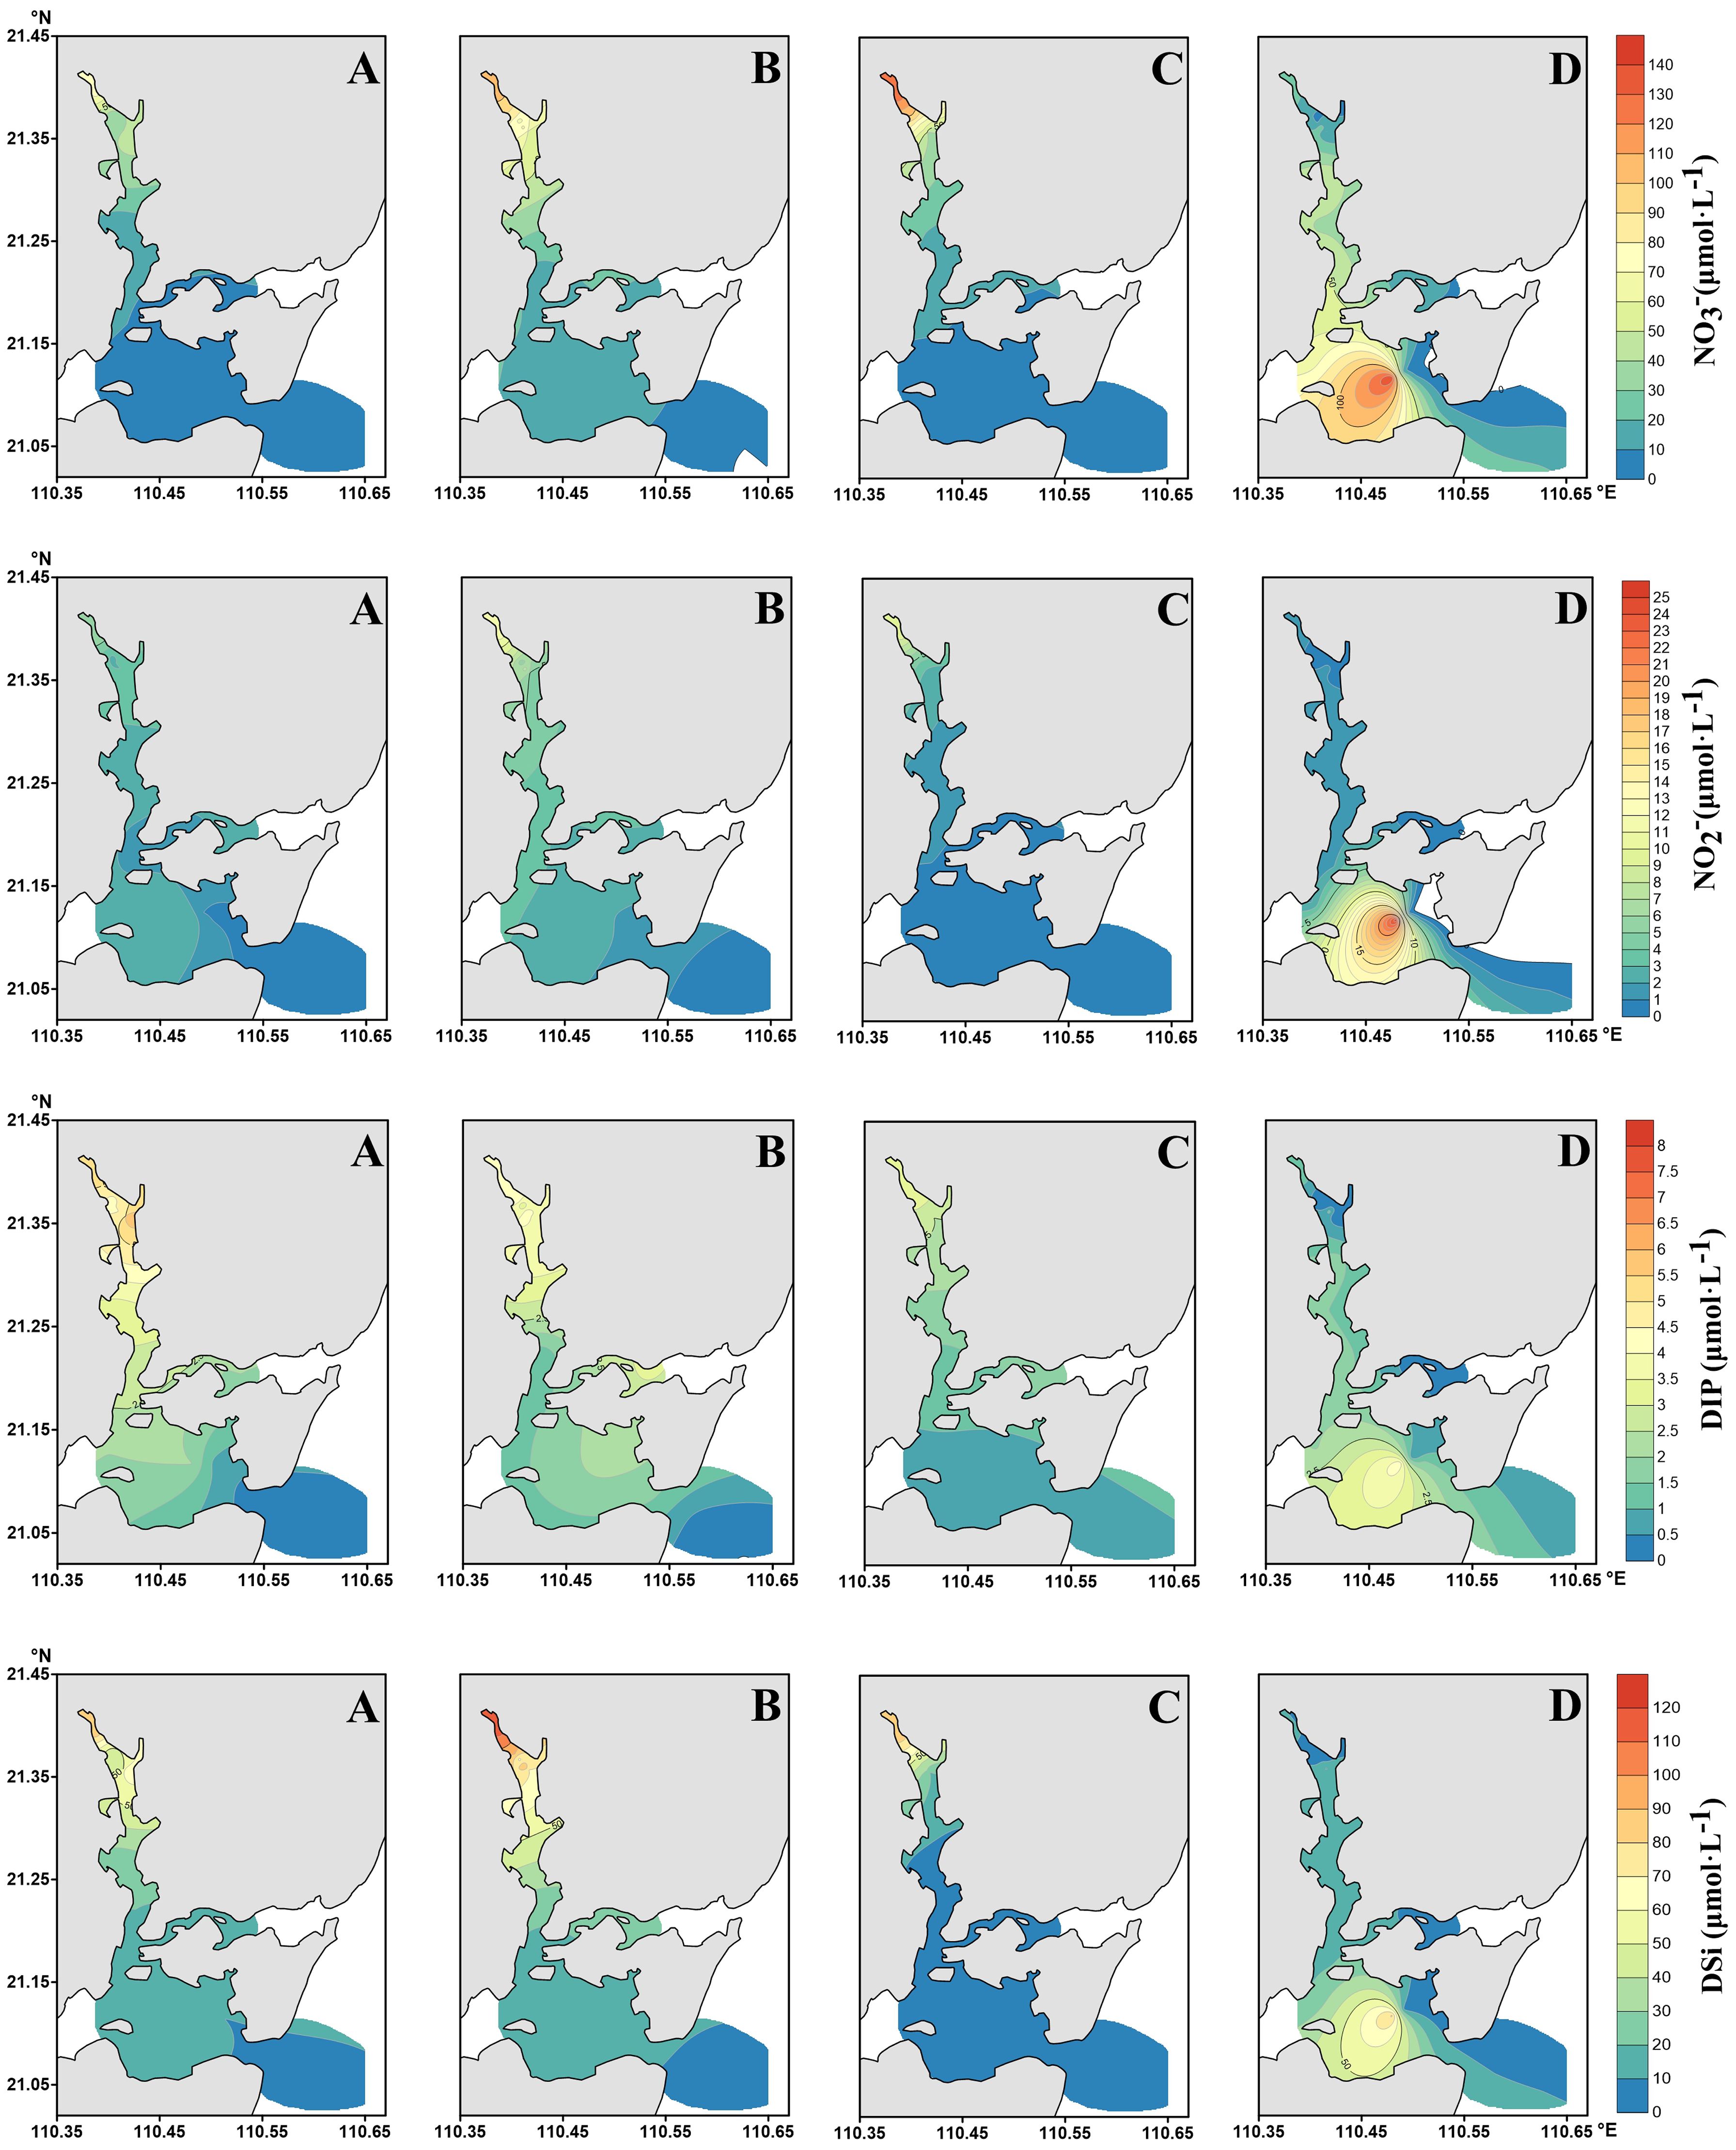
Figure 3. Distribution of nitrate, nitrite, DIP and DSi concentration levels in Zhanjiang Bay (A, B) represent the rainy months of June and September, while (C, D) signify the dry months of December and March).
3.2 SGD flux estimation
To obtain the 222Rn activity in pore water, sediment incubation experiments were conducted in this study (Corbett et al., 1998; Chanyotha et al., 2016), These experiments results are presented in the supplementary data.
Zhanjiang has a small temperature difference throughout the year, with water temperatures 30°C in summer (rainy season) and 20°C in winter (dry season). The concentration of 222Rn in groundwater varies spatially, with activity values obtained from Tan et al. (2018). In order to compute the land runoff flux, the average of the two measurements of 222Rn activity in the Datieyang River is taken as Cu=207 Bq·m-3. This value is obtained through ArcGIS software and the study area had a size of S=21.51 km2, an x-coordinate of 4688.56 m, a depth of 6 m and velocity of 8 m·s-1. The results of the calculation are presented in Table 1.
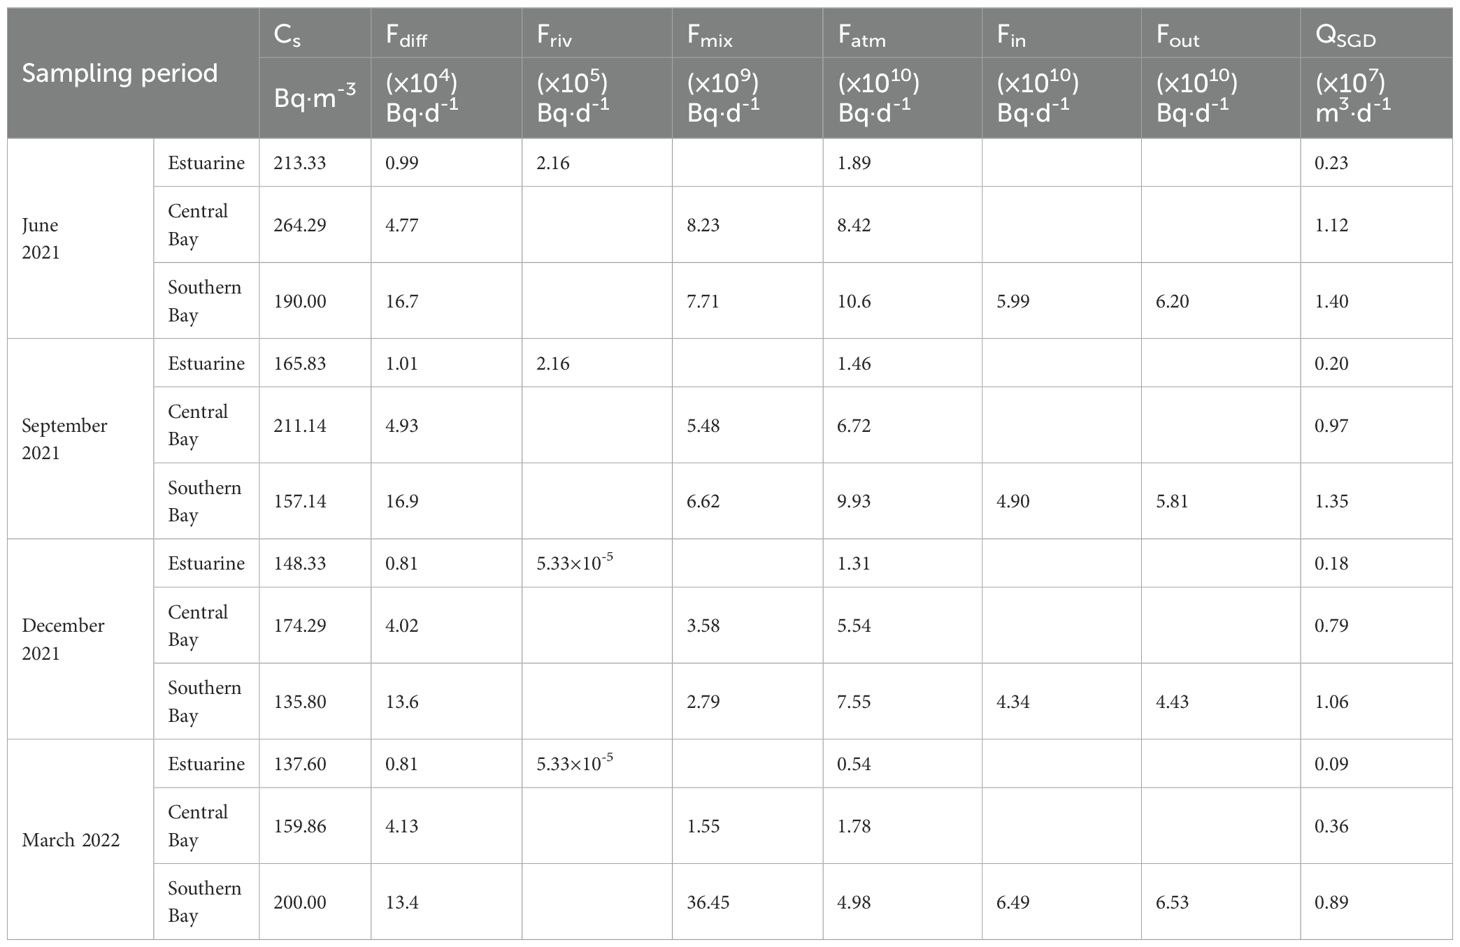
Table 1. SGD flux of 222Rn and its component parameters calculated using mass balance model of 222Rn isotopes on the Zhanjiang Bay.
Overall, SGD fluxes in Zhanjiang Bay are higher during the rainy season than in the dry season. From June to March, the SGD flux in Zhanjiang Bay continuously decrease. Seasonal trends in SGD in the three parts are largely synchronized. Fluxes of SGD in June and September are two to three times higher than those in March. A high flux of SGD appears in the central bay and southern bay during the sampling period, ranging from values between 0.36 107~1.40 107m3·d-1, the highest flux is observed in the southern bay in June.
3.3 SGD flux uncertainly in Zhanjiang Bay
According to Wu and Lu (2011), the three categories of SGD flux uncertainty are parameter uncertainty, model uncertainty, and data uncertainty. The spatial variability of water retention time related to complex geomorphology represents parameter uncertainty, while the spatial variability of coastal groundwater 222Rn activity contributes to model and data uncertainty. In the box model based on 222Rn to estimate SGD, the atmospheric loss of 222Rn is significantly high during June and September, and its flux can reach 1~5 times that of December and March. Since river inputs and sediment diffusion contribute less than 1% to the overall quantity of 222Rn in any season, their contribution can be neglected. Therefore, the primary mechanism of 222Rn inventory in Zhanjiang Bay is predominantly tidal inputs and outputs, seawater mixing and atmospheric loss. Moreover, the change in groundwater end members caused by the heterogeneity of various aquifer properties will be the main factor causing measurement errors under typhoon conditions (Cho and Kim, 2016). The length of the box plot box represents the interquartile range (IQR) (Figure 4), and the two ends are the upper quartile (Q3) and the lower quartile (Q1), respectively. Sample data with greater than Q3 + 1.5IQR and less than Q1-1.5×IQR are considered sample outliers. The outliers between the outlier intercept line and the extreme value intercept line are called mild outliers, and the outliers located outside the extreme value intercept line are called extreme outliers. SGD values are calculated by considering the range within the acceptable limits defined by mild outliers of 222Rn activity in seawater, as depicted in Figure 4. In the first observation in June 2021, the SGD in the estuary area does not exhibit any significant changes compared with the mode without using the method mentioned above to correct the data (we refer to this as the original mode). Meanwhile, a noticeable decrease of 20% is observed in the SGD within the central bay compared to its original mode.
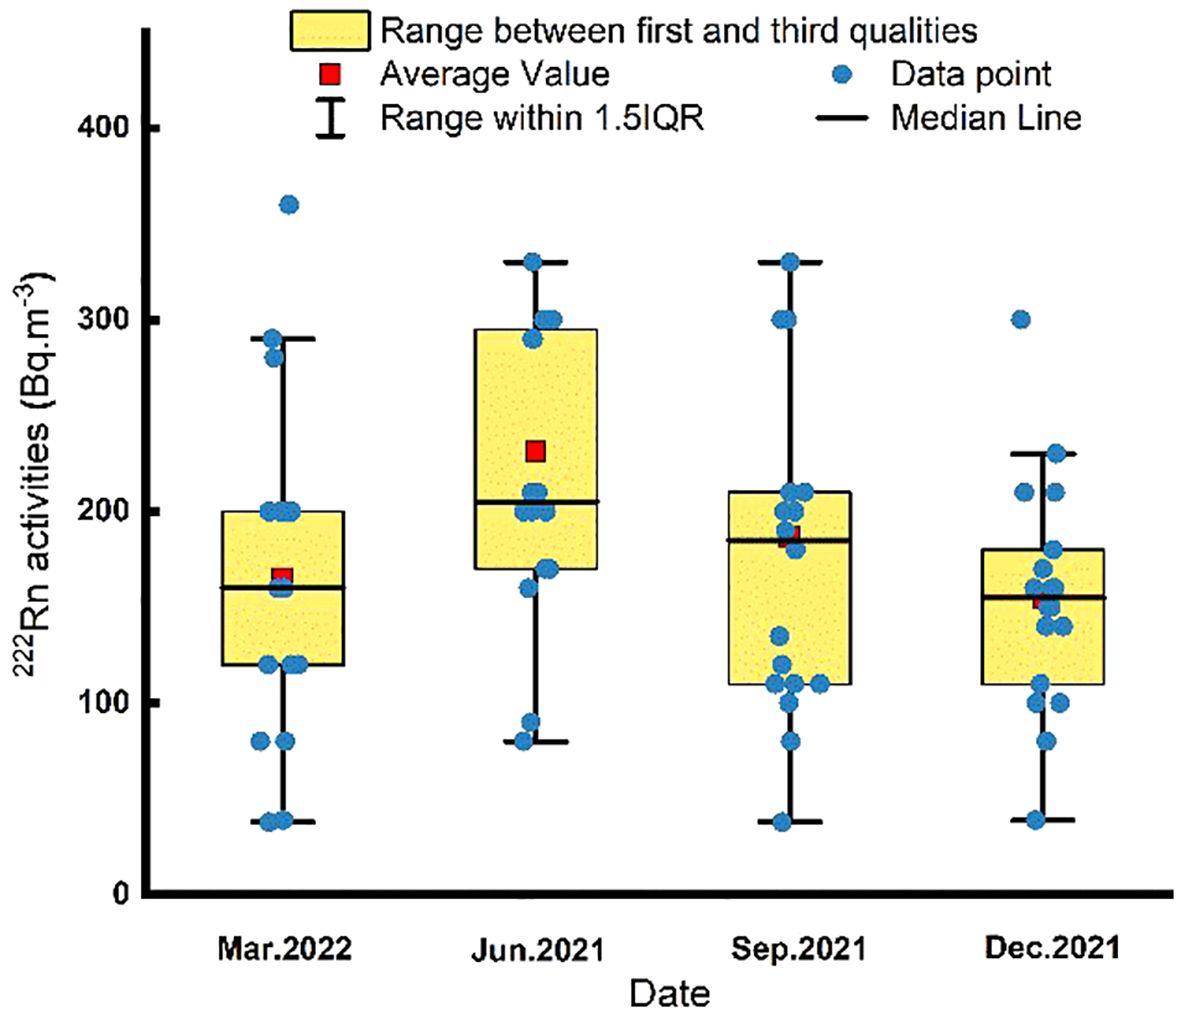
Figure 4. Boxplots of 222Rn activities(Bq·m-3) in seawater in the Zhanjiang Bay (The data within the area between the horizontal line above and the horizontal line below the “yellow box” is considered acceptable data.).
In contrast, southern bay experiences a considerable increase of 13% in the SGD compared to its original mode. The total SGD witnesses a corresponding increase of 3% during this period. In the second observation in September 2021, it is observed that the SGD in the estuary area decreased by 1% compared to the original mode. The SGD in the central bay area exhibits a notable decrease of 23% in comparison to its original mode. The SGD in the southern bay area decreases by 8% from its original mode. Consequently, the total SGD witnesses an overall decrease of 13%. The third observation in December 2021, shows that the estuary area experiences a decrease of 1% in SGD levels, while the central bay area records a decrease of 17%. On the other hand, the southern bay experiences a considerable increase of 9% in the SGD compared to its original mode. The total SGD witnesses a corresponding increase of 3%. In the fourth observation in March 2022, the SGD in the estuary region shows a growth of 8% compared to the initial mode. Similarly, the SGD in the central bay area increased by 16% from its original mode, while the southern bay significantly decreases by 28%. Overall SGD showed a decrease of 14%.
The impact of the spatial variability of 222Rn activity in the whole bay is evident. The discussion on the zoning of SGD in Zhanjiang Bay mitigates the impact of spatial variability, resulting in a certain degree of uncertainty. However, the SGD rate in this paper is within the normal range of the world when compared to previous studies, which indicates that our data is reliable (Table 2).
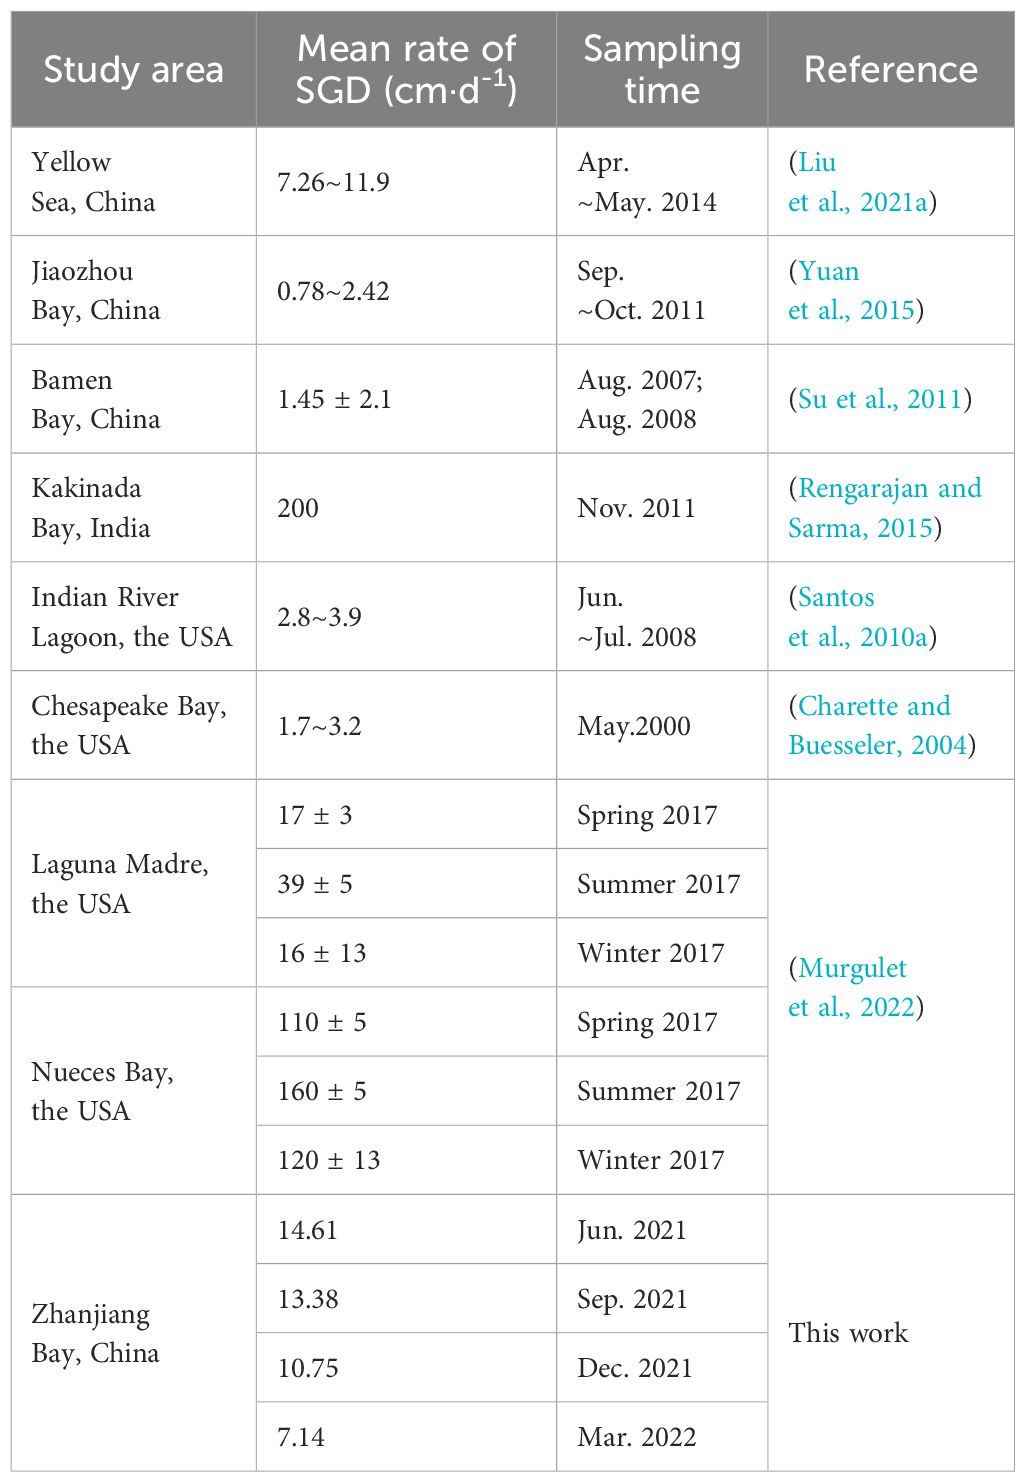
Table 2. The mean SGD rate in different sea areas.
4 Discussion
4.1 Spatial and temporal variation of 222Rn and SGD in Zhanjiang Bay across the year
The distribution of 222Rn activities presents a great spatial and temporal difference in Zhanjiang Bay. The levels of 222Rn activity in estuary and central bay, located in the east of Zhanjiang City, decreases significantly during the dry sampling periods compared to the results of the rainy season sampling. Between June and September, the activity of 222Rn in the estuary and central bay is higher compared to other seasonal levels in the bay, and decreases significantly from the north to the south of the bay (Figure 2). Seasonal changes can impact the activity of 222Rn, as well as cause shifts in its high-value areas, which is related to the Zhanjiang Bay’s geological structure. The ZJ1 station of the estuarine area in Zhanjiang Bay is situated north of the Leiqiong Artesian Basin and is mainly supplied by water from bedrock fissures. Additionally, the area has poor water storage capacity due to the lack of water-retaining properties in the original bedrock (Wen, 2013). As a result, the water level is significantly affected by seasonal variations, and typically relies on rainfall infiltration for replenishment (Nainggolan et al., 2020). Therefore, the groundwater drainage in the estuary area is most directly affected by rainfall under the geological conditions at the northern boundary of the Leiqiong Artesian Basin. This has caused higher 222Rn activity in the Zhanjiang Bay estuary during the rainy season, and lower activity during the dry season. Five stations, ZJ6, ZJ11, ZJ13, ZJ14, and ZJ15, are located at the edge of the Zhanjiang depression, which has a coarse-grained and loosely arranged surface highly saturated with water (Wen, 2013). Whether in the rainy or dry seasons, the 222Rn activity at the above stations is higher than that of the surrounding stations. The difference is that there is a significantly high value in the central bay area during the rainy season, and this high value disappears in the dry season, which may be due to the distribution of several volcanic craters on the west side of the central bay area (Liang et al., 2016). The activity of 222Rn in groundwater is influenced by the abundance of uranium-bearing minerals in the parent rock, especially in volcanic regions, which are known to have higher uranium concentrations. As a result, aquifers in these areas tend to have higher levels of 222Rn (Dini et al., 2019; Wang et al., 2022a). Additionally, the surface groundwater is mainly volcanic pore fracture water, penetrating the study area’s volcanic channels and making the lower basalt directly connected with the sand layer (Wen, 2013; Liang et al., 2016). During the rainy season, the volcanoes on the west side are recharged with a large amount of water, thus increasing the discharge of pore water from the volcanic rocks in the central bay, However, during the dry season, it relies mainly on the submerged flow from the high terraces of the Leizhou Peninsula to the plain area (Liang et al., 2016).
The slope of the correlation between salinity and 222Rn activity in Zhanjiang Bay prior to the rainy season is positive, as demonstrated by the relationship between salinity and 222Rn activity in the bay (Figure 5). In contrast, the slope of the correlation between salinity and 222Rn activity in the dry season is negative, which indicates that high 222Rn activity tends to be present in highly saline waters during the dry season, while high 222Rn activity is present in low-saliny waters during the rainy season. This is because changes in the salinity interface are influenced by oceanic and terrestrial drivers (Santos et al., 2012; Abarca et al., 2013). The high values of 222Rn activity in the dry season near-shore area may be due to the scarcity of precipitation during the dry season, which makes the fall of the groundwater level, and the descent of hydraulic gradient from land to sea, this results greater RSGD in the water column in this area driven by physical processes such as tidal pumping, wave action, seasonal forcing and convection (Murgulet et al., 2022). The salinity boundary in Zhanjiang Bay is mainly determined by the hydraulic gradient of the inland area, which largely depends on the rate of surface water replenishment (Dausman and Langevin, 2005). Therefore, aquifers along the coast of Zhanjiang Bay are greatly affected by precipitation conditions. There is no strong correlation between salinity and radon activity in Zhanjiang Bay in either the wet or dry seasons, which we attribute to the failure to exclude the transport of low-radon-activity waters from terrestrial runoff during the wet season and the error introduced by mixing with near-shore waters during the dry season.
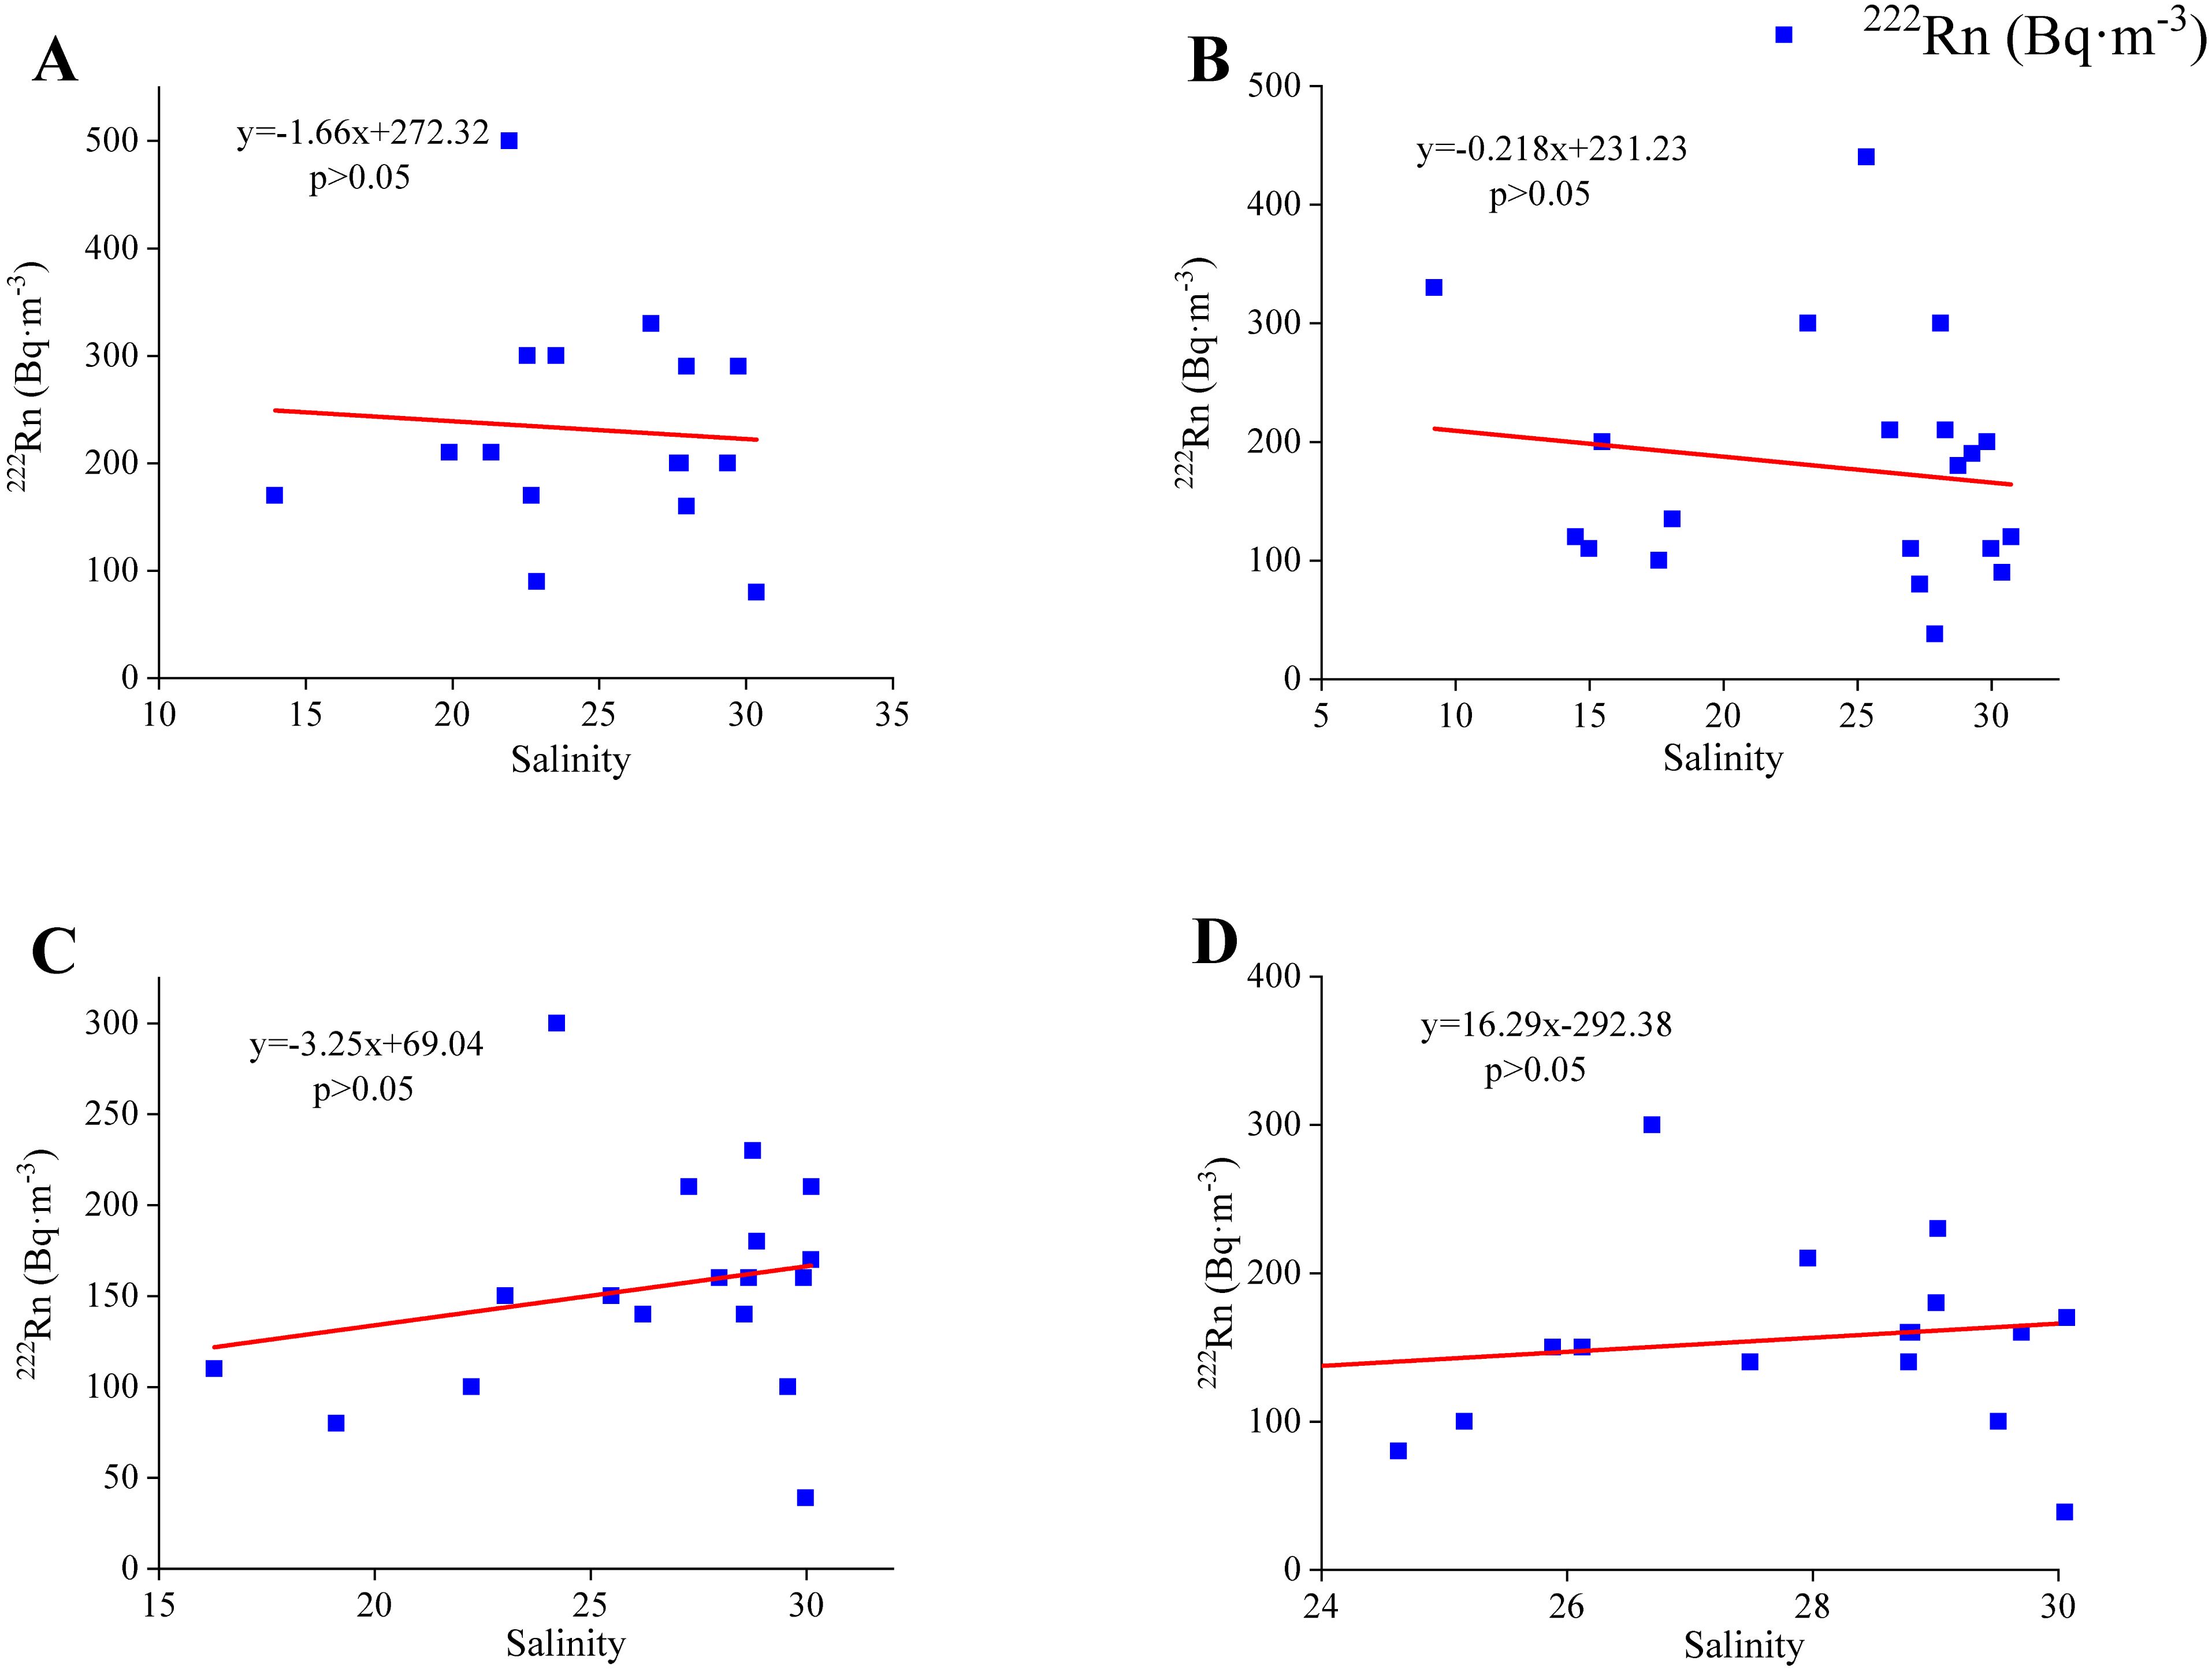
Figure 5. Relationship between salinity and activity of 222Rn in seawater during sampling period SGD induced nutrients [(A) is the June, (B) is the September, (C) is the December and (D) is the March].
The seasonal sampling SGD values mentioned in section 3.3 shows that the SGD fluxes in Zhanjiang Bay are much higher during the rainy season compared to the dry season. This is consistent with the above 222Rn activity distribution pattern; the flux variation of SGD is basically synchronized with the activity of 222Rn. 222Rn provides an estimate of the total SGD, but it cannot be used to determine the SFGD and RSGD. Considering that the Suixi River is the main source of runoff, in systems with little or no surface runoff it is possible to use salinity and Equation 12 (Dulaiova et al., 2010) to make a rough estimate of SFGD in Zhanjiang Bay during the dry season. QSFGD is fresh submarine groundwater discharge (m3·d-1), Scos and Ssho are coastal water and near-shore salinity, which were measured by CTD probe. The Scos is determined by the average salinity of central and southern bay, and Ssho is determined by the average salinity of stations Z18 and Z19.
The SFGD flux in Zhanjiang Bay is calculated to be 1.57×10⁷ m3·d-1 in June, 1.49×10⁷m3·d-1 in September, 6.19×10⁶ m3·d-1 in December and 2.68×10⁶ m3·d-1 in March, accounting for 57%, 60%, 30%, and 20% of the total SGD flux, respectively. During the rainy season, precipitation on the surface seeps into the ground, constituting a substantial portion of the SGD as SFGD. Conversely, in the dry season, the absence of precipitation leads to a sharp reduction in the SFGD flux, RSGD is the main factor at the locations seaward of the interface (Taniguchi et al., 2006). The flux of RSGD can be approximately calculated by the total SGD flux minus the SFGD flux. The RSGD estimated for June, September, December, and March are 1.17×10⁷ m3·d-1, 1.07×10⁷ m3·d-1, 1.40×10⁷ m3·d-1, and 1.08×10⁷ m3·d-1, respectively, indicating minimal RSGD seasonal variation. This observation reinforces the notion that the observed seasonal fluctuations in SGD are predominantly attributed to the alterations in SFGD caused by precipitation patterns.
Temporal variation in groundwater flow is mainly controlled by precipitation, since recharge is influenced largely by this phenomenon (McKenzie et al., 2021). Figure 6 illustrates the impacts of rainfall on SGD and SFGD. Evidently, the SFGD shows a more significant sensitivity to precipitation changes compared to the overall SGD. From April 2021 to April 2022, the precipitation in Zhanjiang Bay presents a trend from rise to decline, with the precipitation concentrated between June and October and peaks in August. During the rainy season, the annual average rainfall in Zhanjiang can reach 594.35mm, accounting for nearly half of the annual precipitation in Zhanjiang. The increase in precipitation in October is influenced by the transit of typhoons Lionrock and Kompasu in early October. The variations in precipitation and SGD are not perfectly coincident, while September recorded greater precipitation than June, the SGD rate unexpectedly exhibits a modest decrease compared to the earlier month. This is due to the fact that in groundwater systems, the permeability of the aquifer and the cross-sectional area of the groundwater end-member determine the maximum discharge rate, excess rainfall will become surface runoff when the rainfall is greater than the infiltration rate (Allen et al., 2021). Therefore, a short period of heavy rainfall does not continuously increase the SGD flux but rather prolongs the period of maximum groundwater discharge (Allen et al., 2021). The soil around Zhanjiang Bay is highly permeable, resulting in a high recharge rate from rainfall to groundwater (Liang et al., 2016). Severe rainfall events can lead to a significant increase in SGD flux in the short term. Indeed, SGD exhibits seasonal variations, primarily due to changes in groundwater levels driven by different seasons (Lee et al., 2007). In December, following the rainy season, there is a noticeable time lag in the response of SGD to precipitation. Even though December experienced less precipitation than March, higher groundwater levels accumulated during the rainy season led to a higher SGD flux in December than in March. These findings agree with the conclusions drawn by (Zhu et al., 2023) at the Yangtze River estuary. The time lag between SGD and precipitation can make rainfall events have a longer-lasting impact on the transport of terrestrial matter from land to the sea.
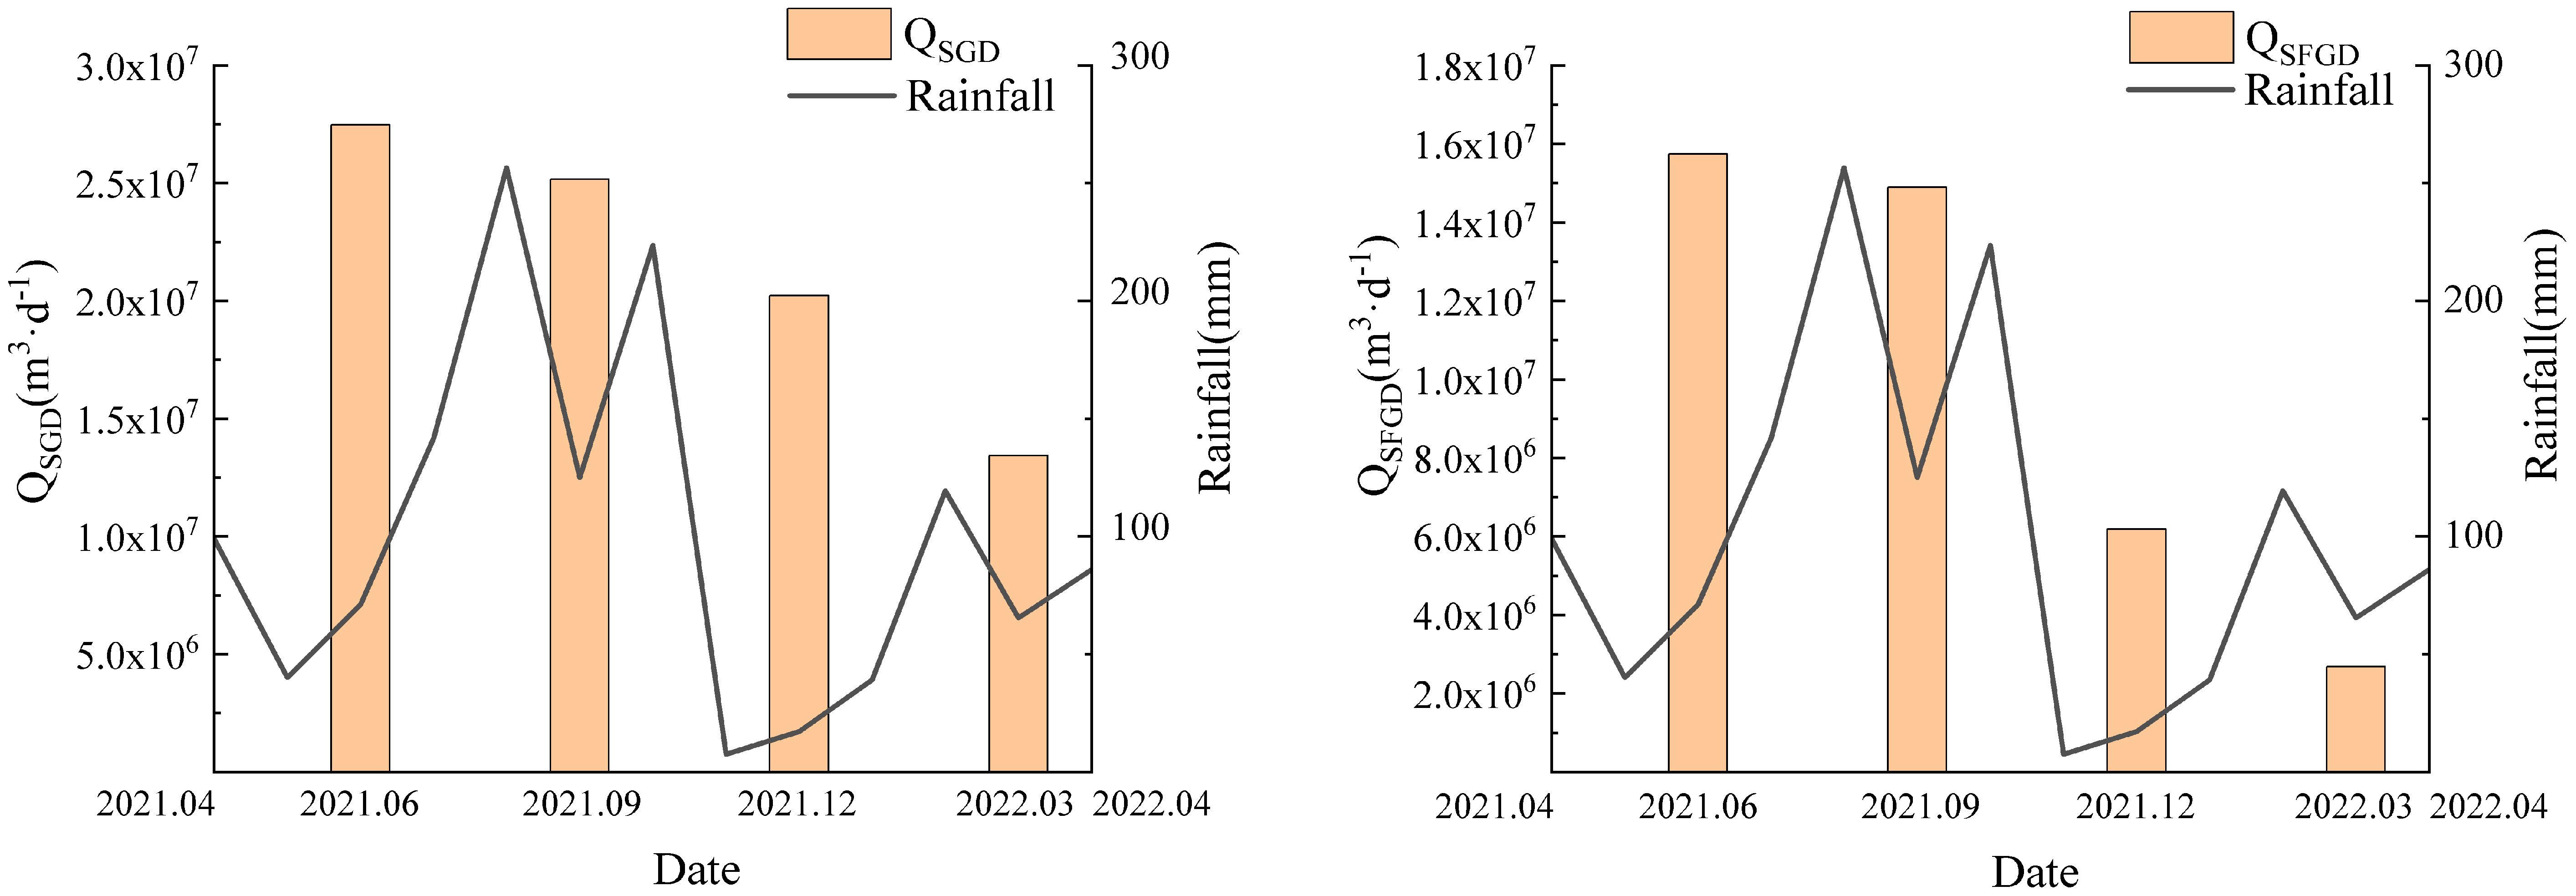
Figure 6. Relationship of SGD and SFGD flux in each zone before and after rainfall impacts in Zhanjiang Bay.
4.2 Spatial and temporal variation of nutrients in Zhanjiang Bay across the year
The overall nutrient status in the bay can vary widely from season to season. It is evident from Figure 3 that during the rainy season, the levels of nitrate and nitrite in the water are highest in the estuary and low-salinity water areas, and decrease as the estuary moves towards the southern bay, suggesting that the nitrate and nitrite are mainly coming from the freshwater in the estuary. In December, the nitrate and nitrite levels at all stations in the estuary, except for the low value at the ZJ5 station, has risen compared to the levels in the rainy season. This is likely due to the mineralization of solid organic nutrients at the ZJ5 station, which leads to an increase in NH4+ and then nitrate and nitrite after water movement (Chen et al., 2022b). In particular, nutrient concentrations in June are higher than those in September, with DIP being the exception, which we attribute to the high phytoplankton growth in the rainy season and the high demand for nutrients.
The temporal and spatial variations of the 222Rn activity and the distribution of nutrients in the central bay are exhibited in Figure 7. In general, the central bay’s nutrients show a good correlation with 222Rn, with R2 greater than 0.75, except in March. The central bay is far from the main rivers and outer sea, and the main source of nutrients may be SGD. Therefore, the 222Rn there shows a good correlation with nutrients. However, in March, the long-term low rainfall results in a decrease in land runoff and SFGD discharge, which also limits the input of terrestrial substances from atmospheric wet deposition. Moreover, the water temperature in Zhanjiang Bay in March is suitable for the growth of algae (He et al., 2023), it will boost the nutrients consumption in the water body, nutrients are greatly affected by biological activities. Simultaneously, the decrease of runoff input leads to the increase of seawater intrusion into the bay (He et al., 2023), resulting in an amount of nutrients from the outer sea in the water. This may be the reason for the lack of correlation between nutrient content and 222Rn activity in the central bay. In contrast, the Suixi River is the estuary’s primary source of nutrients. In the southern bay, nutrient inventories are more affected by outer sea. Nutrient levels in these two regions are particularly susceptible to external factors. However, throughout the year, ZJ14 station is indicated by high radon levels and high nutrient concentrations in the southern bay during the same period, especially in March. We consider station ZJ14 to be the hotspot of this investigation in March, although this station is located in the center of the southern part of the bay, far away from the land runoff recharge sites, the concentrations of nutrients are higher than in the estuary. It can be assumed that this hotspot area’s high nutrients level mainly originates from the SGD. Suggesting that the nutrient input caused by SGD in the dry season has a major influence on nutrient distribution in the region’s ecosystem. Although we do not specifically calculate the rainy season, we expect an increase in SFGD due to heavy precipitation from June to September that increases overland runoff and soil water content. However, since we only have one year of data, we need more in-depth investigations to draw firm conclusions.
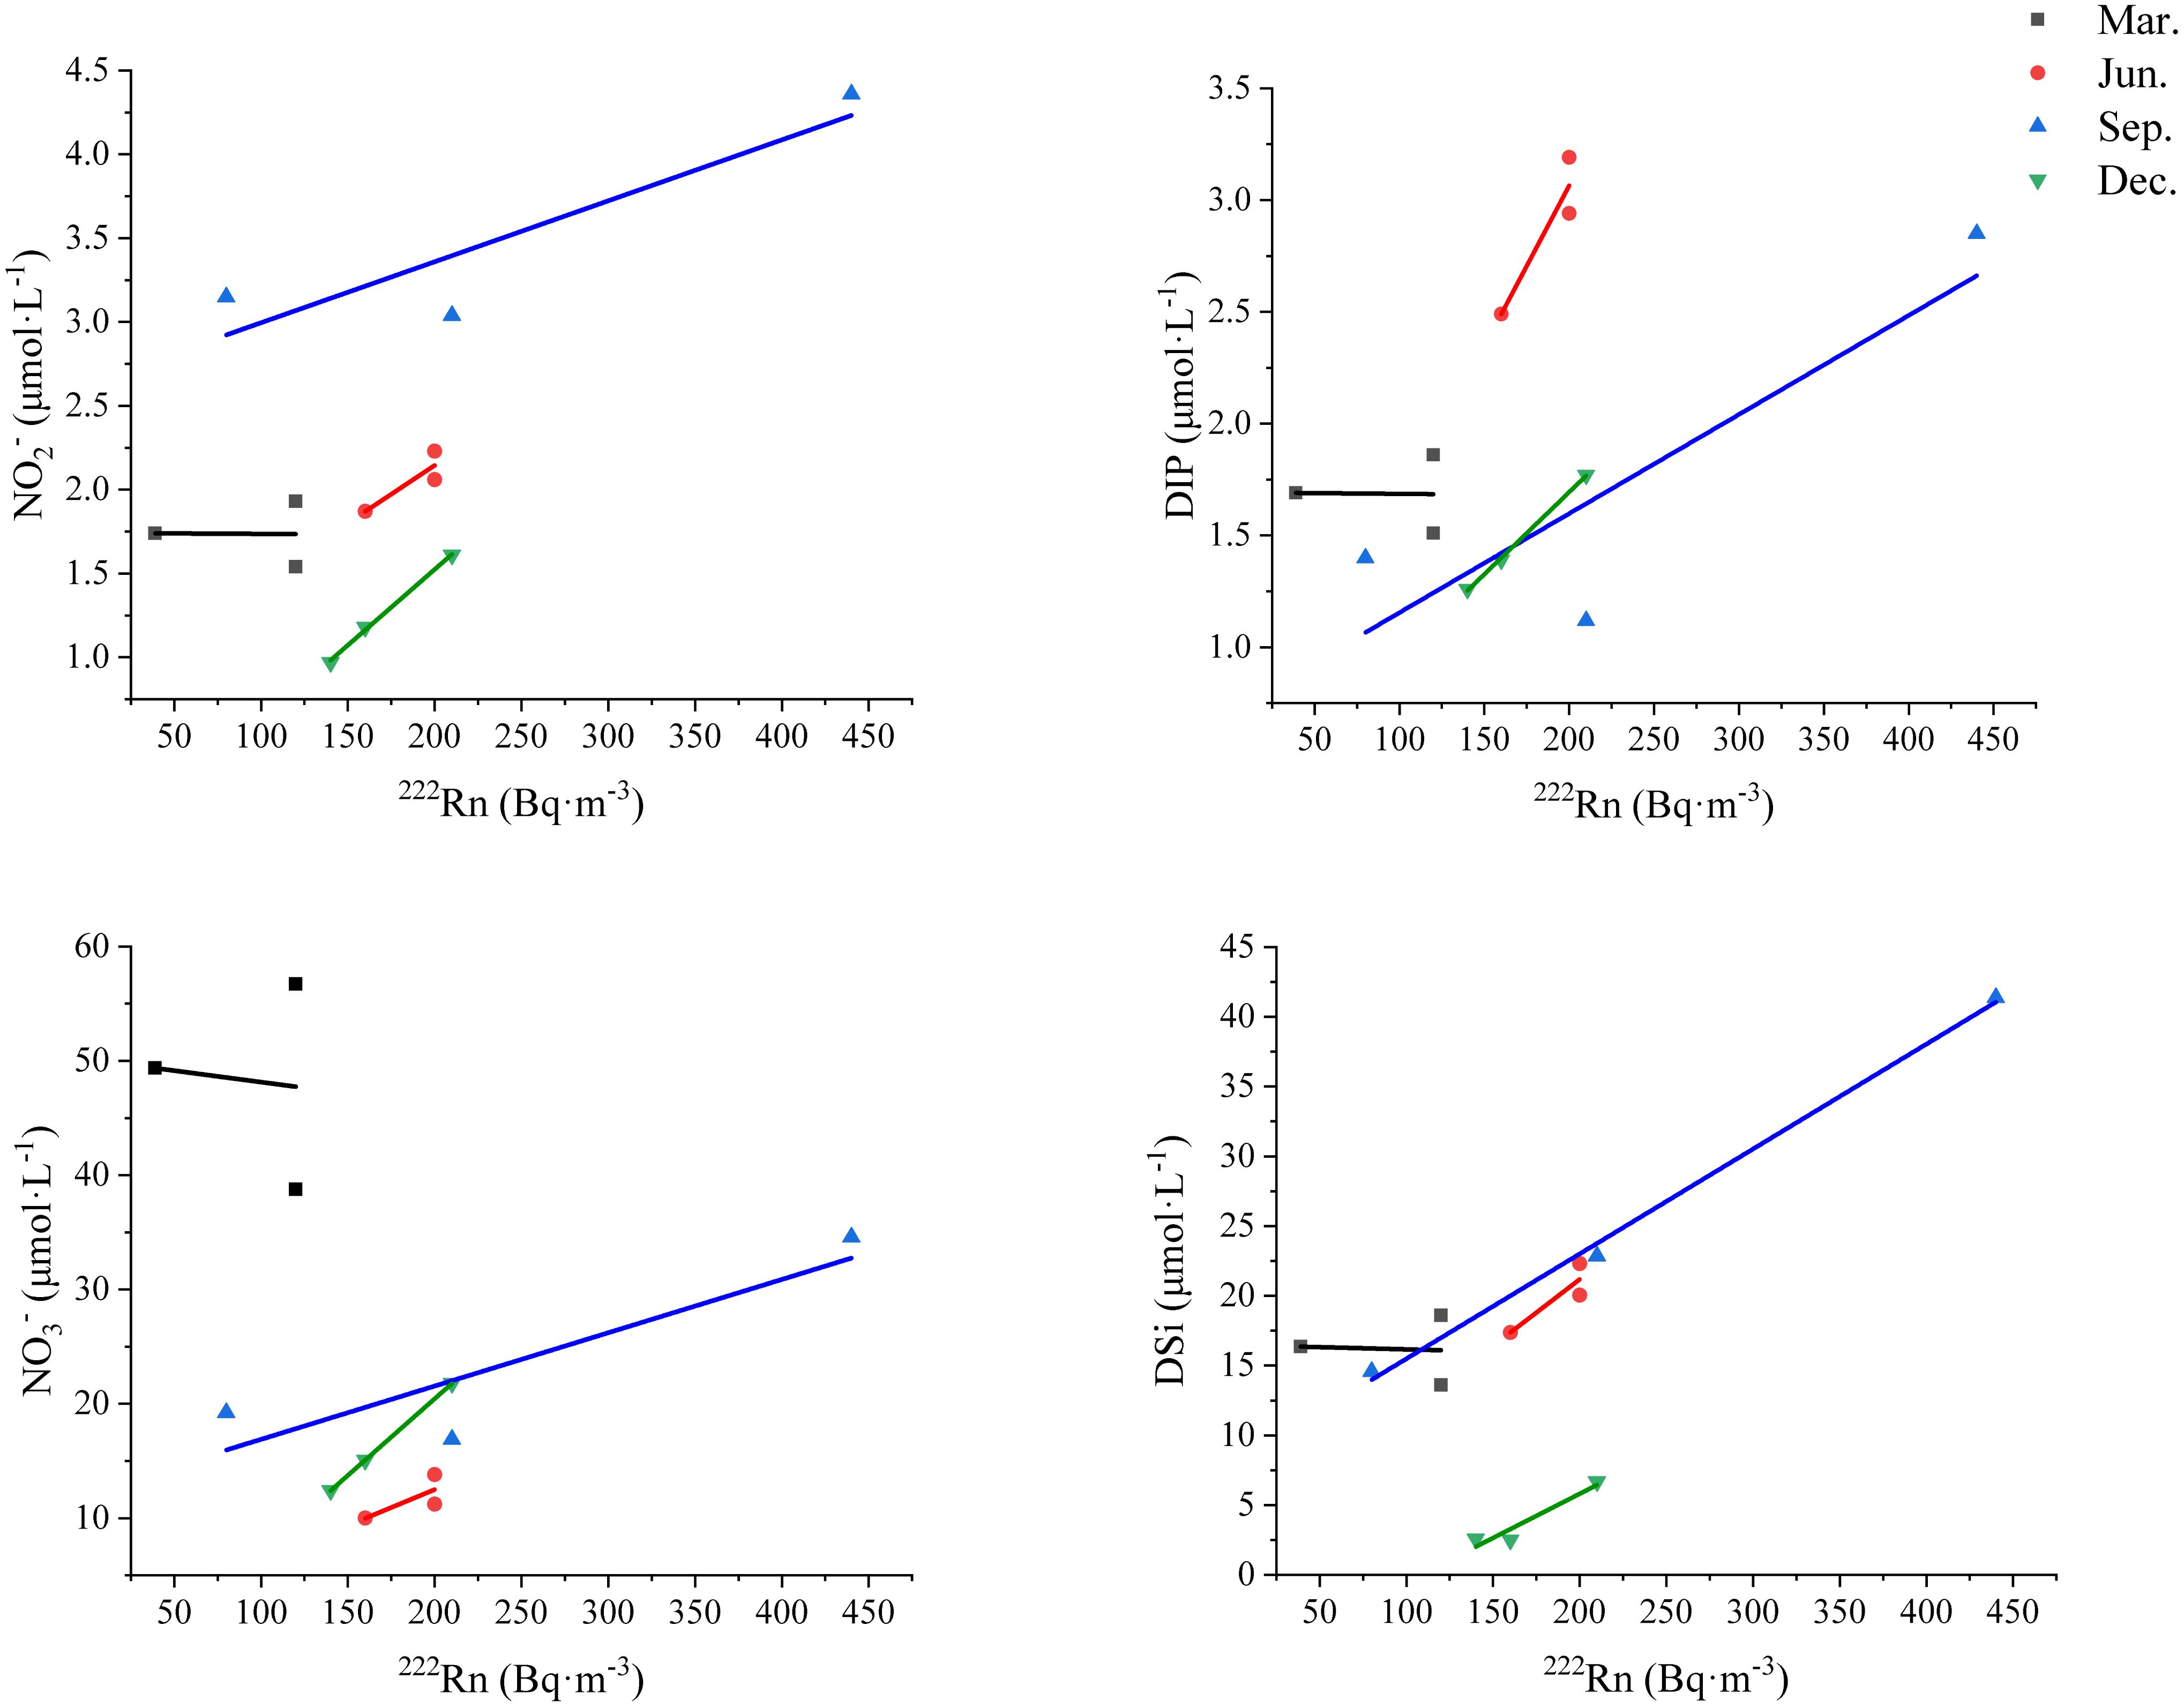
Figure 7. Relationship between nutrients concentrations and activity of 222Rn in seawater from central bay during sampling period.
DSi can be used as a SGD tracer to determine the magnitude of SGD if it shows a conservative behavior in the seawater, and the difference of DSi concentrations between groundwater and seawater is very high (Hwang et al., 2005; Kim and Swarzenski, 2010). In our investigation, the DSi in groundwater is notably higher than that in seawater (Table 3). Furthermore, DSi can supplement the uncertainty caused by degassing loss of 222Rn in high-energy environments (Fanning et al., 1982). As depicted by Figure 8, during the sampling in the rainy season, DSi and salinity has a strongly negative correlation, with the determination coefficients for both samplings being around 0.9. A high concentration of DSi is only found in freshwater with low salinity. The correlation coefficient between DSi concentration and salinity in March of the dry season is only 0.06 and shows a positive correlation. This suggests that the DSi input is chiefly influenced by precipitation. However, the DSi concentration and salinity in December of the dry season are negatively correlated, and the coefficient of determination was 0.96. At this time, rainfall in Zhanjiang is already deficient, suggesting that the source of freshwater for DSi input in December is not from rainwater or immediate surface runoff, but rather from SGD with a lag effect. The supplementation of SFGD gradually decreases with time, and the concentration of DSi in the low-salinity waters of the bay was decreasing. This implies that utilizing DSi as an indicator for SGD, especially SFGD, in this region is a viable approach.
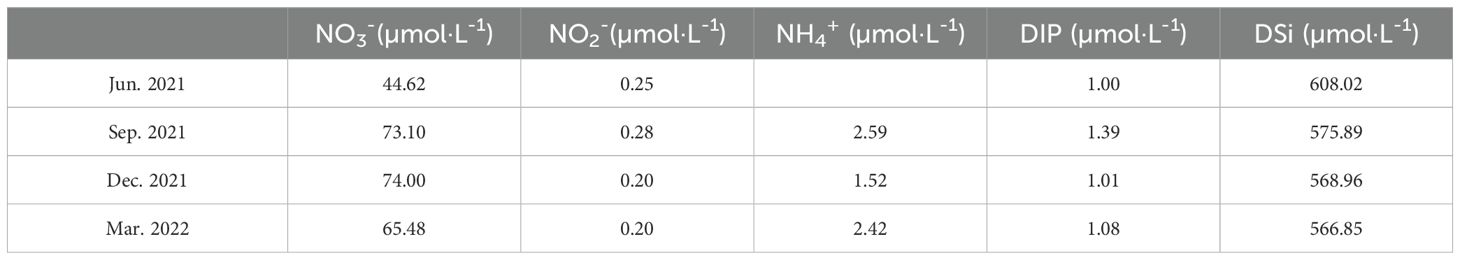
Table 3. Nutrients concentrations in the groundwater in sampling period.
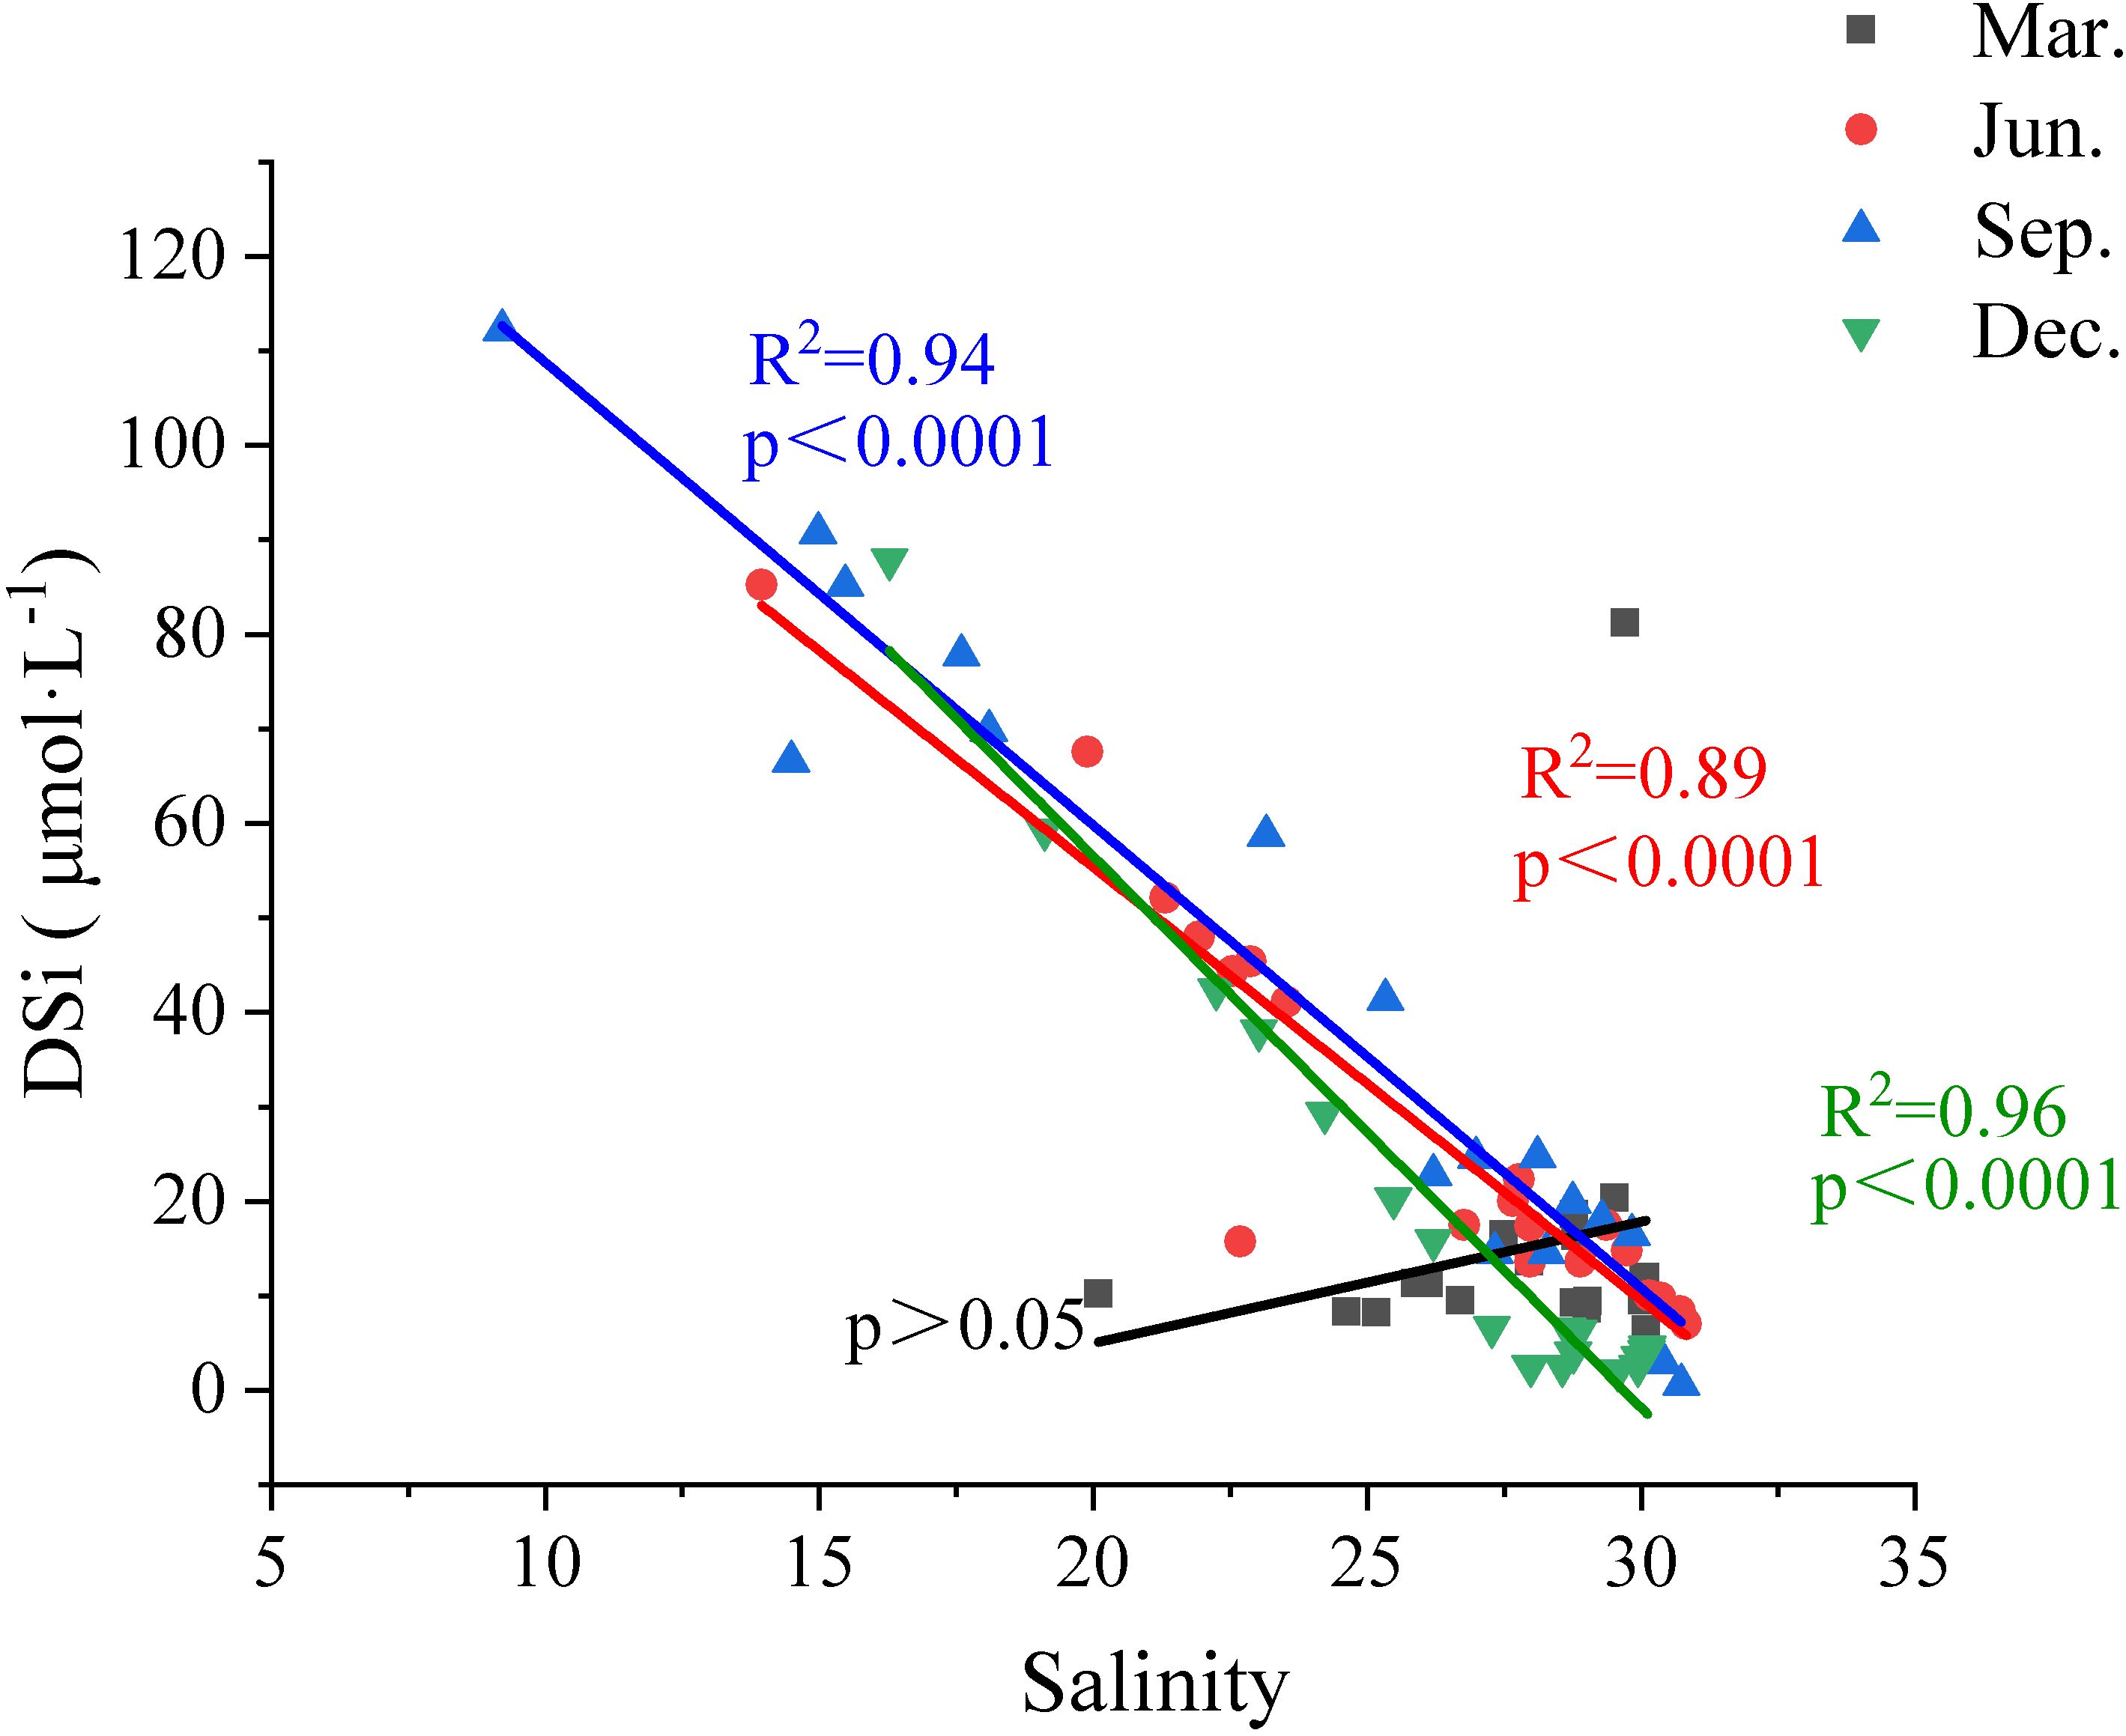
Figure 8. Relationship between DSi and Salinity in seawater during sampling period.
The average concentrations of nutrients are exhibited in Table 3, where NO2- and DIP are significantly lower than those in seawater while NO3- and DSi are higher. The nutrient concentrations in groundwater peaks in September, likely due to the accumulation of surface water from the rainy season that dissolves a higher amount of nutrients before seeping into the ground, thereby increasing the nutrient concentration. The N/P ratio in groundwater, falling within the range of 40 to 80, exceeds the Redfield ratio. The SGD process may to some extent alleviate the nitrogen limitation in Zhanjiang Bay since the 21st century (He et al., 2023). The concentration of NO3- in groundwater is significantly higher than that of both NO2- and NH4+, indicating the absence of anaerobic conditions and weak denitrification processes. This observation may correlate with the low aquifer storage capacity of the bedrock in Zhanjiang Bay, as discussed earlier. The reduced storage capacity results in shorter groundwater residence times, thereby diminishing the oxygen demand for nutrient decomposition (Qu et al., 2017). Phosphorus is typically bound to sediments in oxic groundwater through adsorption (Dini et al., 2019), thus it is relatively low in SGD. DSi is commonly found in high concentrations in SGD and behaves conservatively in coastal aquifers. The influx of DSi into the bay water is usually limited to land runoff and groundwater replenishment, as the groundwater of Zhanjiang Bay is largely composed of volcanic rock pore fissure water and bedrock fissure water (Wen, 2013).
In this study, nutrient fluxes through SGD can be estimated by the product of SGD fluxes and nutrient concentrations in groundwater end-members over the sampling time. Table 4 demonstrates that the flux of nutrients from SGD during the rainy season is marginally higher than in the dry season. The DSi transported by SGD is the highest, two orders of magnitude higher than NH4+and DIP, four orders higher than NO2-, and one order higher than NO3-. The flux of nutrients into Zhanjiang Bay from the Suixi River is estimated by multiplying the annual runoff of the Suixi River by the average concentration of nutrients in the river. The results reveal that the SGD annual input of NO2- is an order of magnitude smaller than that of the river, while DSi is an order of magnitude larger. The flux of other SGD nutrients is comparable to those of the Suixi River. In addition, since there is only one major land runoff in Zhanjiang Bay, the Suixi River, and it is located in the northern bay, nutrients transported by rivers mainly affect the estuary area, while in the central and southern bay, the source of nutrients may mainly come from SGD. Recent years, the flow of the Suixi River is decreasing (Lao et al., 2022). Especially in the dry season, the Suixi River is close to being cut off, and a consequent reduction in the transport of terrestrial materials via the river, SGD-derived nutrients may serve as the major supplement in Zhanjiang Bay. Additionally, there is also a phytoplankton bloom in winter (Zhou et al., 2022). Combined with our investigation, the nutrients transported by SGD in December are still at a high level. This is likely related to the high nutrient intake of SGD. It can be seen that SGD plays an important role in the nutrient budget in Zhanjiang Bay.
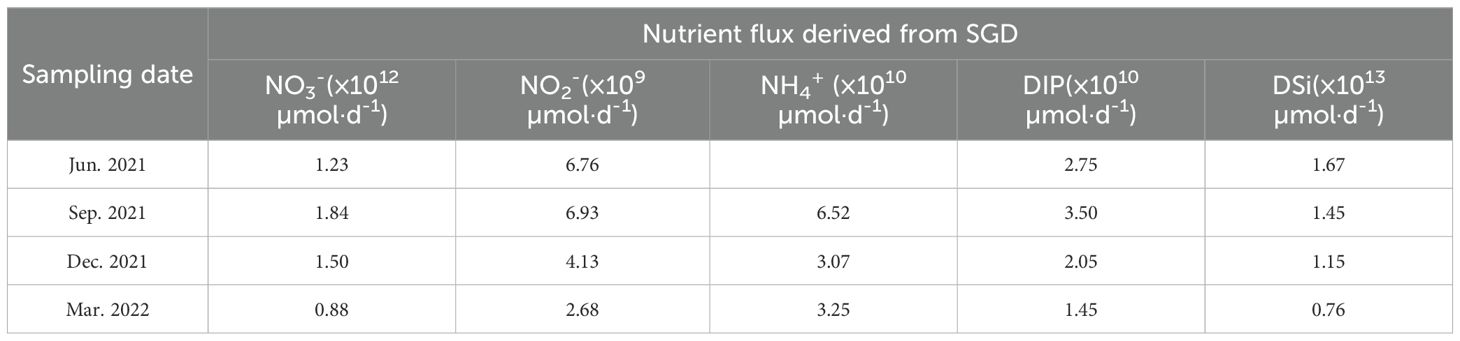
Table 4. Changes in SGD and nutrients fluxes in the bay in sampling period.
However, the uncertainty of nutrients in groundwater end members will cause uncertainty in the nutrient flux calculated by SGD, and Our estimates of the nutrients carried by SGD in Zhanjiang Bay may be subject to substantial discrepancies. Besides, our groundwater endmembers originate from freshwater, focusing our calculations on the nutrients transported by SFGD. The aquifer system’s complexity makes it challenging to accurately estimate the nutrients input by RSGD. Furthermore, microbial activities such as nitrification, denitrification, and ammonia absorption in aquatic environments can modify nitrogen levels (Dulaiova et al., 2010). And decrease nitrogen levels in groundwater pathways (Valiela et al., 1992). Moreover, the intricate biochemical processes of DIN in underground estuaries and sediment-water interfaces can modify the composition of nitrate and nitrite in groundwater (Seitzinger, 1988; Kroeger and Charette, 2008). This can cause inaccuracies in the measurement of nitrate and nitrite concentrations. More accurate calculations of SGD-derived nutrients fluxes necessitate future research on the complex processes within coastal aquifers (Zhang et al., 2016). For instance, Wilson et al. (2024) employed a method to estimate the addition or removal of nutrients due to non-conservative behavior as groundwater carrying nutrients flows through subterranean estuaries (subsurface freshwater-saltwater mixing zone). This approach assumes a steady-state, uniform mixing of seawater and freshwater at the interface of the subterranean estuary, with only two constant end-member water sources present. Each observed nutrient concentration is compared to the theoretical conservative mixture to determine whether nutrients are produced or consumed along the salinity gradient, thereby calibrating the process of nutrient transport from groundwater to seawater. We believe that this method is also applicable for studying the removal or addition of heavy metals carried by SGD within subterranean estuaries. Pain et al. (2021), employed an advection-diffusion model to calculate the advective velocity based on the chloride concentration profiles of porewater. This velocity was then used to determine the freshwater discharge of groundwater per unit time and unit shoreline length. By multiplying this discharge by the nutrient concentrations in the porewater, they were able to estimate the nutrient flux of groundwater per unit time and unit shoreline length. Additionally, we propose that sediment incubation experiments and in-situ trials could be undertaken to investigate the processes through which nutrients or heavy metals are released from sediment pore water into the marine environment within groundwater. It will facilitate the development of mathematical models, thereby refining our results.
4.3 The potential Environmental implications of SGD
In the past five years, nearly half of the water bodies in Zhanjiang Bay has faced severe eutrophication, which may be attributed to increased nutrient input (He et al., 2023). In addition to human factors, high SGD is also one of the reasons that aggravates the eutrophication in Zhanjiang Bay. Especially during the rainy season, the sudden increase in SGD and river flows can introduce large amounts of nutrients to the water body, and the eutrophication level in the rainy season is twice that in the dry season (He et al., 2023).
Eutrophication of water bodies will alter aquatic food webs, which may also trigger hypoxic events in the near-shore marine environment (Turner and Rabalais, 1994; Humborg et al., 1997; Liu et al., 2009), while on the one hand, anoxic fresh groundwater discharges into the seawater, on the other hand, oxygen-enriched seawater can penetrate the associated aquifers, and oxygen would be depleted via organic matter remineralization and other processes within the groundwater (Guo et al., 2020). The fluids may become hypoxic when discharged as RSGD. RSGD accounts for more than 70% of SGD in Zhanjiang Bay in the dry season. It plays an important role in the recycling and release of sediment nutrients to surface waters and may play a significant role in sustaining primary productivity (Correa et al., 2020). The temperature in the rainy season is higher, and the degradation of organic matter is enhanced, increasing oxygen consumption. Due to the decrease in oxygen solubility, dissolved oxygen is more likely to escape from the water, and the stratification of the water body is stronger, which weakens the exchange of low oxygen water derived from SGD in the bottom with surface water. In Zhanjiang Bay, the DO in surface water is lowest in summer, the chlorophyll-a concentration was high but DO was unsaturated in September, suggesting that it was related to terrestrial input (Zhou et al., 2022), including SGD. Therefore, SGD may have a potential threat to the occurrence of hypoxia in the water body.
The area of Zhanjiang Bay is small; the outlet is very narrow; coupled with the construction of the Donghai Dam, it results in insufficient water mobility and long residence time of the water body, especially in the central bay and estuary (Wang et al., 2021). These are the areas where SFGD and rivers transport the most terrestrial materials. Furthermore, Donghai Island situated to the south of Zhanjiang Bay has several steel industrial areas which could increase the concentration of heavy metals in groundwater. The contribution of heavy metals from SGD might be a significant factor in the coastal metal budgets and biogeochemical cycle (Wang et al., 2019).
Studies in the South China Sea region have shown that chlorophyll-a and primary productivity in the region responded significantly to nutrients supplemented by heavy rainfall (Chang et al., 1996; Lin et al., 2003; Sun et al., 2010). The SGD activity, which links the coastal zone to the South China Sea, also affects the sustainability of the coastal zone ecosystem. The alteration of the nutrient structure in the bay due to various biogeochemical processes will affect the nutrient flux transported from the coast to the ocean. This persistent SGD will affect the open marine ecosystem, so further research on its biogeochemical effects on the bay is necessary.
4.4 Limitations of the study
The SGD estimated by the 222Rn mass balance model has certain limitations. Due to the short half-life of 222Rn, which is only 3.8 days, the selected well is located at a certain distance from the coast. In the pathway of groundwater flowing towards the sea, a portion of the 222Rn will decay and be lost (Lopez et al., 2020). Moreover, most of the well water samples we collected belong to unconfined aquifers, neglecting the groundwater discharge from confined aquifers. Variations in the groundwater level can cause interactions between river water and groundwater, leading to the transfer of 222Rn between river water and groundwater (Atkinson et al., 2015; Yang et al., 2017). The selection of groundwater end-members using radon as a tracer introduces significant uncertainty (Lopez et al., 2020). These will cause errors in SGD estimation. In future studies of SGD, it is advisable to use different methods for comprehensive comparison, such as combining multiple tracers, integrating hydrogeological parameters, employing remote sensing technology, and establishing mathematical models (Yang et al., 2018).
5 Conclusion
In this study, we present high-resolution 222Rn data of Zhanjiang Bay seawater and draw the following main conclusions:
1. SGD is a mixture of freshwater and saltwater. Precipitation can significantly affect the SGD flux, especially the SFGD flux, and there is a time lag for SGD to respond to rainfall. The proportion of SFGD is more significant in the rainy season than in the dry season.
2. Based on the 222Rn mass balance model, we estimated the SGD flux during the rainy season was 2.52~2.75×10⁷ m3·d-1, and during the dry season was 1.34~2.02×10⁷ m3·d-1. During the dry season, 222Rn and the NO2-, NO3-, DIP, DSi existed in a hotspot in the south of the bay, away from land, suggesting that SGD processes strongly influence nutrients during the dry season.
3. As the rains start, the amount of nutrients in the environment increases. Throughout the year, the nutrients input from SGD is comparable to that from rivers. During the dry season, SGD may have a significant impact on the overall trophic status in Zhanjiang Bay, particularly in the central and southern bays, which are distant from the estuaries.
Although these results require more detailed groundwater nutrient assays to be further refined, our SGD survey has provided reliable groundwater discharge rates which provide a reasonable basis for future groundwater nutrient flux investigations.
Data availability statement
The original contributions presented in the study are included in the article/supplementary material. Further inquiries can be directed to the corresponding author.
Author contributions
XL: Data curation, Formal analysis, Writing – original draft, Writing – review & editing. XC: Data curation, Formal analysis, Writing – original draft, Writing – review & editing. FC: Funding acquisition, Writing – review & editing. GJ: Conceptualization, Funding acquisition, Writing – review & editing. CW: Data curation, Writing – review & editing. MM: Writing – review & editing. ZS: Data curation, Formal analysis, Writing – review & editing. XS: Data curation, Formal analysis, Writing – review & editing.
Funding
The author(s) declare financial support was received for the research, authorship, and/or publication of this article. This research was supported by the Guangdong Natural Science Foundation of China (2019B151512006, 2016A030312004), National Natural Science Foundation of China (U1901213), the Southern Marine Science and Engineering Guangdong Laboratory (Zhanjiang) (ZJW-2019-08), the Guangdong Provincial College Innovation Team Project(2019KCXTF021) and First-class Discipline Plan of Guangdong Province (080503032101, 231420003), the Guangdong Natural Science Foundation of China (2019B1515120066), APN, CRRP2019-09MY-Onodera, Shin-ichi Onodera.
Acknowledgments
We would like to thank, Qingmei Zhu and Shangjun Cai from College of Ocean and Meteorology, Guangdong Ocean University, for their support in collecting and analyzing water samples.
Conflict of interest
The authors declare that the research was conducted in the absence of any commercial or financial relationships that could be construed as a potential conflict of interest.
Publisher’s note
All claims expressed in this article are solely those of the authors and do not necessarily represent those of their affiliated organizations, or those of the publisher, the editors and the reviewers. Any product that may be evaluated in this article, or claim that may be made by its manufacturer, is not guaranteed or endorsed by the publisher.
References
Abarca E., Karam H., Hemond H. F., Harvey C. F. (2013). Transient groundwater dynamics in a coastal aquifer: The effects of tides, the lunar cycle, and the beach profile. Water Resour. Res. 49, 2473–2488. doi: 10.1002/wrcr.20075
Allen H., Markus E., Boris F. (2021). Hydrogeology, chemical weathering, and soil formation. (John Wiley & Sons, Inc). doi: 10.1002/9781119563952
Atkinson A. P., Cartwright I., Gilfedder B. S., Hofmann H., Unland N. P., Cendon D. I. (2015). A multi-tracer approach to quantifying groundwater inflows to an upland river; assessing the influence of variable groundwater chemistry. Hydrological Processes 29, 1–12. doi: 10.1002/hyp.v29.1
Burnett W. C., Aggarwal P. K., Aureli A., Bokuniewicz H., Cable J. E., Charette M. A., et al. (2006). Quantifying submarine groundwater discharge in the coastal zone via multiple methods. Sci. Total Environ. 367, 498–543. doi: 10.1016/j.scitotenv.2006.05.009
Burnett W. C., Bokuniewicz H., Huettel M., Moore W. S., Taniguchi M. (2003). Groundwater and pore water inputs to the coastal zone. Biogeochemistry 66, 3–33. doi: 10.1023/B:BIOG.0000006066.21240.53
Burnett W. C., Dulaiova H. D. (2003). Estimating the dynamics of groundwater input into the coastal zone via continuous radon-222 measurements. J. Environ. Radioactivity 69, 21–35. doi: 10.1016/S0265-931X(03)00084-5
Cable J. E., Burnett W. C., Chanton J. P., Weatherly G. L. (1996). Estimating groundwater discharge into the northeastern Gulf of Mexico using radon-222. Earth Planetary Sci. Lett. 144, 591–604. doi: 10.1016/S0012-821X(96)00173-2
Cave R. R., Henry T. (2011). Intertidal and submarine groundwater discharge on the west coast of Ireland. Estuarine Coast. Shelf Sci. 92, 415–423. doi: 10.1016/j.ecss.2011.01.019
Chang J., Chung C.-C., Gong G.-C. (1996). Influences of cyclones on chlorophyll a concentration and Synechococcus abundance in a subtropical western Pacific coastal ecosystem. Mar. Ecol. Prog. Ser. 140, 199–205. doi: 10.3354/meps140199
Chanyotha S., Kranrod C., Kritsananuwat R., Lane-Smith D., Burnett W. C. (2016). Optimizing laboratory-based radon flux measurements for sediments. J. Environ. Radioact 158-159, 47–55. doi: 10.1016/j.jenvrad.2016.03.023
Charette M. A., Buesseler K. O. (2004). Submarine groundwater discharge of nutrients and copper to an urban subestuary of Chesapeake Bay (Elizabeth River). Limnology Oceanography 49, 376–385. doi: 10.4319/lo.2004.49.2.0376
Chen F., Deng Z., Lao Q., Bian P., Jin G., Zhu Q., et al. (2022a). Nitrogen cycling across a salinity gradient from the Pearl River Estuary to offshore: insight from nitrate dual isotopes. J. Geophysical Research: Biogeosciences 127, e2022JG006862. doi: 10.1029/2022JG006862
Chen G., Xu B., Zhao S., Yang D., Burnett C. W., Diao S., et al. (2022b). Submarine groundwater discharge and benthic biogeochemical zonation in the Huanghe River Estuary. Acta Oceanologica Sin. 41, 11–20. doi: 10.1007/s13131-021-1882-3
Cho H. M., Kim G. (2016). Determining groundwater Ra end-member values for the estimation of the magnitude of submarine groundwater discharge using Ra isotope tracers. Geophysical Res. Lett. 43, 3865–3871. doi: 10.1002/2016GL068805
Cho H. M., Kim T. H., Moon J. H., Song B. C., Hwang D. W., Kim T., et al. (2021). Estimating submarine groundwater discharge in Jeju volcanic island (Korea) during a typhoon (Kong-rey) using humic-fluorescent dissolved organic matter-Si mass balance. Sci. Rep. 11, 941. doi: 10.1038/s41598-020-79381-0
Corbett D., Burnett W., Cable P., Clark S. (1998). A multiple approach to the determination of radon fluxes from sediments. J. Radioanalytical Nucl. Chem. 236, 247–253. doi: 10.1007/BF02386351
Correa R. E., Tait D. R., Sanders D. R., Conrad S. R., Harrison D., Tucker J. P., et al. (2020). Submarine groundwater discharge and associated nutrient and carbon inputs into Sydney Harbor (Australia). J. Hydrology 580. doi: 10.1016/j.jhydrol.2019.124262
Dai G., Wang G., Li Q., Tan E., Dai M. (2021). Submarine groundwater discharge on the western shelf of the northern South China Sea influenced by the Pearl River plume and upwelling. J. Geophysical Research: Oceans 126, e2020JC016859. doi: 10.1029/2020JC016859
Dausman A., Langevin C. D. (2005). “Movement of the saltwater interface in the surficial aquifer system in response to hydrologic stresses and water-management practices, Broward County, Florida,” in US department of the interior, US geological survey. Scientific Investigations Report 2004-5256. doi: 10.3133/sir20045256
Dini A., Till O., Norma A., Nils M. (2019). Environmental impact of nutrient fluxes associated with submarine groundwater discharge at an urbanized tropical coast. Estuary Coast. Shelf Sci. 221, 30–38. doi: 10.1016/j.ecss.2019.03.009
Dulaiova H., Camilli R., Henderson P. B., Charette M. A. (2010). Coupled radon, methane and nitrate sensors for large-scale assessment of groundwater discharge and non-point source pollution to coastal waters. J. Environ. Radioactivity 101, 553–563. doi: 10.1016/j.jenvrad.2009.12.004
Ellins K. K., Roman-Mas A., Lee R. (1990). Using 222Rn to examine groundwater/surface discharge interaction in the Rio Grande de Manati, Puerto Rico. J. Hydrology 115, 319–341. doi: 10.1016/0022-1694(90)90212-G
Fanning K. A., Breland J. A., Byrne R. H. (1982). Radiuin-226 and Radon-222 in the coastal waters of west Florida: High concentrations and atmospheric degassing. Science 215, 667–670. doi: 10.1126/science.215.4533.667
Garcia-Orellana J., Rodellas V., Tamborski J., Diego-Feliu M., van Beek P., Weinstein Y., et al. (2021). Radium isotopes as submarine groundwater discharge (SGD) tracers: Review and recommendations. Earth-Science Rev. 220. doi: 10.1016/j.earscirev.2021.103681
Guo X., Xu B., Burnett W. C., Wei Q., Nan H., Zhao S., et al. (2020). Does submarine groundwater discharge contribute to summer hypoxia in the Changjiang (Yangtze) River Estuary? Sci. Total Environ. 719. doi: 10.1016/j.scitotenv.2020.137450
Han Z., Xie H., Li H., Xie L. (2021). Evolution of the ebb-tidal delta in zhanjiang bay tidal inlet. Mar. Geology Front. 37, 45–50. doi: 10.16028/j.1009-2722.2020.010
Hao L., Yuan J., Zheng L., Zhang J., Zhang D., Dai Y. (2022). Grain-size characteristics of surface sediment and sedimentary evironment in Zhanjiang Bay. Mar. Geology Front. 38 (8), 1–10. doi: 10.16028/j.1009-2722.2021.152
He G., Lao Q., Jin G., Zhu Q., Chen F. (2023). Increasing eutrophication driven by the increase of phosphate discharge in a subtropical bay in the past 30 years. Front. Mar. Sci. 10. doi: 10.3389/fmars.2023.1184421
Hosono T., Ono M., Burnett W. C., Tokunaga T., Taniguchi M., Akimichi T. (2012). Spatial distribution of submarine groundwater discharge and associated nutrients within a local coastal area. Environ. Sci. Technol. 46, 5319–5326. doi: 10.1021/es2043867
Humborg C., Ittekkot V., Cociasu A., Bodungen B. V. (19976623). Effect of Danube River dam on Black Sea biogeochemistry and ecosystem structure. Nature 386, 385–388. doi: 10.1038/386385a0
Hwang D. W., Kim G., Lee Y. W., Yang H. S. (2005). Estimating submarine inputs of groundwater and nutrients to a coastal bay using radium isotopes. Mar. Chem. 94, 61–71. doi: 10.1016/j.marchem.2004.11.002
Kim G., Swarzenski P. W. (2010). “Submarine groundwater discharge (SGD) and associated nutrient fluxes to the coastal ocean,” in Carbon and nutrient fluxes in continental margins: A global synthesis, part III. Arising issues and new approaches, ed. Liu K. K., Atkinson L., Quiñones R., Talaue-McManus L. (Springer-Verlag), 529–538. doi: 10.1007/978-3-540-92735-8_11
Kroeger K., Charette M. (2008). Nitrogen biogeochemistry of submarine groundwater discharge. Limnology Oceanography 53, 1025–1039. doi: 10.4319/lo.2008.53.3.1025
Lamontagne S., La Salle C. L., Hancock G. J., Webster I. T., Simmons C. T., Love A. J. (2008). Radium and radon radioisotopes in regional groundwater, intertidal groundwater, and seawater in the Adelaide Coastal Waters Study area: Implications for the evaluation of submarine groundwater discharge. Mar. Chem. 109, 318–336. doi: 10.1016/j.marchem.2007.08.010
Lao Q., Wu J., Chen F., Zhou X., Li Z., Chen C., et al. (2022). Increasing intrusion of high salinity water alters the mariculture activities in Zhanjiang Bay during the past two decades identified by dual water isotopes. J. Environ. Manage. 320, 115815. doi: 10.1016/j.jenvman.2022.115815
LaRoche J., Nuzzi R., Waters R., Wyman K., Falkowski P., Wallace D. (1997). Brown tide blooms in Long Island’s coastal waters linked to interannual variability in groundwater flow. Global Change Biol. 3, 397–410. doi: 10.1046/j.1365-2486.1997.00117.x
Lee E., Hyun Y., Lee K. K. (2007). Submarine groundwater discharge under extreme rainfall events. Int. Union Geodesy Geophysics. 281–286.
Lee K. Y., Ko K. S. (2021). Measurement of radium and radon in water using a combination technique of radon-emanation and pair-measurements methods. Appl. Radiat. Isot 178, 109950. doi: 10.1016/j.apradiso.2021.109950
Li X., Sun X., Song J., Yao Z. (2011). Numerical simulation of three-dimensional tides and currents in zhanjiang bay. Mar. Sci. Bull. 30, 509–517. doi: 10.11840/j.issn.1001-6392.2011.5.006
Liang D., Zhao X., Chen J., Li K., Cao J. (2016). Soil permeability in relation to groundwater recharge fron rainfall infiltration in the leizhou peninsula. Trop. Geogr. 36, 960–968. doi: 10.13284/j.cnki.rddl.002902
Lin I., Liu W. T., Wu C. C., Wong G. T., Hu C., Chen Z., et al. (2003). New evidence for enhanced ocean primary production triggered by tropical cyclone. Geophysical Res. Lett. 30. doi: 10.1029/2003GL017141
Liu J., Du J., Yu X. (2021a). Submarine groundwater discharge enhances primary productivity in the Yellow Sea, China: Insight from the separation of fresh and recirculated components. Geosci. Front. 12, 101204. doi: 10.1016/j.gsf.2021.101204
Liu H., Guo Z. (2014). A review on submarine groundwater discharge. Adv. Earth Sci. 29, 774–785. doi: 10.11867/j.issn.1001-8166.2014.07.0774
Liu S., Hong G.-H., Zhang J., Ye X., Jiang X. (2009). Nutrient budgets for large Chinese estuaries. Biogeosciences 6, 2245–2263. doi: 10.5194/bg-6-2245-2009
Liu J., Yu X., Peng T., Du J. (2021b). Research progress of submarine groundwater discharge in marine aquaculture. Adv. Earth Sci. 36, 1235–1246. doi: 10.11867j.issn.1001-8166.2021.115
Lopez C. V., Murgulet D., Santos I. R. (2020). Radioactive and stable isotope measurements reveal saline submarine groundwater discharge in a semiarid estuary. J. Hydrology 590. doi: 10.1016/j.jhydrol.2020.125395
Luo X., Jiao J. J., Wang X.-S., Liu K. (2016). Temporal 222Rn distributions to reveal groundwater discharge into desert lakes: Implication of water balance in the Badain Jaran Desert, China. J. Hydrology 534, 87–103. doi: 10.1016/j.jhydrol.2015.12.051
McKenzie T., Dulai H., Fuleky P. (2021). Traditional and novel time-series approaches reveal submarine groundwater discharge dynamics under baseline and extreme event conditions. Science Report 11 (1), 22570. doi: 10.1038/s41598-021-01920-0
Merlivat L., Memery L. (1983). Gas exchange across an air-water interface: Experimental results and modeling of bubble contribution to transfer. J. Geophysical Research: Oceans 88, 707–724. doi: 10.1029/JC088iC01p00707
Moore W. S. (2010). The effect of submarine groundwater discharge on the ocean. Annual Review of. Mar. Sci. 2, 59–88. doi: 10.1146/annurev-marine-120308-081019
Murgulet D., Lopez C. V., Douglas A. R. (2022). Radioactive and stable isotopes reveal variations in nearshore submarine groundwater discharge composition and magnitude across low inflow northwestern Gulf of Mexico estuaries. Sci. Total Environ. 823, 153814. doi: 10.1016/j.scitotenv.2022.153814
Nainggolan L., Ni C. F., Darmawan Y., Lee I. H., Lin C. P., Lin W. C. (2020). Data-driven approach to assess spatial-temporal interactions of groundwater and precipitation in choushui river groundwater basin, Taiwan. Water 12 (11), 3097. doi: 10.3390/w12113097
Pain A. J., Martin J. B., Young C. R. (2021). Biogeochemical and hydrological drivers of heterogeneous nutrient exports from subterranean estuaries. Front. Mar. Sci. 8. doi: 10.3389/fmars.2021.699916
Porcelli D., Swarzenski P. W. (2003). The behavior of U-and Th-series nuclides in groundwater. Rev. Mineralogy Geochemistry 52, 317–361. doi: 10.2113/0520317
Qu W., Li H., Zheng C., Wang C., Wang X. (2017). Seawater-groundwater exchange and nutrients carried by submarine groundwater discharge in different types of wetlands at Jiaozhou Bay, China. J. Hydrology 555, 185–197. doi: 10.1016/j.jhydrol.2017.10.014
Rengarajan R., Sarma V. V. S. S. (2015). Submarine groundwater discharge and nutrient addition to the coastal zone of the Godavari estuary. Mar. Chem. 172, 57–69. doi: 10.1016/j.marchem.2015.03.008
Robinson C., Li L., Prommer H. (2007). Tide-induced recirculation across the aquifer ocean interface. Water Resour. Res. 43. doi: 10.01029/02006WR005679
Robinson C. E., Xin P., Santos I. R., Charette M. A., Li L., Barry. D. A. (2018). Groundwater dynamics in subterranean estuaries of coastal unconfined aquifers: Controls on submarine groundwater discharge and chemical inputs to the ocean. Adv. Water Resources Volume 115, 315–331. doi: 10.1016/j.advwatres.2017.10.041
Santos I. R., Chen X., Lecher A. L., Sawyer A. H., Moosdorf N., Rodellas V., et al. (2021). Submarine groundwater discharge impacts on coastal nutrient biogeochemistry. Nat. Rev. Earth Environ. 2, 307–323. doi: 10.1038/s43017-021-00152-0
Santos I. R., Erler D., Tait D., Eyre B. D. (2010a). Breathing of a coral cay: tracing tidally driven seawater recirculation in permeable coral reef sediments. J. Geophysical Res. 115. doi: 10.11029/12010JC006510
Santos I. R., Eyre B. D., Huettel M. (2012). The driving forces of porewater and groundwater flow in permeable coastal sediments: A review. Estuarine Coast. Shelf Sci. 98, 1–15. doi: 10.1016/j.ecss.2011.10.024
Santos I. R., Peterson R. N., Eyre B. D., Burnett W. C. (2010b). Significant lateral inputs of fresh groundwater into a stratified tropical estuary: evidence from radon and radium isotopes. Mar. Chem. 121, 37–48. doi: 10.1016/j.marchem.2010.03.003
Savatier M., Rocha C. (2021). Rethinking tracer-based (Ra, Rn, salinity) approaches to estimate point-source submarine groundwater discharge (SGD) into coastal systems. J. Hydrology 598. doi: 10.1016/j.jhydrol.2021.126247
Schulz H. D. (2000). Quantification of early diagenesis: dissolved constituents in marine pore water. in Marine Geochemistry, ed. Schulz H. D., Zabel M. (Berlin, Heidelberg: Springer-Verlag). doi: 10.1007/978-3-662-04242-7_3
Seitzinger S. P. (1988). Denitrification in freshwater and coastal marine ecosystems: ecological and geochemical significance. Limnology oceanography 33, 702–724. doi: 10.4319/lo.1988.33.4_part_2.0702
Shi Y., Jia L., Zhang H. (2020). Analysis of water residence time and influencing factors in zhanjiang bay. Environ. Sci. Technol. 43, 17–24. doi: 10.19672/j.cnki.1003-6504.2020.11.003
Silbiger N., Donahue M., Lubarsky K. (2020). Submarine groundwater discharge alters coral reef ecosystem metabolism. Proc. R. Soc. B. 287 (1914). doi: 10.1098/rspb.2020.2743
Stellato L., Petrella E., Terrasi F., Belloni P., Belli M., Sansone U., et al. (2008). Some limitations in using 222Rn to assess river–groundwater interactions: the case of Castel di Sangro alluvial plain (central Italy). Hydrogeology J. 16, 701–712. doi: 10.1007/s10040-007-0263-0
Su N., Du J., Moore W. S., Liu S., Zhang J. (2011). An examination of groundwater discharge and the associated nutrient fluxes into the estuaries of eastern Hainan Island, China using 226Ra. Sci. Total Environ. 409, 3909–3918. doi: 10.1016/j.scitotenv.2011.06.017
Sun L., Yang Y.-J., Xian T., Lu Z.-M., Fu Y.-F. (2010). Strong enhancement of chlorophyll a concentration by a weak typhoon. Mar. Ecol. Prog. Ser. 404, 39–50. doi: 10.3354/meps08477
Tait D. R., Santos I. T., Erler D. V., Befus K. M., Cardenas M. B. (2013). Estimating submarine groundwater discharge in a South Pacific coral reef lagoon using different radioisotope and geophysical approaches. Mar. Chem. 156, 49–60. doi: 10.1016/j.marchem.2013.03.004
Tan E., Wang G., Moore W. S., Li Q., Dai M. (2018). Shelf-scale submarine groundwater discharge in the northern South China Sea and East China Sea and its geochemical impacts. J. Geophysical Research: Oceans 123, 2997–3013. doi: 10.1029/2017JC013405
Taniguchi M., Burnett W. C., Cable J. E., Turner J. V. (2002). Investigation of submarine groundwater discharge. Hydrological Processes 16. doi: 10.1002/hyp.1145
Taniguchi M., Ishitobi T., Shimada J. (2006). Dynamics of submarine groundwater discharge and freshwater-seawater interface. J. Geophysical Res. 111. doi: 10.1029/2005JC002924
Tse K. C., Jiao J. J. (2008). Estimation of submarine groundwater discharge in Plover Cove, Tolo Harbour, Hong Kong by Rn-222. Mar. Chem. 111, 160–170. doi: 10.1016/j.marchem.2008.04.012
Turner R. E., Rabalais N. N. (1994). Coastal eutrophication near the Mississippi river delta. Nature 368, 619–621. doi: 10.1038/368619a0
Ullman W. J., Aller R. C. (1982). Diffusion coefficients in nearshore marine sediments 1. Limnology Oceanography 27, 552–556. doi: 10.4319/lo.1982.27.3.0552
Valiela I., Costa J., Foreman K., Teal J. M., Howes B., Aubrey D. (1990). Transport of groundwater-borne nutrients from watersheds and their effects on coastal waters. Biogeochemistry 10, 177–197. doi: 10.1007/BF00003143
Valiela I., Foreman K., LaMontagne M., Hersh D., Costa J., Peckol P., et al. (1992). Couplings of watersheds and coastal waters: sources and consequences of nutrient enrichment in Waquoit Bay, Massachusetts. Estuaries 15, 443–457. doi: 10.2307/1352389
Wang X. (2017). Study on submarine groundwater discharge (SGD) and its driven nutrient fluxes from typical area in costal sea of China (East China Normal University).
Wang Y., Chen G., Yu H., Xu X., Liu W., Fu T., et al. (2022a). Distribution of 222Rn in seawater intrusion area and its implications on tracing submarine groundwater discharge on the Upper Gulf of Thailand. Lithosphere 2022, 2039170. doi: 10.2113/2022/2039170
Wang P., Lao Q., Wu J., Wang C., Lu X., Zhu Q., et al. (2022b). Distribution characteristics and influencing factors of chemical oxygen demand in Zhanjiang Bay water body. Guangxi Sci. 29, 498–510. doi: 10.13656/j.cnki.gxkx.20220616.001
Wang X., Li H., Zang Y., Qu W., Schubert M. (2019). Submarine groundwater discharge revealed by 222Rn: comparisonof two continuous on-site 222Rn-in-water measurement methods. Hydrogeology J. 27), 1879–1887. doi: 10.1007/s10040-019-01988-z
Wang X., Li H., Zhang Y., Zheng C., Gao M. (2020). Investigation of submarine groundwater discharge and associated nutrient inputs into Laizhou Bay (China) using radium quartet. Mar. pollut. Bull. 157. doi: 10.1016/j.marpolbul.2020.111359
Wang S., Zhou F., Chen F., Meng Y., Zhu Q. (2021). Spatiotemporal distribution characteristics of nutrients in the drowned tidal inlet under the influence of tides: A case study of Zhanjiang bay, China. Int. J. Environ. Res. And Public Health 18, 2089. doi: 10.3390/ijerph18042089
Wen H. (2013). Study on circulation pattern and the numercial modeling of groundwater in Leizhou Peninsula (China University of Geosciences (Wuhan).
Wilson S. J., Moody A., Mckenzie T., Cardenas M. B., Luijendijk E., Sawyer A. (2024). Global subterranean estuaries modify groundwater nutrient loading to the ocean. Limnology Oceanography Lett. 9, 411–422. doi: 10.1002/lol2.10390
Wu J., Lu L. (2011). Uncertainty analysis for groundwater modeling. J. Nanjing University(Natural Sciences) 47, 227–234. doi: 10.13232/j.cnki.jnju.2011.03.009
Yang W., Peng X., Guo Z., Du M. (2018). Observation methods and environmental impact assessment of submarine groundwater discharge in the coastal area. Environ. Eng. 36, 6. doi: 10.13205/j.hjgc.201801029
Yang P., Zhang Y., Wang J., Xie S. (2017). Geochemical dynamics of river water-groundwater lateral interaction zone under the influence of water level changes. Adv. Water Sci. 28, 293–301. doi: 10.14042/j.cnki.32.1309.2017.02.015
Yu J., Chen G., Huang Z., Chen Z. (2014). Changes in the coastline og Three Typical Bays in Guangdong During Recent 10 Years Revealed by Satellite Image. Trans. Oceanology Limnology 3), 91–96. doi: CNKI:SUN:HYFB.0.2014-03-013
Yuan X., Zhanrong G., Zhiyong M., Bin Z., Jie L. (2015). The evaluation of submarine groundwater discharge in jiaozhou bay based on 222Rn mass balance. Acta Geoscientica Sin. 36, 237–244. doi: 10.3975/cagsb.2015.02.1
Zhang Y., Li H., Wang X., Zheng C., Wang C., Xiao K., et al. (2016). Estimation of submarine groundwater discharge and associated nutrient fluxes in eastern Laizhou Bay, China using 222Rn. J. Hydrology 533, 103–113. doi: 10.1016/j.jhydrol.2015.11.027
Zhou F., Xiong M., Wang S., Tian S., Jin G., Chen F. (2022). Impacts of human activities and environmental changes on spatial-seasonal variations of metals in surface sediments of Zhanjiang Bay, China. Front. Mar. Sci. 9. doi: 10.3389/fmars.2022.925567
Zhu A., Saito M., Onodera S.-I., Shimizu Y., Jin G., Ohta T., et al. (2019). Evaluation of the spatial distribution of submarine groundwater discharge in a small island scale using the 222Rn tracer method and comparative modeling. Mar. Chem. 209, 25–35. doi: 10.1016/j.marchem.2018.12.003
Keywords: submarine groundwater discharge, seasonal variation, nutrients, 222 Rn, Zhanjiang Bay
Citation: Lin X, Chen X, Chen F, Jin G, Wang C, Mayakrishnan M, Shi Z and Si X (2024) Seasonal dynamics of submarine groundwater discharge in Zhanjiang Bay: an investigative study utilizing 222Rn as a tracer. Front. Mar. Sci. 11:1451533. doi: 10.3389/fmars.2024.1451533
Received: 19 June 2024; Accepted: 29 July 2024;
Published: 27 August 2024.
Edited by:
Qinsheng Wei, Ministry of Natural Resources, ChinaReviewed by:
Zhuo-Yi Zhu, Shanghai Jiao Tong University, ChinaBin Yang, Jiangsu Ocean University, China
Copyright © 2024 Lin, Chen, Chen, Jin, Wang, Mayakrishnan, Shi and Si. This is an open-access article distributed under the terms of the Creative Commons Attribution License (CC BY). The use, distribution or reproduction in other forums is permitted, provided the original author(s) and the copyright owner(s) are credited and that the original publication in this journal is cited, in accordance with accepted academic practice. No use, distribution or reproduction is permitted which does not comply with these terms.
*Correspondence: Guangzhe Jin, amluZ3pAZ2RvdS5lZHUuY24=