 Ni Xin
 Zhao Li3†
 Xiao-Long Lin
- 1Engineering Research Center of Environmental DNA and Ecological Water Health Assessment, Shanghai Ocean University, Shanghai, China
- 2Shanghai Universities Key Laboratory of Marine Animal Taxonomy and Evolution, Shanghai Ocean University, Shanghai, China
- 3China National Environmental Monitoring Centre, Water Ecological Environment Monitoring Department, Beijing, China
- 4Liaoning Province Ecological Environment Monitoring Center, Ecological Monitoring and Assessment Department, Shenyang, China
- 5Shanghai Academy of Environmental Sciences, Institute of Applied Ecology, Shanghai, China
The escalating environmental changes are imposing multiple pressures on biodiversity conservation, thereby, more attention has been paid to fish diversity and community assembly patterns. Fish diversity in Liaohe River has deteriorated significantly due to overfishing, environmental pollution and other reasons, in addition, no fish survey related research has been published in Liaohe National Park in recent years. In order to study the diversity of fish species in the area and to investigate the presence of any invasive species. This study used eDNA metabarcoding to explore the distribution and diversity of fish communities in the Liaohe National Park. The study showed that a total of 54 species of fish from six orders, 14 families, and 39 genera were detected, meantime, the invasive species Lepomis cyanellus was found at two sampling sites. The α-diversity results showed that estuarine sites had the highest species diversity. The spatial structure of fish communities in the upstream and downstream reaches were similar as indicated by non-metric multidimensional scaling. In our study, the fish community is influenced by both deterministic and stochastic processes, with the stochastic processes being the main factor. The potential existence of L. cyanellus in Liaohe National Park might be resulted from aquaculture, ornamental pet trade, other economic fish farming, artificial release. The relatively low number of fish species in this study may be attributed to the limited number of sampling events and sampling sites. In addition to these factors, over exploitation of resources, water pollution, and the invasion of alien species have directly impacted the biodiversity of aquatic life. The results of this study lay a foundation for the future biodiversity investigation in National Parks of China, meantime, the use of eDNA monitoring is crucial to prevent, to control and limit the spreading of invasive species in advance.
1 Introduction
Rivers cover less than 1% of the Earth’s surface, yet they represent a rich biodiversity, including nearly 18,000 species of fish and a quarter of the world’s vertebrates (Allen and Pavelsky, 2018; Su et al., 2021, Van der Laan, 2020). With intensifying economic development and anthropogenic activities, biological invasions are threatening China’s biodiversity with unparalleled magnitude (Lin et al., 2015; Liu et al., 2017; Liu et al., 2019). In addition, due to population growth and industrialization, most aquatic ecosystems are polluted, and the quality of the environment is deteriorating. The loss of biodiversity in freshwater ecosystems is accelerating (Comte and Olden, 2017; Ahmed et al., 2022). The severe decline of aquatic species resources has become a prominent issue affecting ecological safety. Freshwater fish are an important part of freshwater ecosystems, with more than 10,000 fish species living in freshwater, accounting for approximately 40% of the world’s fish species and a quarter of the world’s vertebrates (Lundberg et al., 2000). Estuarine fish inhabit the dynamic environment where freshwater and seawater meet, and thus must adapt to a range of environmental pressures, including fluctuations in salinity, temperature variations, and tidal cycles. These fish possess physiological adaptations such as osmoregulatory mechanisms and specialized respiratory adaptations, enabling them to survive and reproduce in this highly variable ecological setting (Whitfield, 2021). The physiological traits of estuarine fish are not only crucial for their own survival but also provide significant biological information for studying how organisms adapt to environmental changes (Xian et al., 2016). Within the phylum Chordata, the class of fish is the most primitive and also the most diverse, representing a typical group of poikilothermic animals living in aquatic environments (Yan and Xie, 2012). Located in the middle to upper levels of the food chain in aquatic ecosystems and with different sensitivity to pollution, they have been widely regarded as useful indicators of environmental water quality (Obinna et al., 2019). Compared with other aquatic organisms, fish have a wide distribution and long lifespan, which can provide long-term records of environmental stress and play an important role in biomonitoring. Therefore, the changes of fish species diversity and composition are of great scientific significance for the assessment of aquatic ecosystem health (Minamoto et al., 2018; Zhang et al., 2022).
Traditionally, biodiversity monitoring is based on morphology, usually limited to local scales and focused on limited biological groups (Baird and Hajibabaei, 2012; Cavaliere et al., 2021). Compared with terrestrial organisms, aquatic organisms have a wide variety of species and complex community structure, and many biological groups are characterized by small size, small population size at the initial stage of colonization, hidden underwater, and lack of external forms that can be used for species identification, which makes it more challenging at the technical level to build an early detection/monitoring and early warning system in aquatic ecosystems (Xiong et al., 2016; Li et al., 2019). As an emerging technology, environmental DNA (eDNA) metabarcoding offers a non-invasive tools and was expected to provide qualitative and quantitative analysis of biological communities by detecting the short DNA fragments left in the environment by biological tissues, secretions, excreta, blood, and corpses (Doi et al., 2017; Minamoto et al., 2018; Itakura et al., 2019). Many studies have proven that eDNA surveys have higher sensitivity and effectiveness than traditional survey methods such as capture or observation (Biggs et al., 2015; McKee et al., 2015; Katano et al., 2017). It has been widely applied in biodiversity research studies (Foote et al., 2012; Beng and Corlett, 2020). The monitoring of the Liaohe National Park adopted the method of eDNA, which can serve as a beneficial supplement to traditional survey methods for discovering endangered species, invasive species, and other species that were not easily discovered.
Fish community aggregation is influenced by two types of processes: deterministic and stochastic (Zhou and Ning, 2017). Deterministic processes are linked to ecological selection, encompassing environmental filtering and a variety of biological interaction mechanisms such as predation, parasitism, symbiosis, cooperation, and competition (Vellend, 2010). Stochastic processes comprise unpredictable perturbations, ecological drift, and diffusion events that are not the adaptive outcomes determined by the environment (Chase and Myers, 2011).
The Liaohe River basin is the largest one in the Northeast region, spanning four provinces in China, mainly located in Liaoning Province (Gao et al., 2015). According to previous research, a total of 103 species of freshwater fish from 20 families have been recorded, providing an ideal platform for studying the complex interactions among fish and their responses to ecological factors (Luo et al., 2020). The Liaohe National Park includes the Liaohe River Mainstream Protection Area and the Liaohe River Estuary National Nature Reserve, with a total area of over 170,000 hectares, making it the most biodiverse area in the region. The downstream area near the estuary of the Liaohe National Park is characterized as an estuarine region. Due to the estuary’s rich nutrients, diverse habitats, and migratory pathways, the estuarine area is endowed with abundant biodiversity (González-Sansón et al., 2022). However, due to overfishing, environmental pollution, and other reasons, the diversity of fish in the Liaohe River has significantly deteriorated, and no reports of using eDNA metabarcoding to investigate fish diversity (Wei et al., 2023).
In this study, eDNA metabarcoding technology was used to monitor fish diversity at 11 sites in Liaohe National Park. The objectives are: (1) to evaluate the spatial pattern of fish biodiversity by calculating α, β diversity index, exploring the formation of fish communities and the relationship with environmental factors; (2) to study the assembly mechanism of fish communities in Liaohe National Park.
2 Materials and methods
2.1 Sample collection and processing
In September 2022, our fieldwork was conducted in Liaohe National Park. We established a total of 11 sampling sites, including Tieling City, Panjin City, Shenyang City, and Anshan City (Supplementary Table S1, Figure 1). The upstream sites in Tieling City involves seven sites: FD, TJ, HH, SH, QL, DDQ, ZE, the downstream sites in Shenyang City, Anshan City, and Panjin City involve four sites: MH, HM, XA, SG. For each sample, to minimize random errors and ensure accuracy, we combined water samples from different areas around each sampling site before collecting them. we collected three repeated samples, with each sample containing 2 L of water. As a negative control, we used sterile water (2 L). We captured eDNA using mixed cellulose ester membranes with a pore size of 3 μm. The eDNA was stored in 1 mL of 2×CTAB buffer at -20°C. Additionally, we measured several physical-chemical indicators: pH, dissolved oxygen (DO), and turbidity (TUR). These measurements were taken using a portable instrument (YSI ProDSS, USA). Furthermore, we quantified the following parameters through spectrophotometry (SP): permanganate index (CODMn), ammonia nitrogen (NH3-N) and phosphorus (TP), Plumbum (TPb), hydrargyrum (THg). Additionally, we determined the Chemical Oxygen Demand (CODCr) using the dichromate method and assessed the Biochemical Oxygen Demand (BOD) through dilution and seeding.
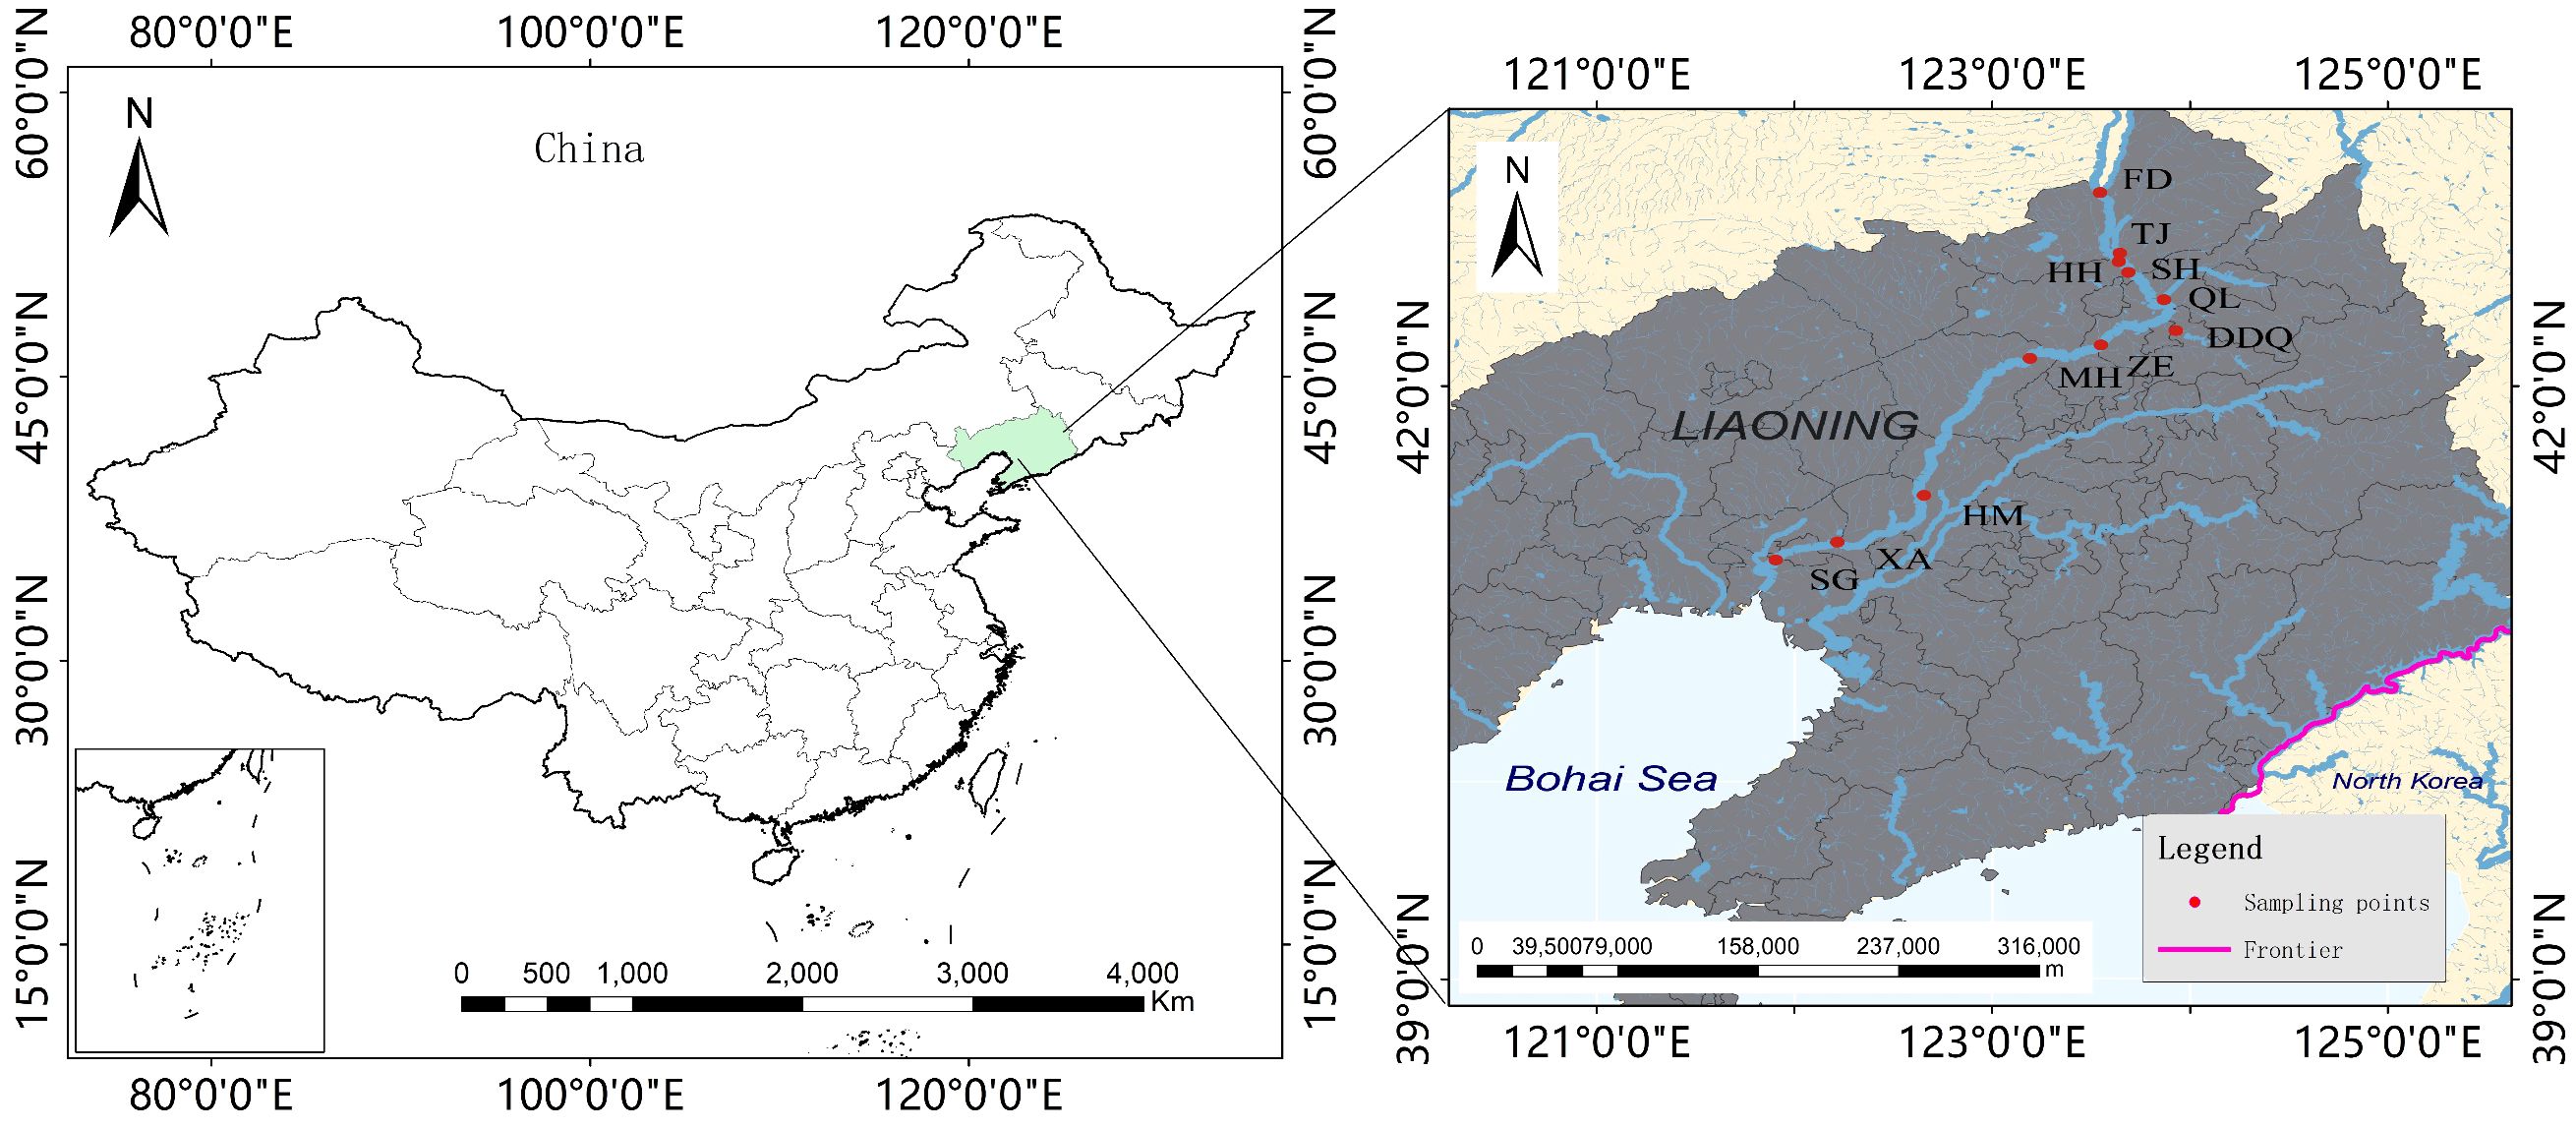
Figure 1 Distribution of 11 sample sites in Liaohe National Park. This figure depicts the spatial distribution of the sampling sites within the Liaohe National Park area. Each dot represents an individual sampling site, and the purple line delineates the border between China and North Korea.
2.2 DNA extraction
DNA extraction was implemented with the phenol-chloroform-isopropanol method. The samples were first heated with a 65°C-water bath for 10 min and mix with equal volume of phenol chloroform (25:24:1), the solution was then centrifuged at 7000 rpm at room temperature for 15 min. we mixed 1 mL supernatant with 500 µL precool isopropanol and 250 µL of 5 M NaCl, and then leave them under -20°C for 1 h. After centrifuge at 15,000 rcf at room temperature for 15 min, and twice washing with 70% ethanol, DNA was dried and dissolved with 100 µL of TE buffer. Gel electrophoresis and spectrophotometric method (Thermo Scientific NanoDrop 3300, Thermo Fisher Scientific, USA) were used to check the quality of DNA.
2.3 DNA amplification and library construction
PCR amplification was performed using the universal primer MiFish-U (mitochondrial 12S rRNA, targeting 170 bp, M-F1:GTCGGTAAAACTCGTGCCAG-C; M-R1:CATAGTGGGGTATCTAATCCCAGTTTG) (Miya et al., 2015). We use two-step method for library construction. The volume of first PCR was 10 μL, which included 5 μL of 2×Taq Master Mix (vazamy), 0.4 μL of each forward and reverse primers (10 μmol·L-1), and 4.2 μL of DNA template. The PCR program implemented with pre-denaturation at 95°C for 3 min; followed with 35 cycles of denaturation at 95°C for 15 s, annealing at 60°C for 20 seconds and extension at 72°C for 60 s, with a final extension at 72°C for 5 min. To add the adaptors for sequencing, second step of PCR were implemented with total volume of 10 μL, which includes 5 μL of 2×Taq, 0.4 μL each adapter (10 μmol·L-1), 1.2 μL of product of first PCR, and 3 μL of ddH2O. The PCR program was set as follows: pre-denaturation at 98°C for 45 s; with 15 cycles of denaturation at 98°C for 15 s, annealing at 60°C for 30 s and extension at 72°C for 45 s, followed a final extension at 72°C for 1 min. Each sample has three technical repetitions, Genomic DNA was used as positive control and sterile water was used as negative control, respectively. The PCR products were pooled in equimolar ratio for 150 bp paired-end sequencing on an Illumina NovaSeq 6000 at Novogene (Beijing, China).
2.4 Bioinformatics analysis
After acquiring all the sequencing data, we conducted all bioinformatic analyses on a Linux server. Primers were removed from reads using Cutadapt v2.9 (Martin, 2011), reads were trimmed using fastp v0.20.1 (Chen et al., 2018), setting the quality threshold at 15, the minimum length at 50 bp, and limiting the proportion of bases with low QV to no more than 2%. Then denoised, dereplicated, merged and cleaned of chimaeras in dada2 v1.14.1 (Callahan et al., 2016). The remaining sequences were clustered into Operational Taxonomic Units (OTUs) with 97% threshold. Taxonomic assignments to species level were made using a reference database and processed with BLASTN v2.3.31 (Camacho et al., 2009). To achieve a higher ratio of assignment, thresholds were gradually relaxed, for example, to 97% similarity for genus level and 95% similarity for family level. The NCBI (https://www.ncbi.nlm.nih.gov) public nucleotide database and mitochondrial genomes from Mitofish (Zhu et al., 2023) (http://mitofish.aori.utoko.ac.jp/download.html) were selected as reference library.
2.5 Statistical analysis
Statistical analysis was conducted using R v4.2.2 (R Core Team, 2022). The relative abundance of species sequences was calculated based on the number of species and sequences at different classification levels. Quantitative analysis was performed using the species sequence abundance data from each sampling site (Lagkouvardos et al., 2017). The upset plot was used to visualize the number of species intersections across different sampling sites. We calculated α diversity and β diversity using the ‘vegan’ package (v 2.6-4) in R. The ranked distances among sites were calculated using the Euclidean correlation coefficient. The NMDS scores for each site represented the similarity or dissimilarity of fish communities across all sampling sites. To explore the relationship between community species composition and environmental variables, we performed Redundancy Analysis (RDA) (Dixon, 2003). We calculated the beta nearest taxonomic index (βNTI) and Raup-Crick matrix (RCbray) using the picante package (Chase et al., 2011; Ni et al., 2021) to investigate the assembly mechanism of the fish community. Relationships between community assembly processes (βNTI) and the changes in environmental variables were assessed using the Spearman’s correlation coefficients.
The value of βNTI indicating that whether the variation between two communities were influenced by deterministic or random factors. |βNTI|>2 indicates that the observed difference between two communities is primarily due to a deterministic process (Zhou and Ning, 2017), where βNTI>2 means a heterogeneous selection process and βNTI<-2 means a homogeneous selection process. When |βNTI|<2, community establishment is stochastic, and probabilistic diffusion occurred at |RCbray|>0.95, where diffusion was limited when RCbray>0.95 (dispersal limitation), and homogeneous dsipersal when RCbray<-0.95. The undominated processes at |RCbray|<0.95, including drift, diversification, weak diffusion and weak selection, could be simply classified as ecological drift processes.
3 Results
3.1 Fish species composition
We obtained a total of 36,973,094 sequence reads from 11 sites within the Liaohe National Park. Out of these, 4,936,154 reads were assigned to 98 OTUs. Our analysis detected a total of 54 fish species, which belong to 39 genera, 14 families, and six orders, including an invasive species, Lepomis cyanellus (Supplementary Table S2). The number of sequences of the L. cyanellus detected at the sites HM, MH, QL, XA, and DDQ were 2111, 164, 2, 1, 1, respectively. The Cypriniforms represented the largest number of species and accounted for the highest proportion of fishes (68.52%). They were followed by the Perciformes (18.52%), the Siluriformes (5.56%), and other orders (7.40%) (Figure 2A). At the family level, the Cyprinidae had the most species, with a total of 22 species, representing 40.74% of the total number of species. The Gobiidae and Gobionidae each had six species, accounting for 11.11% each. The Acheilognathidae had four species, making up 7.41% of the total number of species. The Cobitidae includes three species of fish, accounting for 5.56% of the total fish population. The Bagridae, Siluridae, Odontobutidae and Nemacheilidae, each had two species, each accounting for 3.70% of the total number of species. Other families accounted for a total of 9.26% (Figure 2B; Supplementary Table S2). Based on the number of reads detected at each sampling site, we have illustrated the top 30 fish species in Figure 3A, and the top 10 dominant species in Figure 3B. Notably, Hypophthalmichthys molitrix, Cyprinus carpio, Hypophthalmichthys nobilis, Rhinogobius similis, Plagiognathops microlepis, Hemiculter leucisculus, Acheilognathus macropterus, and Acheilognathus barbatus were detected in all 11 sampling sites.
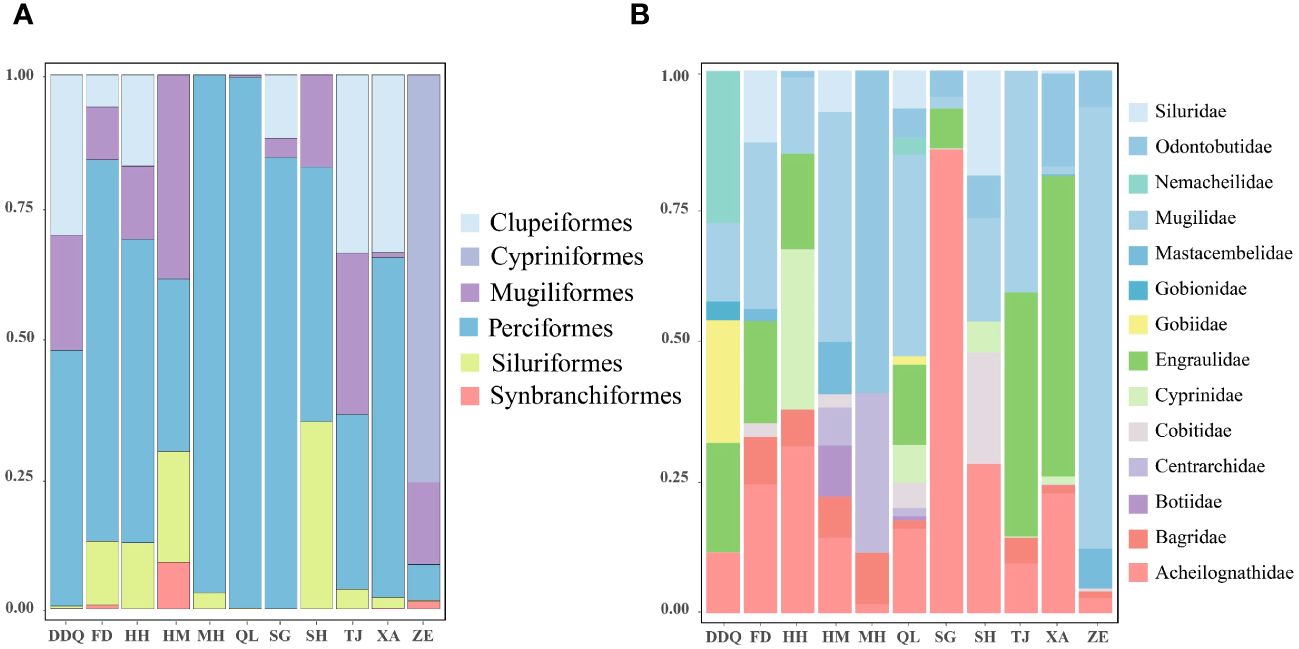
Figure 2 Order (A) and Family (B) at the proportion of different sampling sites. Relative abundance of different fish species at different sampling sites. Each bar in the chart represents the variety of fish species found at different sampling sites, divided into distinct segments corresponding to different species. Each species is assigned a unique color to facilitate species identification. The X-axis is the coordinate information of the sampling sites, The Y-axis is the proportion of Order (A). The X-axis is the coordinate information of the sampling sites, The Y-axis is the proportion of Family (B).
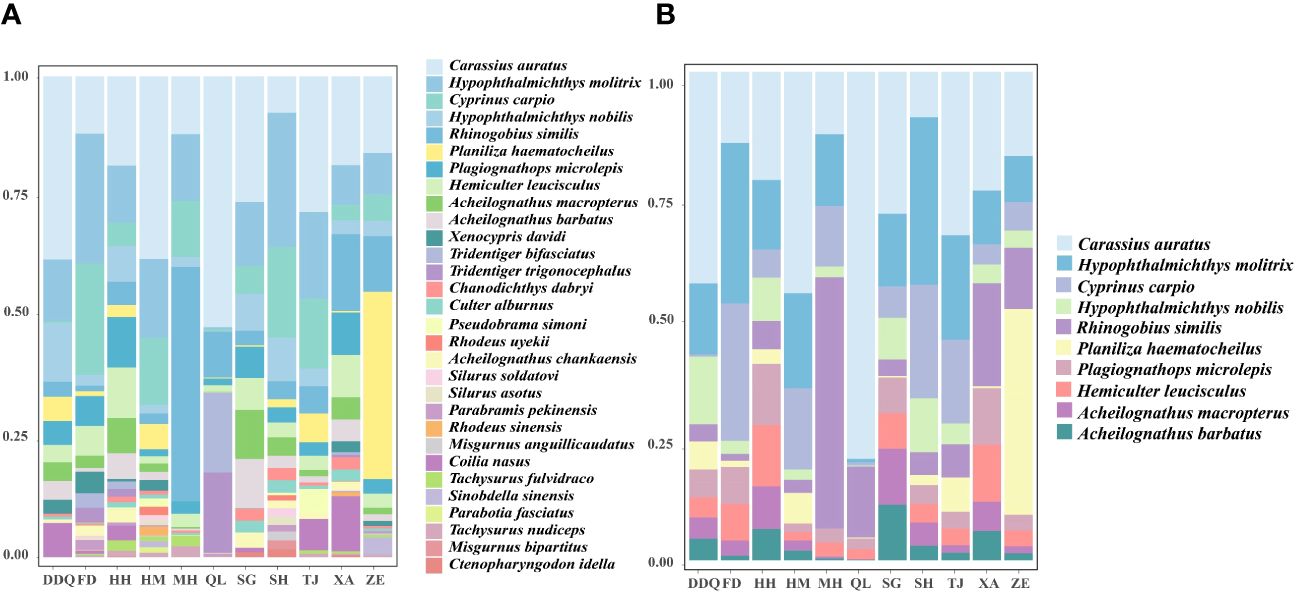
Figure 3 Relative abundance of the top 30 fish species (A). Composition of dominant fish species at each sampling station (B). Each bar in the chart represents the variety of fish species found at different sampling sites, divided into distinct segments corresponding to different species. Each species is assigned a unique color to facilitate species identification. The X-axis is the coordinate information of the sampling sites, The Y-axis is the proportion of the top 30 fish species (A). The X-axis is the coordinate information of the sampling sites. The Y-axis is the proportion of dominant fish (B).
3.2 Analysis of fish species differences among samples
The results of the upset diagram (Figure 4) showed that all samples shared a common number of 12 OTUs. The heatmap of the top 30 fish species with high abundance (Figure 5) more clearly displayed the differences in fish composition at different sites. From the perspective of site clustering, the species distributions at sites HH and SG, MH and ZE, and DDQ and XA exhibited a high degree of similarity. From the species clustering perspective, Pachysurus fulvidraco and Pachysurus nudiceps, Parabotia fasciatus and Rhodeus sinensis, P. microlepis and H. leucisculus, Misgurnus bipartitus and Ctenopharyngodon idella had the most similar distributions across different sites. Site HM exhibited the greatest species diversity.
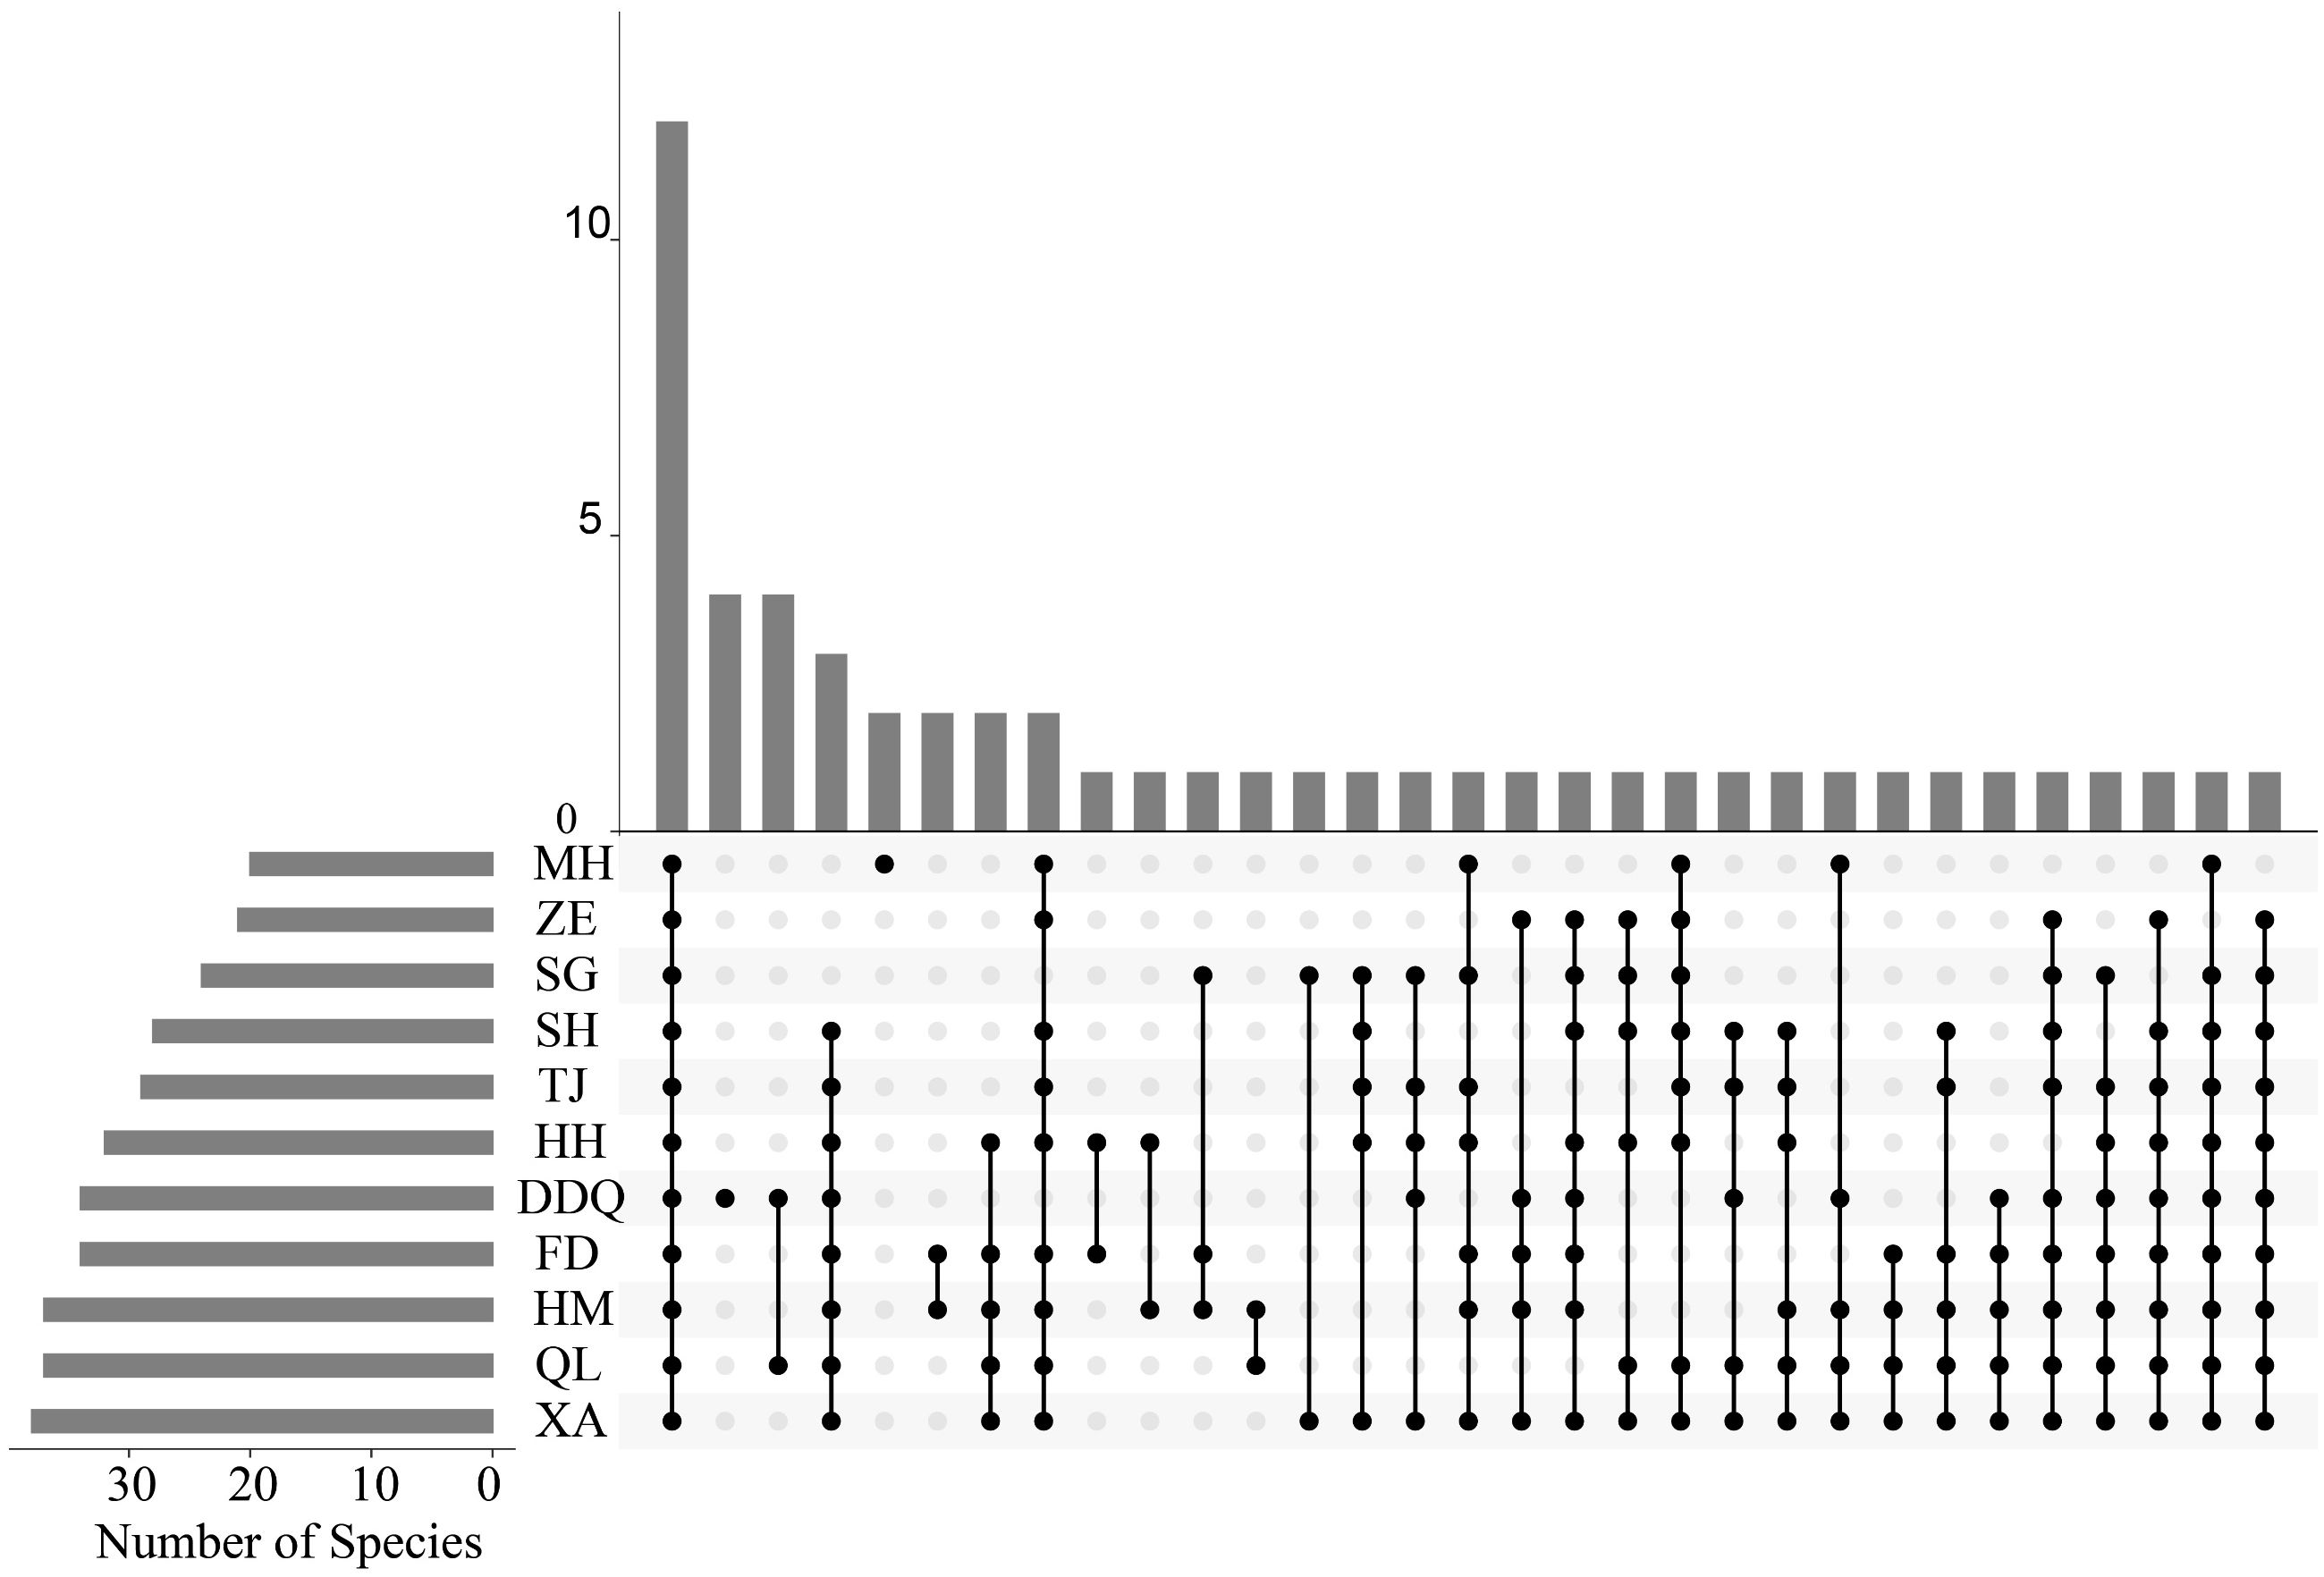
Figure 4 OTU upset of different sampling stations in Liaohe National Park. The plot is composed of a set of horizontal bars that represent individual species, with the occurrence of each species on the x-axis and the number of sites where the species was found on the y-axis. Intersection points between bars indicate species that co-occur, and the width of each section is proportional to the number of sites where the intersection of species occurs.
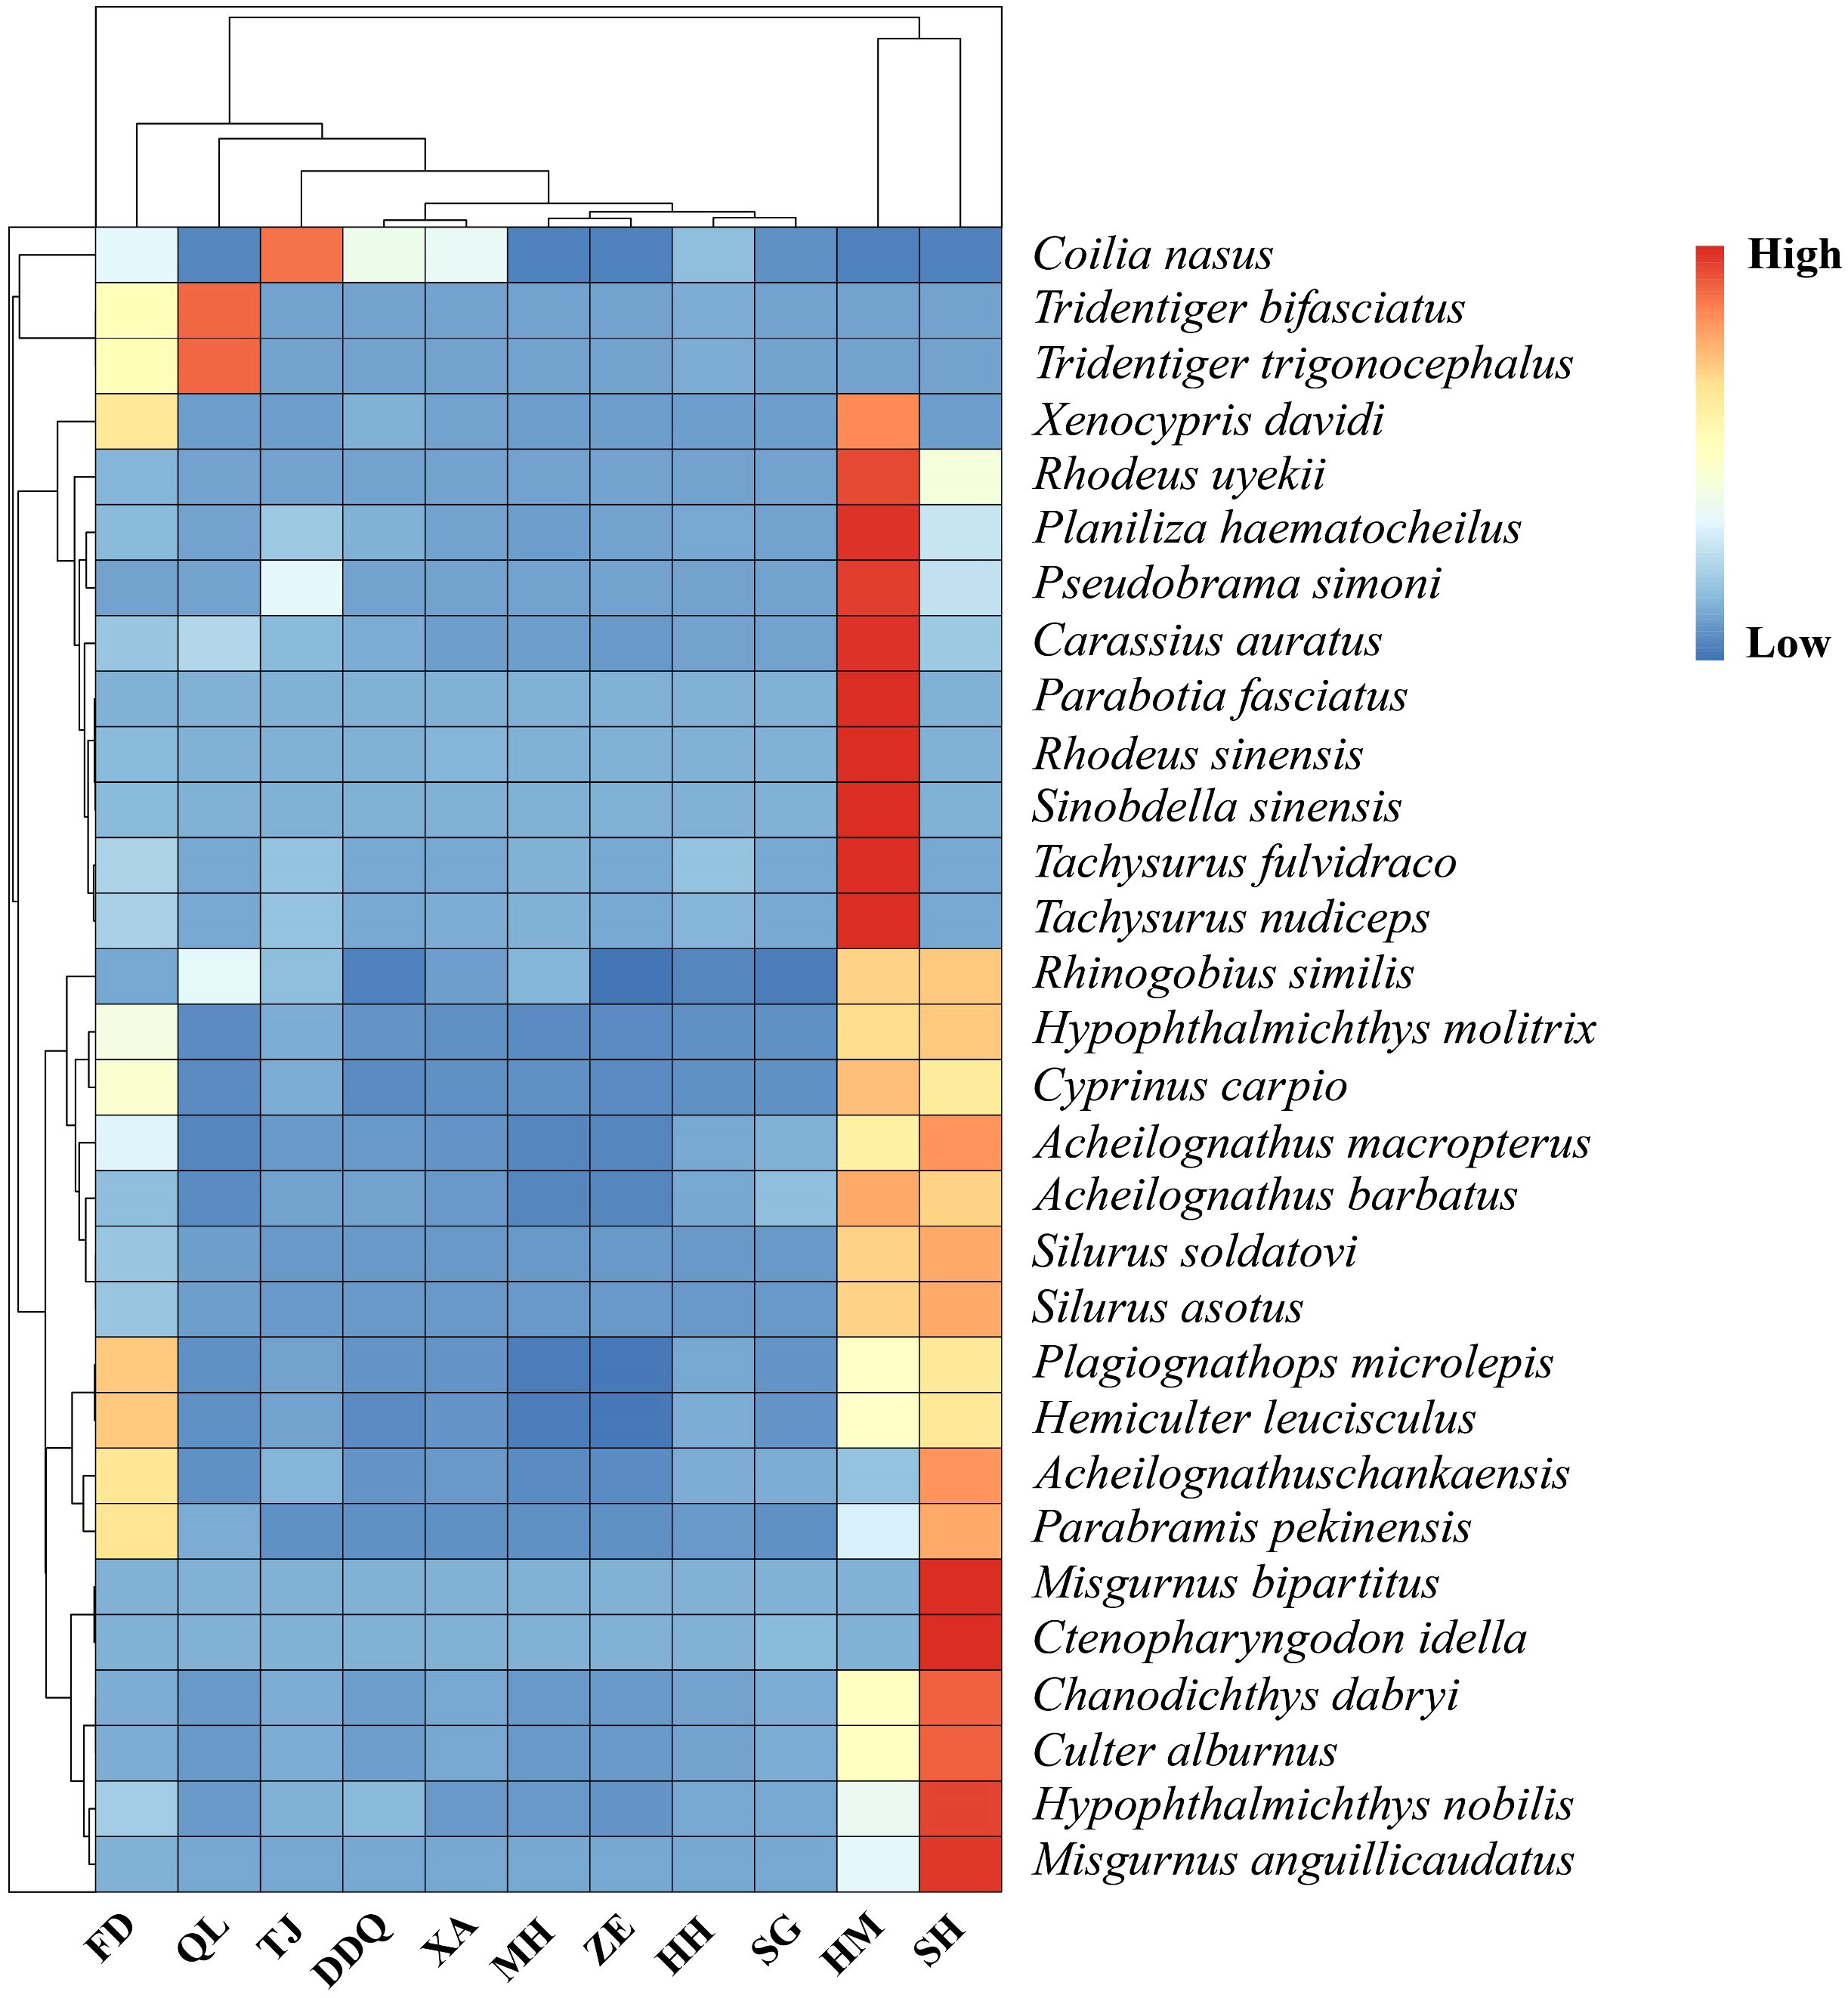
Figure 5 Clustering heatmap of the top 30 dominant fish species. The heatmap provides a visual representation of fish richness at various sampling sites within the Liaohe National Park. The intensity of the colors in the heatmap reflects the abundance of fish recorded at each site, as indicated by the color bar on the right, with darker shades of red indicating a higher number of species, the gradient from red to blue signifies that the abundance in the corresponding samples gradually decreases.
3.3 Fish species diversity and β diversity analysis
Community richness and diversity of downstream were higher than upstream (Supplementary Figure S1). Site ZE owns the lowest richness and diversity (Figure 6), which was consistent with the results of the heatmap of the first 30 fish species with high abundance described (Figure 5), while site SG had the highest diversity among all sampling sites. As can be seen from the Figure 7, the upstream and downstream communities almost overlap, indicating that there is no difference between the two communities.
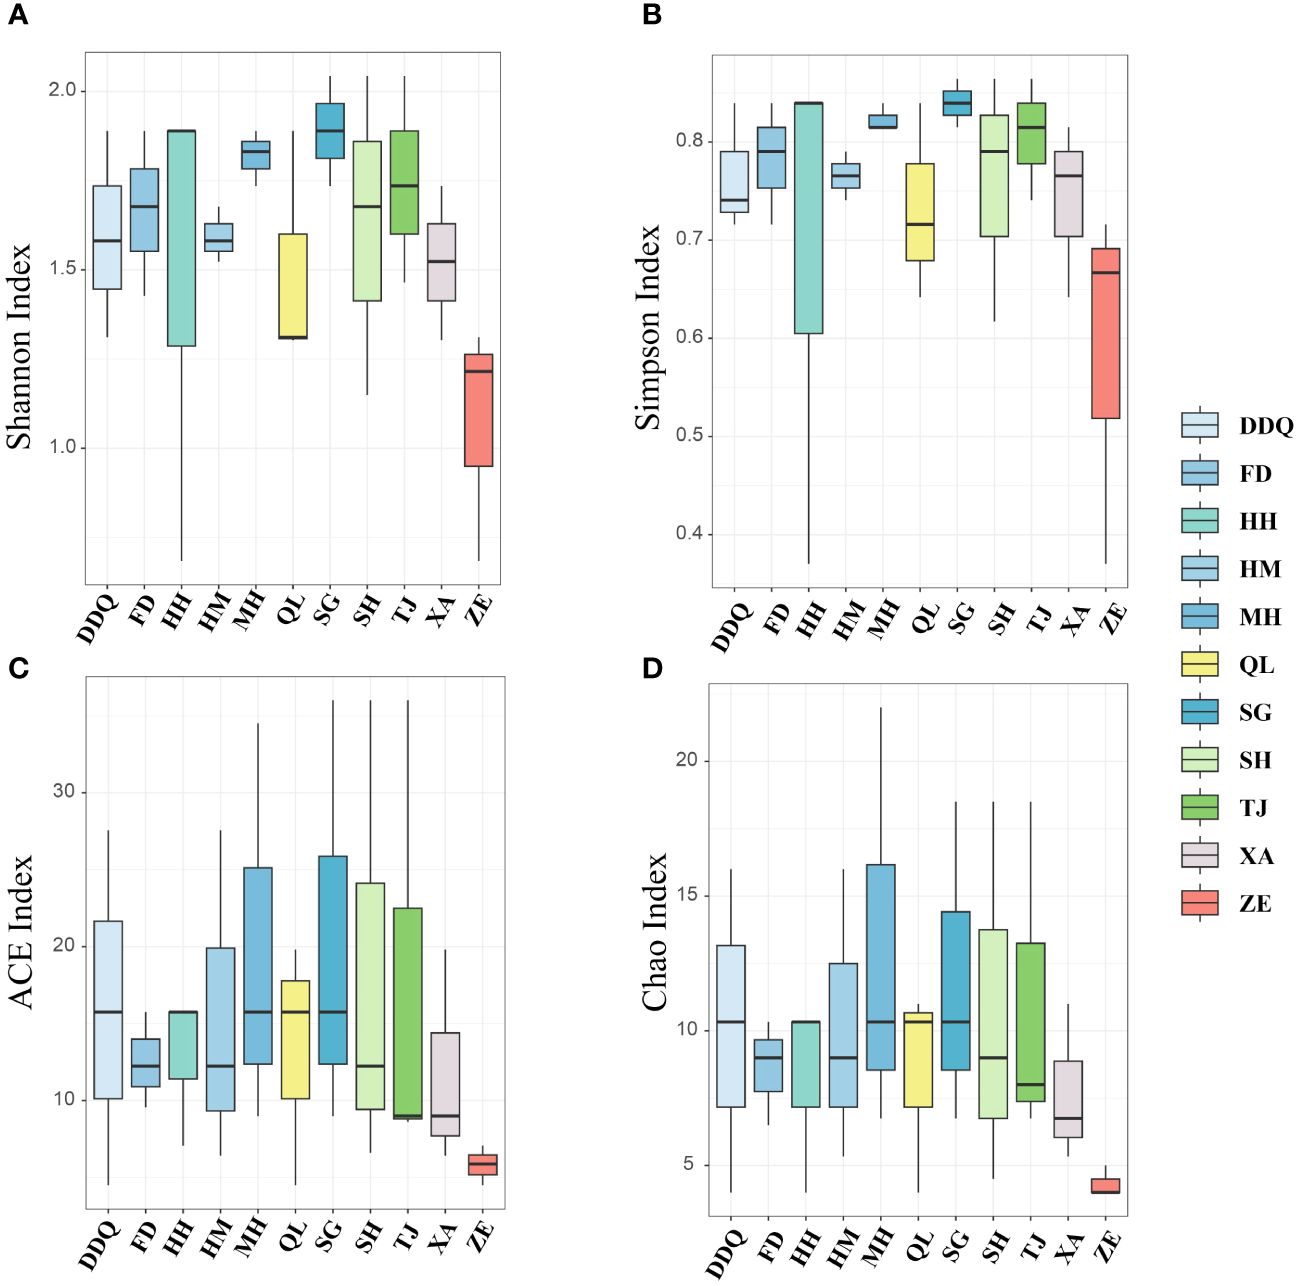
Figure 6 A diversity index of fish at each site derived from eDNA. (A, B) show the Shannon and Simpson Indices for fish, respectively, while (C, D) display the ACE and Chao1 Indices for fish, respectively.
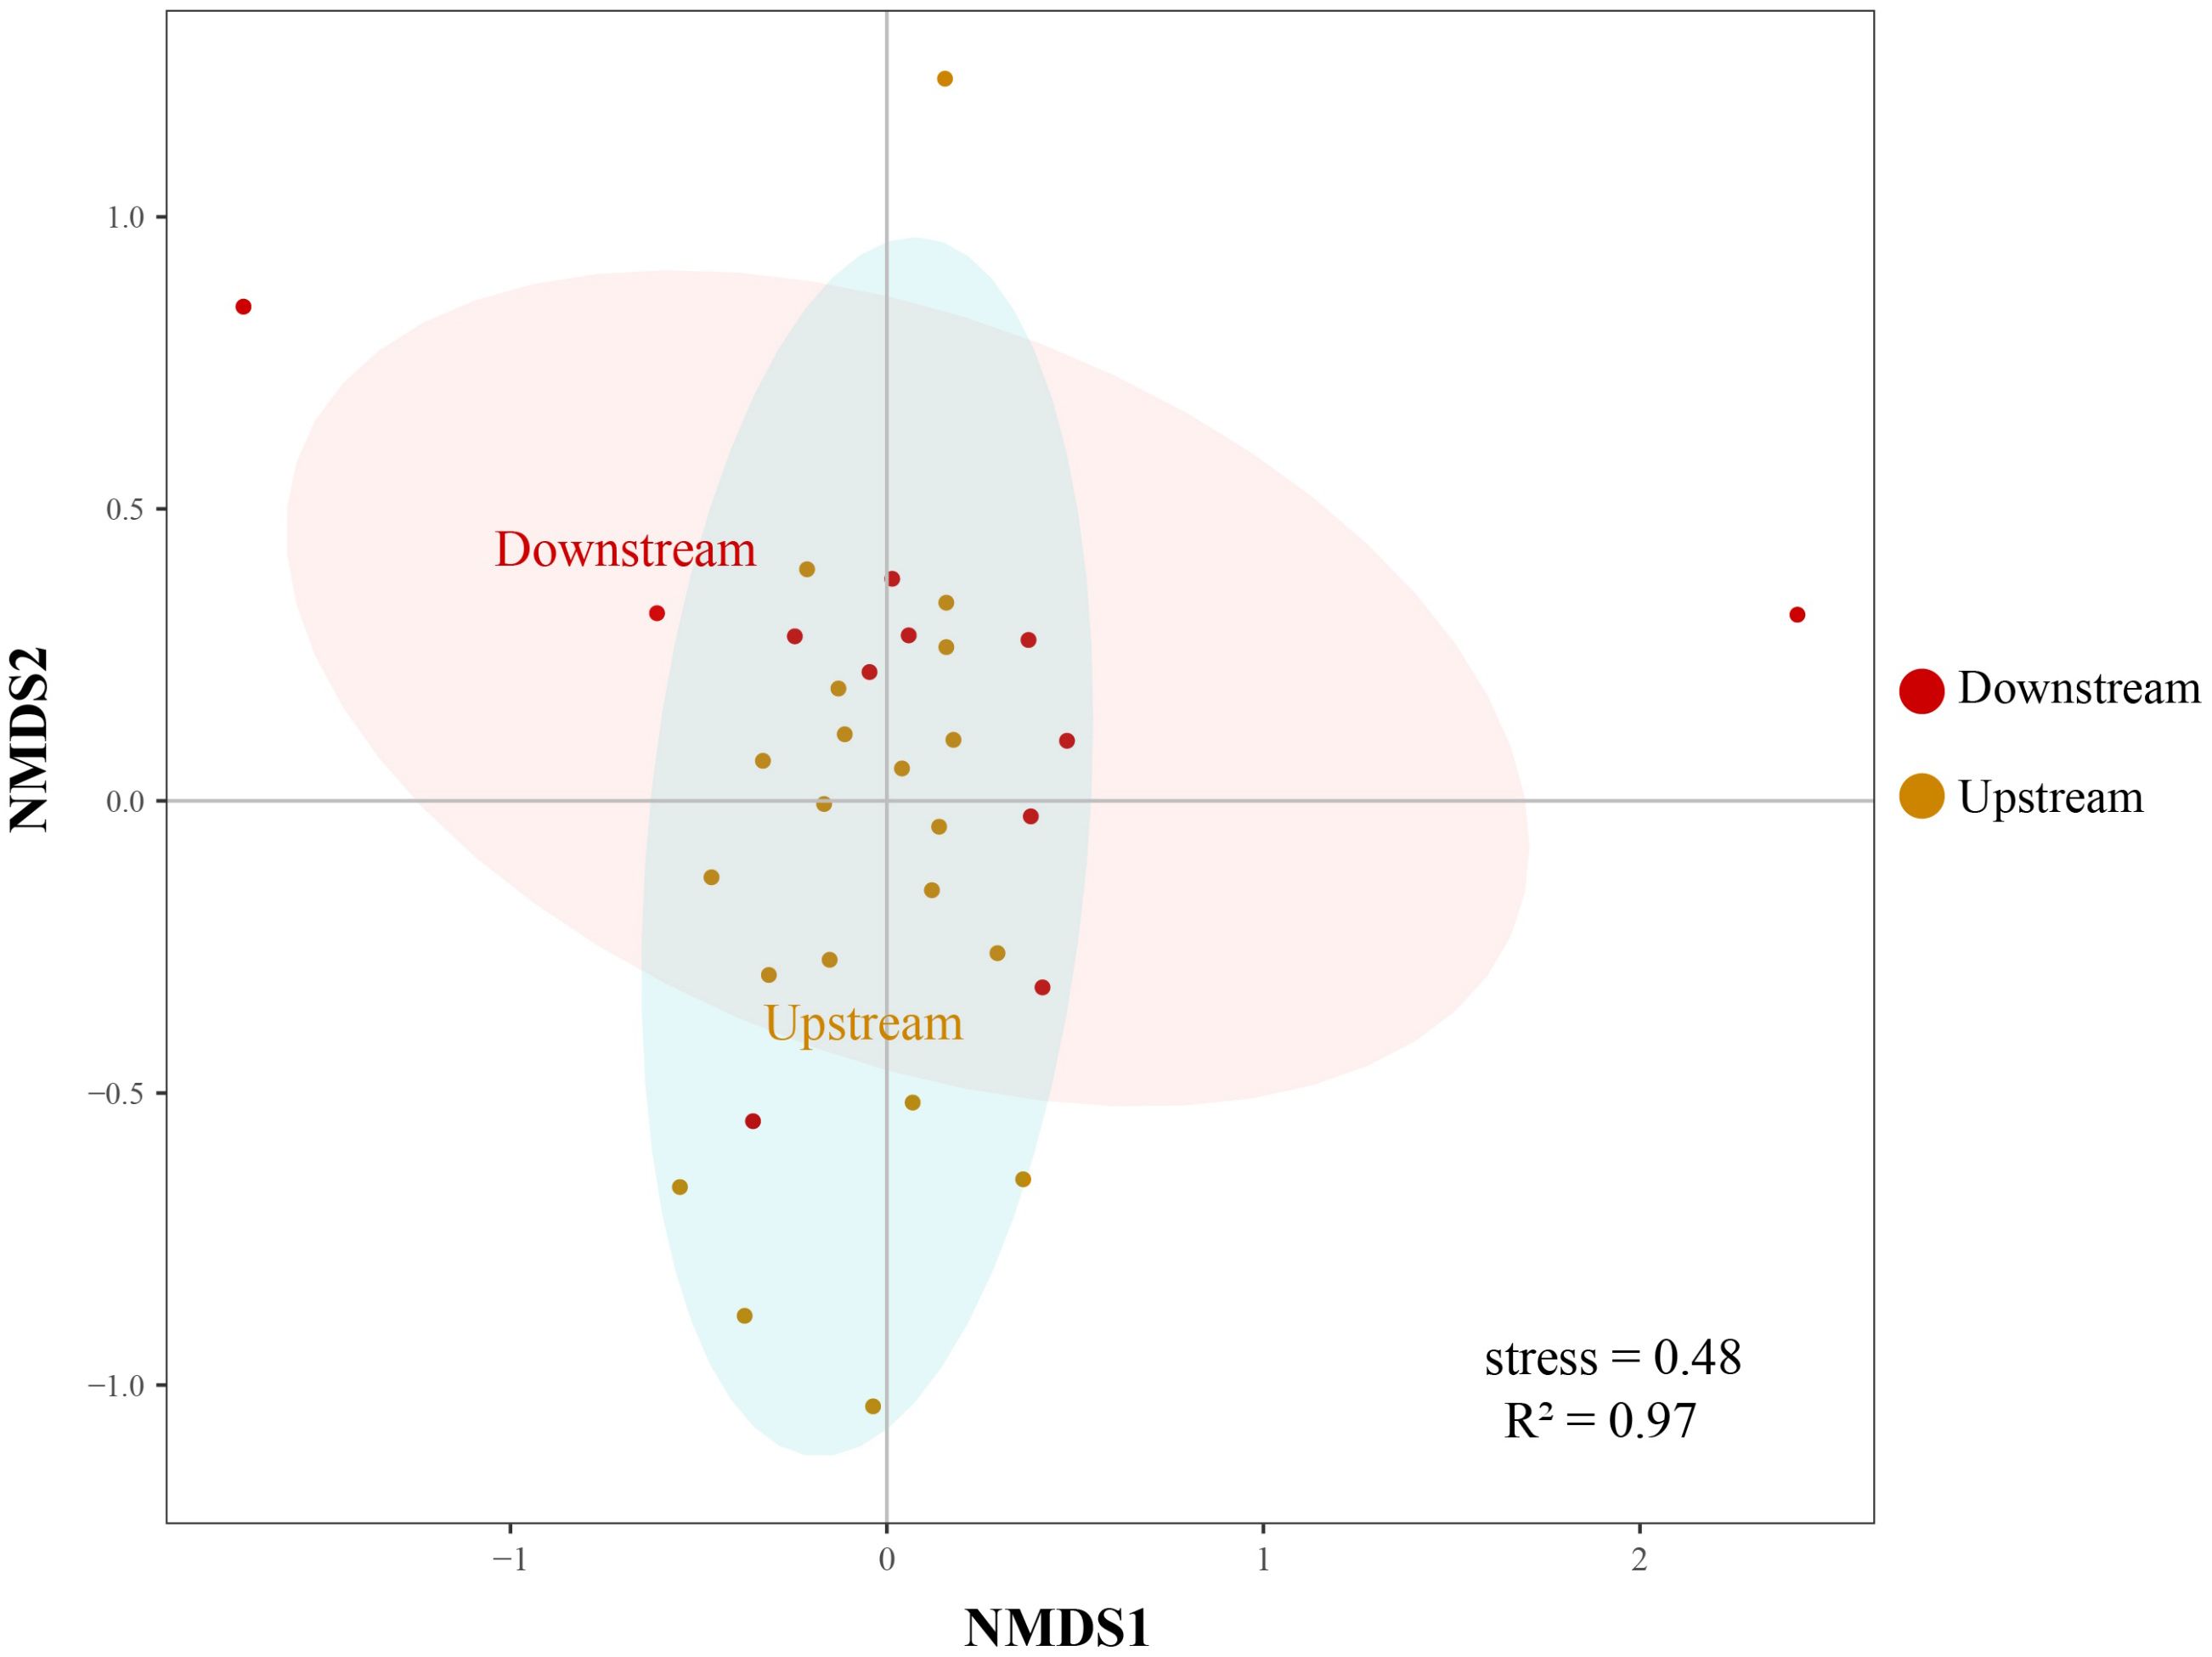
Figure 7 A non-metric multidimensional scale (NMDS) plot of the differences between different groups of fish (i.e. upstream and downstream) in the Liaohe National Park. The NMDS plot visualizes the patterns of fish community composition within the upstream and downstream habitats of the study area. The points on the plot, distinguished by different colors, represent the two communities from the upstream and downstream regions, respectively. The distance between the points indicates differences in species composition, with closer points signifying more similar communities.
3.4 Correlation between dominate species and environmental factors
In this study, nine environmental factors were detected, including DO, TUR, CODMn, BOD, CODCr, TP, THg, TPb and NH3-N (Figure 8). DO and THg were proven to be the most influential ecological factors affecting the structure of fish communities. Environmental factors could explain 58.4% variation of species community, with most environmental factors more related to RDA1 (37.9%). Among species, H. molitrix was impacted more by THg, meanwhile, C. auratus was more related to TPb and H. nobilis was more related to TUR.
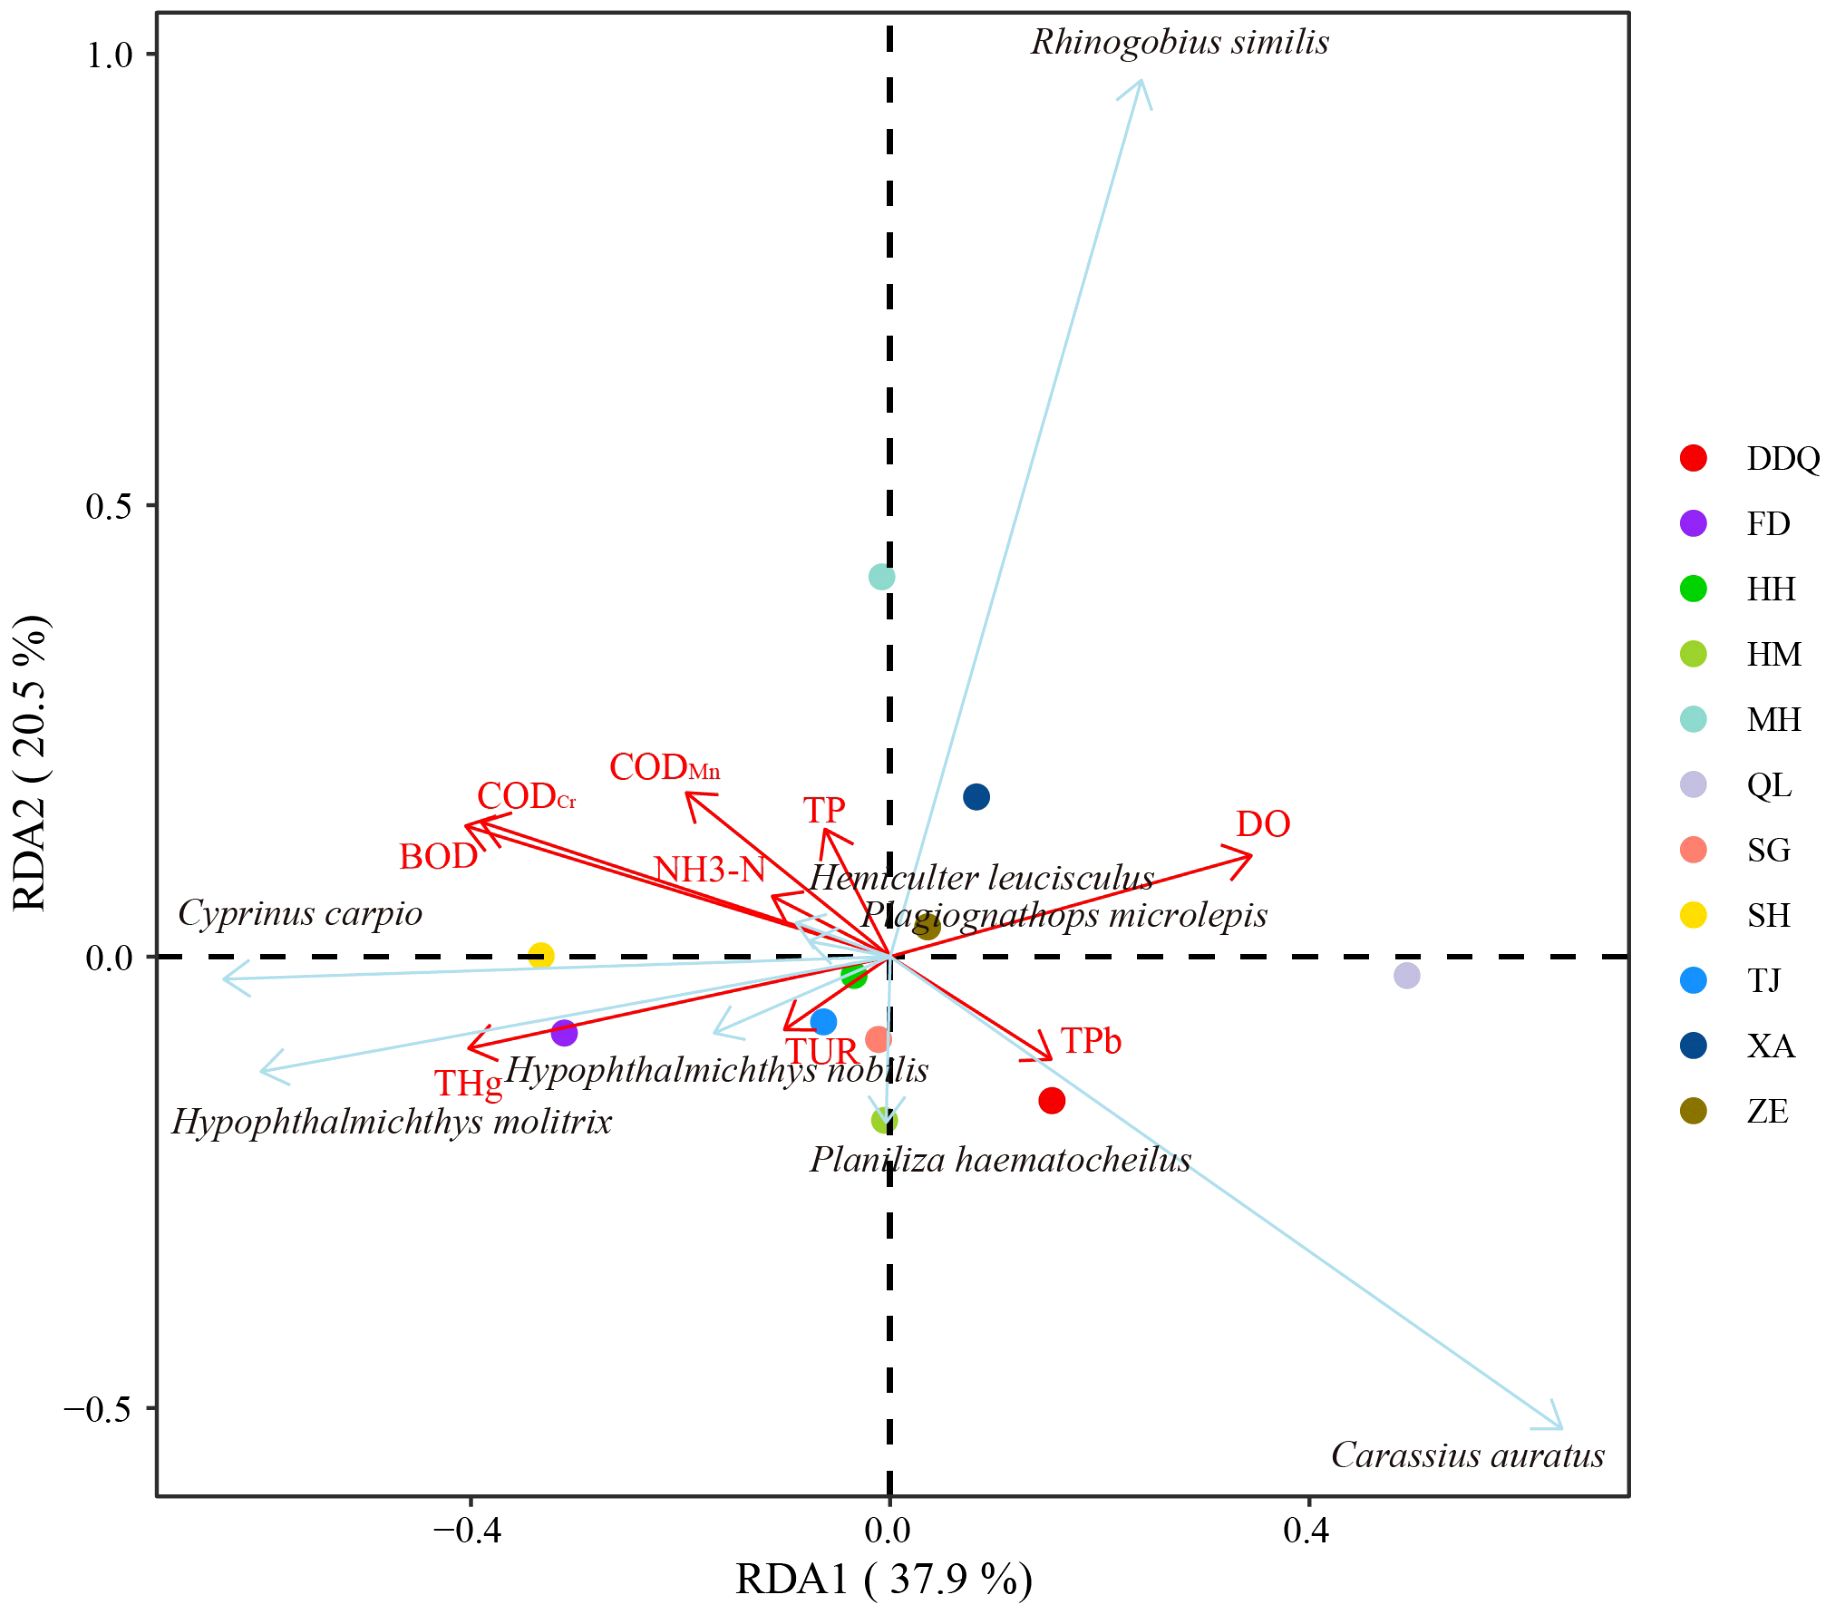
Figure 8 Redundancy Analysis (RDA) Plot Depicting Relationships Between Fish Species and Environmental Variables. This RDA plot illustrates the relationships between fish species and various environmental variables within the study area. The positions of the species labels and sample points on the axes, which are derived from the RDA, reflect their correlations with the environmental factors. The points in the figure represent sites, the red arrows represent environmental factors, and the blue arrows represent species, with the length of the arrows indicating the strength of the correlation and the direction pointing towards the direction of increasing values of that variable.
3.5 Deterministic and stochastic processes determining fish community distribution
The results indicated that the βNTI values for all 11 sampling sites fall within the range of -2 to 2 (Figure 9A). Given that |βNTI|<2, the Raup-Crick value was calculated to determine which random processes under the null model regulate phylogenetic turnover. The results showed that at most sampling sites (including DDQ, MH, QL, SH, TJ, XA), the |Raup-Crick|<0.95, indicating that the observed fish turnover was dominated by non-deterministic processes, which included weak selection, weak diffusion, diversification, and drift. At some sampling sites (including FD, HH, HM, SG, ZE), the Raup-Crick value was less than 0.95, indicating that the fish were dominated by homogenizing dispersal (Figure 9B). Spearman correlation coefficient analysis showed that βNTI in fish communities was positively correlated with changes in BOD, DO, CODMn, NH4, TP and TUR, but the results were not significant (Figure 10).
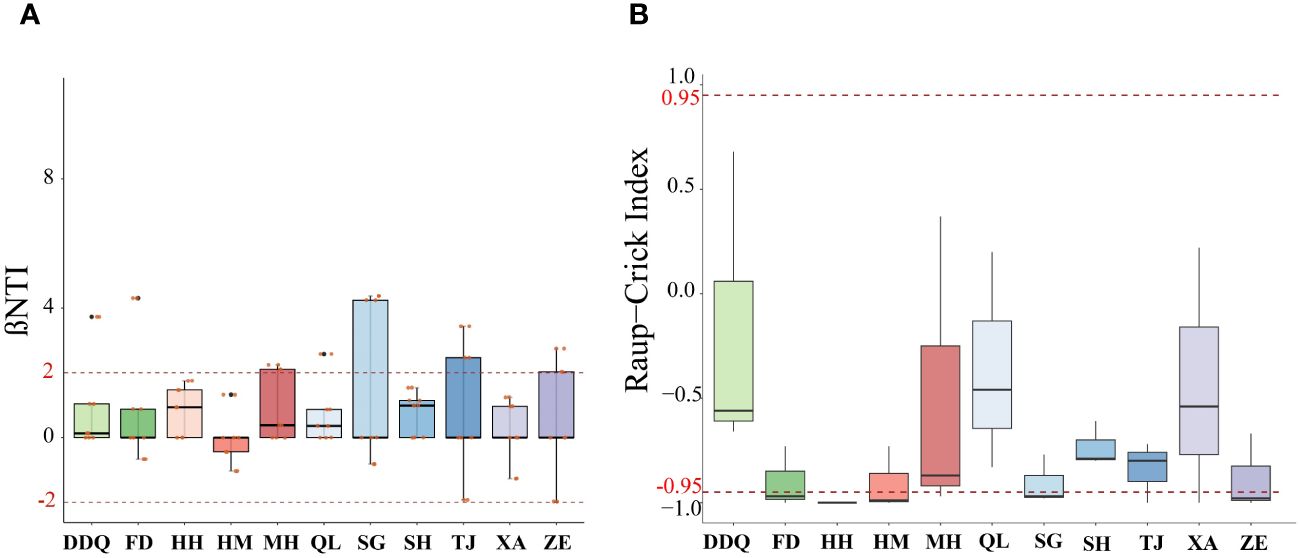
Figure 9 βNTI Values (A) and Raup-Crick values (B) of Fish Community Dynamics in the Liaohe National Park. The community assembly mechanisms for fish are analyzed using the βNTI and Raup-Crick metrics in panels for fish.
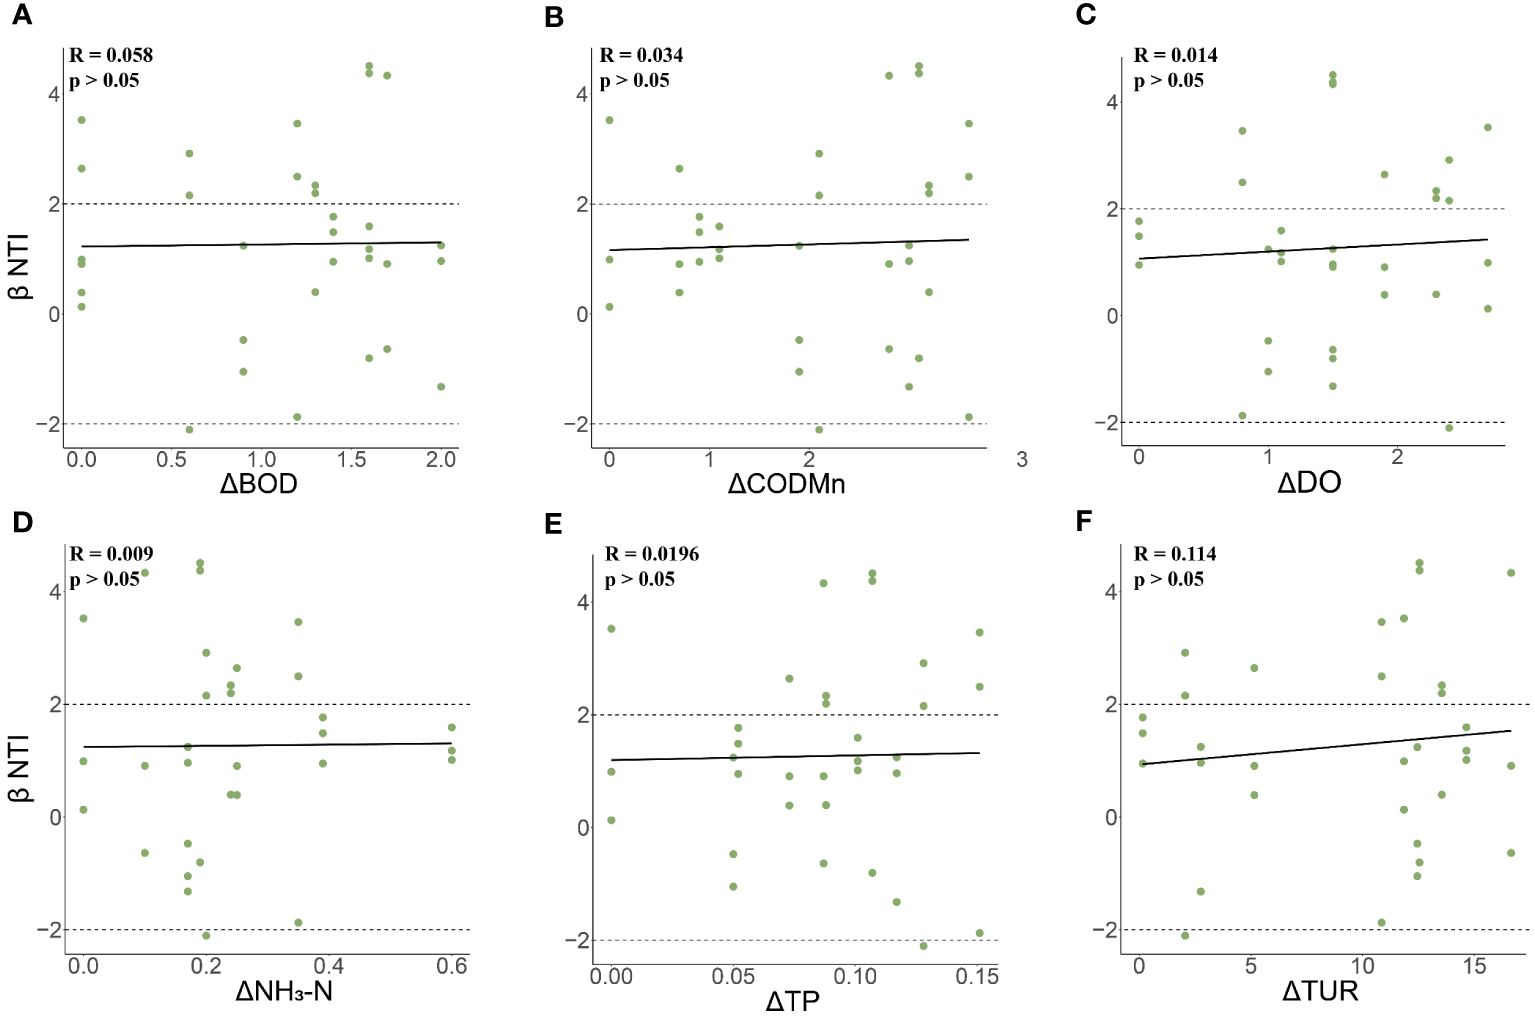
Figure 10 Relationship between βNTI of fish communities and environmental variables. (A) The relationship between the changes of βNTI and BOD in fish communities; (B) The relationship between βNTI and CODMN changes in fish communities; (C) The relationship between βNTI and DO changes in fish communities; (D) The relationship between βNTI and NH4 changes in fish communities; (E) The relationship between changes in β-NTI and TP in fish communities; (F) The relationship between βNTI and TUR changes in fish communities.
4 Discussion
4.1 Fish species composition
According to the ‘Liaoning Animal Chronicle Fish Volume’, a total of 103 freshwater fish species belonging to 79 genera and 20 families have been recorded in Liaoning Province. In the course of this investigation, 54 species of fish were identified across 11 sampling sites, falling under six orders, 14 families, and 39 genera. The majority of these species are classified within the Cypriniformes and Cyprinidae. The quantity of fish species identified in this eDNA survey was relatively low when juxtaposed with historical data. On one hand, overexploitation of resources (Chu and Feng, 2020), water pollution (Mu et al., 2016), and the invasion of alien species have directly impacted the biodiversity of aquatic life (Mueller et al., 2018). On the other hand, related research indicates that the richness of fish species increases with the number of sampling points, and the abundance of fish increases the fastest compared with other groups (Zhang et al., 2023). The fact that only 11 points were sampled in this study may affect the richness of the species. Furthermore, the lack of temporal sampling and variability in sampling times may affect the accurate assessment of fish community diversity and population dynamics due to factors such as the reproductive cycles of fish populations, seasonal migrations, and environmental changes that lead to variations in distribution and abundance at different times (Cao, 2019; Xu et al., 2020). The integrity of a database is crucial for ensuring the accuracy of biodiversity surveys (Ma et al., 2018). Historical records indicate that there are 103 known species of fish in Liaoning Province. However, in this study, upon comparing our database with public sequence databases, we found that while sequence data for 100 species are accessible, sequence information for three species remains undisclosed. This gap in data may result in an underestimation of the total number of species identified in our survey. Consequently, our findings may not fully represent the diversity of fish species in the region. From 2016 to 2017, a total of 34 species of fish were detected by morphological methods (Li et al., 2020). The survey results can support that eDNA survey has higher sensitivity and effectiveness than traditional capture-based methods or visual observation.
L. cyanellus, indigenous to Canada and northern Mexico in North America, was introduced to China from the United States in 1999 for purposes of food production, ornamentation, and recreational fishing (Ma et al., 2003). Currently, there are documented findings of L. cyanellus in Anhui, Sichuan, and Guizhou (Wan et al., 2017; Xia et al., 2022). Prior this study, L. cyanellus has not been reported from Liaoning. Our study revealed the potential existence of L. cyanellus in Liaohe National Park by eDNA based survey, indicating the sensitivity and accuracy of eDNA. The potential existence of L. cyanellus in Liaohe National Park might be resulted from aquaculture, ornamental pet trade, other economic fish farming, artificial release (Hulme et al., 2008; Pysek et al., 2020). Additionally, climate warming may facilitate the northward spread of invasive species (Liu et al., 2019). L. cyanellus, with its robust ability to withstand extreme conditions and high reproductive rate, is recognized as an omnivorous species in the field of biology (Hertling and Lubke, 2000). It is likely to have a significant negative impact on the reproduction of local fish populations and may potentially become the dominant species in the area, thereby posing a significant threat to native species (Lemly, 1985; Lohr and Fausch, 1996; Dudley and Matter, 2000). The loss and fragmentation of habitats, overuse of resources, pollution of the water environment, and invasion of alien species have led to the continuous deterioration of the aquatic ecological environment in some river basins (Jing et al., 2023). Therefore, it is necessary to strengthen the detection of aquatic biodiversity and the investigation and research of invasive species distribution in the Liaohe River National Park. At the same time, it is also very important to carry out the investigation and management of breeding and trading conditions (Zhao et al., 2019).
4.2 Diversity variation
In this survey, freshwater fish were the most prevalent, with a total of 50 species identified, accounting for approximately 92.59% of the total number, primarily consisting of Cyprinidae. There were four species of estuarine brackish water fish (sedentary species), making up about 7.41%, mainly belonging to the Gobiidae. A single species of migratory fish, the Coilia nasus, was found, representing about 1.85%. The results of α diversity indicate that the downstream site, which was closer to the seawater, exhibits higher diversity and richness compared to the upstream site. This could be attributed to the unique habitat features and the seasonal movement of fish associated with salinity intrusion. These factors could potentially lead to a more diverse fish assemblage in this transitional zone, thereby contributing to the observed differences in biodiversity (Moura et al., 2012; González-Sansón et al., 2022). Among all sites, SG, located at the estuary, had the highest Shannon and Simpson index. The species richness was significantly higher at the natural channel that links the estuarine and freshwater ecosystems (Moura et al., 2012). NMDS showed no significant difference between upstream and downstream, it may be due to the upstream and downstream belong to the same basin with similar ecological environment and close geographical location. The fish DNA fragments of the sampling sites may come from a larger spatial scale due to the migration and diffusion of biological fragments, and the DNA fragments of fish in the water may be spread to the neighboring sampling points through the water flow (Merkes et al., 2014; Shi et al., 2023). The application of eDNA monitoring method in the survey of species diversity distribution are becoming increasingly popular.
4.3 Relationship with ecological factors and community assembly
Fish assemblages can be structured by stochastic processes, deterministic processes or both mechanisms, resulting in different co-occurrence patterns (Ortega et al., 2015). Deterministic processes can be generated by different environmental requirements of fish and their biological interactions (such as competition or predation). Random patterns can be generated by neutral processes (such as weak selection, weak dispersal, diversification and drift, etc.). This study revealed that the fish assemblages in Liaohe National Park are primarily influenced by stochastic processes.
Following the establishment of the Liaohe River Conservation Area, several engineering and management strategies have been implemented by Liaoning Province. These include the closure of small to medium-sized polluting businesses, the reversion of farmland back to river, and the natural sealing and restoration of wetlands. These measures have significantly enhanced the water quality and ecological environment of the Liaohe River’s main stream. As a result, the Liaohe River Reserve now boasts a rich biodiversity (Liu et al., 2013; Li et al., 2020). Previous study have shown that environmental factors affect the species abundance of fish to a large extent, such as pollutants in water, eutrophication, suspended particulate matter (John et al., 2004). The deterministic processes affect community structure include land use factors, water environmental quality factors and so on. The findings in this study were that DO and THg were the most influential factors. DO is the main source of oxygen for aquatic organisms. It has significant effects on physiological processes such as respiration, swimming, growth performance and metabolism of fish (Jia et al., 2020). THg can enter fish bodies through the gills and intestines, accumulating in organs such as muscles, liver, and kidneys. High concentrations of THg can have detrimental effects on the physiological functions of fish, leading to behavioral abnormalities, stunted growth, and reduced reproductive capabilities. The bioaccumulation of THg poses a potential risk to the health of fish, possibly affecting their physiological processes such as respiration, swimming, growth performance, and metabolism. Due to the toxicity of Hg, some fish populations that are sensitive to mercury may decrease or vanish, such as the high sensitivity of H. molitrix to THg, thereby altering the species composition and distribution of ecological niches within the community (Chen et al., 2023). This could lead to certain niches being occupied by other Hg-tolerant species, thereby affecting the stability and diversity of the entire community.
5 Conclusion
The distribution and diversity of fishes in Liaohe National Park were investigated by using eDNA metabarcoding technology, and detected 54 fish species belonging to six orders, 14 families, and 39 genera. There was no significant difference in upstream and downstream for fish diversity, and the spatial structure of fish communities was similar. The stochastic process of fish community aggregation dominates the replacement of fish, including weak selection, weak diffusion, diversification, and drift. RDA results showed that the factors affecting fish community structure and environmental filtration included DO and THg in the river basin, the distribution of H. molitrix was positively correlated with THg, the distribution of C. auratus was proportional to TPb and H. nobilis was more related to TUR. This showed that the fish community in the Liaohe National Park might subject to the dual influence of deterministic and stochastic processes. In this eDNA survey of Liaohe National Park, an invasive species of L. cyanellus was found for the first time. The invasion of L. cyanellus may threaten the survival of native fish species and become dominant. It is necessary to strengthen the investigation, monitoring, and research on the distribution status of L. cyanellus in the Liaohe National Park, and carry out the investigation and management of farming and trade conditions.
Data availability statement
The list of all fish species and their sequences detected in the Liaohe National Park can be accessed through the following DOI link: https://doi.org/10.6084/m9.figshare.25765533.
Author contributions
NX: Conceptualization, Data curation, Formal analysis, Investigation, Methodology, Project administration, Resources, Software, Writing – original draft, Writing – review & editing. ZL: Investigation, Validation, Visualization, Writing – review & editing. YJ: Investigation, Project administration, Resources, Writing – original draft. HW: Data curation, Formal analysis, Visualization, Writing – original draft. JT: Conceptualization, Supervision, Visualization, Writing – original draft. YL: Investigation, Project administration, Resources, Writing – original draft. BS: Investigation, Project administration, Visualization, Writing – original draft. XL: Conceptualization, Data curation, Funding acquisition, Investigation, Methodology, Project administration, Visualization, Writing – original draft, Writing – review & editing.
Funding
The author(s) declare financial support was received for the research, authorship, and/or publication of this article. This research was funded by the National Key R&D Program of China (2022YFC2601301) and the Yangtze River Joint Research Phase II Program (2022-LHYJ-02-0102).
Conflict of interest
The authors declare that the research was conducted in the absence of any commercial or financial relationships that could be construed as a potential conflict of interest.
Publisher’s note
All claims expressed in this article are solely those of the authors and do not necessarily represent those of their affiliated organizations, or those of the publisher, the editors and the reviewers. Any product that may be evaluated in this article, or claim that may be made by its manufacturer, is not guaranteed or endorsed by the publisher.
Supplementary material
The Supplementary Material for this article can be found online at: https://www.frontiersin.org/articles/10.3389/fmars.2024.1403700/full#supplementary-material
References
Ahmed S. F., Kumar P. S., Kabir M., Zuhara F. T., Mehjabin A., Tasannum N., et al. (2022). Threats, challenges and sustainable conservation strategies for freshwater biodiversity. Environ. Res. 214, 113808. doi: 10.1016/j.envres.2022.113808
Allen G. H., Pavelsky T. M. (2018). Global extent of rivers and streams. Science 361, 585–588. doi: 10.1126/science.aat0636
Baird D. J., Hajibabaei M. (2012). Biomonitoring 2.0: a new paradigm in ecosystem assessment made possible by next-generation DNA sequencing. Mol. Ecol. 21, 2039–2044. doi: 10.1111/j.1365-294X.2012.05519.x
Beng K. C., Corlett R. T. (2020). Applications of environmental DNA (eDNA) in ecology and conservation: opportunities, challenges and prospects. Biodivers. Conserv. 29, 2089–2121. doi: 10.1007/s10531-020-01980-0
Biggs J., Ewald N., Valentini A., Gaboriaud C., Dejean T., Griffiths R.A., et al. (2015). Using eDNA to develop a national citizen science-based monitoring programme for the great crested newt (Triturus cristatus). Biol. Conserv. 183, 19–28. doi: 10.1016/j.biocon.2014.11.029
Callahan B. J., McMurdie P. J., Rosen M. J., Han A. W., Johnson A. J. A., Holmes S. P., et al. (2016). DADA2: High-resolution sample inference from Illumina amplicon data. Nat. Methods 13, 581–583. doi: 10.1038/nmeth.3869
Camacho C., Coulouris G., Avagyan V., et al. (2009). BLAST+: architecture and applications. BMC Bioinf. 10, 421. doi: 10.1186/1471-2105-10-421
Cao L. (2019). Fish functional groups and their relationship with water environmental factors in Jinan City. Water Resour. Prot. 35, 79–86. doi: 10.3880/j.issn.1004-6933.2019.01.015
Cavaliere M., Barrenechea Angeles I., Montresor M., et al. (2021). Assessing the ecological quality status of the highly polluted Bagnoli area (Tyrrhenian Sea, Italy) using foraminiferal eDNA metabarcoding. Sci. Total Environ. 790, 147871. doi: 10.1016/j.scitotenv.2021.147871
Chase J. M., Kraft N. J. B., Smith K. G., Vellend M., Inouye B. D. (2011). Using null models to disentangle variation in community dissimilarity from variation in α-diversity. Ecosphere 2, 1–11. doi: 10.1890/ES10-00117.1
Chase J. M., Myers J. A. (2011). Disentangling the importance of ecological niches from stochastic processes across scales. Philos. Trans. R Soc. Lond B Biol. Sci. 366, 2351–2363. doi: 10.1098/rstb.2011.0063
Chen C. Z., Chai Y., Wang Y. J., Li P., Liu L., Li Z. H. (2023). Physiological and molecular responses in the silver carp (Hypophthalmichthys molitrix) larvae after acute mercury exposure. Environ. Sci. pollut. Res. 30, 49760–49770. doi: 10.1007/s11356-023-25842-8
Chen S., Zhou Y., Chen Y., Gu J. (2018). fastp: an ultra-fast all-in-one FASTQ preprocessor. Bioinformatics 34, i884–i890. doi: 10.1093/bioinformatics/bty560
Chu T. J., Feng X. Y. (2020). Research status and protection measures of fish resources in Qiantang River Basin. J. Zhejiang Agric. Sci. 61, 2122–2124. doi: 10.16178/j.issn.0528-9017.20201050
Comte L., Olden J. D. (2017). Climatic vulnerability of the world’s freshwater and marine fishes. Nat. Climate Change 7, 718–722. doi: 10.1038/nclimate3382
Dixon P. (2003). VEGAN, a package of R functions for community ecology. J. Veget. Sci. 14, 927–930. doi: 10.1111/j.1654-1103.2003.tb02228.x
Doi H., Inui R., Akamatsu Y., Kanno K., Yamanaka H., Takahara T., et al. (2017). Environmental DNA analysis for estimating the abundance and biomass of stream fish. Freshw. Biol. 62, 30–39. doi: 10.1111/fwb.12846
Dudley R. K., Matter W. J. (2000). Effects of small green sunfish (Lepomis cyanellus) on recruitment of Gila chub (Gila intermedia) in Sabino Creek, Arizona. Southwest. Nat. 45, 24–29. doi: 10.2307/3672548
Foote A. D., Thomsen P. F., Sveegaard S., Wahlberg M., Kielgast J., Kyhn L. A., et al. (2012). Investigating the potential use of environmental DNA (eDNA) for genetic monitoring of marine mammals. PloS One 7 (8), e41781. doi: 10.1371/journal.pone.0041781
Gao X., Zhang Y., Ding S., Zhao R., Meng W. (2015). Response of fish communities to environmental changes in an agriculturally dominated watershed (Liao River Basin) in northeastern China. Ecol. Eng. 76, 130–141. doi: 10.1016/j.ecoleng.2014.04.019
González-Sansón G., Rodríguez F. N., Aguilar-Betancourt C. M., Páez Y. C. (2022). Estuarine fish diversity as indicator of natural environmental gradients. Mar. Biodivers. 52, 32. doi: 10.1007/s12526-022-01270-8
Hertling U. M., Lubke R. A. (2000). Assessing the potential for biological invasion–the case of Ammophila arenaria in South Africa. South Afr. J. Sci. 96, 520–527.
Hulme P. E., Bacher S., Kenis M., Klotz S., Kühn I., Minchin D., et al. (2008). Grasping at the routes of biological invasions: a framework for integrating pathways into policy. J. Appl. Ecol. 45, 403–414. doi: 10.1111/j.1365-2664.2007.01442.x
Itakura H., Wakiya R., Yamamoto S., Kaifu K., Sato T., Minamoto T. (2019). Environmental DNA analysis reveals the spatial distribution, abundance, and biomass of Japanese eels at the river-basin scale. Aquat. Conserv.: Mar. Freshw. Ecosyst. 29, 361–373. doi: 10.1002/aqc.3058
Jia Y. D., Wang J. W., Li J., Gao Y. T., Guan C. T., Huang B. (2020). Effect of dissolved oxygen on physiological functions and mechanism in fish. Journal of Fisheries Research 07 (01), 8–14. doi: 10.12677/OJFR.2020.71002
Jing M. Q., Song F., Meng K. X., Su F. L., Wei C. (2023). Optimization of landscape pattern in the main river basin of Liao River in China based on ecological network. Environ. Sci. pollut. Res. 30, 65587–65601. doi: 10.1007/s11356-023-26963-w
John V. S., Joan B., Alan H., Peter B., Stanley G., Patti H., et al. (2004). Projecting the biological condition of streams under alternative scenarios of human land use. Ecol. Appl. 14, 368–380. doi: 10.1890/02-5009
Katano I., Harada K., Doi H., Souma R., Minamoto T. (2017). Environmental DNA method for estimating salamander distribution in headwater streams, and a comparison of water sampling methods. PloS One 12 (5), e0176541. doi: 10.1371/journal.pone.0176541
Lagkouvardos I., Fischer S., Kumar N., Clavel T. (2017). Rhea: a transparent and modular R pipeline for microbial profiling based on 16S rRNA gene amplicons. Peerj 5, e2836. doi: 10.7717/peerj.2836
Lemly A. D. (1985). Suppression of native fish populations by green sunfish in first-order streams of piedmont North Carolina. Trans. Am. Fish. Soc. 114, 705–712. doi: 10.1577/1548-8659(1985)114<705:SONFPB>2.0.CO;2
Li H., Huang X., Li S., Zhan A. (2019). Environmental DNA (eDNA)-metabarcoding-based early monitoring and warning for invasive species in aquatic ecosystems. Biodivers Sci. 27, 5, 491–504. doi: 10.17520/biods.2018233
Li M., Qian F., Li D., Duan L. (2020). Spatial and temporal distribution characteristics and influencing factors of water quality in Liaohe Conservation Area. Chinese Res. Acad. Environmental Sci. 10, - 6, 1043. doi: 10.3390/app132111720
Lin Y. P., Gao Z. X., Zhan A. B. (2015). Introduction and use of non-native species for aquaculture in China: status, risks and management solutions. Rev. Aquacult. 7, 28–58. doi: 10.1111/raq.12052
Liu C. L., Comte L., Xian W. W., Chen Y. F., Olden J. D. (2019). Current and projected future risks of freshwater fish invasions in China. J. Ecogr. 42, 12, 2074–2083. doi: 10.1111/ecog.04665
Liu C. L., Dekui H., Chen Y. F., Olden J. L. (2017). Species invasions threaten the antiquity of China’s freshwater fish fauna. Diversity Distrib. 23, 556–566. doi: 10.1111/ddi.12541
Liu M., Li Y., Sun Y., Liu Y. (2013). Economic benefit analysis of ecological water purification in Liaohe River Conservation Area. J. Environ. Engr. Tech. 2, 5. doi: 10.12153/j.issn.1674-991X.20200104
Lohr S. C., Fausch K. D. (1996). Effects of green sunfish (Lepomis cyanellus) predation on survival and habitat use of plains killifish (Fundulus zebrinus). Southwest. Nat. 41, 155–160.
Lundberg J., Kottelat M., Smith G., Stiassny M., Gill A. (2000). So many fishes, so little time: an overview of recent ichthyological discovery in continental waters. Ann. Missouri Bot. Garden 87, 26–62. doi: 10.2307/2666207
Luo X. N., Zhao X. W., Duan Y. (2020). Exploitation and utilization of freshwater indigenous fishes in Liaoning Province: a review. J. Dalian Ocean Univ. 35, 2, 155–160. doi: 10.16535/j.cnki.dlhyxb.2019-185
Ma K.p., Min Z., Ji L.q., Ma J. c., Guo Q. h., OuYang Z. y. (2018). Establishing China infrastructure for big biodiversity data. Bull. Chin. Acad. Sci. 33, 8. doi: 10.16418/j.issn.1000-3045.2018.08.011
Ma X., Bang X., Yin D., Mingxue W. (2003). Intentionally introduced and transferred fishes in China’s inland waters. Asian Fish. Sci. doi: 10.33997/j.afs.2003.16.4.001
Martin M. (2011). Cutadapt removes adapter sequences from high-throughput sequencing reads. J. EMBnet 17, 10–12. doi: 10.14806/EJ.17.1.200
McKee A. M., Calhoun D. L., Barichivich W. J., Spear S. F., Goldberg C. S., Glenn T. C., et al. (2015). Assessment of environmental DNA for detecting presence of imperiled aquatic amphibian species in isolated wetlands. J. Fish Wildl. Manage. 6, 498–510. doi: 10.3996/042014-JFWM-034
Merkes C. M., McCalla S. G., Jensen N. R., Gaikowski M. P., Amberg J. J. (2014). Persistence of DNA in carcasses, slime and avian feces may affect interpretation of environmental DNA data. PloS One 9, e113346. doi: 10.1371/journal.pone.0113346
Minamoto T., Hayami K., Sakata M. K., Imamura A. (2018). Real-time polymerase chain reaction assays for environmental DNA detection of three salmonid fish in Hokkaido, Japan: Application to winter surveys. Ecol. Res. 34, 237–242. doi: 10.1111/1440-1703.1018
Miya M., Sato Y., Fukunaga T., Sado T., Poulsen J. Y., Sato K., et al. (2015). MiFish, a set of universal PCR primers for metabarcoding environmental DNA from fishes: detection of more than 230 subtropical marine species. R Soc. Open Sci. 2, 150088. doi: 10.1098/rsos.150088
Moura P., Vieira J., Garcia A. (2012). Fish abundance and species richness across an estuarine–freshwater ecosystem in the Neotropics. Hydrobiologia 696, 107–122. doi: 10.1007/s10750-012-1187-9
Mu X. Y., Huang Y., Li X. F., Cheng.Ju W., Luo J. B., Qiu J., et al. (2016). The occurrence of persistent organic pollutants in China and their environmental risk to fish: a review. Chin. J. Pesticide Sci. 18, 12–27. doi: 10.16801/j.issn.1008-7303.2016.0002
Mueller M., Pander J., Geist J. (2018). Comprehensive analysis of >30 years of data on stream fish population trends and conservation status in Bavaria, Germany. Biol. Conserv. 226, 311–320. doi: 10.1016/j.biocon.2018.08.006
Ni Y. Y., Yang T., Ma Y. Y., Zhang K. P., Soltis P. S., Soltis D. E., et al. (2021). Soil pH determines bacterial distribution and assembly processes in natural mountain forests of eastern China. Global Ecol. Biogeogr. 30, 2164–2177. doi: 10.1111/geb.13373
Obinna O., Eyo J., Omovwohwovie Emmanuel E. (2019). Role of fish as bioindicators: A review. Icon. Res. And Eng. Journals 2, 15.
Ortega J. C. G., Dias R. M., Petry A. C., Oliveira E. F., Agostinho A. A. (2015). Spatio-temporal organization patterns in the fish assemblages of a Neotropical floodplain. Hydrobiologia 745, 31–41. doi: 10.1007/s10750-014-2089-9
Pysek P., Hulme P. E., Simberloff D., Bacher S., Blackburn T. M., Carlton J. T., et al. (2020). Scientists’ warning on invasive alien species. Biol. Rev. Camb Philos. Soc. 95, 1511–1534. doi: 10.1111/brv.12627
R Core Team (2022). R: A language and environment for statistical computing (Vienna, Austria. 1: R Foundation for Statistical Computing) 1.
Shi Y., Wang S. P., Lin X. L., Li H., Li A., Fan J. T., et al. (2023). Unraveling fish diversity and assembly patterns in a temperate river: Evidence from environmental DNA metabarcoding and morphological data. Ecol. Indic. 156, 111111. doi: 10.1016/j.ecolind.2023.111111
Su G. H., Logez M., Xu J., Tao S. L., Villéger S., Brosse S. (2021). Human impacts on global freshwater fish biodiversity. Science 371, 835–838. doi: 10.1126/science.abd3369
Vellend M. (2010). Conceptual synthesis in community ecology. Q Rev. Biol. 85, 183–206. doi: 10.1086/652373
Wan A., Zhang X. K., Liu Z. G., Wang H. L., Chen M. M., Zhou S. (2017). Morphological characteristics of the green sunfish (Lepomis cyanellus) in HeiGou Creek, Ta-pieh Mountains. Acta Hydrobiol. Sin. 41, 194–200. doi: 10.7541/2017.24
Wei C., Su F. L., Yue H. Y., Song F., Li H. F. (2023). Spatial distribution characteristics of denitrification functional genes and the environmental drivers in Liaohe estuary wetland. Environ. Sci. pollut. Res. 31, 1064–1078. doi: 10.1007/s11356-023-30938-2
Whitfield A. K. (2021). Estuaries – how challenging are these constantly changing aquatic environments for associated fish species? Environ. Biol. Fish. 104, 517–528. doi: 10.1007/s10641-021-01085-9
Xia F. M., Chen H. M., Luo Y. Q., Jiang X. K., Dai L. L., Yuan G., et al. (2022). Invasion risk of Lepomis cyanellus Rafinesque 1819 in Guizhou Province. Guizhou Sci. 33–36.
Xian W. W., Zhang H., Liu S. D. (2016). Research advance in estuarine ichthyoplankton ecology. Studia Marina Sin. 51, 167–180. doi: 10.12036/hykxjk20160718001
Xiong W., Li H. T., Zhan A. B. (2016). Early detection of invasive species in marine ecosystems using high-throughput sequencing: technical challenges and possible solutions. Mar. Biol. 163, 139. doi: 10.1007/s00227-016-2911-1
Xu T. Z., Xu D. P., Zhou Y., Jing L., Ge Y., Zhang Y. J. (2020). Spatial distribution pattern of fish communities in the Huaihe River channel and its adjacent water systems. J. Dalian Ocean Univ. 35, 8. doi: 10.16535/j.cnki.dlhyxb.2019-305
Yan Y. L., Xie X. J. (2012). Metabolic compensation based on regulating mechanism in mitochondrion of fish in response to environmental temperature. Acta Hydrobiol. Sin. 36, 532–540. doi: 10.3724/SP.J.1035.2012.00532
Zhang C., Liu F., Liu H. Z., Wang C. l., Lin P. c., Gao X. (2022). Temporal Changes in Taxonomic and Functional Diversity of Fish Assemblages in the Upper Yangtze River After Impoundment of the Three Gorges Reservoir (China) 10. doi: 10.3389/fenvs.2022.875789
Zhang S., Zhao J., Yao M. (2023). Urban landscape-level biodiversity assessments of aquatic and terrestrial vertebrates by environmental DNA metabarcoding. J. Environ. Manage 340, 117971. doi: 10.1016/j.jenvman.2023.117971
Zhao K.s., Li C., Wang T., Hu B. w., Zhang M., Xu J. (2019). Distribution and trophic pattern of non-native fish species across the Liao river basin in China. Water 11, 1217. doi: 10.3390/w11061217
Zhou J., Ning D. (2017). Stochastic community assembly: does it matter in microbial ecology? Microbiol. Mol. Biol. Rev. 81 (4), e00002-17. doi: 10.1128/MMBR.00002-17
Keywords: 12S rRNA, fish diversity, Liaohe, Lepomis cyanellus, ecological investigation
Citation: Xin N, Li Z, Jiang Y-W, Wang H, Tan J, Li Y, Sun B-J and Lin X-L (2024) Environmental DNA metabarcoding reveals fish diversity, community assembly and one invasive species prevalence in a National Park of Liaohe in September. Front. Mar. Sci. 11:1403700. doi: 10.3389/fmars.2024.1403700
Received: 19 March 2024; Accepted: 07 May 2024;
Published: 21 May 2024.
Edited by:
Shuping Wang, Chinese Research Academy of Environmental Sciences, ChinaReviewed by:
Beixin Wang, Nanjing Agricultural University, ChinaYongde Cui, Chinese Academy of Sciences (CAS), China
Shufang Liu, Chinese Academy of Fishery Sciences (CAFS), China
Clara F. Rodrigues, University of Aveiro, Portugal
Copyright © 2024 Xin, Li, Jiang, Wang, Tan, Li, Sun and Lin. This is an open-access article distributed under the terms of the Creative Commons Attribution License (CC BY). The use, distribution or reproduction in other forums is permitted, provided the original author(s) and the copyright owner(s) are credited and that the original publication in this journal is cited, in accordance with accepted academic practice. No use, distribution or reproduction is permitted which does not comply with these terms.
*Correspondence: Xiao-Long Lin, bGluODgwMjI0QGdtYWlsLmNvbQ==
†These authors have contributed equally to this work