 Qianqian Liu
 Juan Tan1,2,3†
 Ni Xin
- 1Engineering Research Center of Environmental DNA and Ecological Water Health Assessment, Shanghai Ocean University, Shanghai, China
- 2Shanghai Universities Key Laboratory of Marine Animal Taxonomy and Evolution, Shanghai Ocean University, Shanghai, China
- 3Shanghai Academy of Environmental Sciences, Shanghai, China
- 4Jiangxi Agricultural Technology Extension Center, Nanchang, Jiangxi, China
In the study of environmental DNA (eDNA), the rate of water filtration and the amount of DNA obtained are of general interest to researchers. We compared the PCTE filters with different pore sizes in enriching total DNA and fish eDNA from water samples. We also designed and tested a new filter device with a PET pad (5 µm) superimposed on a PCTE membrane (3 µm) and compared it to a pure PCTE filter. A comprehensive evaluation of filtration time, eDNA concentration, fish DNA quantification, and fish species detected showed that the shortest average filtration time was obtained with the 8 μm pore size (2 min 9 s) and the longest average filtration time was obtained with the 0.2 μm pore size (32 min 6 s). The highest average DNA concentration was 3.785 ng/μL for the 0.2 μm filter and the lowest was 0.577 ng/μL for the 8 μm filter; meanwhile, the concentrations of fish DNA measured by quantitative PCR were 5.02E+02(8 μm), 4.79E+02(3 μm), 1.63E+03(1.2 μm), 5.95E+03(0.2 μm) copies of fish DNA per µl and there was no significant difference in the results between them (p > 0.05). The sequencing results showed that 17 fish species were detected in the 0.2 μm filter, 10 species in the 1.2 μm filter, 12 species in the 3 μm filter and 11 species in the 8 μm filter. Comparing to 3 μm and 0.2 um, the average filtration time in stacked-filter was reduced by 4 and 24 min, respectively, while the average concentration was 2.46 and 1.55 times higher than the former. The qPCR results showed that the number of eDNA copies of the samples enriched with the 3 µm and stacked-filter was 4.79E+02 and 1.53E+04, respectively. 3 μm and stacked-filter showed significant differences (p < 0.05), while 0.2 µm and stacked-filter did not show significant differences (p > 0.05). Sixteen fish species were detected by the stacked-filter. The number of eDNA obtained and the number of fish species detected were higher than those of the pure PCTE filter, while clogging during filtration was effectively avoided. We recommend using the stacked-filter to enrich eDNA from water samples.
1 Introduction
Environmental DNA (eDNA) can be broadly defined as DNA present in the environment, including DNA released by organisms into the environment as well as DNA of microscopic organisms. Environmental DNA metabarcoding technology is used for qualitative and quantitative analysis of organisms through collection of environmental samples, enrichment, DNA extraction, selection of molecular markers, design of universal primers for their amplification, and high-throughput sequencing. In recent years, eDNA technology has been used in various applications such as species diversity monitoring (Plough et al., 2018; Webster et al., 2020; Zou et al., 2020; Jia et al., 2021; DiBattista et al., 2022; Knudsen et al., 2022), invasive species detection, and biomass assessment (Tillotson et al., 2018; Fraija-Fernandez et al., 2020; Wang et al., 2020; Hanzek et al., 2021). The method has been used to detect target species (Baudry et al., 2021; Matthias et al., 2021; Brand et al., 2022; Ruppert et al., 2022), for example, in 2021 to detect giant catfish in the Mekong River (Osathanunkul, 2022).
The main methods for eDNA enrichment include alcohol precipitation (Echeverria-Beirute et al., 2021; Persaud et al., 2021), passive eDNA sampling (Kirtane et al., 2020; Verdier et al., 2022), and filtration (Kamoroff and Goldberg, 2018; Jeunen et al., 2019; Muha et al., 2019; Shi et al., 2020; Allison et al., 2021; Bairoliya et al., 2022; Pathiraja et al., 2023; Sahu et al., 2023). Alcohol precipitation involves the addition of anhydrous ethanol to a small amount of aqueous sample, which is centrifuged at high speed to concentrate eDNA(Goldberg et al., 2016) Among these methods, alcohol precipitation is usually used for small sample volumes and the results of alcohol precipitation usually depend on the concentration of target eDNA available in the sample. Ethanol precipitation is only able to enrich sufficient amounts of eDNA when the concentration of target eDNA is very high (Dejean et al., 2012). Passive sampling is the undisturbed collection of eDNA directly from aquatic environments using natural or man-made materials, but it is difficult to expand the scope of passive sampling because it is so dependent on the habits (Zhang et al., 2023). At the same time, a wide variety of equipment and materials are used for passive sampling, and their impact on the sampling results needs to be considered during the sampling process. The filtration method has the advantages of filtering a large volume of water sample, and fast and easy to extract DNA subsequently. However, due to the complex environment of water samples, clogging of filters often occurs (Dunker et al., 2017; Hunter et al., 2019; Kirtane et al., 2020)To mitigate this situation, selection of filters is important. In eDNA applications, membrane pore size ranges from 0.2 to 20 µm (Egan et al., 2013; Jo et al., 2020; Jo and Yamanaka, 2022; Osathanunkul, 2022; Shu et al., 2020; von Ammon et al., 2023). Filtration with large-pore membranes can save time, process large volume of water and presumably reduce DNA degradation (Barnes and Turner, 2015; Zaiko et al., 2022); on the other hand, it may lose fine particles and small DNA fragments, and even possible to increase inhibitory substances (Beng and Corlett, 2020). Nonetheless, using small pore size may increase eDNA yields through retaining small particles, but clogging often occurs, which in turn costs more filtration time and even damages the filter membrane. The effect of pore size on enrichment of eDNA has been studied in different waterbody types (Moushomi et al., 2019; Wu et al., 2019; Fan et al., 2021). Pre-filtering water samples using membrane with larger pore size or using small-mesh net also was proposed (Takasaki, et al., 2021; Brandt et al., 2021; Zaiko et al., 2022). Although pre-filtering can improve consistency of DNA samples obtained (Takasaki et al., 2021), Majaneva et al. (2018) evaluated the effects of large-aperture prefiltration and found that while pre-filtration in complex environments increased the probability of detecting a single species and yielded higher values of the diversity index and a more consistent community composition, it reduced DNA yield.
Besides, pre-filtration of water samples may increase the risk of sample contamination due to more operation steps, such as changing different filter membranes. In terms of filter membrane material, it can be chosen from glass fiber (GF), mixed cellulose ester (MCE), polycarbonate track etched (PCTE) etc. (Hongo et al., 2021; Wang et al., 2021; Osathanunkul, 2022; Osathanunkul and Madesis, 2022; Uthicke et al., 2022; Xing et al., 2022). Choice of filter material can affect the blockage of filters and subsequent DNA extraction process (Li et al., 2023). For example, with the thin structure and limited number of pores of PCTE membranes, clogging occurs frequently. GF and MCE filters, on the other hand, do not clog as much due to their thickness and almost “three-dimensional” structure, which allows them to hold more particles before they get stuck. However, GF and MCE filters require several steps such as cutting the membrane for incubation during DNA extraction.
CTAB is a cationic detergent with the property of precipitating nucleic acids and acidic polysaccharides from low ionic strength solutions. As such, it is widely used for the extraction of DNA from water samples and the precipitation of environmental DNA (Tsuji et al., 2017; Wang et al., 2021). Meanwhile, Hunter et al. (2019) evaluated Longmire’s storage buffer, Long-CTAB-CI, CTAB-PCI buffer for the removal of PCR inhibitors and concluded that CTAB was the reagent that yielded the highest amount of ambient DNA in short-term storage (5–8 days). Briefly, the filtered membrane can be stored in CTAB solution, then phenol chloroform is added to dissolve the membrane, and after centrifugation at high speed, the supernatant is transferred to a new centrifuge tube for subsequent extraction. No membrane cutting and prolonged incubation is required during this process, so it can reduce the risk of cross-contamination (Djurhuus et al., 2017).
Theoretically, the thick PET pad not only helps to trap particles but also reduces the possibility of clogging. Like PCTE membrane, PET pad can be partially dissolved in phenol, so CTAB-phenol-chloroform extraction protocol can be used on the stacked-membrane filter to increase extraction yield and avoid cross-contamination. In this study, we took the advantage of both GF-like and PCTE-like materials, 1) designed a stacked-membrane filter by combing a polyethylene terephthalate pad (5 µm pore size, 2 cm thickness) and a PCTE membrane (3 µm pore size) for eDNA extraction. 2) We also compared the effect of pore size on eDNA enrichment, particularly its effect on DNA of targeted fish species.
2 Materials and methods
2.1 Sample collection
All sampling tools were bleached and then washed with double distilled water before collecting water samples, such as water sampler (volume 3 L), plastic buckets, etc. Disposable suppliers, such as mask, filter assemblages and forceps were used to avoid cross-contamination. Water samples were collected in mid-December 2021 from a freshwater lake (38°88′72.47″N, 121°89′62.82″E) on campus of the Shanghai Ocean University, Shanghai, China. The lake hosts both freshwater and some brackish water species, so it is a good sampling place for testing our methods because of its high diversity of fish species. The water sampler and the plastic bucket were rinsed with the water on site for three times. Water samples were taken 10 cm below surface, and then mixed in a plastic bucket. Finally, the mixed water samples were transferred directly to the lab within 30 min. A total of 42 L of water was obtained. The water sample was mixed well before taken for subsequent experiment. Double-distilled water was used as blank control before filtering the samples.
2.2 Sample filtration
Polycarbonate track etched filters with a diameter of 47 mm and pore sizes ranging from 8, 3, 1.2 to 0.2 µm were used to filter 1 L of water sample. A vacuum filtration system was used to filter the samples, composed of a 500 mL disposable syringe, a filter assemblage, and a vacuum pump. Six replicates were carried for each pore size, as well as a sample of dd H2O used as the blank control. The time required for filtration was recorded. After the filtration was completed, the filter membranes were stored in a 5 mL tube with 2X CTAB buffer added. The samples then were kept in a −20°C freezer before DNA extraction. DNA extraction and subsequent experimental steps are described in the following sections.
Water samples tend to filter quickly at the beginning and then become slower and slower until they clog. On this basis, we hypothesized that, rather than increasing the number of particles trapped, prolonging filtration after the filter has clogged would damage the filter and result in loss of the DNA sample. Therefore, we compared the effect of using one membrane to filter 1 L water sample with that of using two membranes, each filtering 0.5 L of water. PCTE with pore sizes of 1.2 and 3 µm were selected for testing. In the two-membrane treatment, each 0.5-L water sample was filtered through one membrane, while in the single-membrane treatment, a 1-L water sample was filtered through one membrane. Each treatment was repeated three times. Record the filtration time. DNA was extracted by placing two membranes in a test tube.
Meanwhile, two different filter combinations were designed: (1) a single membrane filter (PCTE; 3 μm, Safe Lab: #MS-PCTE-47-3.0-10) and (2) a stacked membrane filter combining a PET pad (5 μm, 2 cm thickness) and a PCTE membrane (3 µm). The top material of the stacked filter is PET with a thickness of 2 cm and pore size of 5 µm. It has a diameter of 47 mm and mainly of three-dimensional structure. Stacked-filter is assembled as follows: place the PCTE membrane on the plastic base,then lay the PET linear flat on the top of the PCTE membrane and tighten the cover (Figure 1). One-liter of water sample was filtered using both filter assemblies. Each treatment was repeated three times. The filtration time was recorded with a timer.
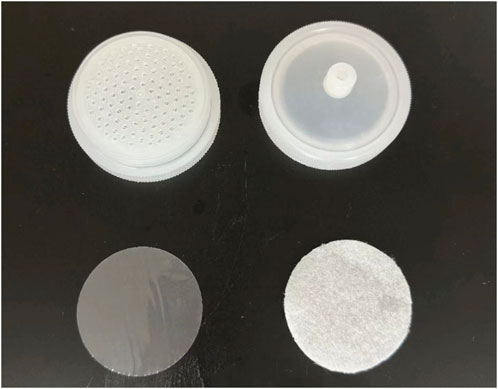
Figure 1. Parts of the stacked-filter.
2.3 eDNA extraction
The samples were transferred to special 15 mL centrifuge tubes. The CTAB and phenol-chloroform protocols were followed for DNA extraction with some modifications. Briefly, samples were incubated at 65°C in a water bath for 10 min. Then 1,000 μL of chloroform-isoamyl alcohol mixture (24:1) was added to the sample tube under a fume hood. The tubes were vortexed vertically for 5 min to mix the liquid well, and then the tubes were centrifuged at 15,000 g for 15 min. After that, the supernatant was transferred to a 2 mL Eppendorf tube, and 250 μL of 5 M NaCl solution and 500 μL of cold isopropanol were added to the solution and kept at −20°C for 1 hour.
Samples were removed from the freezer and centrifuged at 15,000 g for 15 min. The supernatant was slowly poured out. Subsequently, 150 μL of 70% ethanol was added to the sample and centrifuged at 15,000 g for 5 min (repeat this step twice). The supernatant was poured out and the sample was dried in a vacuum dryer at 45°C for 10 min. Finally, 100 μL of TE buffer (preheated to 55°C) was added to elute the DNA. The DNA concentration of the samples was determined using a Nanodrop 3,300 fluorescence spectrophotometer (Thermo Fisher Scientific, Wilmington, DE, U.S.A).
2.4 Estimation of fish DNA using quantitative PCR
A real-time fluorescent quantitative PCR system (CFX connect, BIO-RAD, China) was used to quantify fish DNA in the samples using MiFish primers (Miya et al., 2015). The 15 μL reaction system contained 3 μL of template DNA, 1 μL of each of the forward and reverse primers (10 μM; MiFish-U-F: GTCGGTAAAACTCGTGCCAGC; MiFish-U-R: CATAGTGGGGTATCTAATCCCAGTTTG), 6 μL of 2X T5 Fast qPCR mix (Tsingke Biotechnology Co., Ltd, S/N 1FB219010138, China), and 4 μL of dd H2O. Amplification products of goldfish samples were used as reference for making standard curves. Double-distilled water was used as negative controls. The cycling conditions for qPCR were as follows: 95°C, 1 min; 40 cycles of 95°C, 10 s, 60°C, 30 s, 72°C, 12 s. Fluorescent signals were collected at 72°C. Concentration of fish DNA in the samples were estimated from three replicates, and the copy number was calculated accordingly.
2.5 PCR amplification and sequencing to identify fish species in the eDNA samples
Amplification and sequencing library preparation followed the pipeline of Miya with some modifications. Three replications were performed for each eDNA samples. A pair of inline indices was added to differentiate each PCR replicates and different samples, that is, 6 bp of indices were added between the MiFish primers (Miya et al., 2015) and the Illumina adapter (Wang et al., 2022). The 25 μL reaction system contained 4 μL of template DNA, 1 μL of forward and reverse primers (10 μM), 12.5 μL of PrimeSTAR® MAX DNA Polymerase (Takara, CO. NOR045A, BEIJING), and 6.5 μL of PCR H2O. The primer we used is innovative based on MiFish Primer proposed by Maski Miya, and its specific sequence is displayed in Table 1. The cycling conditions for the first round of PCR were as follows: 95°C for 3 min; 35 cycles of 98°C for 10 s, 60°C for 15 s, 72°C for 15 s; 72°C for 5 min and a final hold at 12°C. After the first round of PCR, magnetic beads were used to wash the PCR products. A second round of PCR amplification was performed using the washed products as template and with standard Illumina P5 and P7 primers. The condition for the second PCR was as follows: 98°C for 45 s; 15 cycles of 98°C for 15 s, 60°C for 30 s, 72°C for 45s; 72°C for 1 min and finally held at 12°C. The amplicons were sequenced as PE150 on an Illumina Nova Seq platform (GENEWIZ, Inc., Suzhou, China).
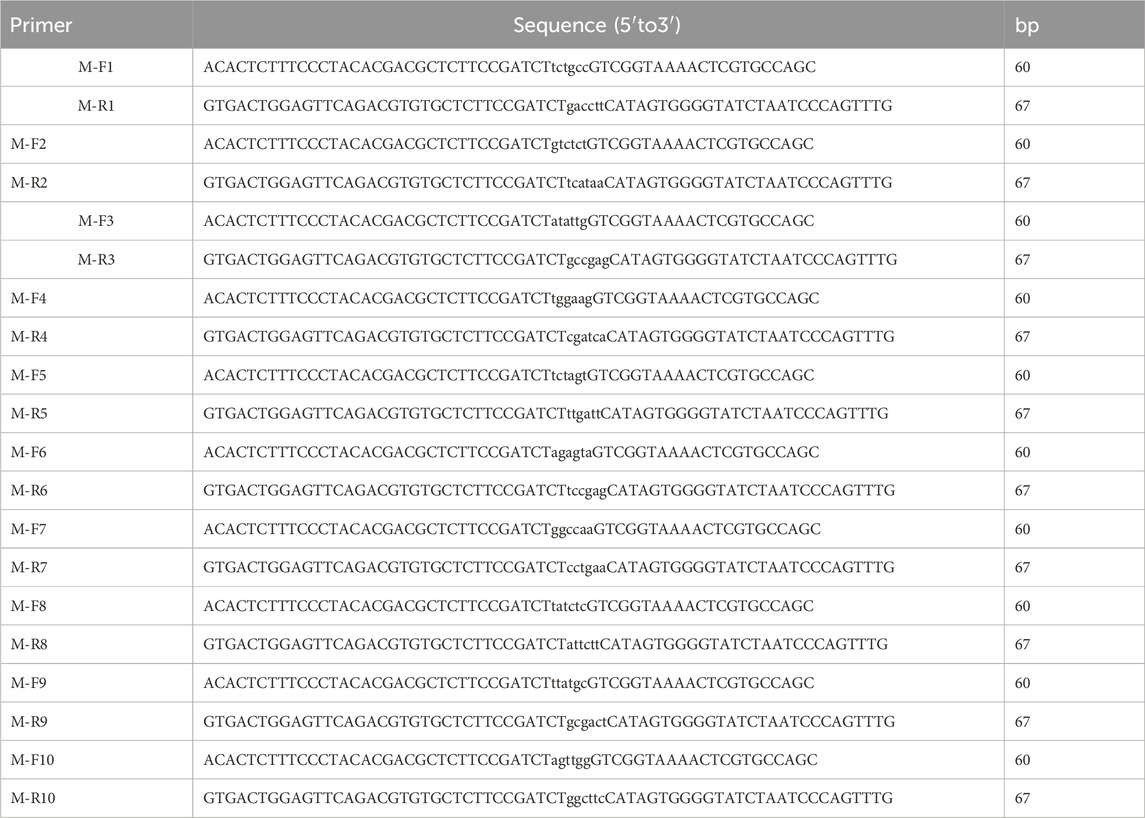
Table 1. MiFish primers with inline index (lower case) and the tail of Illumina adapter.
2.6 Data analysis
The sequencing data were parsed base on the pair of inline indices. Reads with low quality (Q-score <20) and wrong combination of index were excluded. We uploaded the cleaned sequencing data to the webserver implementing the MiFish pipeline (Sato et al., 2018). MiFish pipeline (http://mitofish.aori.u-tokyo.ac.jp/mifish/) server is an all-in-one website that includes primer removal, sequence assembly, and database sequence comparison. Mitofish (v3.87 version) database was used as the reference for comparison (Iwasaki et al., 2013). The similarity threshold was set to 97%, which means that when the sequence similarity was greater than or equal to 97%, the name of the species corresponding to the eDNA sequence and related information were reported.
The result of the species data was compared using a “Venn” plot implemented in R language, including specific and co-detected species in each DNA sample collected with different pore sizes and different filter materials. Information on all detected species was assembled in a table with the name of the detected species. To evaluate the effect of the stacked-membrane filter and different pore sizes on eDNA enrichment, we compared four parameters: filtration time, total eDNA yield, amount of fish DNA, and detection rate of fish species. We used the “gg plot2” in R.4.3.1 to plot the boxplot and performed a log coefficient transformation to match a normal distribution. Comparisons were made for pore size, number of membranes treated and different eDNA concentrations produced by using different filters.
One-way analysis of variance in SPSS27 and t-tests were used to perform significance tests for filtration time, eDNA amount, and fish eDNA for different pore sizes and filters. Fish DNA amounts were presented using a linear bar graph. For species richness in the community, we used accumulation curves for representation. All the R and the package was found in the R Graph Gallery and GitHub.
3 Results
3.1 Effect of different pore size of filter membrane on eDNA enrichment
The shortest average filtration time for 1 L of water sample was 2 min 9 s using 8 μm membrane, ranged from 1 min 58 s to 3 min 24 s. The next shortest average filtration time was 12 min 8 s for 3 μm, ranged from 11 min 37 s to 14 min 27 s. The average filtration time for 1.2 μm was 14 min 31 s, ranged from 12 min 19 s to 16 min 57 s. The average filtration time for 0.2 μm was 32 min and 6 s, ranged from 28 min to 14 s to 36 min and 12 s. There was no significant difference between filtration time using membranes with different pore size, except between 0.2 and 8 µm (p < 0.05).
The average concentration of total extracted DNA was 0.577 ng/μL for the 8 μm filter, 2.388 ng/μL for the 3 μm, 1.404 ng/μL for the 1.2 µm, and 3.785 ng/μL for the 0.2 µm (Figure 2). The results showed no significant difference between concentration of extracted total DNA using 1.2, 3, 0.2 and 8 μm filters (p > 0.05; Figure 2), excepted between that of 3 μm and 8 μm (p < 0.05; Figure 2). There were significantly difference if no identical letters shared between them.
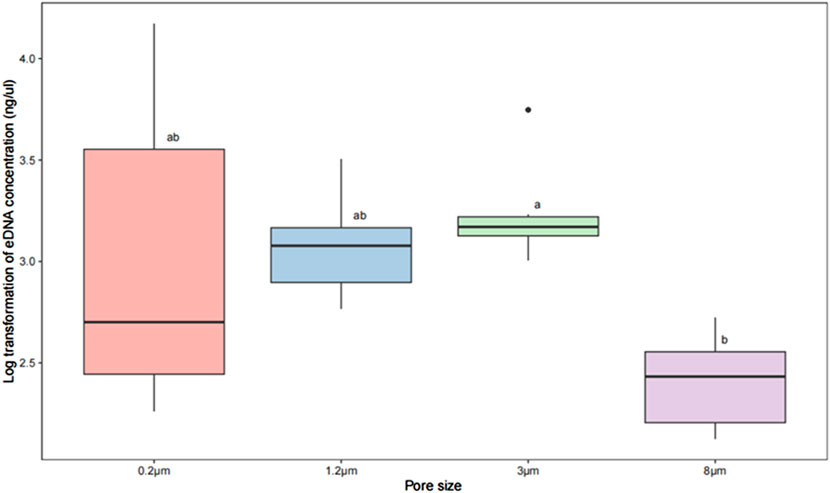
Figure 2. Box plot and one-way ANOVA test on log transformed eDNA concentration enriched with filters of different pore size. The results of using log treatment for concentrations extracted from filters with different pore sizes along with differential comparisons using Tukey test. Comparison between the two groups was carried out at different pore sizes. Within the box plots, each group has a label ‘a’, ‘b’ ‘c’ or a combination of letters to show the result of Tukey multiple comparison tests. The results showed no significant difference in total DNA concentrations extracted from the 1.2, 3, 0.2, and 8 μm filters (p > 0.05), but those extracted by the 3 μm and 8 μm filters differed significantly (p < 0.05).
The qPCR result showed that DNA copy numbers of 8, 3, 1.2, 0.2 μm filters were 5.02E+02, 4.97E+02, 1.63E+03, 5.95E+03, respectively. There was no significant difference between them (p > 0.05, Figure 3).
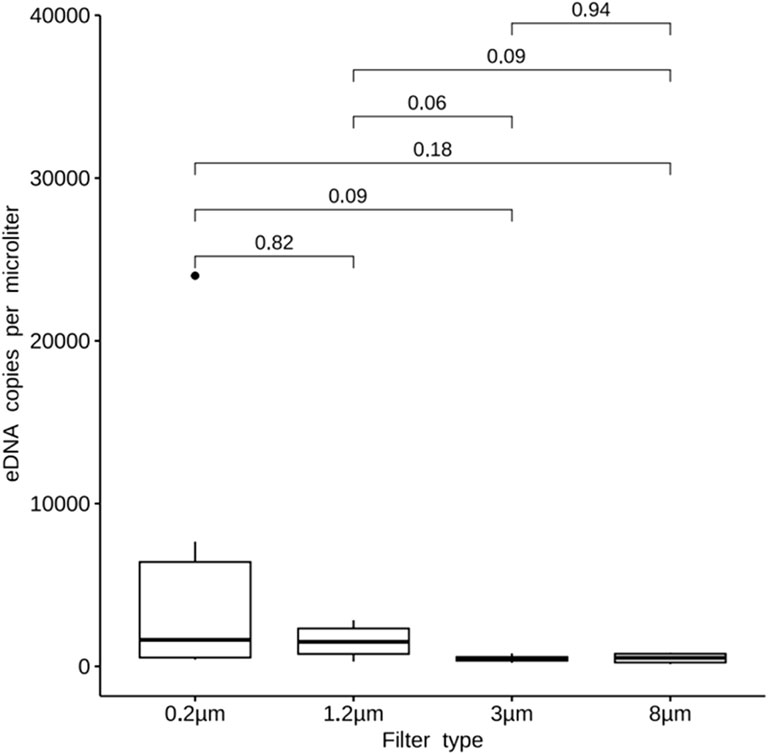
Figure 3. Quantity of fish DNA extracted with different filters. Quantification of fish DNA in samples using a real-time fluorescence quantitative PCR system and MiFish primers. For the results obtained the amount of fish DNA was analyzed for variability using one-way ANOVA with SPSS 27. The results of fish DNA quantification were plotted as linear bar graphs. The results shows DNA copy numbers of 8, 3, 1.2, 0.2 μm filters were 5.02E+02, 4.97E+02, 1.63E+03, 5.95E+03, respectively. There was no significant difference between them (p > 0.05).
A total of 27 species of fishes were detected in this experiment (Table 2), including four species of the Gobiiformes (14.8%), 15 species of the Cypriniformes (55.6%), three species of the Siluriformes (11.2%), one species of the Perciformes (3.7%), as well as one species each for the Clupeiformes (3.7%), the Mugiliformes (3.7%), the Pempheriformes (3.7%). The fish detected include majorly freshwater fish species, but also some brackish species, which is consistent with that the sampling lake is a freshwater lake having a gated channel connecting to the East China Sea. Seventeen species of fish were enriched in the 0.2 µm treatment, of which seven were specific, Pseudorasbora parva, Planiliza haematocheilus, Pseudobrama simoni, Hypophthalmichthys nobilis, Tridentiger bifasciatus, Tridentiger barbatus, Squaliobarbus curriculus. There were ten species of fish obtained in the 1.2 µm treatment, including Sarcocheilichthys variegatus, Lateolabrax maculatus. There were 11 species of fish enriched in the 8 µm treatment, and the Coilia nasus was specifically detected. Twelve fish species found in the eDNA obtained with 3 µm filter, the Tachysurus fulvidraco was only found in this filter (Figure 4). Number of species detected in different treatments and PCR replicates can be found in Table 3.
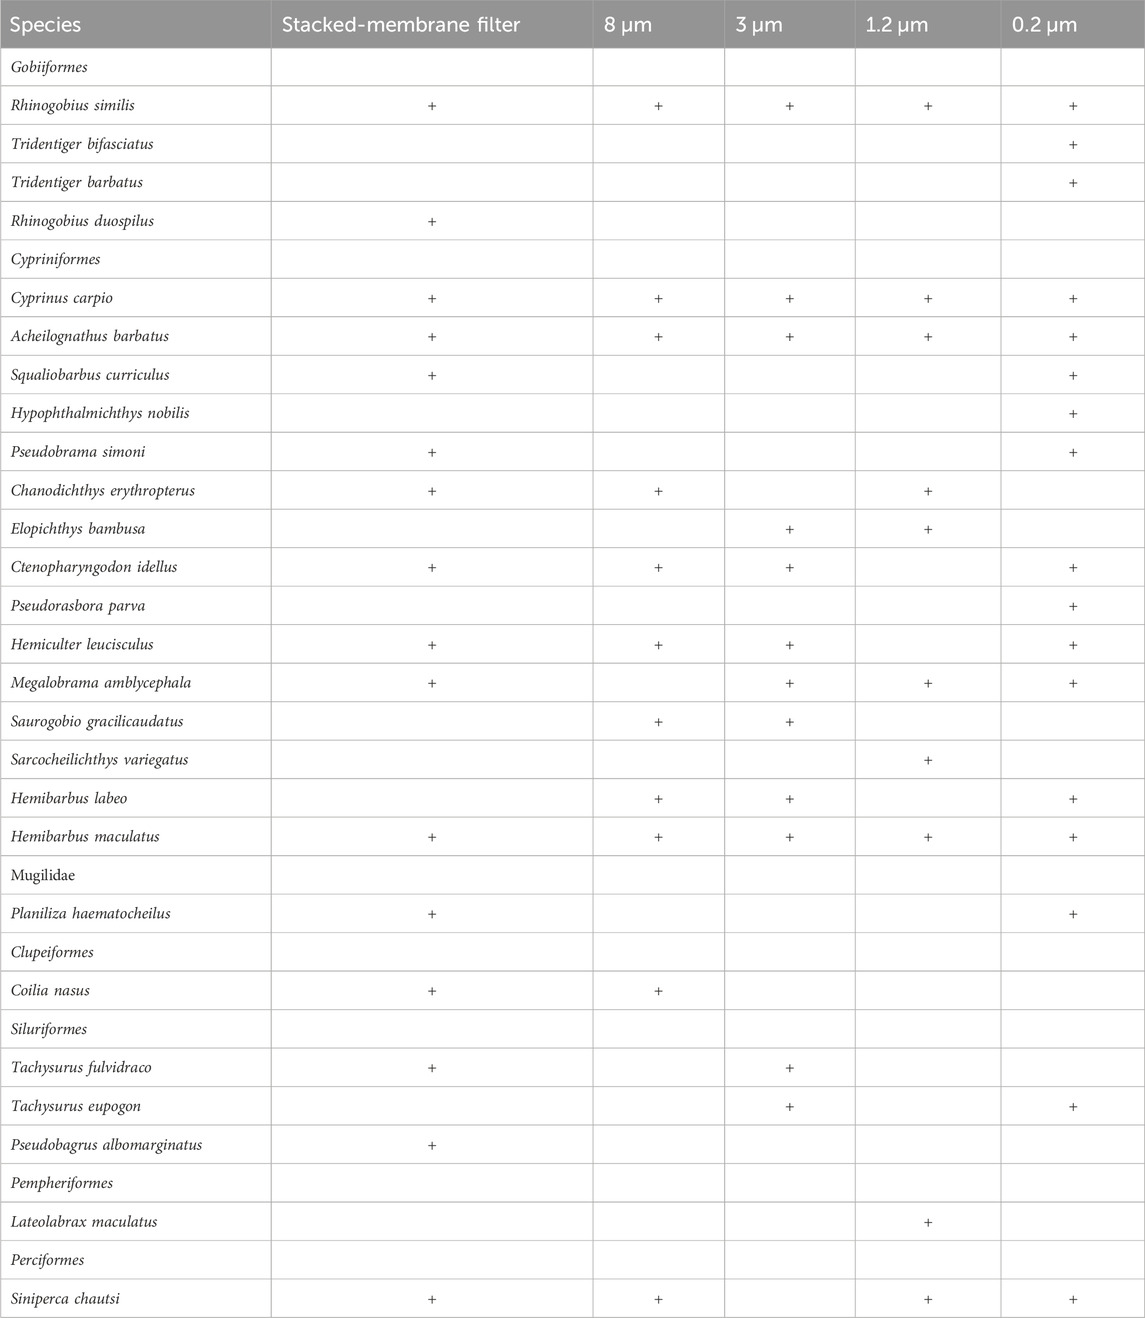
Table 2. Fish species identified in the eDNA samples of different treatments.
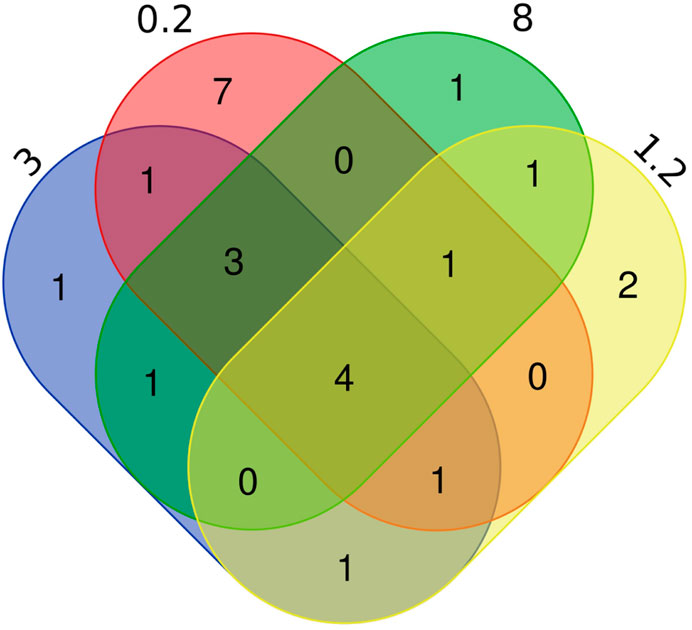
Figure 4. Number of fish species identified in eDNA enriched with different pore sizes. The numbers 0.2, 3, 8, 1.2 represent the different pore sizes (in µm) of filtration membranes, showing the number of replicates of species detected between different pore size.
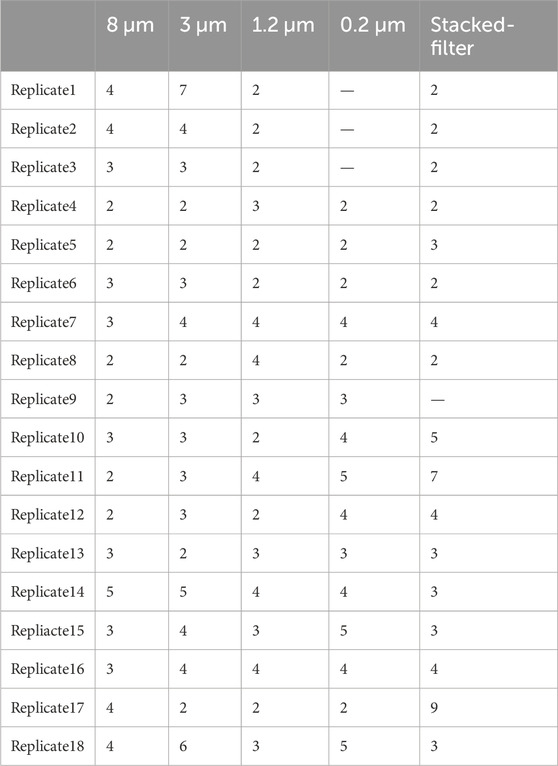
Table 3. Number of species identified in different samples and PCR replicates.
3.2 Effect of changing filter membranes on eDNA enrichment
One liter of water sample was filtered with one PCTE membrane or two 0.5 L water samples were filtered separately using one membrane for each. The average concentration of eDNA extracted from 1 L water sample was 1.576 ng/μL for two membrane trials and 0.4298 ng/μL for one membrane using the 1.2 µm filter membrane. The average value was 1,337 ng/μL for a single membrane and 4.056 ng/μL for two filter membranes in the 3 µm group. The results showed that eDNA concentration was around three times higher using two filter membranes than using one to enrich 1 L of water samples (p < 0.05; Figure 5).
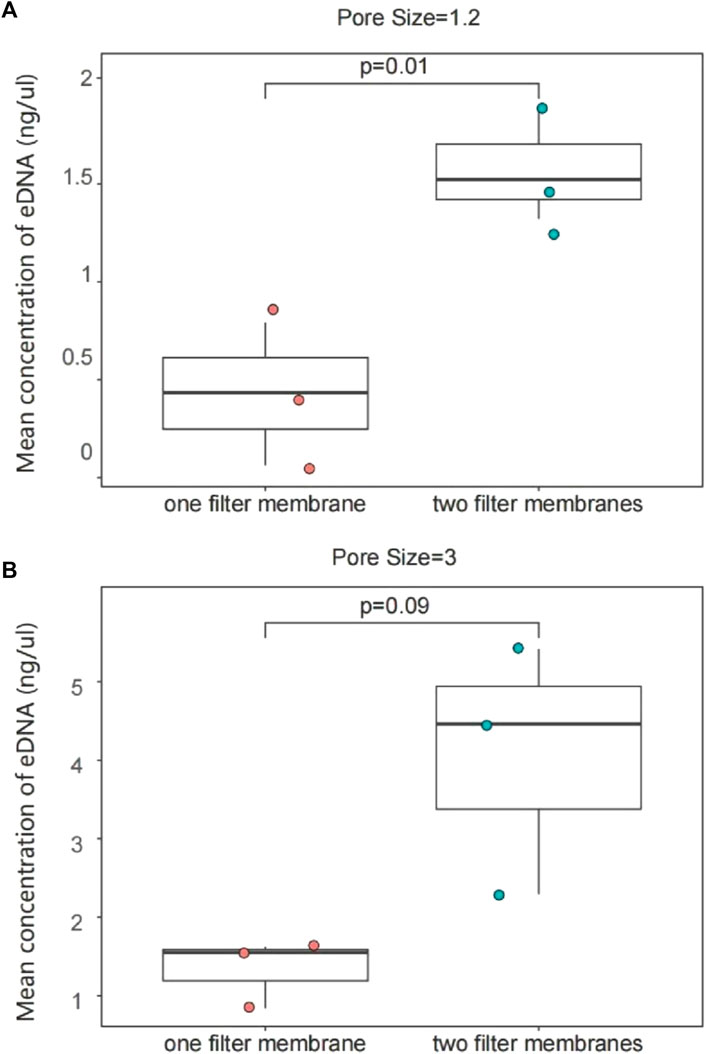
Figure 5. eDNA concentration enriched with one filter membrane or two filter membranes from 1 L of water. 1.2 μm group (A); 3 μm group (B). The results of the eDNA concentration experiments with different numbers of filter membranes between the same pore sizes were interpreted with two sets of plots, AB. (A) The two filter membranes in the 1.2 μm pore size extracted a higher concentration of eDNA; there was also a significant difference; (B) The concentration of eDNA extracted in the 3um pore size was also significantly increased. Each sample point in the figure shows the concentration of different replicates.
3.3 Comparison between the stacked-membrane filter and PCTE-only filter
The boxplot showed that mean eDNA concentration from the stacked-membrane filter had a relative wide range than that of the PCTE-only filter. This implies that the results of stacked-filter device were not as consistent as using PCTE-only filters. The PCTE-only filter (3 µm) resulted in an average concentration of 2.388 ng/μL of eDNA but stacked-membrane filter generated an average concentration of 5.875 ng/μL, which was 2.46 times higher than the former (p < 0.05; Figure 6B). The PCTE-only filter (0.2 µm) resulted in an average eDNA concentration of 3.785 ng/μL. Again, stacked-filter yielded 1.55 times higher eDNA than using PCTE-only filter (p > 0.05; Figure 6A).
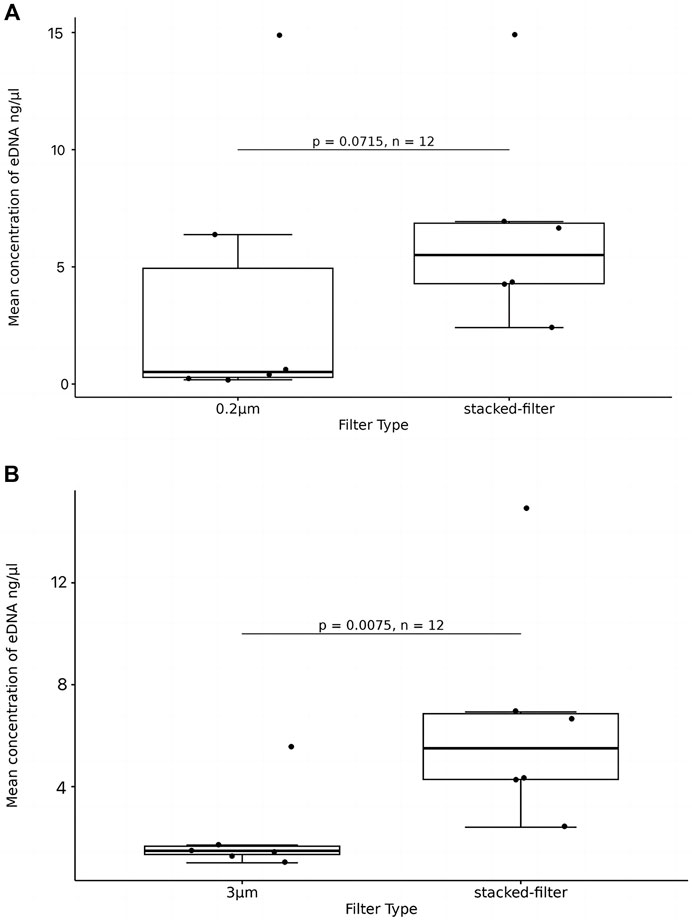
Figure 6. eDNA concentration enriched with stacked-filters or PCTE-only filters. T-tests were used to compare significant differences and box plots were used to show the results. (A) The PCTE-only filter (0.2 µm) resulted in an average eDNA concentration of 3.785 ng/μL. Again, stacked-filter yielded 1.55 times higher eDNA than using PCTE-only filter (p > 0.05); (B) The PCTE-only filter (3 µm) resulted in an average concentration of 2.388 ng/μL of eDNA but stacked-membrane filter generated an average concentration of 5.875 ng/μL, which was 2.46 times higher than the former (p < 0.05).
The filtration time of the stacked-filter was 8 min 36s in average, which was 4 min shorter than that of the PCTE-only filter (p > 0.05). In the 0.2 µm comparison, we find that the stacked-filter time was reduced by 24 min (p > 0.05).
The qPCR results showed that eDNA copy numbers of samples enriched with 3 μm,0.2um and stacked-filters were 4.79E+02,5.95E+03 and 1.53E+04, respectively. The result showed that there was no significant difference between the 0.2 μm filters and the stacked filters (p > 0.05; Figure 7A) while the difference was a significant between the 3 μm filters and the stacked filters (p < 0.05; Figure 7B).
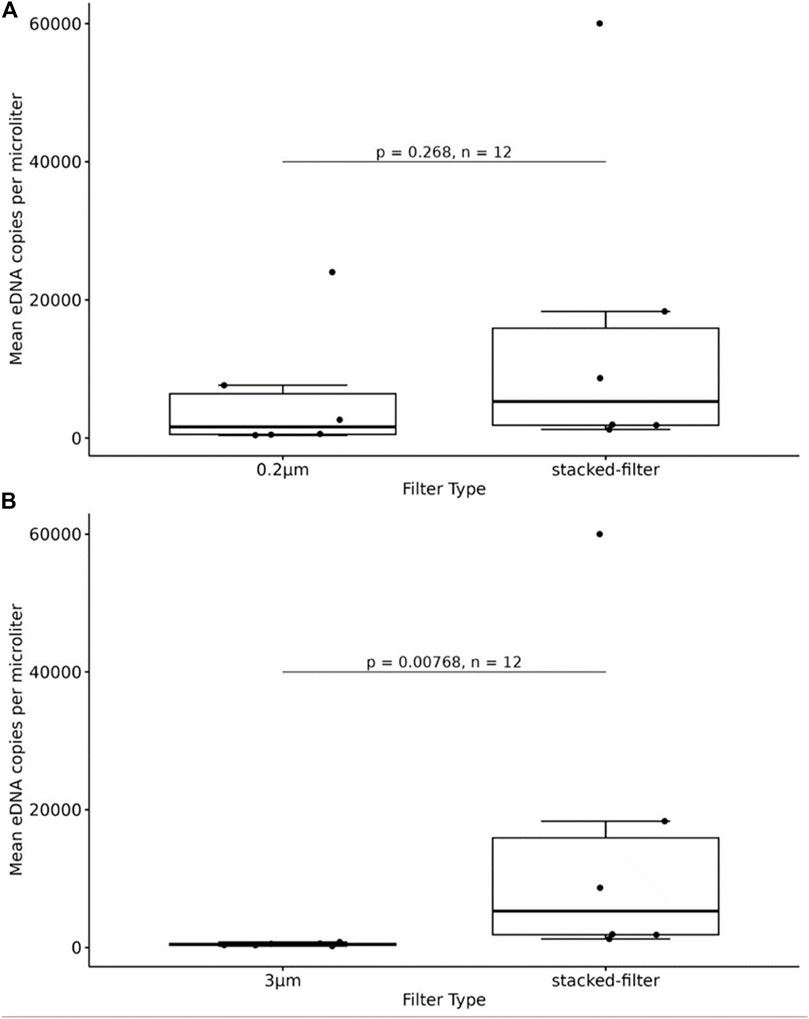
Figure 7. Quantity of fish DNA from samples enriched with the PCTE-only and the stacked-membrane filters, comparing 0.2 μm with stacked-filter. The result showed that there was not a significant difference between the 0.2 μm filters and the stacked filters (A), comparing 3 μm with stacked-filter, the difference was a significant between the 3 μm filters and the stacked filters (B).
The species detected result shows that sixteen species of fishes were detected in the samples of stacked-membrane filters and twelve species were found in the samples of PCTE-only filters (Table 2). There were eight species shared between the results of stacked-membrane filter and the PCTE-only filter (Figure 8). Species specifically detected by stacked-filter included Siniperca chuatsi, P. haematocheilus, P. simoni, C. nasus, Pseudobagrus albomarginatus, Chanodichthys erythropterus, Rhinogobius duospilus, S. curriculus. Species only found in the 3 µm treatment include Hemibarbus labeo, Saurogobio gracilicaudatus, Elopichthys bambusa, Tachysurus eupogon.
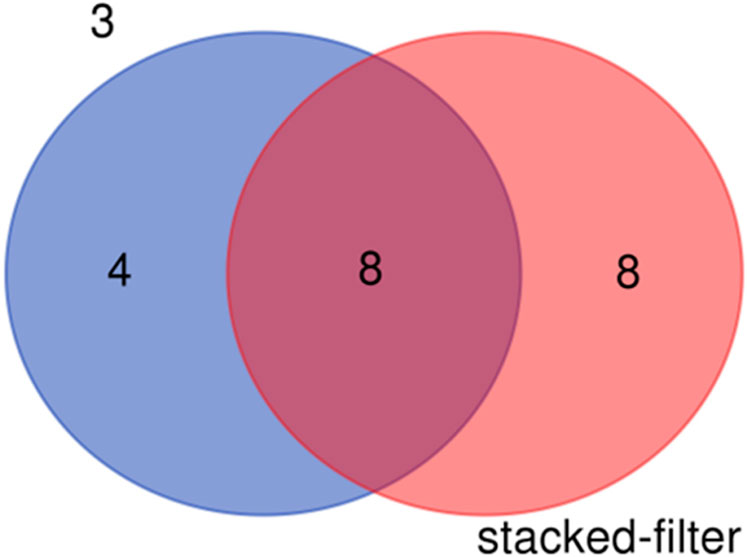
Figure 8. Fish species detected in the eDNA samples enriched with stacked-membrane filters and PCTE-only filters (3 µm).
The result (Figure 9) is based on one sample drawn from fifteen samples, counting 15 draws. Each draw has a corresponding number of species and combining the 25%–75% range of these species is the yellow box. The blue fitted curve behind the yellow box is the fitted curve point confidence interval.
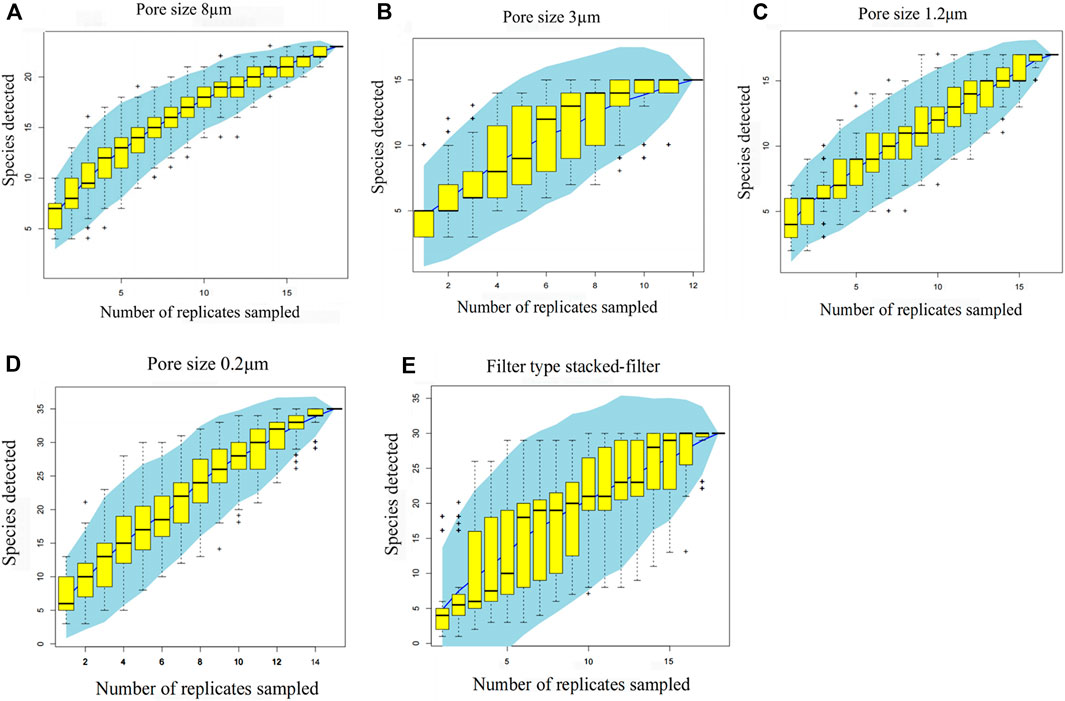
Figure 9. Accumulation graphs for different types of filtrations. Pore size 8 μm (A); pore size 3 μm (B); pore size 1.2 μm (C); pore size 0.2 μm (D); filter type stacked-filter (E). The x-axis is the number of samples and the y-axis is the number of species. The result is based on one sample drawn from 15, counting 15 draws. Each draw has a corresponding number of species, and combining the 25%–75% range of these species is the yellow box. The blue fitted curve behind the yellow box is the fitted curve point confidence interval.
4 Discussion
The effect of pore size on the amount of eDNA extracted from the water samples has been studied previously in different ecosystems (Banks et al., 2021; Ma et al., 2022; Turner et al., 2014a; Kumar et al., 2020). It is agreed that the larger pore size of the filter membrane, the shorter filtration time it would cost, but the quantity of eDNA retained may be not optimal. In contrast, small pore size of the membranes can help gathering more eDNA, but the filtration time would be too long (Andruszkiewicz et al., 2017). Our data corroborated this pattern that the 8 μm membrane used the shortest filtration time comparing to all other pore sizes, but it also obtained the least amount of total eDNA and targeted fish DNA. The amount of eDNA obtained at 0.2 μm was the highest, but the filtration time was the longest. Although the 3 μm membrane did not obtain the highest amount of environmental DNA, it was the most consistent performer compared to the 0.2 and 1.2 µm membranes. When detecting concentrations of fish DNA at different pore sizes, the concentration obtained at 0.2 µm pore size is the highest and the concentration obtained at 8 µm is the lowest. However, in terms of total DNA extracted and the number of species detected, 1.2 µm filters performed worse than 3 µm filters. This is contrary to our common perception. We suspected that when the filter membrane was under vacuum pressure for a prolonged period, the integrity of the pore structure of the membrane maybe damaged and small particles maybe lost. The high variance in data collected with 0.2 µm filters also suggests this hypothesis.
Our results showed that when we used two membranes to filter 1 L of water sample sequentially instead of using only one membrane, the amount of eDNA obtained was more than three times higher. Therefore, when the filtration process is stuck, a long time waiting for the process to complete would not increase the yield of eDNA. This has very significant implications, because the extraction time reported in common practice was often long, e.g., >65 min (Chen et al., 2020), which is bad for eDNA enrichment. Changing membranes during filtration can avoid blocking the pores, but it may also increase the risk of cross-contamination and not easy to operate in the field. Using different filtration devices and materials should help to solve this problem.
The quantity of eDNA often is estimated by the concentration of total DNA, not by the DNA of the target taxa, but with some exceptions. For example (Vautier et al., 2023), set an environmental DNA-based qPCR quantification technique to assess the spawning behavior of the target species, European perch and whitefish. Nevertheless, DNA of the target taxa is more relevant, while DNA of other taxa may bias the estimation of eDNA concentration of target taxa. We used qPCR to quantify the eDNA of fish and found that the amount of fish DNA did not differ significantly between samples collected with different pore sizes. In terms of the number of fish species identified, the 3 μm filter resulted in the second highest number of species among the different pore size filters. Combining all evidence, 3 μm would be the best choice of pore size.
Thick filters membranes, such as GF, MCE can hold more particles, but those need to be cut into pieces and incubated with proteinase K for a long time for DNA extraction. The tedious steps of DNA extraction may increase the risk of cross-contamination. It was reported that cross-contamination accounted for 27.01%–83.00% in an eDNA experiment using GF membrane (Wang et al., 2022). The advantage of PCTE membrane is that it is soluble in phenol-chloroform and easy to fit in the DNA extraction protocol without extra manipulation, but the PCTE membrane is easy to be clogged. The stacked-filter we designed not only can filter a large amount of eDNA in a short time, but also can be partially dissolved in phenol chloroform for easy DNA extraction, so to avoid cross-contamination between samples. The average concentration of eDNA enriched with the stacked-filter was 1.55 times high than that obtained with PCTE-only filter (0.2 μm) (Figure 8). However, the concentration extracted using stacked-filter had a wider range, between 2 and 14 ng/μL per liter, which may be due to the uneven thickness of the PET pad in the stacked-filter. In the future, different thickness, and materials in addition to PET can be tested to improve the performance of the stacked-filters.
Overall, our results showed that stacked-filter made with phenol-dissolvable material can improve the capture and analysis of environmental DNA. However, cautions should be taken when interpreting the results, since only one type of water body, a campus lake was tested. In future, the filter system should be tested in a range of ecological settings, including both freshwater and marine environments, to better understand its universal applicability.
5 Conclusion
Use of 3 µm filter membrane can save time and obtain adequate amounts of eDNA. The stacked-filter designed in this study can trap more particles and hence more eDNA without being stuck. The stacked-filter with a disposable syringe and filter would be useful in the field for fast enrichment of eDNA and for lowing the risk of contamination, which should be evaluated for sampling of eDNA in different geographical locations, ecological environments, and different turbidity levels of water samples.
Data availability statement
The original contributions presented in the study are publicly available. This data can be found here: 10.6084/m9.figshare.25838188 (https://figshare.com/articles/dataset/OTU_data_from_filter_material_of_different_pore_size/25838188).
Author contributions
QL: Conceptualization, Data curation, Formal Analysis, Funding acquisition, Investigation, Methodology, Project administration, Resources, Software, Supervision, Validation, Visualization, Writing–original draft, Writing–review and editing. JT: Data curation, Formal Analysis, Investigation, Methodology, Writing–review and editing. MW: Data curation, Investigation, Project administration, Supervision, Writing–review and editing. NX: Data curation, Investigation, Methodology, Project administration, Writing–review and editing. RQ: Data curation, Formal Analysis, Writing–review and editing. HW: Conceptualization, Data curation, Formal Analysis, Software, Writing–review and editing.
Funding
The author(s) declare that financial support was received for the research, authorship, and/or publication of this article. This work was supported by the “National Key Research and Development Program of China (2022YFC2601301) and Shanghai Science and Technology Innovation Action Plan for Social Development Science and Technology (Project, No. 20dz1204300)”.
Conflict of interest
CL, QL, HW are authors on a patent applied for by Shanghai Ocean University that covers the stacked-filter designed in this study (202210754981.3).
Publisher’s note
All claims expressed in this article are solely those of the authors and do not necessarily represent those of their affiliated organizations, or those of the publisher, the editors and the reviewers. Any product that may be evaluated in this article, or claim that may be made by its manufacturer, is not guaranteed or endorsed by the publisher.
References
Allison, M. J., Round, J. M., Bergman, L. C., Mirabzadeh, A., Allen, H., Weir, A., et al. (2021). The effect of silica desiccation under different storage conditions on filter-immobilized environmental DNA. BMC Res. Notes 14 (1), 106. doi:10.1186/s13104-021-05530-x
Andruszkiewicz, E. A., Sassoubre, L. M., and Boehm, A. B. (2017). Persistence of marine fish environmental DNA and the influence of sunlight. PLoS One 12 (9), e0185043. doi:10.1371/journal.pone.0185043
Bairoliya, S., Xiang, J. K. Z., and Cao, B. (2022). Extracellular DNA in environmental samples: occurrence, extraction, quantification, and impact on microbial biodiversity assessment. Appl. Environ. Microbiol. 88 (3), e0184521. Article e018115-21. doi:10.1128/aem.01845-21
Barnes, M. A., and Turner, C. R. (2015). The ecology of environmental DNA and implications for conservation genetics. Conserv. Genet. 17 (1), 1–17. doi:10.1007/s10592-015-0775-4
Baudry, T., Mauvisseau, Q., Goût, J.-P., Arqué, A., Delaunay, C., Smith-Ravin, J., et al. (2021). Mapping a super-invader in a biodiversity hotspot, an eDNA-based success story. Ecol. Indic. 126, 107637. doi:10.1016/j.ecolind.2021.107637
Beng, K. C., and Corlett, R. T. (2020). Applications of environmental DNA (eDNA) in ecology and conservation: opportunities, challenges and prospects. Biodivers. Conservation 29 (7), 2089–2121. doi:10.1007/s10531-020-01980-0
Brand, S. C., Jeffs, A. G., von Ammon, U., and Zaiko, A. (2022). Assessing the presence, settlement and growth of the invasive Mediterranean fanworm, Sabella spallanzanii, on mussel farms. J. Exp. Mar. Biol. Ecol. 554, 151767. doi:10.1016/j.jembe.2022.151767
Chen, Z., Song, N., Toshifumi, M., Wu, Q., and Gao, T. (2020). The eDNA collection method of zhoushan costal waters. Acta Hydrobiol. Sin. 44. doi:10.7541/2020.007
Dejean, T., Valentini, A., Miquel, C., Taberlet, P., Bellemain, E., and Miaud, C. (2012). Improved detection of an alien invasive species through environmental DNA barcoding: the example of the American bullfrog Lithobates catesbeianus. J. Appl. Ecol., 49(4), 953–959. doi:10.1111/j.1365-2664.2012.02171.x
DiBattista, J. D., Fowler, A. M., Riley, I. J., Reader, S., Hay, A., Parkinson, K., et al. (2022). The use of environmental DNA to monitor impacted coastal estuaries. Mar. Pollut. Bull. 181, 113860. doi:10.1016/j.marpolbul.2022.113860
Djurhuus, A., Port, J., Closek, C. J., Yamahara, K. M., Romero-Maraccini, O., Walz, K. R., et al. (2017). Evaluation of filtration and DNA extraction methods for environmental DNA biodiversity assessments across multiple trophic levels. Front. Mar. Sci. 4. Article 314. doi:10.3389/fmars.2017.00314
Dunker, K. J., Sepulveda, A. J., Massengill, R. L., Olsen, J. B., Russ, O. L., Wenburg, J. K., et al. (2017). Correction: potential of environmental DNA to evaluate northern pike (Esox lucius) eradication efforts: an experimental test and case study. PLoS One 12 (3), e0173837. doi:10.1371/journal.pone.0173837
Echeverria-Beirute, F., Varela-Benavides, I., Jimenez-Madrigal, J. P., Carvajal-Chacon, M., and Guzman-Hernandez, T. (2021). eDNA extraction protocol for metagenomic studies in tropical soils. Biotechniques 71 (6), 580–586. doi:10.2144/btn-2021-0057
Egan, S. P., Barnes, M. A., Hwang, C. T., Mahon, A. R., Feder, J. L., Ruggiero, S. T., et al. (2013). Rapid invasive species detection by combining environmental DNA with light transmission spectroscopy. Conserv. Lett. 6 (6), 402–409. doi:10.1111/conl.12017
Fan, L., Chen, Q., Mairiyangu, Y., Wang, Y., and Liu, X. (2021). Stable vesicle self-assembled from phospholipid and mannosylerythritol lipid and its application in encapsulating anthocyanins. Food Chem. 344, 128649. doi:10.1016/j.foodchem.2020.128649
Fraija-Fernandez, N., Bouquieaux, M.-C., Rey, A., Mendibil, I., Cotano, U., Irigoien, X., et al. (2020). Marine water environmental DNA metabarcoding provides a comprehensive fish diversity assessment and reveals spatial patterns in a large oceanic area. Ecol. Evol. 10 (14), 7560–7584. doi:10.1002/ece3.6482
Goldberg, C. S., Turner, C. R., Deiner, K., Klymus, K. E., Thomsen, P. F., Murphy, M. A., et al. (2016). Critical considerations for the application of environmental DNA methods to detect aquatic species. Methods Ecol. Evol., 7(11), 1299–1307. doi:10.1111/2041-210X.12595
Hanzek, N., Udovic, M. G., Kajan, K., Borics, G., Varbiro, G., Stoeck, T., et al. (2021). Assessing ecological status in karstic lakes through the integration of phytoplankton functional groups, morphological approach and environmental DNA metabarcoding. Ecol. Indic. 131, 108166. Article 108166. doi:10.1016/j.ecolind.2021.108166
Hongo, Y., Nishijima, S., Kanamori, Y., Sawayama, S., Yokouchi, K., Kanda, N., et al. (2021). Fish environmental DNA in Tokyo Bay: a feasibility study on the availability of environmental DNA for fisheries. Regional Stud. Mar. Sci. 47, 101950. doi:10.1016/j.rsma.2021.101950
Hunter, M. E., Ferrante, J. A., Meigs-Friend, G., and Ulmer, A. (2019). Improving eDNA yield and inhibitor reduction through increased water volumes and multi-filter isolation techniques. Sci. Rep. 9, 5259. Article 5259. doi:10.1038/s41598-019-40977-w
Iwasaki, W., Fukunaga, T., Isagozawa, R., Yamada, K., Maeda, Y., Satoh, T. P., et al. (2013). MitoFish and MitoAnnotator: a mitochondrial genome database of fish with an accurate and automatic annotation pipeline. Mol. Biol. Evol. 30 (11), 2531–2540. doi:10.1093/molbev/mst141
Jeunen, G.-J., Knapp, M., Spencer, H. G., Taylor, H. R., Lamare, M. D., Stat, M., et al. (2019). Species-level biodiversity assessment using marine environmental DNA metabarcoding requires protocol optimization and standardization. Ecol. Evol. 9 (3), 1323–1335. doi:10.1002/ece3.4843
Jia, H., Zhang, H., and Xian, W. (2021). Fish diversity monitored by environmental DNA in the yangtze river mainstream. Fishes 7 (1), 1. doi:10.3390/fishes7010001
Jo, T., Murakami, H., Masuda, R., and Minamoto, T. (2020). Selective collection of long fragments of environmental DNA using larger pore size filter. Sci. Total Environ. 735, 139462. doi:10.1016/j.scitotenv.2020.139462
Jo, T., and Yamanaka, H. (2022). Fine-tuning the performance of abundance estimation based on environmental DNA (eDNA) focusing on eDNA particle size and marker length. Ecol. Evol., 12(8), e9234. doi:10.1002/ece3.9234
Kamoroff, C., and Goldberg, C. S. (2018). An issue of life or death: using eDNA to detect viable individuals in wilderness restoration. Freshw. Sci. 37 (3), 685–696. doi:10.1086/699203
Kirtane, A., Atkinson, J. D., and Sassoubre, L. (2020). Design and validation of passive environmental DNA samplers using granular activated carbon and montmorillonite clay. Environ. Sci. Technol. 54 (19), 11961–11970. doi:10.1021/acs.est.0c01863
Knudsen, S. W., Hesselsoe, M., Thaulow, J., Agersnap, S., Hansen, B. K., Jacobsen, M. W., et al. (2022). Monitoring of environmental DNA from nonindigenous species of algae, dinoflagellates and animals in the North East Atlantic. Sci. Total Environ. 821, 153093. doi:10.1016/j.scitotenv.2022.153093
Li, C., Ling, L., Tan, J., Lin, X., Wang, H., Sun, B., et al. (2023). Challenge, breakthrough and future perspectives of environmental DNA technology inmonitoring aquatic organisms. J. Shanghai Ocean Univ., 1–15. doi:10.12024/jsou.20221104019
Majaneva, M., Diserud, O. H., Eagle, S. H. C., Bostrom, E., Hajibabaei, M., and Ekrem, T. (2018). Environmental DNA filtration techniques affect recovered biodiversity. Sci. Rep. 8 (1), 4682. doi:10.1038/s41598-018-23052-8
Matthias, L., Allison, M. J., Maslovat, C. Y., Hobbs, J., and Helbing, C. C. (2021). Improving ecological surveys for the detection of cryptic, fossorial snakes using eDNA on and under artificial cover objects. Ecol. Indic. 131, 108187. doi:10.1016/j.ecolind.2021.108187
Miya, M., Sato, Y., Fukunaga, T., Sado, T., Poulsen, J. Y., Sato, K., et al. (2015). MiFish, a set of universal PCR primers for metabarcoding environmental DNA from fishes: detection of more than 230 subtropical marine species. R. Soc. Open Sci. 2 (7), 150088. doi:10.1098/rsos.150088
Moushomi, R., Wilgar, G., Carvalho, G., Creer, S., and Seymour, M. (2019). Environmental DNA size sorting and degradation experiment indicates the state of Daphnia magna mitochondrial and nuclear eDNA is subcellular. Sci. Rep. 9, 12500. Article 12500. doi:10.1038/s41598-019-48984-7
Muha, T. P., Robinson, C. V., de Leaniz, C. G., and Consuegra, S. (2019). An optimised eDNA protocol for detecting fish in lentic and lotic freshwaters using a small water volume. PLoS One 14 (7), e0219218. Article e0219218. doi:10.1371/journal.pone.0219218
Osathanunkul, M. (2022). An eDNA detection of captive-bred Mekong Giant Catfish in the Chao Phraya River basin for further environmental impacts assessment. Aquaculture 546, 737328. doi:10.1016/j.aquaculture.2021.737328
Osathanunkul, M., and Madesis, P. (2022). Environmental DNA detection of giant snakehead in Thailand's major rivers for wild stock assessment. PLoS One 17 (5), e0267667. doi:10.1371/journal.pone.0267667
Pathiraja, D., Cho, J., Kim, J., and Choi, I.-G. (2023). Metabarcoding of eDNA for tracking the floral and geographical origins of bee honey. Food Res. Int. 164, 112413. doi:10.1016/j.foodres.2022.112413
Persaud, S. F., Cottenie, K., and Gleason, J. E. (2021). Ethanol eDNA reveals unique community composition of aquatic macroinvertebrates compared to bulk tissue metabarcoding in a biomonitoring sampling scheme. Diversity-Basel 13 (1), 34. Article 34. doi:10.3390/d13010034
Plough, L. V., Ogburn, M. B., Fitzgerald, C. L., Geranio, R., Marafino, G. A., and Richie, K. D. (2018). Environmental DNA analysis of river herring in Chesapeake Bay: a powerful tool for monitoring threatened keystone species. PLoS One 13 (11), e0205578. doi:10.1371/journal.pone.0205578
Ruppert, K. M., Davis, D. R., Rahman, M. S., and Kline, R. J. (2022). Development and assessment of an environmental DNA (eDNA) assay for a cryptic Siren (Amphibia: Sirenidae). Environ. Adv. 7, 100163. doi:10.1016/j.envadv.2021.100163
Sahu, A., Kumar, N., Pal Singh, C., and Singh, M. (2023). Environmental DNA (eDNA): powerful technique for biodiversity conservation. J. Nat. Conservation 71, 126325. doi:10.1016/j.jnc.2022.126325
Sato, Y., Miya, M., Fukunaga, T., Sado, T., and Iwasaki, W. (2018). MitoFish and MiFish pipeline: a mitochondrial genome database of fish with an analysis pipeline for environmental DNA metabarcoding. Mol. Biol. Evol. 35 (6), 1553–1555. doi:10.1093/molbev/msy074
Shi, X. J., Liu, G., Zhang, M., Zhao, J., Li, H., Yang, Z., et al. (2020). Membrane-sensitive bacterial DNA extractions and absolute quantitation of recovery efficiencies. Sci. Total Environ. 708, 135125. doi:10.1016/j.scitotenv.2019.135125
Shu, L., Ludwig, A., and Peng, Z. (2020). Standards for methods utilizing environmental DNA for detection of fish species. Genes 11 (3), 296. Article 296. doi:10.3390/genes11030296
Tillotson, M. D., Kelly, R. P., Duda, J. J., Hoy, M., Kralj, J., and Quinn, T. P. (2018). Concentrations of environmental DNA (eDNA) reflect spawning salmon abundance at fine spatial and temporal scales. Biol. Conserv. 220, 1–11. doi:10.1016/j.biocon.2018.01.030
Tsuji, S., Ushio, M., Sakurai, S., Minamoto, T., and Yamanaka, H. (2017). Water temperature-dependent degradation of environmental DNA and its relation to bacterial abundance. PLoS One 12 (4), e0176608. doi:10.1371/journal.pone.0176608
Uthicke, S., Robson, B., Doyle, J. R., Logan, M., Pratchett, M. S., and Lamare, M. (2022). Developing an effective marine eDNA monitoring: eDNA detection at pre-outbreak densities of corallivorous seastar (Acanthaster cf. solaris). Sci. Total Environ. 851, 158143. doi:10.1016/j.scitotenv.2022.158143
Vautier, M., Chardon, C., Goulon, C., Guillard, J., and Domaizon, I. (2023). A quantitative eDNA-based approach to monitor fish spawning in lakes: application to European perch and whitefish. Fish. Res. 264, 106708. doi:10.1016/j.fishres.2023.106708
Verdier, H., Konecny-Dupre, L., Marquette, C., Reveron, H., Tadier, S., Gremillard, L., et al. (2022). Passive sampling of environmental DNA in aquatic environments using 3D-printed hydroxyapatite samplers. Mol. Ecol. Resour. 22 (6), 2158–2170. doi:10.1111/1755-0998.13604
von Ammon, U., Pochon, X., Casanovas, P., Trochel, B., Zirngibl, M., Thomas, A., et al. (2023). Net overboard: comparing marine eDNA sampling methodologies at sea to unravel marine biodiversity. Mol. Ecol. Resour. 23 (2), 440–452. doi:10.1111/1755-0998.13722
Wang, S., Yan, Z., Hanfling, B., Zheng, X., Wang, P., Fan, J., et al. (2021). Methodology of fish eDNA and its applications in ecology and environment. Sci. Total Environ. 755 (Pt 2), 142622. doi:10.1016/j.scitotenv.2020.142622
Wang, X., Lu, G., Zhao, L., Yang, Q., and Gao, T. (2020). Assessment of fishery resources using environmental DNA: small yellow croaker (Larimichthys polyactis) in East China Sea. PLoS One 15 (12), e0244495. Article e0244495. doi:10.1371/journal.pone.0244495
Wang, Y., Yuan, H., Huang, J., and Li, C. (2022). Inline index helped in cleaning up data contamination generated during library preparation and the subsequent steps. Mol. Biol. Rep. 49 (1), 385–392. doi:10.1007/s11033-021-06884-y
Webster, H. J., Emami-Khoyi, A., van Dyk, J. C., Teske, P. R., and Jansen van Vuuren, B. (2020). Environmental DNA metabarcoding as a means of estimating species diversity in an urban aquatic ecosystem. Anim. (Basel) 10 (11), 2064. doi:10.3390/ani10112064
Wu, Y., Tang, Y., Li, J., Liu, K., Li, H., Wang, Q., et al. (2019). The application of environmental DNA in the monitoring of the Yangtze finless porpoise, Neophocaena phocaenoides asaeorientalis. J. Fish. Sci. China 26 (No.1), 124–132. doi:10.3724/sp.j.1118.2019.18133
Xing, Y., Gao, W., Shen, Z., Zhang, Y., Bai, J., Cai, X., et al. (2022). A review of environmental DNA field and laboratory protocols applied in fish ecology and environmental health. Front. Environ. Sci. 10. Article 725360. doi:10.3389/fenvs.2022.725360
Zaiko, A., von Ammon, U., Stuart, J., Smith, K. F., Yao, R., Welsh, M., et al. (2022). Assessing the performance and efficiency of environmental DNA/RNA capture methodologies under controlled experimental conditions. Methods Ecol. Evol. 13 (7), 1581–1594. doi:10.1111/2041-210x.13879
Zhang, L., Zhou, W., Jiao, M., Xie, T., Xie, M., Li, H., et al. (2023). Use of passive sampling in environmental DNA metabarcoding technology: monitoring of fish diversity in the Jiangmen coastal waters. Sci. Total Environ. 908, 168298. doi:10.1016/j.scitotenv.2023.168298
Keywords: stacked-membrane filter, filter pore size, PCTE, PET, environmental DNA
Citation: Liu Q, Tan J, Wang M, Xin N, Qi R and Wang H (2024) Optimization of pore size and filter material for better enrichment of environmental DNA. Front. Environ. Sci. 12:1422269. doi: 10.3389/fenvs.2024.1422269
Received: 23 April 2024; Accepted: 28 May 2024;
Published: 14 June 2024.
Edited by:
Shuping Wang, Chinese Research Academy of Environmental Sciences, ChinaReviewed by:
Wei Kang, Chinese Academy of Fishery Sciences, ChinaJunyi Zhang, Jiangnan University, China
Copyright © 2024 Liu, Tan, Wang, Xin, Qi and Wang. This is an open-access article distributed under the terms of the Creative Commons Attribution License (CC BY). The use, distribution or reproduction in other forums is permitted, provided the original author(s) and the copyright owner(s) are credited and that the original publication in this journal is cited, in accordance with accepted academic practice. No use, distribution or reproduction is permitted which does not comply with these terms.
*Correspondence: Hui Wang, d2g5MjY0QGdtYWlsLmNvbQ==
†These authors contributed equally to this work