 Yuhu Cui
- 1School of Business, Shandong University, Weihai, China
- 2College of Business, Qingdao University of Technology, Qingdao, China
- 3School of Bohai, Hebei Agricultural University, Baoding, China
- 4Research Center for Marine Economy and Coastal Economic Belt, Hebei Normal University of Science & Technology, Qinhuangdao, China
- 5Institute of State Governance, Shandong University, Jinan, China
The marine economic development demonstration zone (MEDDZ) is the regional marine functional policy that assumes the significant tasks of innovation in the system and mechanism of the marine economy, optimization of the marine industrial structures, and the construction of marine ecological civilization. This paper constructs a panel database of 11 coastal provinces in China from 2006 to 2019, takes the Zhejiang Marine Economy Development Demonstration Zone Plan officially approved by the State Council of China in 2011 as a quasi-natural experiment, applies the synthetic control method (SCM) to evaluate the effect of implementation of the MEDDZ policy on marine industrial structure optimization in Zhejiang. The results show that: (1) The MEDDZ policy significantly promotes the structure optimization of the marine industry in Zhejiang and the existence of the policy lag phenomenon. (2) Based on the results of the robustness tests, we find that the fitted path of policy effects is better when the time of MEDDZ implementation is adjusted to 2012. (3) Government financial support and marine cargo capacity play a role in implementing the MEDDZ policy, positively affecting and optimizing the coastal marine industry’s structure. Therefore, we make some suggestions from the perspectives of strengthening the policy implementation process, focusing on the policy lag phenomenon, and broadening funding sources, thus enriching theoretical research on policies in the field of the marine industry and providing practical references for the development of other coastal demonstration zones.
1 Introduction
The optimization of the structure of the marine industry refers to the process of achieving coordinated development and gradual improvement of the comprehensive benefits of various marine industries, which guides the transformation of traditional marine industries towards diversified development, emphasizes the enhancement of the upstream and midstream links of the value chain of the marine industry, and promotes the green, low-carbon and sustainable development of the marine industry, realizing the complementarity of the advantages of the resources of the coastal region and the mutual benefits of the industry (Liu and Chen, 2022). Nowadays, coastal countries around the world are oriented by SDG-14 to promote sustainable development through the protection and sustainable use of oceans and marine resources (Virto, 2018). So, China is actively accelerating the integration of strategic resources in the marine industry, which has shown strong resilience with the gradual expansion of the marine industrial scale, continuous optimization of the industrial structure, and vigorous development of new industries. According to the Statistical Bulletin of China’s Marine Economy, 2010–2022 (see Figure 1), China’s coastal marine economy has been steadily developing, and the proportion of Gross Ocean Product (GOP) to Gross Domestic Product (GDP) in the past 10 years has remained approximately 9%; the marine industry structure has been continuously optimized, with the ratio of the structure of the marine three industries being 4.6:36.5:58.9, and the internal structure showing a trend of continuous optimization, which has made the marine industry an essential growth point for China’s marine economic development. Therefore, exploring the practical factors and policy effects that promote the coastal marine industrial structure optimization is significant for improving the international impact of China’s marine economy.
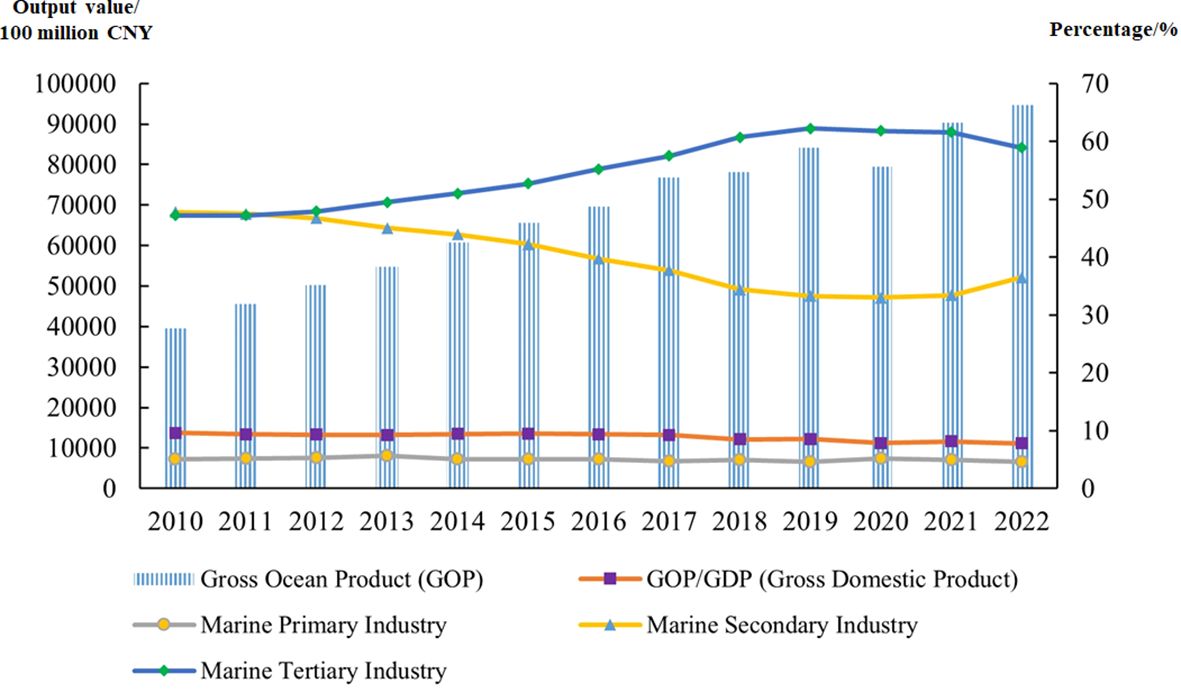
Figure 1 China’s coastal marine economic production and industrial structure, 2010–2022.
The marine economic development demonstration zone (MEDDZ) policy is one of China’s major coastal strategies, which aims to achieve the goals of sustainable marine resource utilization, environment protection, and economic growth by enhancing the development of the marine industry. Zhejiang, a large coastal economic province facing the East China Sea, has a sea area of 260,000 square kilometers, a coastline of over 6,000 kilometers, and over 4,300 islands (Lou et al., 2012). It has distinct advantages in marine resources, making it a critical nexus for developing China’s coastal blue economy in the new era. The “Zhejiang Marine Economic Development Demonstration Zone Plan” was formally approved by the State Council of China in 2011, indicating that Zhejiang has given birth to the first plan incorporated into the national development strategy. In recent years, Zhejiang has focused on major sea-related strategies, such as MEDDZ policy and the new area of the Zhoushan Islands. It has empowered the high-quality development of the marine economy with innovation as it continues to progress from a “large marine province” to a “strong marine province.” As a result, the development of Zhejiang’s marine economy has accelerated, and its strength has gradually moved into the country’s first square (Lin et al., 2022). In conclusion, starting from the general situation of the ocean power strategy, it is of great practical significance to reasonably assess the policy effect of MEDDZ on the marine industrial structure optimization and to promote the development of the marine economy in coastal areas.
In this paper, we use the Zhejiang Marine Economic Development Demonstration Zone in 2011 as a quasi-natural experiment, empirically test the impact effect of the MEDDZ policy on the optimization of the marine industry structure and based on the coastal 11 provincial-level regions panel data from 2006-2019 with synthetic control method (SCM) and verifies the above effect through a series of robustness tests. The innovations of this paper are mainly reflected in the following aspects: First, we analyze the impact of the MEDDZ policy on the marine industrial structure optimization to enrich the method of evaluating the marine policy’ effect and to provide policy suggestions for improving the management system of the coastal marine economy. Second, this paper summarizes the general experience of the construction of Zhejiang’s MEDDZ, provides references for the construction of the coastal region, and promotes sustainable development of the marine economy. Third, we use the SCM to compare and analyze the trend of optimizing coastal marine industrial structure in Zhejiang, alleviate the possible problems of endogeneity and selection bias of the traditional econometric model, and make the assessment method more accurate and reliable.
2 Literature review
2.1 The impact of marine policy goals on the marine industrial structure of coastal countries
Marine policy objectives are related to marine industrial structure optimization of the world’s coastal countries (Qi, 2022), which have formulated a series of marine policies and plans to promote the structural optimization and restructuring of the marine industry in response to the global challenges of the development of marine resources, environmental protection, and sustainable development. The United States enacted “the Blue Earth Act” in February 2021 to implement the Sustainable Development Goals, supporting marine innovation, accelerating the progress of marine technology, improving the monitoring of essential sea areas, promoting the development of new industries, for instance, offshore wind power and desalination, and transitioning to a green, low-carbon and environmentally friendly environment, thus optimizing and upgrading of the marine industry structure. In April 2023, according to Vietnam’s Resolution 48/NQ-CP, Vietnam will effectively use marine resources to serve socio-economic development, significantly reduce marine pollution, protect marine biodiversity, and reduce the impact of natural disasters. By 2030, marine resources will serve coastal tourism, develop natural resources such as oil and gas, aquaculture, renewable energy, and other areas of the marine economy to improve living standards and promote the transformation and elevation of the marine industry (Dang et al., 2017). Overall, a global marine policy has an essential role to play in guiding and promoting the optimization of the marine industrial structure of the world’s coastal countries, encouraging them to focus on sustainability, environmental friendliness, and resource-use efficiency in the development of the marine economy.
With the requirement of building maritime community with a shared future (Wang C., 2023), China has been profoundly participating in global ocean governance, from actively exploring maritime fishery cooperation and joint development of resources with neighboring countries setting up several Asian cooperation funds to provide the impetus for regional maritime cooperation to put forward the initiative of building the 21st-Century Maritime Silk Road and actively fostering the interconnection and economic integration of the countries along the route, and jointly pushing for the sustainable development of the global maritime industry (Zhang and Yu, 2019). Some scholars have proposed the concept of “blue growth,” which emphasizes the need to achieve economic and social goals through sustainable promotion of the development of the marine industry (Brent et al., 2020). Meanwhile, existing studies have elaborated on the marine environmental governance frameworks constructed by China and the Republic of Korea. These frameworks have expanded the existing marine data sets to identify the root causes of regional marine pollution and provide realistic references for governments to guide the optimization of the structure of the marine industry (Yuan and Lee, 2023).
2.2 Research on the structure of China’s marine industry
Chinese researchers have investigated primarily the efficiency of the coastal marine industry, the quality of development, and the improvement of paths (Wang S. et al., 2021; Guo et al., 2022). Existing research analyzes new initiatives for global marine economic development and, when combined with Chinese marine conditions, presents the implementation of the SDG-14, and strengthens international marine cooperation and other perspectives (Löhr et al., 2017); China’s marine economy has made significant progress, but there are still some weaknesses. An et al. (2022) proposed scientific and technological innovation to promote high-quality marine economic development.
Even though the marine power strategy has been implemented, there are still uncertainties in China’s coastal and coastal management. It is critical to study the relationship between the structure of coastal marine industries and the growth of the marine economy for the structure of coastal marine industries (Jiang et al., 2014). Su (2020) takes the lead in analyzing the factors affecting the change in the structure of the coastal marine industry, then describes the intrinsic relationship between the two influences, and finally explores the relationship between the change in the structure of the coastal marine industry and economic growth. Meanwhile, some studies on coastal science and technology and industrial transformation have used panel-fixed effect and random effect models to empirically analyze the impact of China’s marine science and technology on the optimization and upgrading of coastal marine industries (Wang L. et al., 2021), and then make policy recommendations. Chen and Qian (2020) analyze the dual impact of different types of marine environmental regulations on the upgrading of the structure of the coastal manufacturing industry and industrial transfer and show a positive ‘U’ type relationship, in which the inflection point of the pollution industry transfer time is earlier than the time of upgrading the industrial structure and consider the intermediary. Furthermore, some results have been found in coastal marine ecological security by developing a comprehensive multifunctional marine ecological security system dynamics model, discovering the constraints of China’s coastal marine ecological security, and then presenting the corresponding policy recommendations (Wang S. et al., 2021). The preceding results investigate many aspects of China’s coastal marine industry structure, providing a better theoretical foundation for this article’s study.
2.3 Research on methods of evaluation of policy effects
The policy evaluation methods used in existing research are mainly based on Difference-in-Differences (DID) and Regression Discontinuity (RD), which Instrumental Variable (IV) and Propensity Score Matching (PSM) supplement (Liu et al., 2022; Yuan et al., 2023b). Furthermore, traditional econometric models remain the primary methods for assessing the implementation effects of relevant policies at various levels and fields (Fox and Swearingen, 2021). Some studies in coastal marine policy assessment primarily focus on theoretical elaboration from macro descriptions, building coastal policy assessment frameworks, and marine protected area planning, with fewer relevant empirical studies (Voyer et al., 2012; Biedenweg et al., 2016). So, this paper applies the SCM to the study of coastal marine policy evaluation, which can effectively alleviate subjective bias and endogeneity problems in the traditional econometric regression model and avoid the problem of unrealistic policy effects due to data error and time intervention.
In conclusion, the literature reviewed above provides a solid foundation for this study. However, the following areas need improvement: (1) The existing literature is primarily from the macro level of the marine economy and industrial structure to carry out related measurement studies, and we should focus more on coastal policy in the marine field. (2) Only a few results are based on the premise of marine economy development and empirical assessment of the effects of marine policy implementation, which necessitates more standardized and systematic theoretical guidance. (3) The impact path of coastal marine economic policy on the development of the marine economy and the optimization of industrial structures is relatively complex, and part of the research only empirically explores the theory and requires more condensation of the experience summary.
3 Policy background and theoretical analysis
3.1 Background of the policy
MEDDZ refers to improving modern marine industry agglomerations with international competitiveness in coastal-specific marine areas by innovating marine investment systems, optimizing marine management mechanisms, and improving marine policies. The MEDDZ policy’s goal is to promote the integration of marine scientific and technological innovation and marine three industries, as well as the efficient use of marine resources and the long-term development of the marine economy. This policy has its origins in May 2003, when the State Council of China issued the Outline of the National Marine Economic Development Plan, which condensed the following development goals: the formation of distinct marine economic zones, the marine economy becoming a new growth point for the national economy and step-up efforts to build China into a strong maritime country. Next, the Twelfth Five-Year Plan for National Economic and Social Development of the People’s Republic of China, published in October 2010, states that developing the marine economy, formulating, and implementing marine development strategies, and rationally developing and using marine resources is necessary. In this context, the State Council of China approved the ‘Zhejiang Marine Economic Development Demonstration Zone Plan’ in February 2011. The construction of the Zhejiang marine economic demonstration zone was a national strategy, and it was the first marine economic development demonstration zone plan in China and the first national economic development strategy in Zhejiang Province after 1949.
3.2 Theoretical analyses
The MEDDZ policy and the optimization of marine industrial structures are inextricably linked and mutually reinforcing. They both play critical roles in the process of high-quality development of the coastal marine economy (Wu, 2019). Theoretically, the MEDDZ policy provides support and guarantees for optimizing and upgrading marine industrial structures. The Government has stimulated the flow of elements of coastal marine resources through the formulation of a series of marine industry plans, and coastal regions strive to connect with international standards, flexibly introducing foreign investment power and advanced technology into China’s marine industry market, perfecting the allocation of marine resources, and improving the marine development environment (Huang and Liu, 2022). Meanwhile, the demonstration zone actively encourages the coastal marine industry to develop green and low carbon, guides marine enterprises in technological innovation and product upgrading, and accelerates the transformation of the marine industry’s scientific and technological achievements. As a result, the demonstration zone policy can support and protect the development of the coastal marine economy while also creating favorable conditions for structural optimization and upgrading of the marine industry (see Figure 2). Based on the above analysis, this paper proposes the first hypothesis:
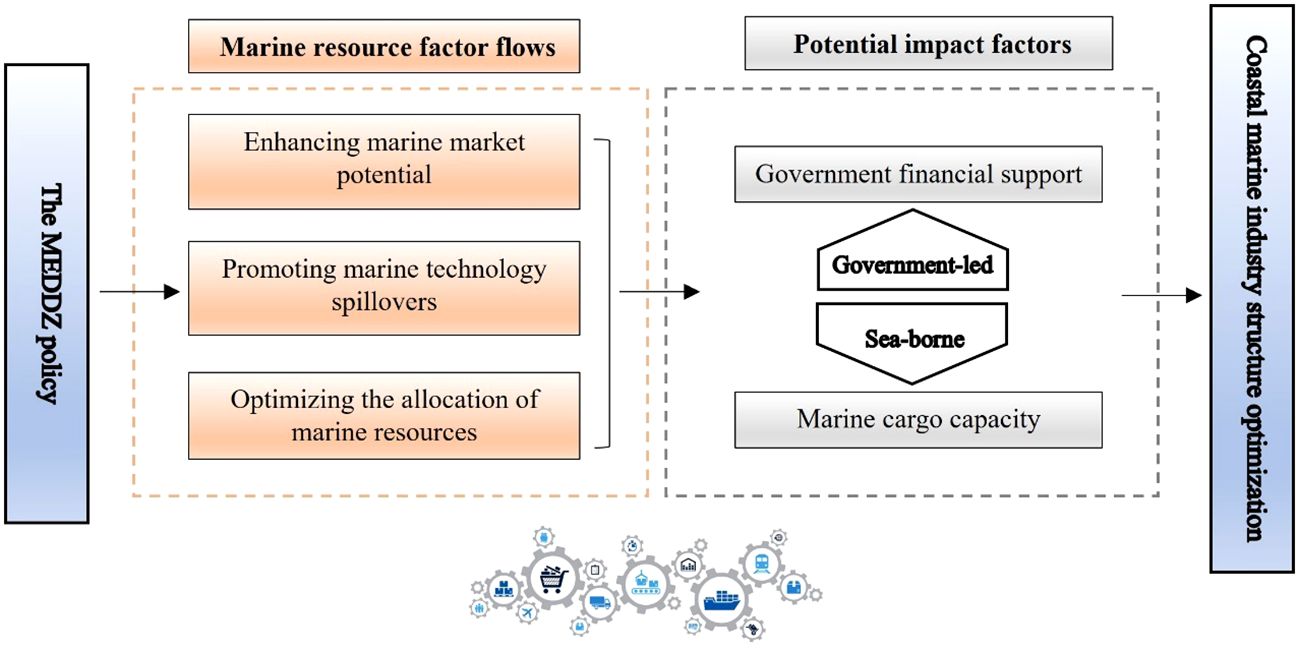
Figure 2 Mechanism of MEDDZ influence on the marine industry structure optimization.
H1: The MEEDZ policy effectively promotes coastal marine industry structure optimization.
At the realistic level, the construction of MEDDZ has supported and guided the technological transformation and upgrading of marine industries within the demonstration zones through financial inputs (Yuan et al., 2023a), promoting the transformation of traditional marine industries into high-value-added, and environmentally friendly marine industries, and optimizing the structure of marine industries. Also, along with the continuous improvement of the infrastructure construction of the marine industry within the demonstration zone, promoting the expansion of shipping routes, ship construction, port construction, and other aspects of development, improving the efficiency of marine transportation and service level, and providing better support for the marine industry chain (Dawley, 2014; Duarte et al., 2020). Given the solid regional nature of the marine industry’s development, optimizing the industrial structure could promote the complementary and coordinated development of industries in various regions, which is conducive to the strengthening of cooperation between the coastal state and localities, the formation of a mechanism for the collaborative development of the marine industry, and the implementation of policies in the marine field on an all-encompassing scale. Because of this, we propose the second hypothesis:
H2: The MEDDZ policy pushes for marine industry structure optimization under the impact of factors including government financial support and marine cargo capacity.
4 Methodology
4.1 Econometric modeling
According to the research theme of this paper, selecting a scientific and reasonable assessment method is an essential part of reflecting the impact of the MEDDZ policy on optimizing the coastal marine industry’s structure. The SCM is mainly applied to policy assessment and macro-analysis and is currently one of the more effective non-parametric methods. Most of the existing literature uses the DID to evaluate policies (Athey and Imbens, 2022; Xu et al., 2022). It is simple, straightforward, and directly reflects the policy effect, but its preconditions are strict. It not only requires the treatment and control groups to be completely randomized and homogeneous but also that the policy intervention should not have a spillover effect on the control group (Stuart et al., 2014). Compared with the reality of this study, it is not easy to satisfy the randomness of the policy and differences in the endowment conditions between the treatment group and the control group, which do not have a common trend. In addition, the country’s approval of the Zhejiang Marine Economic Development Demonstration Zone plan as a policy shock only partially satisfies the model homogeneity.
Therefore, when the study cannot accurately identify the optimal control group in the policy pilot region, the SCM creates a corresponding virtual control group by linearly weighting several other groups, including the intervention group. It simulates a situation in which the intervention group is unaffected by the policy, thereby assessing its implementation effect, which can be applied to situations where the experimental group consists of one or very few subjects (Kaul et al., 2022). Compared to traditional DID and RD, the SCM can assess the policy effect of the MEDDZ on optimizing the coastal marine industrial structure more objectively and scientifically. It is most visible in the following areas: (1) As a nonparametric method, SCM is more intuitive and concise in terms of model setup and dummy variable meanings than traditional DID. (2) SCM is supported by a data-driven approach to weight summing of selected control groups, and ultimately synthesizes a virtual experimental group with characteristics very similar to those of the experimental group prior to the policy disturbance, to analyze the specific effects of the policy disturbance on the experiment (Kim et al., 2020). Extending the results of a comparative experiment conducted on the same region over a certain period to optimize the structure of the coastal marine industry in the case where the region becomes a MEDDZ and those where it does not, is indicated in this paper. The above difference in results represents MEDDZ’s policy effect on optimizing the coastal marine industry structure.
The SCM process is built as follows:
Assume that the assessment variable for optimizing the marine industrial structure is Y and that the existing data on the marine industrial structure of M+1 provinces for period T, if province 1 becomes a MEDDZ in year T0 but the other M provinces do not. Yit1 represents the potential results that province I becomes a MEDDZ in period t, while Yit0 represents the potential results that province I does not become a demonstration zone in period t. T0 is set to 2011 because the MEDDZ policy refers to the event when Zhejiang Province was approved by the State Council of China in 2011. As a result, the effect of the MEDDZ policy on industrial structure optimization in Zhejiang Province can be expressed as follows (Abadie and Gardeazabal, 2003):
For Equation (1), as Yit1 and Yit0 cannot be observed simultaneously for the same region, we import the dummy variable, Dit. Dit=1 indicates that province i establishes a model district policy in period T0, and Dit=0 indicates that it does not become a model district in period T0, and then Yit1=Yit0.
If αit is the policy effect of a model MEDDZ, when t ≤ T0, Yit1=Yit0 ; when T0< t ≤ T, Yit1=Yit0+αit(i=1,⋯,M+1;t=1,⋯,T), where Yit0 is unobservable, and to obtain αit counterfactual result corresponding to Yit0 must to be fitted. Based on this, to further estimate the counterfactual outcome of the implementation of the policy in province 1, the following model is constructed to represent Yit0:
In Equation (2), δt represents a time fixed-effect, θt is a vector of unidentified parameters, Zi is a control variable not affected by MEDDZ, λtμ is an unobservable co-factor, and εit is an unobservable error term.
To solve Yit0, it has been studied to introduce a weight vector W=(w2,…,wM+1) satisfying Wj≥0, j=2,…,M+1, and w2+…+wM+1 = 1. Each observation of the vector W, which represents a synthetic control for province 1, gives the result in Equation (3):
Then we assume that there exists a weight vector (w2*,…,wM+1*) such that the Equation (4):
The existing studies have proved that if T0Σt=1λ'tλtis a nonsingular matrix (Abadie et al., 2010), which can be obtained:
In regular conditions, the result of Equation (5) will converge to 0. Therefore, if and only when T0< t ≤ T, ∧Y10t=∑M+1j=2w*jYjt. Finally, the estimated value of the optimization effect of the coastal marine industry structure following the establishment of the MEDDZ is obtained:
In Equation (6), the appropriate weight vector w* is significant in the solution process, and an approximate solution frequently determines the synthetic control vector (Abadie et al., 2015).
4.2 Description of variable selection
4.2.1 Data source
Using the SCM, we empirically analyze the impact of MEDDZ on optimizing marine industrial structures in Zhejiang using panel data from 11 coastal provinces from 2006 to 2019. The data came primarily from the China Marine Economic Statistical Yearbook for 2007–2020, the statistical yearbooks for each province, and the marine economy statistical bulletin. Among them, the State Council of China formally approved the Zhejiang Marine Economic Development Demonstration Zone Plan in February 2011, marking the official upgrade of the MEDDZ to a national strategy. Then, Zhejiang Province is used as an experimental group following the research objectives of this paper. The control group comprises the ten coastal provinces of Liaoning, Hebei, Tianjin, Shandong, Jiangsu, Shanghai, Fujian, Guangdong, Guangxi, and Hainan. So, we create a balanced panel dataset and the study area for Figure 3.
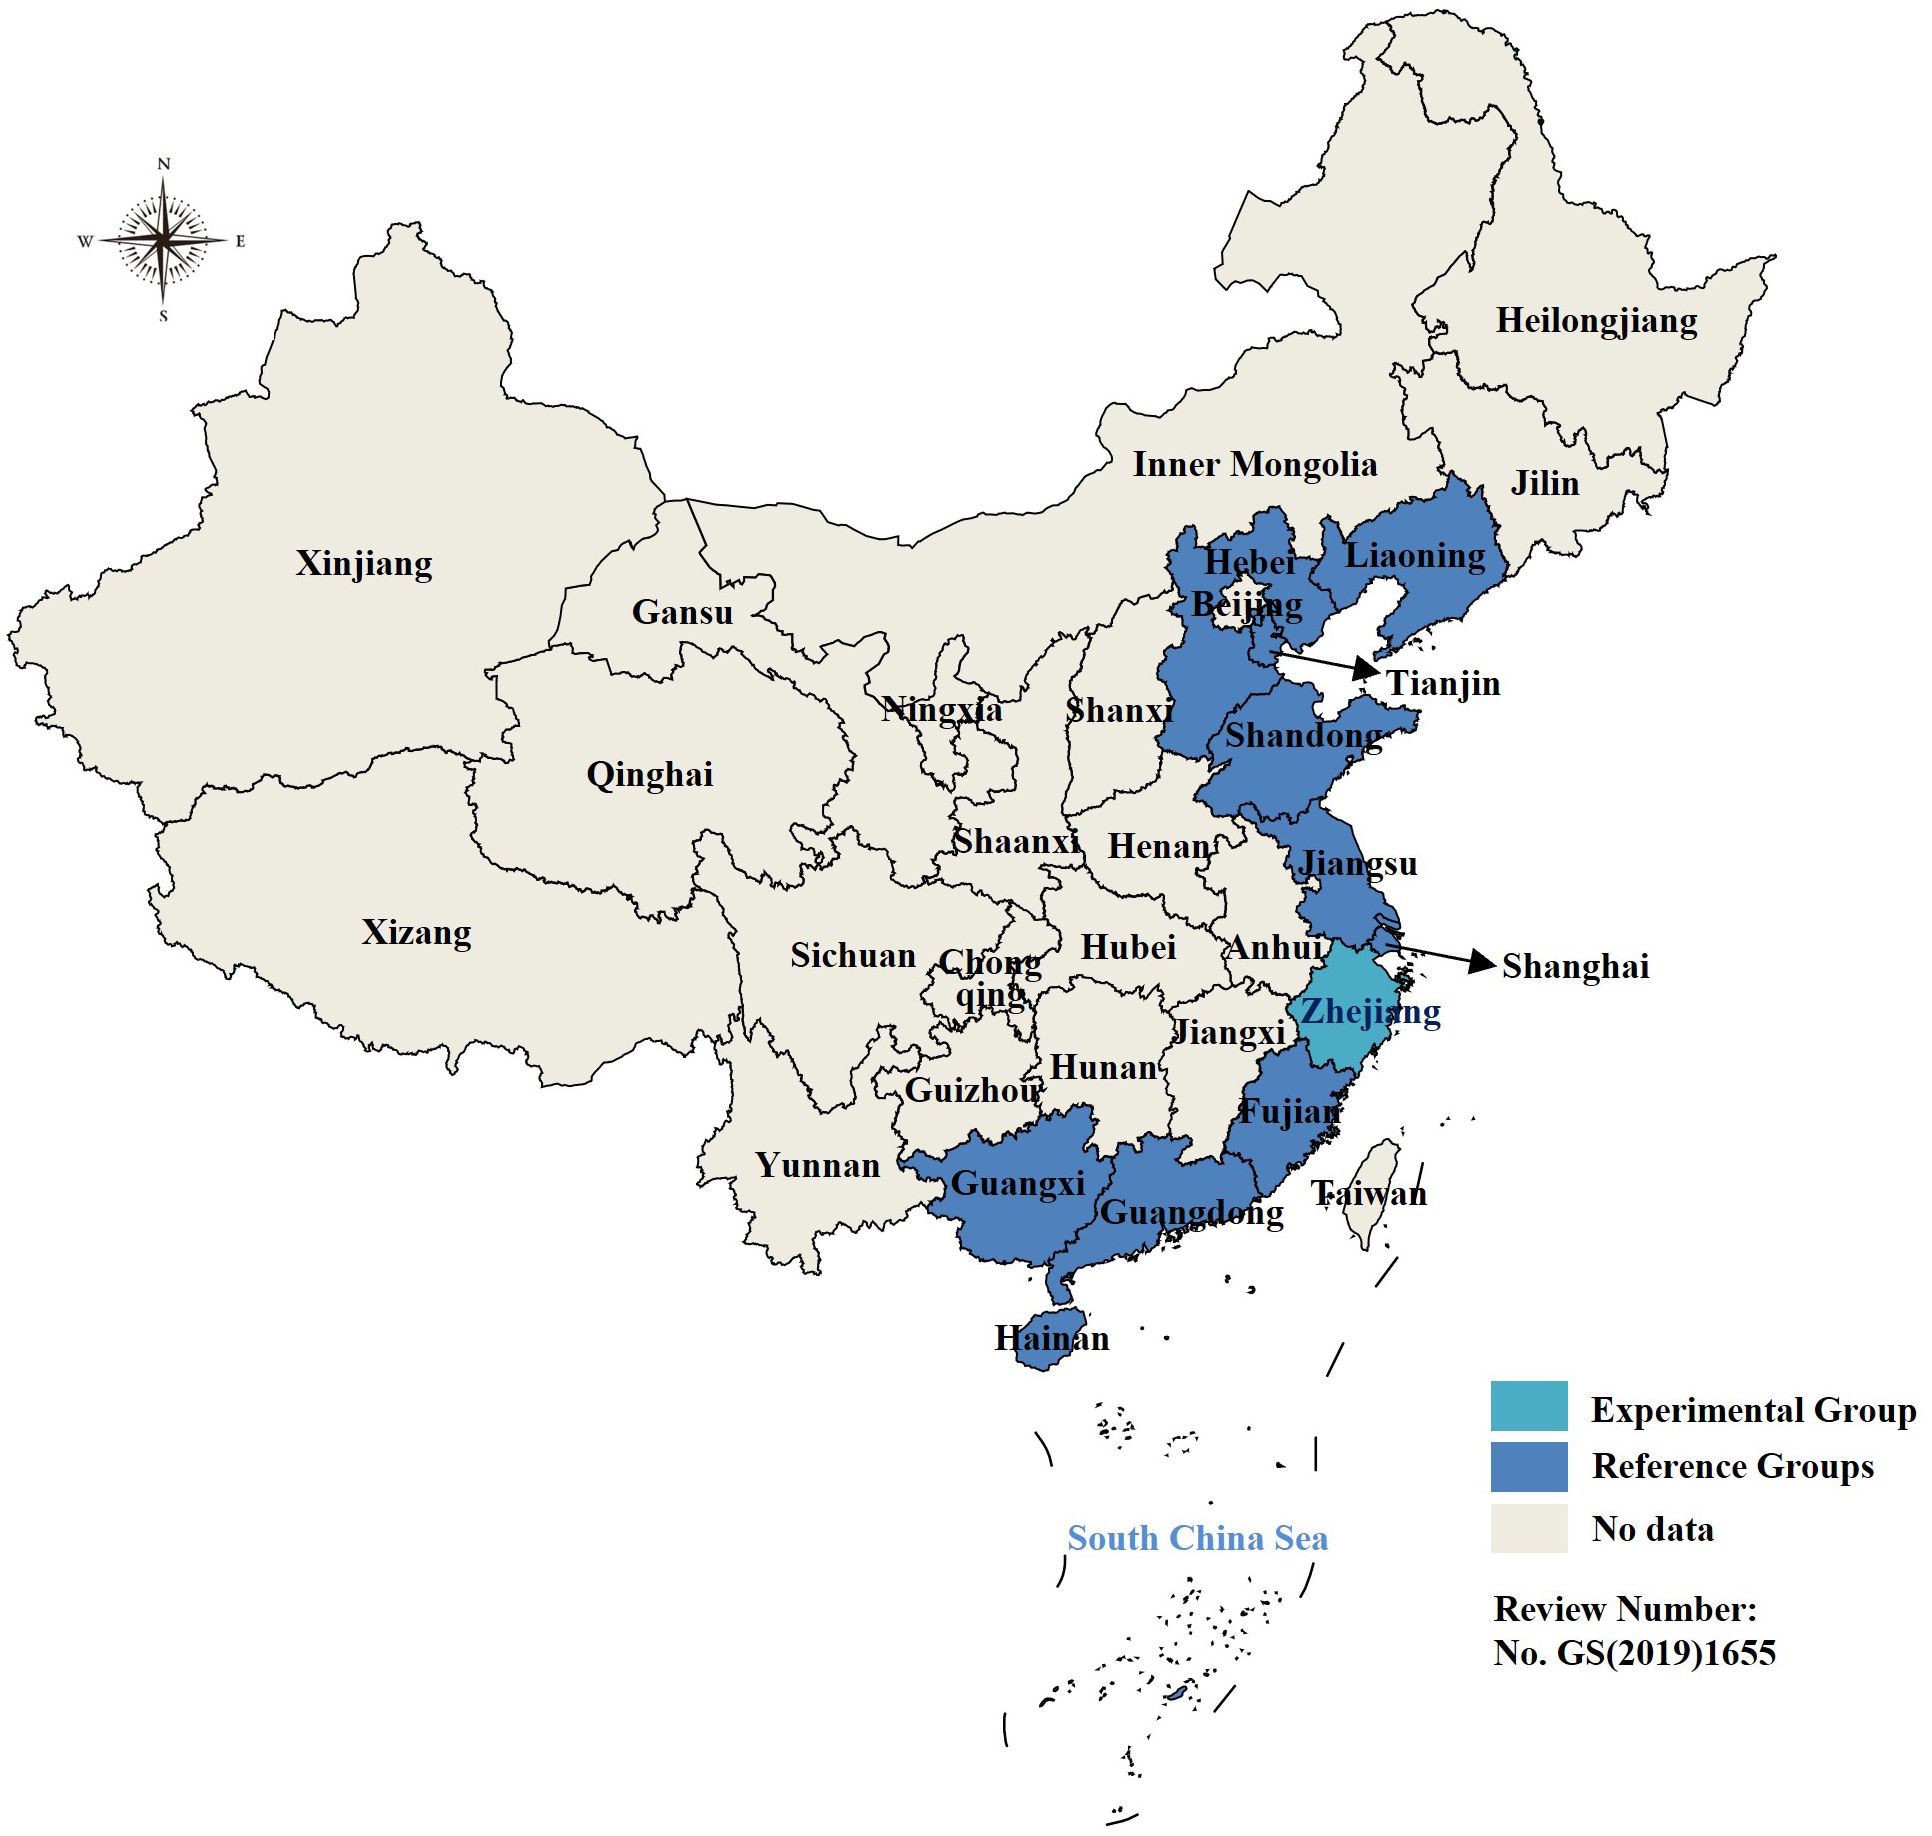
Figure 3 Study area map.
4.2.2 Description of variables
For the explained variable, marine industrial structure optimization is the primary dimension of industrial structure transformation and upgrading, reflecting the dynamic process of marine industrial structure evolving from low-level to high-level state based on the history and logical sequence of marine economic development (Yu and Wang, 2021). We refer to the existing studies that adopt the method of structural hierarchy coefficient (He and Zheng, 2023), which portrays the evolution of the marine three industries at the quantitative level in terms of the relative change of the share ratio and is calculated as follows:
In Equation (7), q(m) is the ratio of the marine industry m to GDP, n=3, and the Str value range is [1,3]. If the marine industrial structure optimization index is high, the marine industrial structure is reasonable and coordinated, and the overall utilization rate of the integrated resources of the three marine industries is high; otherwise, it means that the marine industry structure still needs to be improved.
Also, we selected the following indicators as predictor variables to use the weighted average of the indicator values of other coastal regions to approximate the marine industry structure in MEDDZ without being approved: (1) The coastal marine industry’s economic development level (lnMel). The overall development of the marine economy has a direct impact on the transformation and upgrading of the marine industry (Wang B. et al., 2021), as measured by the regional gross marine product to GDP ratio. (2) The extent to which foreign development has occurred in the marine environment (lnOel). Opening to the outside world is an important part of optimizing the structure of the marine industry, which is measured by the ratio of coastal ports’ foreign trade volume to cargo throughput (Zheng et al., 2022). (3) The level of interest in marine tourism (lnOtl). Tourism service industries in coastal areas are critical to optimizing three marine industries (Gössling et al., 2018). The room occupancy rate of star-rated hotels in coastal provinces is calculated. (4) The level of marine aquaculture carrying capacity (lnOal). Marine aquaculture represents the traditional marine industry, and the total area of coastal marine aquaculture is used here (Kluger and Filgueira, 2021). (5) The coastal marine transport capacity (lnOtc). The core content reflecting the reasonable layout of the marine industry is the convenience and carrying capacity of marine transportation. The amount of freight in the coastal ocean is calculated (Damian et al., 2022). (6) The ability of marine science and technology to innovate (lnMti). The high and low levels of marine science and technology innovation capacity are critical factors in determining whether the structure of the marine industry can be optimized (Li et al., 2021), which is measured by the number of marine patent authorizations. (7) The level of marine human resources (lnMhl). Marine employees’ education level reflects the potential to optimize the marine industry’s structure. It is calculated as the number of students enrolled in marine majors in higher education institutions (Júnior et al., 2016), which includes three levels of undergraduate, master, and doctoral degrees, and is expressed in terms of 1,000 people. Linear interpolation was used to fill in the missing values of the variables listed above. Table 1 lists the definitions and descriptive statistics for each variable for the 11 coastal provinces of China (including the experimental group Zhejiang).
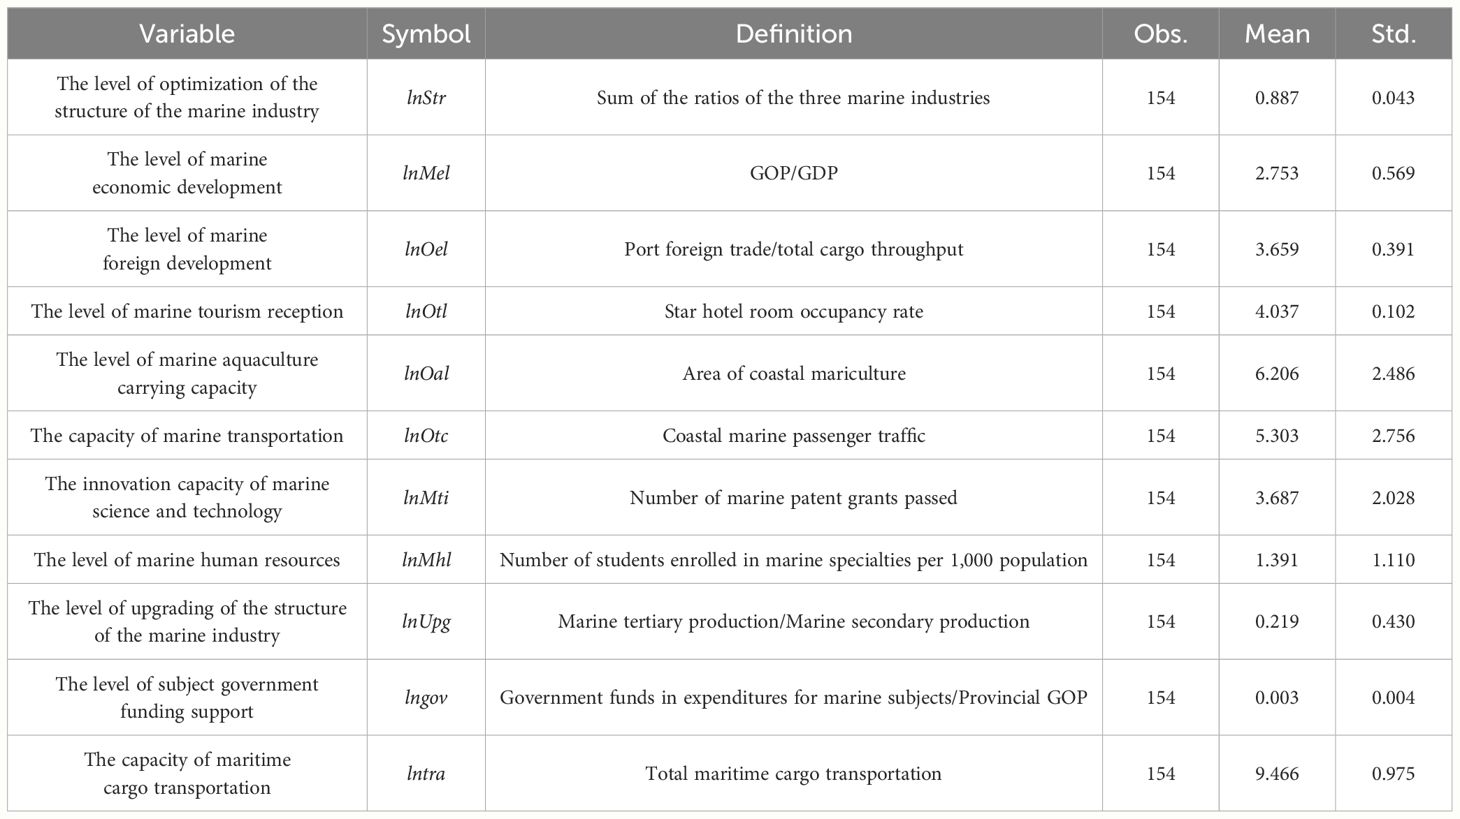
Table 1 Descriptive statistics of variables.
5 Results
5.1 Synthetic control baseline results
To evaluate the impact of MEDDZ on optimizing the marine industrial structure, Zhejiang is the experimental group, and the other ten provinces are the control group in this paper. Stata 16.0 software is used in this section to synthesize the control and calculate the weight proportion of synthetic Zhejiang. The real and synthetic values of each predictor variable are compared in Table 2. The difference between real and synthetic control values based on optimal weight combinations is slight.

Table 2 Real vs. Synthetic values of predictor variables for SCM.
The root mean square prediction error (RMSPE) value of the model output is 0.00409 when combined with Table 3, indicating that the synthetic control model is well fitted and can be used to assess the policy effect of the MEDDZ on the optimization of the marine industrial structure. Meanwhile, the synthetic Zhejiang is made up of five provinces: Fujian, Guangdong, Hainan, Jiangsu, and Liaoning, whose marine development is like that of the real Zhejiang, with weight values of 0.022, 0.455, 0.126, 0.313, and 0.084. To better assess the effect of policy implementation, we include Guangxi, which weighs 0, in the placebo test.
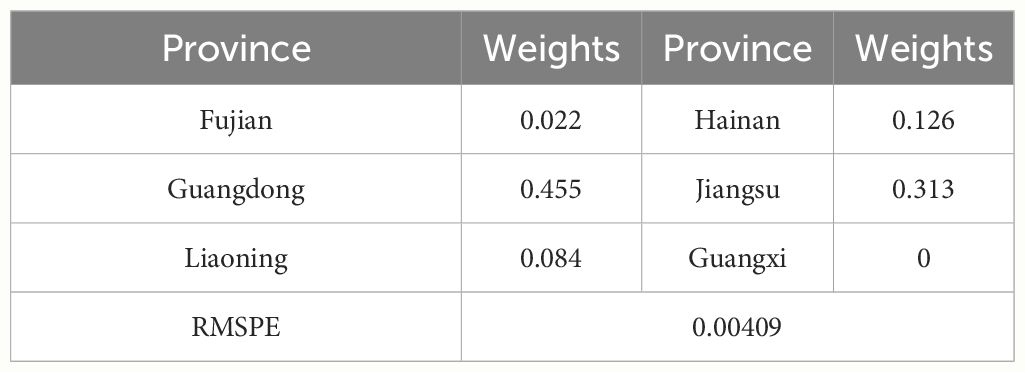
Table 3 Control group object weights.
The change paths and difference values of the real and synthetic values of Zhejiang’s marine industrial structure optimization are empirically plotted based on the weighting situation of the control group in Table 3. In Figure 4A, the solid line represents the real value of Zhejiang’s marine industrial structure optimization over time, and the long dashed line reflects the change in the synthetic value of Zhejiang’s marine industrial structure optimization; the vertical short dashed line in the middle indicates the year of the Zhejiang MEDDZ’s approval (2011); in this paper, we focus on the trend of the paths of the solid line (the real Zhejiang) and the dashed line (the synthetic Zhejiang) at the right side of the vertical short dashed line, which is the path of the implementation effect of the MEDDZ policy. Existing research indicates that when the real line is on the upper side of the dotted line, the implementation of the MEDDZ policy has a positive impact on the optimization of marine industrial structure; when it is on the lower side, it has a negative impact (Ben-Michael et al., 2021).
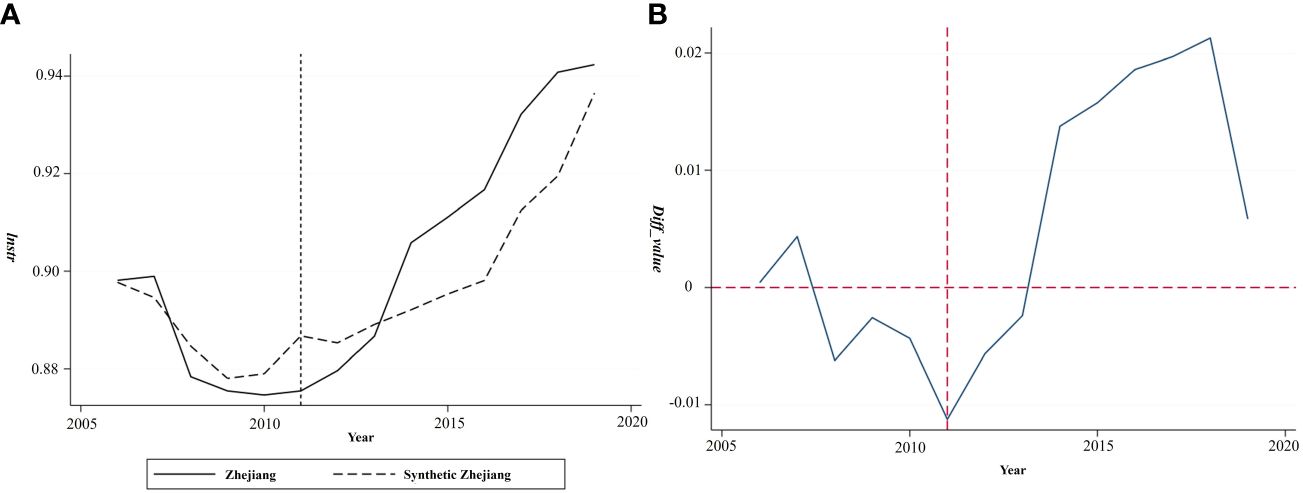
Figure 4 Impact effect diagram of the MEDDZ policy on optimizing the marine industrial structure in Zhejiang Province. (A) The comparison of real Zhejiang and synthetic Zhejiang marine industry structure optimization level. (B) The difference value of optimization level of marine industry structure between real Zhejiang and synthetic Zhejiang.
In Figure 4A, the marine industrial structure optimization of real Zhejiang and synthetic Zhejiang is more consistent on the left side of the vertical dotted line. The difference between the two values is small, indicating that synthetic Zhejiang better fits the optimization trend of the Zhejiang marine industrial structure. After 2011, the level of optimization of the real Zhejiang marine industry structure gradually exceeded the synthetic Zhejiang prediction value, with a significant deviation trend, indicating that the MEDDZ has a positive effect on the optimization and adjustment of Zhejiang’s marine industry structure, with a lag. Between 2011 and 2013, the synthetic Zhejiang (dotted line) was higher than the real Zhejiang (solid line), which could be attributed to a period of transition between the concrete implementation of coastal management policies and the optimization of the industrial structure. There could be a bottleneck in the administrative hierarchy, information transmission, and implementation efficiency, resulting in policy lag. However, after 2013, the real Zhejiang was located above the synthetic Zhejiang, demonstrating that the demonstration zone’s policy effect is gradually strengthened. At this point, Zhejiang has issued detailed programs such as the ‘Development Plan for Emerging Marine Industries in Zhejiang Province’ and the ‘822 Action Plan for Marine Economic Development in Zhejiang (2013–2017),’ which clarify the direction of future coastal marine industry development. It promotes the marine engineering equipment and high-end ship manufacturing industries, the port and navigation logistics service industry, coastal tourism, desalination, and comprehensive seawater utilization, and aims to cultivate the development of 25 marine-featured industrial bases.
To highlight the trend of optimizing the Zhejiang marine industrial structure under the MEDDZ policy, we use the difference between the real and synthetic value of Zhejiang marine industrial structure optimization as the treatment effect. The red horizontal dotted line in Figure 4B indicates the processing effect is 0. Before 2011, the difference between the real value and the synthetic value of the structure optimization level of the Zhejiang marine industry showed a significant downward trend, indicating that the Zhejiang coastal marine industry was facing a policy adjustment period, with increasingly prominent contradictions between the economy, resources, and the environment, and the space for development was constrained; after 2011, the difference between the two values showed a significant upward trend, indicating that the Zhejiang coastal marine industry was facing a policy adjustment period. Furthermore, the difference between the two values showed upward. It shifted from negative to positive around 2013, indicating that the demonstration zone’s effect on marine economic development has gradually been revealed, bringing new vitality to the structure of the Zhejiang marine industry. Finally, the MEDDZ policy encourages the optimization and adjustment of the coastal industrial structure, as well as the development of traditional industries with high-added value and technological content; it also regulates and guides the development and use of coastal resources and encourages resource rationalization to achieve a win-win situation in terms of both economic and environmental benefits.
5.2 Placebo test
According to Figure 4B, the MEDDZ policy effect is more significant after 2011, i.e., without considering other interfering factors, under the premise of reflecting the optimization of each predictor variable’s panel data fitting results. As a result, to further ensure the scientific validity and effectiveness of the preceding conclusions, this paper will change a portion of the order of the synthetic control method from the control group permutation test, the time point permutation test, and the sorting test for the placebo test.
5.2.1 The control group permutation test
One of the commonly used methods in the placebo test of the SCM is the control group replacement test, in which representative provinces in the control group are re-benchmarked for synthetic control to see if the results differ from those of Zhejiang. Assume that the difference in real and synthetic values of the control group objects is slight. In that case, the SCM could be used to demonstrate that the MEDDZ policy positively impacts the optimization of the coastal marine industrial structure; otherwise, a significant difference between the two indicates that the credibility of the above conclusions still needs to be improved.
In this paper, we refer to some research results and choose the two provinces with the greatest and smallest weight share in the control group for a comparative analysis of differences in the model’s experimental group (Bouttell et al., 2018). On the one hand, Guangdong has the highest weight share, implying that the two are more similar in characteristics of the marine economy and industry structure. Based on reality, Guangdong and Zhejiang are rich in marine resources; both contribute approximately 14% of GOP to GDP, the layout of the marine industrial structure is reasonable, and the optimization of the Guangdong marine industrial structure is higher. The proportion of marine three industries is relatively constant. Guangxi, on the other hand, is one of the provinces with a weight share of zero. Guangxi’s volume of marine economic development is relatively small. The proportion of GDP is approximately 8%, the type of marine industry is relatively single, and the level of benefits from marine resource development is relatively low. So, there is a significant difference in the level of the marine economic growth and the level of optimization of the marine industrial structure between Guangxi and Zhejiang.
Before 2011, the synthetic values of Guangdong show some fluctuations. Still, the magnitude is small, indicating that the model fitting effect is better, as shown in Figure 5. In general, MEDDZ’s policy has a specific positive impact on optimizing Guangdong’s marine industrial structure, and the delay is more pronounced. The amplitude of fluctuation of the optimization level of the Guangdong marine industrial structure is noticeably small. However, most of the time, the predicted value of the synthetic Guangdong exceeds the real Guangdong, indicating that the promotion effect of the demonstration zone policy on the optimization of the Guangdong marine industrial structure is minor. Although Zhejiang and Guangdong have similarities in terms of marine economy share and industrial structure composition, according to the Guangdong Marine Economic Development Report (2022), Guangdong’s total marine economy has ranked first in China for 27 consecutive years. The province’s GOP accounts for approximately 16% of GDP. Guangdong’s marine three industries ratio is 2.5:27.5:70.0. The value-added of the significant marine industries was 572.3 billion CNY, up 13.3% yearly. Thus, compared to Zhejiang, MEDDZ’s policy effect on optimizing its coastal industrial structure is weaker.
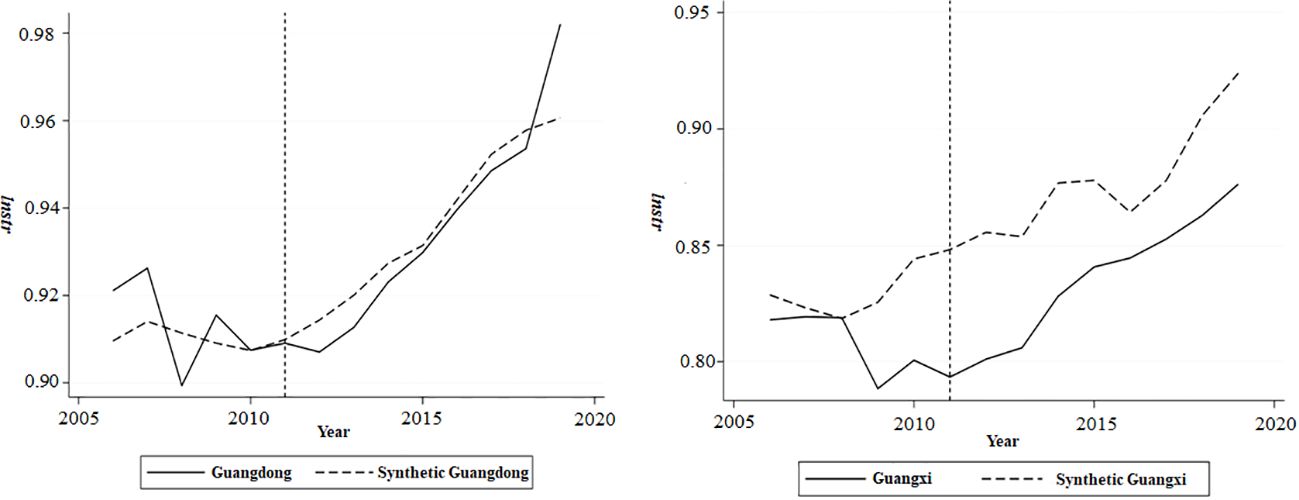
Figure 5 The path of change in the level of optimization of the structure of Guangdong and Guangxi marine industries.
Although the MEDDZ policy for the optimization of Guangxi’s marine industrial structure is insignificant and has a negative impact, as evidenced primarily by the fact that after 2011, its synthetic value of the degree of divergence gap is higher, the synthetic value of the real value of the above, and Zhejiang’s approval to obtain the demonstration zone for the development of the marine economy, there is a significant difference in the growth trend. As the above results, the promotion effect and the robustness of the synthetic control baseline results are not coincidental.
5.2.2 The time point permutation test
In this section, the time point of the MEDDZ policy is advanced or delayed for synthetic control analysis to show the effect of policy implementation better (Robbins and Davenport, 2021). Next, the demonstration zone’s approval date has been defined to 2010 and 2012. It represents the trend of real Zhejiang and synthetic Zhejiang in the marine industrial structure optimization in 2010, as shown in Figure 6A. The overall situation is more similar to the results of the synthetic control baseline regression; that is, at the policy point near the path of gradual divergence, the synthetic value is higher than the real value and changes around 2013 before maintaining a stable growth trend; in Figure 6B, when the policy node for 2012, the real Zhejiang (solid line) is higher than the synthetic Zhejiang (dotted line), the divergence area is more transparent. Based on the above adjustment time test, the demonstration zone policy has a positive effect, as stated in the benchmark conclusion. This shows that the variability in the timing of policy implementation requires more attention when implementing coastal marine policies. The reasons for the lag in coastal ocean policies include (1) insufficient coordination among coastal government agencies and work efficiency; (2) the policy design process is lacking in forward-thinking considerations, and the amount of ownership of different resources in the coastal region is not yet sufficient to fully promote policy implementation. As a result, coastal areas could reduce lag by improving communication and coordination, raising administrative processes, and increasing implementation efficiency.

Figure 6 Synthetic control results for the time point of the transformation policy. (A) The policy point is the result of the 2010 synthetic control. (B) The policy point is the result of the 2012 synthetic control.
5.2.3 The sorting test
To further demonstrate the robustness of the above results, this section employs some scholars’ placebo test method, sequentially taking provinces that have not been approved as demonstration zones for the development of the marine economy as the experimental group and performing a synthetic control analysis to estimate the implementation effects of the demonstration zones policies in the above provinces (Gardeazabal and Vega-Bayo, 2017). In Figure 7, the solid line represents the effect of Zhejiang’s policy treatment, while the dashed line represents the effect of policy treatment in other provinces. Before 2011, the fluctuation between Zhejiang and some provinces was relatively similar and of small magnitude; after 2011, the speed of adjustment of the industrial structure in Zhejiang showed a fluctuating increasing trend and is currently at its peak around 2019, demonstrating the positive impact of the MEDDZ on the optimization of the marine industrial structure in Zhejiang. According to the significance test, the treatment effect is significant at the 10% confidence level. Therefore, the results’ dependability is once again demonstrated.
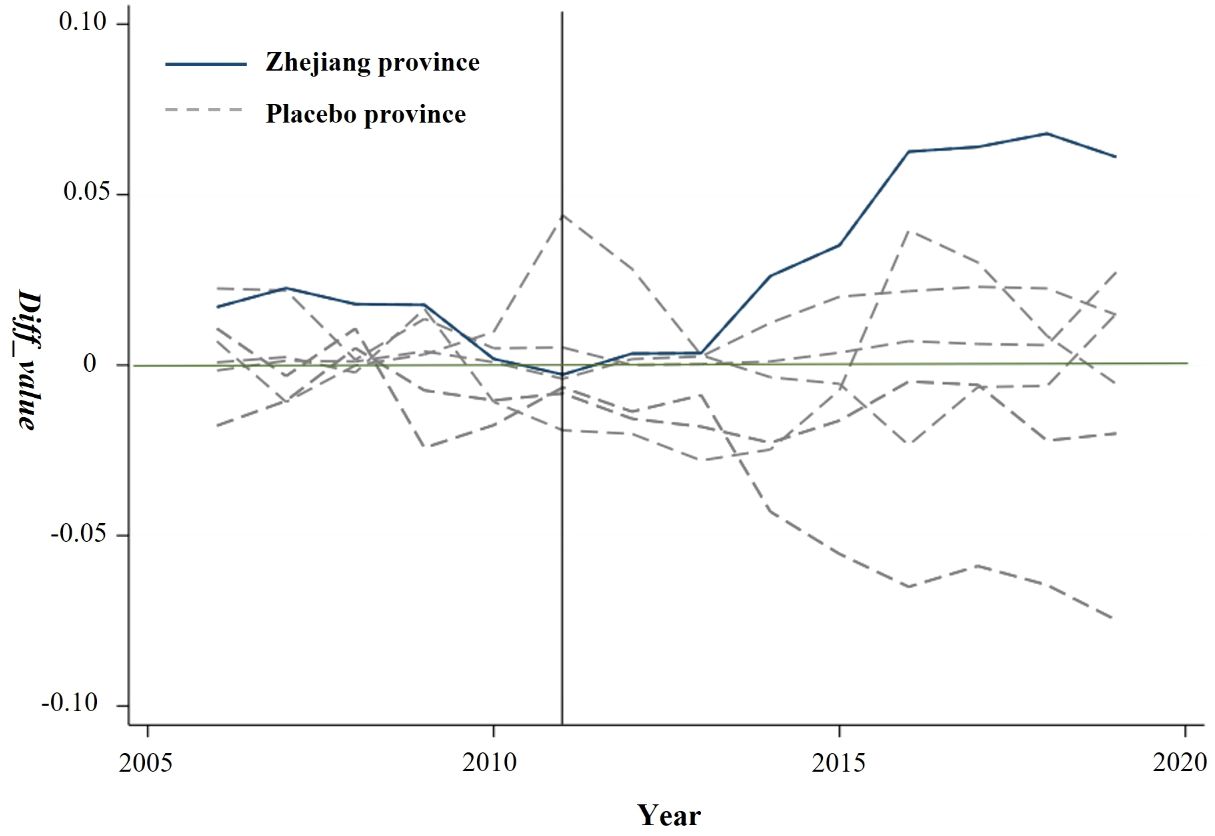
Figure 7 Distribution of the treatment effects in Zhejiang and other provinces without placebo.
5.3 Robustness test
5.3.1 Change of variable indicator
The variable change indicator test converts the explained variable optimization of marine industrial structure into an indicator of marine industrial structure upgrading, thereby representing optimization and upgrading of marine industrial structure (Li et al., 2023). Then, after transforming the indicators, this paper puts them under SCM to test the policy effect. Figure 8A shows the trend of real and synthetic values of marine industrial structure upgrading in Zhejiang. Regarding the overall fitting effect, the RMSPE value of the model output is 0.00512, indicating a relatively fitting effect.
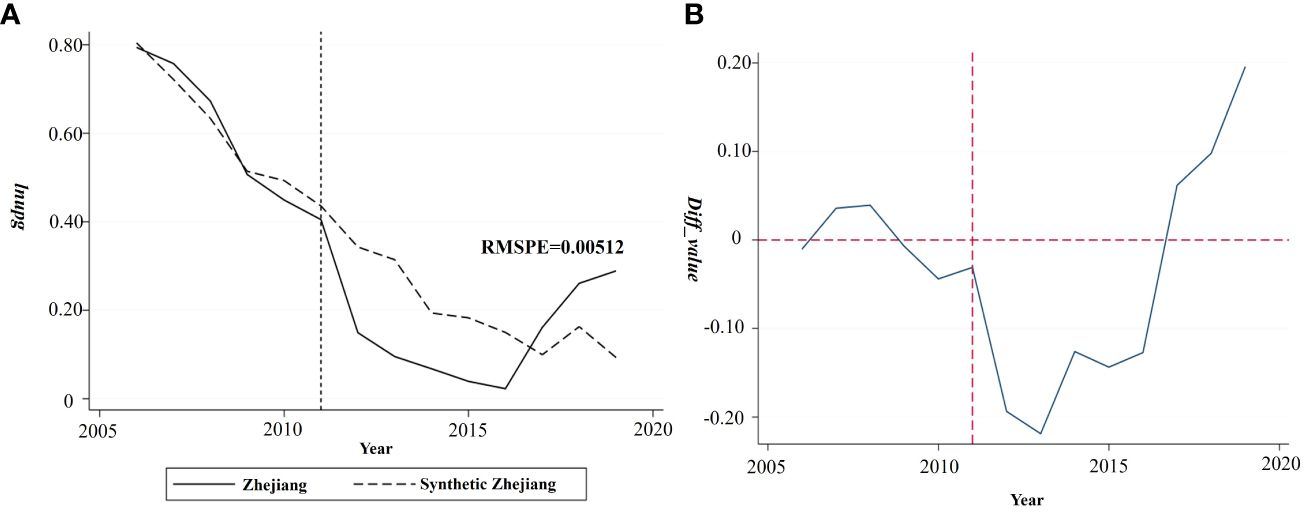
Figure 8 The path of change of the upgrading of Zhejiang’s marine industrial structure. (A) The comparison of real Zhejiang and synthetic Zhejiang upgrading of the structure of the marine industry level. (B) The difference value of upgrading of the structure of the marine industry level between real Zhejiang and synthetic Zhejiang.
The overall trend of the change path is characterized by ‘decrease and then increase’; prior to 2011, the change paths of the real Zhejiang and the synthetic Zhejiang coincided, indicating that the simulation effect of the synthetic Zhejiang constructed by the model is better. Around 2017, the predicted value of real Zhejiang surpassed the value of synthetic Zhejiang, demonstrating the positive impact of the MEDDZ policy on transforming and upgrading the marine industrial structure. According to the trend of the difference value in Figure 8B, its fluctuation frequency was low prior to 2011, indicating that the upgrade of the Zhejiang marine industrial structure is stable. This variable belongs to macro and single co-existence indicators. It necessitates high expectations for the results of the marine industry upgrade, and the time required to convey the effect of the policy to the industrial structure and achieve good results is longer. As a result, after 2011, the difference between real Zhejiang and synthetic Zhejiang had a negative value, but the policy effect appeared around 2013. It shows an upward trend and shifts from negative to positive around 2017, indicating the impact of the demonstration zone policy on the marine industry structure.
A realistic process of achieving higher productivity and lower production costs through rationalization factors under the conditions of existing coastal resource factors is one of the possible reasons for upgrading the marine industry. This process greater precision in implementing coastal marine policies and a longer cycle of policy effects, which necessitates coastal regions to continue to emphasize changes in the structure of the coastal marine industry and adjust their policy efforts regularly (Wang et al., 2020).
5.3.2 Change of estimation methodology
When assessing the effect of policy treatment, the regression control method (RCM), based on the counterfactual principle, requires constructing counterfactual values corresponding to provinces not subject to policy intervention from the control group that did not implement the policy (Hsiao et al., 2012). Compared to the SCM, the alternative method further relaxes the assumption of positive weights and is more applicable to experimental groups with unique characteristics (Hsiao and Zhou, 2019).
Above all, we use the RCM to regress the optimized value of Zhejiang Province’s marine industrial structure and other coastal control provinces. Finally, we obtain the optimal combination of control group provinces using the corrected Akaike information criterion (AICC principle). Figure 9 shows the actual and predicted values of the optimized value of the marine industrial structure before and after the MEDDZ implementation. The solid line represents the actual value, while the dotted line represents the predicted value of the unapproved demonstration zone. This shows that before the demonstration zone’s approval, the change paths of the real value and the predicted value of the marine industrial structure optimization of coastal provinces are more consistent, indicating that the two fit better; after 2011, the real value is significantly higher than the predicted value, indicating that the MEDDZ policy effectively promotes the optimization and upgrading of the marine industrial structure of coastal areas. In conclusion, a series of placebo and robustness tests show that MEDDZ positively effects the optimization of Zhejiang’s marine industrial structure, indicating that the conclusions drawn by the SCM are robust.
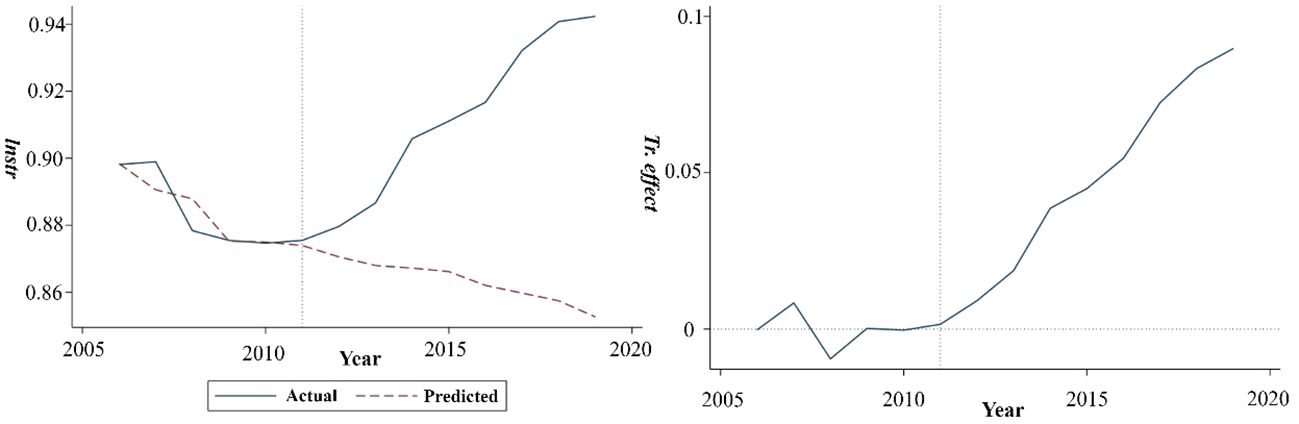
Figure 9 Effects of MEDDZ on optimizing marine industrial structure (RCM).
5.4 Impact mechanism test
According to the previous theoretical analysis, we built the mechanism effect model to test the impact mechanism of the MEDDZ approval on the optimization of the marine industrial structure (Zhao et al., 2022):
For Equation (8) and Equation (9), where Mit is the mechanism variable, which is replaced by two variables reflecting the financial support of the subject’s government, and the transportation of marine goods in turn (Sherman, 2014). policyit is the policy variable, i.e. policyit=treatit×year (treatit is the policy variable of the MEDDZ, which takes the value of 1 in Zhejiang, and the value of 0 in the other provinces, and Year is the dummy variable of the year, which takes the value of 1 after 2011, and the value of 0 before 2011); controlit is a series of control variables. εit represents the randomized perturbation term. If the coefficients β and θ are both significant, the mechanism effect is present.
In Table 4, Columns (1) and (2) show that the coefficients of the variable policy are significantly positive, indicating that the MEDDZ policy provides more financial support to pilot provinces. MEDDZ is not only for early and pilot implementation of the coastal economic management system but also for theoretical research on the development of the coastal marine industry, thereby strengthening the level of coastal management. Furthermore, the MEDDZ policy positively impacts marine goods’ transportation in columns (3) and (4). For one thing, MEDDZ optimizes port construction, improves cargo handling efficiency, and lowers transportation costs; for another, it simplifies policy for port enterprises, optimizes the transportation network, and increases cargo transportation demand and scale. Finally, an increase in the volume of coastal cargo transportation will drive the development of the marine transportation industry and other industries and promote the optimization of the coastal marine industry’s structure.
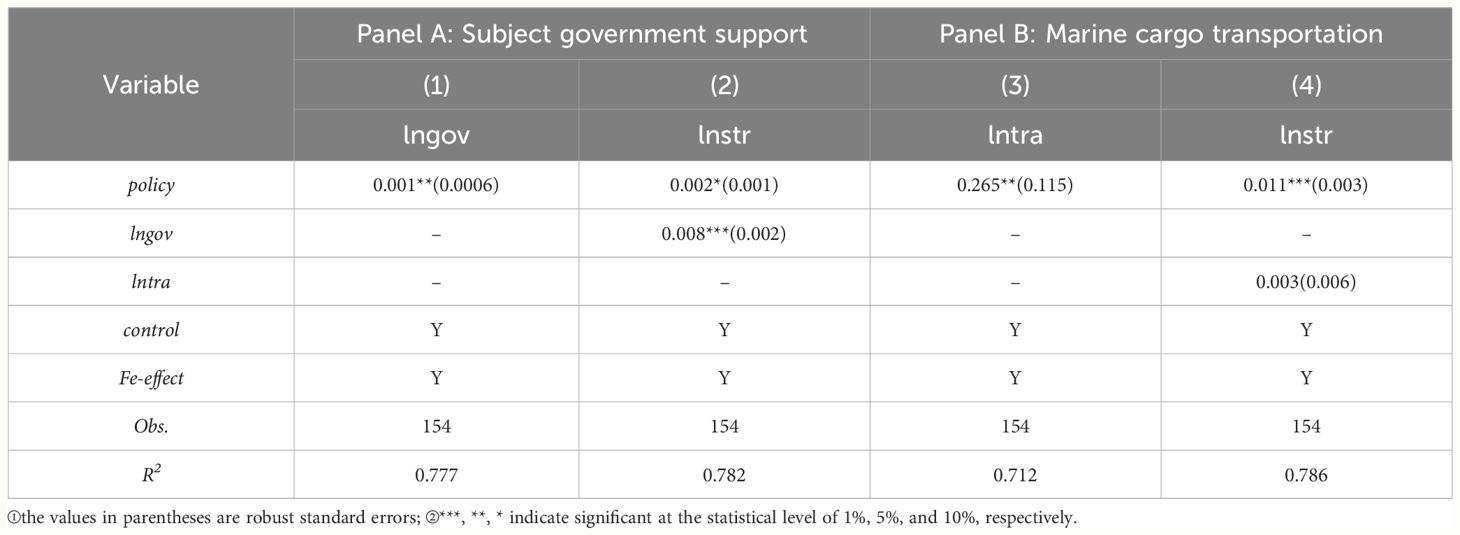
Table 4 Results of regression on impact mechanism.
5.5 Summary of typical experiences
The above quantitative empirical research shows that the MEDDZ policy significantly optimizes the regional marine industry structure; the policy lag effect exists considering the realistic factors. On this basis, we adopt qualitative research methods, such as structured interviews (Qu and Dumay, 2011), for understanding the typical experience formed in the Zhejiang Marine Economic Development Demonstration Zone to provide experience reference for other regions more comprehensively and guarantee the reliability of the research.
Since its designation as a MEDDZ in 2011, Zhejiang Province has taken the initiative to meet national strategic needs, leveraged its advantages in coastal resources and management, comprehensively organized the demonstration zone’s construction tasks, and achieved significant results in optimizing the marine industrial structure. We compiled the relationship between the structure of the marine industry in Zhejiang from 2006 to 2020 by reviewing the China Marine Economy Statistical Yearbook (2007–2021) (see Figure 10). First, the industry in Zhejiang Province tends to stabilize, accounting for about 7%. The value chain of primary industries such as mariculture is constantly broadening. Second, the proportion of marine secondary industry fluctuates and decreases, accounting for approximately 30% of the total. Zhejiang Province fully exploits coastal resources; traditional marine industries are constantly optimized, and the value-added of new industries such as marine biological medicine and new energy is gradually improved; finally, the proportion of marine tertiary industries fluctuates and increases, accounting for approximately 62%. Since 2011, Zhejiang Province has taken advantage of the construction of the ‘Belt and Road’ to promote the development of the tertiary industry, including coastal tourism and the marine service industry, which continues to contribute to the high-quality development of the regional marine economy through the promotion of the demonstration zone policy.
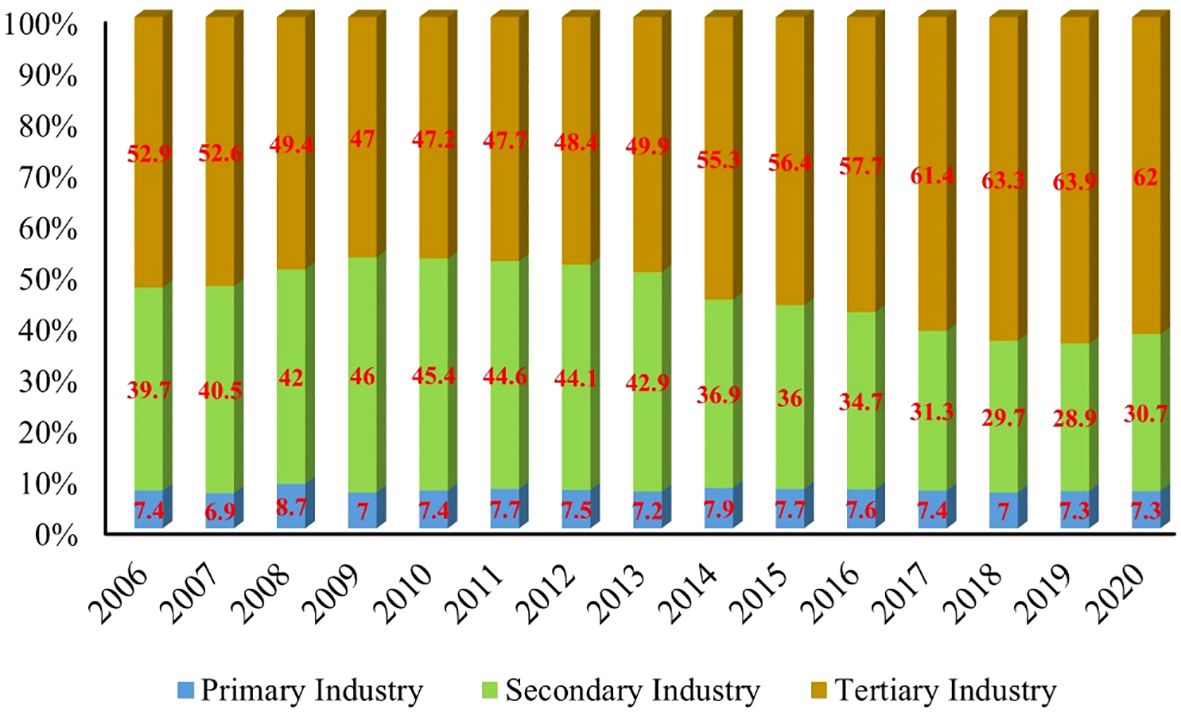
Figure 10 The change in the structure of Zhejiang’s marine industry from 2006 to 2020.
Under the auspices of the MEDDZ policy, Zhejiang Province has significantly optimized its marine industrial structure. As a result, we summarize the typical experience of optimizing the structure of the marine industry in Zhejiang Province in general (see Figure 11) and elaborate on it in terms of national strategy, government support, key projects, and ecological protection to provide a targeted reference for other coastal regions, promote the realization of the complementarity between land and marine resources in coastal regions, and lead to a healthier and more sustainable development of the marine industry.

Figure 11 Typical experience in optimizing the structure of coastal marine industries.
6 Conclusions and policy recommendations
Accelerating the development of MEDDZ benefits the construction of a modernized coastal marine industrial system, strengthens international cooperation in the marine industry, and provides an essential guarantee for the marine economy’s long-term and high-quality development. Based on panel data from 11 coastal provinces from 2006 to 2019, this paper uses the SCM to assess the effect of the MEDDZ policy implementation scientifically and accurately on the optimization of Zhejiang’s marine industrial structure, while also conducting a series of placebo and robustness tests to summarize and condense the typical experience of the construction of the MEDDZ. The following are the main conclusions: (1) MEDDZ has a positive and significant effect on the optimization of the marine industrial structure in Zhejiang, and there is a lagged policy effect. (2) After a series of placebo and robustness tests, the policy effect of MEDDZ is shown to fit the path better when the policy is applied in 2012, and the study’s conclusions are robust and reliable. (3) Under the policy guidance of the MEDDZ, there is a specific impact on the marine industrial structure optimization based on factors such as governmental financial support and the marine cargo transportation situation. By considering the results of existing research, this article makes policy recommendations:
(1) MEDDZ’s policy of empowering optimization of marine industrial structures should be continuously promoted and implemented. As a significant coastal economic province, Zhejiang should play an essential role in improving the marine field’s top-level design and development planning and scientifically comprehending the coastal marine economy and industrial layout. Furthermore, other coastal regions could combine the region’s advantages in the marine industry, marine talent, and sea-related projects, as well as other aspects of collaborative efforts to achieve more support for marine policy, policy implementation, and actual ocean integration to help the regional marine economy and high-quality development.
(2) We should focus on the MEDDZ policy’s lagging effect in providing risk management for optimizing the structure of the coastal marine industry. According to the research results, the effects of the MEDDZ policy take about 1-2 years to appear, which gives policy realization will inevitably be delayed, and the process from policy to landing will be more complicated. Then, when implementing policies in the marine field, coastal regions should thoroughly investigate the region’s marine market and resources, pay attention to the development of marine specialties, improve the industrial layout and composition of the MEDDZ, and enhance the overall strength of the regional marine economy by focusing on the entire area.
(3) Broadening the funding sources for construction with MEDDZ promotes marine industrial structure optimization. Funding is a crucial component in restructuring the marine industry. The coastal regions should actively seek national marine special funds to support the development of marine industries and ecological and environmental protection in demonstration zones, develop regulations on fund management to improve fund utilization efficiency, scientifically establish funds for the marine industry, build an integrated marine innovation model of production, academia, and research, and supplement it with an industrial fund to promote the marine industry.
This article focuses on the MEDDZ policy’s overall effectiveness in optimizing the marine industrial structure in typical coastal regions. Because of the limitations of the research methodology, it does not compare differences in policy content across regions. Future research will explore the effects of various coastal city policies on their marine economic and industrial development from a more microscopic level, combining it with other measurement methods to conduct in-depth research on the specific conduction mechanism and impact path. Furthermore, the data limits our study to the provincial level. Next, consider collaborating with coastal cities to create a city panel database to better understand the effects of coastal marine management policies.
Data availability statement
The data analyzed in this study is subject to the following licenses/restrictions: The original contributions presented in the study are included in the article/supplementary material. Further inquiries can be directed to the corresponding author. Requests to access these datasets should be directed to CNKI https://data.cnki.net/.
Author contributions
YC: Conceptualization, Formal analysis, Project administration, Writing – original draft. HX: Data curation, Investigation, Resources, Writing – review & editing. DA: Investigation, Resources, Writing – review & editing. LY: Conceptualization, Project administration, Visualization, Writing – review & editing.
Funding
The author(s) declare financial support was received for the research, authorship, and/or publication of this article. This study was supported in part by grants from The National Social Science Fund of China (Major Project), (No.20&ZD100), Major Project of the Institute of State Governance, Shandong University (No. 23Z03), The Graduate Student Scientific Research Fund Grant of School of Business, Shandong University and The Research Funds for Key Research Bases of Humanities and Social Sciences in Higher Education Institutions in Hebei Province.
Conflict of interest
The authors declare that the research was conducted in the absence of any commercial or financial relationships that could be construed as a potential conflict of interest.
Publisher’s note
All claims expressed in this article are solely those of the authors and do not necessarily represent those of their affiliated organizations, or those of the publisher, the editors and the reviewers. Any product that may be evaluated in this article, or claim that may be made by its manufacturer, is not guaranteed or endorsed by the publisher.
References
Abadie A., Diamond A., Hainmueller J. (2010). Synthetic control methods for comparative case studies: Estimating the effect of California’s tobacco control program. J. Am. Stat. Assoc. 105, 493–505. doi: 10.1198/jasa.2009.ap08746
Abadie A., Diamond A., Hainmueller J. (2015). Comparative politics and the synthetic control method. Am. J. Polit. Sci. 59, 495–510. doi: 10.1111/ajps.12116
Abadie A., Gardeazabal J. (2003). The economic costs of conflict: A case study of the Basque Country. Am. Econ. Rev. 93, 113–132. doi: 10.1257/000282803321455188
An D., Shen C., Yang L. (2022). Evaluation and temporal-spatial deconstruction for high-quality development of regional marine economy: A case study of China. Front. Mar. Sci. 9. doi: 10.3389/fmars.2022.916662
Athey S., Imbens G. W. (2022). Design-based analysis in difference-in-differences settings with staggered adoption. J. Econom. 226, 62–79. doi: 10.1016/j.jeconom.2020.10.012
Ben-Michael E., Feller A., Rothstein J. (2021). The augmented synthetic control method. JJ. Am. Stat. Assoc. 116, 1789–1803. doi: 10.1080/01621459.2021.1929245
Biedenweg K., Stiles K., Wellman K. (2016). A holistic framework for identifying human wellbeing indicators for marine policy. Mar. Pol. 64, 31–37. doi: 10.1016/j.marpol.2015.11.002
Bouttell J., Craig P., Lewsey J., Robinson M., Popham F. (2018). Synthetic control methodology as a tool for evaluating population-level health interventions. J. Epidemiol. Community Health 72 (8), 673–678. doi: 10.1136/jech-2017-210106
Brent Z. W., Barbesgaard M., Pedersen C. (2020). The Blue Fix: What’s driving blue growth? Sustain. Sci. 15, 31–43. doi: 10.1007/s11625-019-00777-7
Chen X., Qian W. (2020). Effect of marine environmental regulation on the industrial structure adjustment of manufacturing industry: an empirical analysis of China’s eleven coastal provinces. Mar. Pol. 113, 103797. doi: 10.1016/j.marpol.2019.103797
Damian S. E., Wong L. A., Shareef H., Ramachandaramurthy V. K., Chan C. K., Moh T. S. Y., et al. (2022). Review on the challenges of hybrid propulsion system in marine transport system. J. Energy Storage 56, 105983. doi: 10.1016/j.est.2022.105983
Dang N. B., Momtaz S., Zimmerman K., Nhung P. T. H. (2017). Effectiveness of formal institutions in managing marine fisheries for sustainable fisheries development: A case study of a coastal commune in Vietnam. Ocean Coast. Manage. 137, 175–184. doi: 10.1016/j.ocecoaman.2016.12.021
Dawley S. (2014). Creating new paths? Offshore wind, policy activism, and peripheral region development. Econ. Geogr. 90, 91–112. doi: 10.1111/ecge.12028
Duarte C. M., Agusti S., Barbier E., Britten G. L., Castilla J. C., Gattuso J. P., et al. (2020). Rebuilding marine life. Nature 580, 39–51. doi: 10.1038/s41586-020-2146-7
Fox H. K., Swearingen T. C. (2021). Using a difference-in-differences and synthetic control approach to investigate the socioeconomic impacts of Oregon’s marine reserves. Ocean Coast. Manage. 215, 105965. doi: 10.1016/j.ocecoaman.2021.105965
Gardeazabal J., Vega-Bayo A. (2017). An empirical comparison between the synthetic control method and hsiao et al.’s panel data approach to program evaluation. J. Appl. Econom. 32, 983–1002. doi: 10.1002/jae.2557
Gössling S., Hall C. M., Scott D. (2018). “Coastal and ocean tourism,” in Handbook on marine environment protection: Science, impacts and sustainable management Cham: Springer, 773–790. doi: https://doi.org/10.1007/978-3-319-60156-4_40
Guo J., Yuan X., Song W. (2022). Driving forces on the development of China’s marine economy: efficiency and spatial perspective. Ocean Coast. Manage. 224, 106192. doi: 10.1016/j.ocecoaman.2022.106192
He Y., Zheng H. (2023). How does environmental regulation affect industrial structure upgrading? Evidence from prefecture-level cities in China. J. Environ. Manage. 331, 117267. doi: 10.1016/j.jenvman.2023.117267
Hsiao C., Steve Ching H., Ki Wan S. (2012). A panel data approach for program evaluation: measuring the benefits of political and economic integration of Hong Kong with mainland China. J. Appl. Econom. 27, 705–740. doi: 10.1002/jae.1230
Hsiao C., Zhou Q. (2019). Panel parametric, semiparametric, and nonparametric construction of counterfactuals. J. Appl. Econom. 34, 463–481. doi: 10.1002/jae.2702
Huang C., Liu L. (2022). Research on the network map of literature information distribution in China’s marine economic development demonstration zone. Mar. Econ. Manage. 5, 84–101. doi: 10.1108/MAEM-12-2021-0014
Jiang X. Z., Liu T. Y., Su C. W. (2014). China’ s marine economy and regional development. Mar. Pol. 50, 227–237. doi: 10.1016/j.marpol.2014.06.008
Júnior J. G. C. O., Ladle R. J., Correia R., Batista V. S. (2016). Measuring what matters–Identifying indicators of success for Brazilian marine protected areas. Mar. Pol. 74, 91–98. doi: 10.1016/j.marpol.2016.09.018
Kaul A., Klößner S., Pfeifer G., Schieler M. (2022). Standard synthetic control methods: The case of using all preintervention outcomes together with covariates. J. Bus. Econ. Stat. 40 (3), 1362–1376. doi: 10.1080/07350015.2021.1930012
Kim S., Lee C., Gupta S. (2020). Bayesian synthetic control methods. J. Mark. Res. 57, 831–852. doi: 10.1177/0022243720936230
Kluger L. C., Filgueira R. (2021). Thinking outside the box: embracing social complexity in aquaculture carrying capacity estimations. ICES J. Mar. Sci. 78, 435–442. doi: 10.1093/icesjms/fsaa063
Li M., Liu N., Kou A., Chen W. (2023). Customer concentration and digital transformation. Int. Rev. Financ. Anal. 89, 102788. doi: 10.1016/j.irfa.2023.102788
Li F., Xing W., Su M., Xu J. (2021). The evolution of China’s marine economic policy and the labor productivity growth momentum of marine economy and its three economic industries. Mar. Pol. 134, 104777. doi: 10.1016/j.marpol.2021.104777
Lin Y., Yang Y., Li P., Feng C., Ding J., Zhou J. (2022). Spatial-temporal evaluation of marine ecological civilization of Zhejiang Province, China. Mar. Pol. 135, 104835. doi: 10.1016/j.marpol.2021.104835
Liu X., Chen S. (2022). Has environmental regulation facilitated the green transformation of the marine industry? Mar. Pol. 144, 105238. doi: 10.1016/j.marpol.2022.105238
Liu X., Li Y., Chen X., Liu J. (2022). Evaluation of low carbon city pilot policy effect on carbon abatement in China: An empirical evidence based on time-varying DID model. Cities 123, 103582. doi: 10.1016/j.cities.2022.103582
Löhr A., Savelli H., Beunen R., Kalz M., Ragas A., Van Belleghem F. (2017). Solutions for global marine litter pollution. Curr. Opin. Environ. Sustain. 28, 90–99. doi: 10.1016/j.cosust.2017.08.009
Lou W., Chen H., Shen X., Sun K., Deng S. (2012). Fine assessment of tropical cyclone disasters based on GIS and SVM in Zhejiang Province. China Nat. Hazards 64, 511–529. doi: 10.1007/s11069-012-0254-x
Qi X. (2022). The conceptual framework of the national blue economic system: A multiagent perspective. Mar. Pol. 145, 105287. doi: 10.1016/j.marpol.2022.105287
Qu S. Q., Dumay J. (2011). The qualitative research interview. Qual. Res. Account. Manage. 8, 238–264. doi: 10.1108/11766091111162070
Robbins M. W., Davenport S. (2021). Microsynth: synthetic control methods for disaggregated and micro-level data in R. J. Stat. Software 97, 1–31. doi: 10.18637/jss.v097.i02
Sherman K. (2014). Adaptive management institutions at the regional level: the case of large marine ecosystems. Ocean Coast. Manage. 90, 38–49. doi: 10.1016/j.ocecoaman.2013.06.008
Stuart E. A., Huskamp H. A., Duckworth K., Simmons J., Song Z., Chernew M. E., et al. (2014). Using propensity scores in difference-in-differences models to estimate the effects of a policy change. Health Serv. Outcomes Res. Methodol. 14, 166–182. doi: 10.1007/s10742-014-0123-z
Su T. (2020). Research on the change of marine industrial structure in marine economic zone to marine economic growth. J. Coast. Res. 106, 49–52. doi: 10.2112/SI106-013.1
Virto L. R. (2018). A preliminary assessment of the indicators for Sustainable Development Goal (SDG) 14 “Conserve and sustainably use the oceans, seas and marine resources for sustainable development”. Mar. Pol. 98, 47–57. doi: 10.1016/j.marpol.2018.08.036
Voyer M., Gladstone W., Goodall H. (2012). Methods of social assessment in Marine Protected Area planning: Is public participation enough? Mar. Pol. 36, 432–439. doi: 10.1016/j.marpol.2011.08.002
Wang C. (2023). The significance of the concept of a maritime community with a shared future in the international law-making process: Taking the BBNJ Agreement as an example. Mar. Pol. 149, 105509. doi: 10.1016/j.marpol.2023.105509
Wang S., Chen S., Zhang H., Song M. (2021). The model of early warning for China’s marine ecology-economy symbiosis security. Mar. Pol. 128, 104476. doi: 10.1016/j.marpol.2021.104476
Wang B., Han L., Zhang H. (2021). The impact of regional industrial structure upgrading on the economic growth of marine fisheries in China—The perspective of industrial structure advancement and rationalization. Front. Mar. Sci. 8. doi: 10.3389/fmars.2021.693804
Wang L., Su M., Kong H., Ma Y. (2021). The impact of marine technological innovation on the upgrade of China’s marine industrial structure. Ocean Coast. Manage. 211, 105792. doi: 10.1016/j.ocecoaman.2021.105792
Wang S., Xing L., Chen H. (2020). Impact of marine industrial structure on environmental efficiency. Manag. Environ. Qual. 31, 111–129. doi: 10.1108/MEQ-06-2019-0119
Wu X. (2019). Developing the marine economy and building a strong marine province. Chinese dream and practice in Zhejiang – Economy. Research Series on the Chinese Dream and China’s Development Path. Springer, Singapore. 177–207. doi: 10.1007/978-981-13-7484-5_6
Xu H., Dong R., Cui Y., Zang W. (2022). Does the Photovoltaic poverty alleviation project promote county economic development?: Evidence from 852 counties in China. Sol. Energy 248, 51–63. doi: 10.1016/j.solener.2022.10.050
Yu X., Wang P. (2021). Economic effects analysis of environmental regulation policy in the process of industrial structure upgrading: Evidence from Chinese provincial panel data. Sci. Total Environ. 753, 142004. doi: 10.1016/j.scitotenv.2020.142004
Yuan B., Cui Y., An D., Jia Z., Ding W., Yang L. (2023a). Marine environmental pollution and offshore aquaculture structure: evidence from China. Front. Mar. Sci. 9. doi: 10.3389/fmars.2022.979003
Yuan C., Lee B. T. F. (2023). From rivals to partners: the evolution of environmental cooperation among China, Japan, and Korea. Global: Jurnal Politik Internasional 25 (1), 60–89. doi: 10.7454/global.v25i1.1267
Yuan B., Liu W., Cui Y. (2023b). The impact of retirement on body mass index in China: An empirical study based on regression discontinuity design. SSM-Popul. Health 23, 101434. doi: 10.1016/j.ssmph.2023.101434
Zhang R., Yu S. (2019). “The challenge to the Maritime Silk Road and port connectivity,” in The 21st Century Maritime Silk Road (Routledge), 47–61.
Zhao X., Sun X., Zhao L., Xing Y. (2022). Can the digital transformation of manufacturing enterprises promote enterprise innovation? Bus. Process. Manage. J. 28, 960–982. doi: 10.1108/BPMJ-01-2022-0018
Zheng H., Zhang L., Zhao X. (2022). How does environmental regulation moderate the relationship between foreign direct investment and marine green economy efficiency: An empirical evidence from China’s coastal areas. Ocean Coast. Manage. 219, 106077. doi: 10.1016/j.ocecoaman.2022.106077
Appendix I: Classification of marine three industries structure
According to the national standard of China “National Economic Industry Classification” (GB/T 4754-2002) and the marine industry standard of China “Marine Economy Statistical Classification and Codes” (HY/T052-1999), marine industry is divided into three categories: Marine primary industry, Marine secondary industry, and Marine tertiary industry:
➢ The marine primary industry includes the marine fishery industry.
➢ The secondary industry includes marine oil and gas industry, coastal salt industry, marine chemical industry, marine biological medicine industry, marine electric power and seawater utilization industry, marine ship industry, marine engineering construction industry, etc.
➢ The tertiary industry includes marine transportation industry, coastal tourism industry, marine scientific research, education, and social service industry, etc.
In terms of the structure of the marine economy, the marine industrial structure has been continuously optimized, and the construction of a modern marine industrial system has been accelerated. A reasonable and stable marine industrial structure is an essential manifestation of the high-quality development of the marine economy. The structure of China’s marine industry has been continuously transformed from being dominated by the marine primary and secondary industries to being dominated by the marine tertiary industry. Coastal regions have continuously adjusted and optimized the regional spatial layout of the marine industry under the principle of land-sea integration and actively constructed a modern marine industry system. At present, China is actively promoting the construction of the 21st Century Maritime Silk Road, strengthening cooperation with countries along the route in the marine economy, extending the marine industry chain, expanding the degree of openness in the marine field, and making continuous efforts to climb up the global marine industry chain.
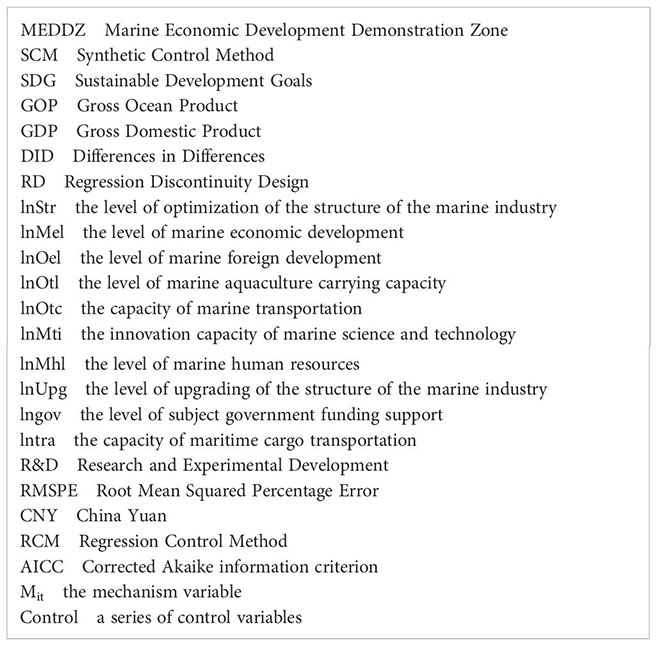
Appendix II: Nomenclature
Keywords: marine economic development demonstration zone, coastal marine industry structure optimization, synthetic control method, policy evaluation, case study
Citation: Cui Y, Xu H, An D and Yang L (2024) Evaluation of marine economic development demonstration zone policy on marine industrial structure optimization: a case study of Zhejiang, China. Front. Mar. Sci. 11:1403347. doi: 10.3389/fmars.2024.1403347
Received: 19 March 2024; Accepted: 10 May 2024;
Published: 28 May 2024.
Edited by:
Michelle Voyer, University of Wollongong, AustraliaReviewed by:
Jeremy Hills, University of the South Pacific, FijiQingji Zhou, Tianjin University, China
Copyright © 2024 Cui, Xu, An and Yang. This is an open-access article distributed under the terms of the Creative Commons Attribution License (CC BY). The use, distribution or reproduction in other forums is permitted, provided the original author(s) and the copyright owner(s) are credited and that the original publication in this journal is cited, in accordance with accepted academic practice. No use, distribution or reproduction is permitted which does not comply with these terms.
*Correspondence: Lin Yang, yanglin0631@sdu.edu.cn