 Ran Ni
 Hongjun Guan
 Yichuan Wang
 Yilin Liu3*
95% of researchers rate our articles as excellent or good
Learn more about the work of our research integrity team to safeguard the quality of each article we publish.
Find out more
ORIGINAL RESEARCH article
Front. Mar. Sci. , 07 March 2024
Sec. Marine Affairs and Policy
Volume 11 - 2024 | https://doi.org/10.3389/fmars.2024.1338154
This article is part of the Research Topic The Potentials and Pitfalls from National Blue Economy Plans Towards Sustainable Development View all 12 articles
Introduction: In China, the sustainable development of the marine is facing a prominent contradiction between ecological security and economic development, as well as unbalanced and non-coordinated regional development. Exploring the regional differences in the synergy between marine ecological security (MES) and high-quality development of the marine economy (MHQD) and its driving mechanism is the key to optimizing the spatial distribution of marine development, promoting the synergistic and balanced development of the regional marine composite system during the “14th Five-Year Plan” period.
Methods: In this article, we employed the Dagum Gini coefficient decomposition model and Kernel density estimation methods to reveal the evolution of regional differences, sources, and distributional dynamics of synergistic development of the composite system from 2009 to 2020. Meanwhile, spatial econometric analyses were applied to identify the influencing factors and spatial spillover effects.
Results: The level of synergistic development of composite system has a fluctuating upward trend, with a significant positive spatial correlation and a significant “polarization effect”. Inter-regional differences in the synergistic development of the composite system are the main source of the overall differences. Factors such as innovation-driven, human capital, and opening up to the outside world are important driving factors for the synergistic development of the composite system.
Discussion: The MES-MHQD composite system exhibits a low level of synergistic development, with significant differences in the level of synergy both among the 3MMECs and within each circle. We infer that the expansion trend of overall difference will constrain the exploration of a sustainable development path for China’s coastal regions in the future. It is necessary to optimize the spatial layout of the composite system, establish robust mechanisms for regional cooperation and communication, accurately identify the development bottlenecks of the regional composite systems. This study provides a theoretical basis and decision-making reference for the promotion of the synergistic development of the composite system of the Three Major Marine Economic Circles (3MMECs) in China.
With the increasing pressure on land-based resources, energy, and space, the maritime domain has become an important area for all countries in the world to enhance their comprehensive national power and compete for long-term strategic advantages. To date, more than 100 countries have formulated detailed plans for the development of the marine economy, promoting it as a strategic national priority (Hussain et al., 2010; European commission, 2021). In China, the marine economy has become the most important part of the national economy (Zou et al., 2017), however, behind the high-speed development of the marine economy, the contradiction between the inefficiency of the marine industrial structure and the demand for marine resources is becoming increasingly prominent. Problems such as overfishing, escalating pollution, and worsening environmental degradation are persistently challenging marine ecosystems, disrupting their natural balance. These challenges imperil the sustainable progression of society and the economy, and pose a significant risk to human safety and survival (Liu C. et al., 2021). Therefore, the importance and urgency of marine ecological security(MES) are becoming increasingly prominent (Wang et al., 2023). Since 1989, when the International Institute for Applied Systems Analysis (IIASA) first proposed the concept of “ecological security”, more and more scholars have paid attention to ecological security issues and widely introduced the concept into the field of maritime domain (Dai et al., 2021). MES describes a condition where the marine ecosystem remains within a stable and secure range of natural environmental and human-induced activities over a defined period within a specific location. In such a state, the marine ecological environment does not represent a threat or cause damage to the marine economy, as well as to the sustainability of human existence and progress. Distinct from the narrower concept of marine ecological health, the definition of MES encompasses a broader scope, necessitating a harmonious coexistence of natural resources, ecological environment, and socio-economic development (Wang et al., 2023).
At a time when issues of MES are increasingly prominent, the Chinese government has placed greater emphasis on the sustainable relationship between MES and economic development. It has put forth a strategy for high-quality development and regards the maritime domain as a strategic priority for such development (CNR News, 2018). High-quality development of the marine economy (MHQD) is a development model that caters to people’s needs for a better life in the context of production activities and the distribution of the impacts and results of production-related outcomes in ocean development. It characterized by a high input-output ratios, efficient resource allocation, abundant technological content, sufficient regional and industrial development, balanced supply and demand, and high-quality sustainable development. It is also built on the principles of the “Five Development Concepts (innovative, coordinated, green, open and shared development)”. By integrating these concepts deeply, it represents a significant advancement over traditional development approaches, crafted to align with the distinctive features and needs of our contemporary era (Di et al., 2019; Di et al., 2022). Given the increasingly prominent negative impacts of economic growth that neglects ecological protection, the development of the marine economy requires a comprehensive transformation (Zhang et al., 2019). It is essential to integrate the concept of MES into the process of the MHDQ. Therefore, achieving a harmonious unity between MES and the MHQD is particularly important. In addition, as international and domestic marine regional cooperation further deepens, the pattern of the “three major marine economic circles” (3MMEC) in the north, east, and south of China, where the marine industry gathers, has been formed. But in fact, regional differences in China’s marine development are gradually expanding due to differences in geographic location, economic foundation, and natural resource endowment (Li et al., 2022). Further, the “14th Five-Year Plan (2021-2025) of China’s Marine Economic Development” underlines the importance of optimizing the spatial distribution of marine development, as well as promoting the synergistic and balanced development of the 3MMECs in the north, east, and south in an integrated manner. In this context, the key to high-quality construction of a marine power lies in promoting the coordinated development of MES-MHQD composite system. It is necessary to identify the factors influencing coordinated development and then address the issues of unbalanced, insufficient, and unsustainable development in coastal regions.
Research on the interaction between MES and MHQD is still in the exploratory stage. Previous studies mainly focused on the study of the relationship between marine economy, ecology, science, technology, and so on (Chen et al., 2020; Lin, 2020; Yu and Di, 2020). Especially under the guidance of the goal of building a global community of destiny for the oceans, the research on the relationship between the major conflicts of marine economic development and ecological protection, models and paths for the coordinated development of marine ecological-economic systems, and developmental differences in marine systems and influencing factors have been emphasized by scholars from all over the world (Martínez et al., 2007; Li and Teng, 2013).
In exploring the conflicting relationships, after the study of economic-ecological coupling derived from the Environmental Kuznets Curve (EKC) has been widely applied to the oceans, scholars have been examining the interactions and mechanisms between global marine activities, ecological environment, and socio-economic development by qualitative and quantitative methods. Jin et al. (2003) constructed a marine ecological and economic exchange matrix (G) to link ecology and economy in an attempt to illustrate the interactions between them. In the framework of the European Union’s “Blue Economy Growth”, how marine and coastal-driven economic activities can benefit from the optimization of the marine environment has become an important research topic for sustainable development (UNEP, 2015; European, 2016). Lillebø et al. (2017) analysed the relationship between the demand and supply of marine ecosystem services and good environmental status for blue growth activities, concluding that blue growth scenarios need to be strongly supported by economic and social, natural ecology, and marine environment. Masud et al. (2021) verified the above view using Structural Equation Modelling (SEM) with a case of marine nature reserves, and found that economic, social, cultural, and ecological development factors have a significant impact on the “sustainable use of marine natural resources”. In China, related studies have been emerging to seek a dialectical relationship between marine economic development and ecological protection, since the Chinese Government proposed a new concept of “green water and green mountains are gold and silver mountains” and issued a series of regulations (Wang et al., 2022). Scholars have used quantitative evaluation methods and models such as comprehensive evaluation (Bennett et al., 2021), ecological footprint (Zhang et al., 2022), energy value analysis (Sun et al., 2020; Ma et al., 2022), BP neural network (Tang et al., 2022), and system dynamics (Jiao et al., 2023) to explore the interactive response mode of the marine composite system and the degree of coupling and coordination.
How exactly can marine ecological protection and marine economic activities be coordinated? Some scholars argued that there is some coherence between land and sea in social and ecological systems (Fernandes et al., 2022). Drawing on management experience in the land area, scholars have explored from the perspective of marine management strategies, the coordinated development model and the effective path for balancing economic and social development, and environmental protection (Ren and Ji, 2021; Qian, 2023). By building a tripartite evolutionary game model using numerical simulation techniques, Li and Jiang (2023) argued that easing marine ecological-economic conflicts and achieving sustainable development of the marine economy is not only the responsibility of the Central Government but also requires the cooperation of multiple stakeholders, such as Local Governments and Sea-using Enterprises. Islam et al (Islam and Shamsuddoha, 2018). developed marine conservation strategies, targets, and action plans for nine interrelated sectors to achieve the blue growth and sustainable development goals of the Gala State Government. In terms of empirical simulation studies of pathways, Wang et al. (2021a) constructed a marine L-V symbiosis model focusing on socio-economics and marine ecology harmonization in terms of economic and environmental pressures, ecological status, and socio-economic responses. In addition, there are also studies covering marine sustainable ecological and economic assessment (Sun et al., 2020), the construction of an ecological footprint model for the rational planning of marine space (Ma et al., 2022; Tang et al., 2022), the establishment of a blue economic growth model to improve the marine ecological safety early warning system, which are aimed primarily at seeking a balance between the economy of the oceans and the protection of the environment and at proposing a scientific and integrated approach to their management (Jiao et al., 2023).
Regional differences and influencing factors are important element of synergistic research on marine systems (Wang et al., 2019). Research on the differences in global marine system development and the affecting factors has usually focused on one particular system, such as the marine economic system, ecosystem, resource system, and social system, involving marine industry development (Ji et al., 2023), marine pastures (Du and Li, 2022), eco-protected area construction (Zhang et al., 2021b), marine resources and energy dilemmas (Wang et al., 2018). Models and methods such as linear weighting models, Theil’s index, Tobit regression, and geographic factor detectors are mostly used (Wang et al., 2020; Cheng M. et al., 2023; Pan and Guo, 2023; Zhao et al., 2023). In terms of empirical research. Aiming at the unbalanced and uncoordinated status quo of China’s marine eco-tourism development, Ji and Wang studied the regional differences, dynamic evolution, and driving factors of tourism development for coastal cities (Ji and Wang, 2022). Scholars incorporated green development efficiency into the study of regional differences and influencing factors in order to promote the sustainable development of the marine economy (Zhou et al., 2023). In addition, other scholars have revealed the developmental characteristics and differences between land and sea socioecological systems from the perspective of land-sea coordination (Liu et al., 2017; Guo et al., 2022). Fernandes et al. (2022) explored spatial differences in socio-economic and marine-environmental characteristics between land-marine areas of the Portuguese, and developed the Marine Socio-Ecological Category, which informs the discrepancy management and planning under the different subdivisions.
Based on the research mentioned above, we can conclude that research on marine ecological-economic system synergistic relationships mainly focuses on the relationship between ecological protection and economic aggregates. Research on regional differences and influencing factors of multi-system synergies, especially considering the strategic context of MES and MHQD, is still lacking and unsystematic. Meanwhile, relevant empirical analyses need to be further developed.
In this study, we take the 3MMECs as the spatial scale, and adopt the method of Dagum’s Gini coefficient and its decomposition, Kernel density estimation, and spatial panel econometric modelling, to innovatively study the regional differences, dynamic evolution, and imbalance influences of the synergy between MES and MHQD in 3MMECs. We broaden the research perspective by combining mechanism analysis with empirical analysis to clarify the coupling mechanisms of synergy of the MES and MHQD. Our studies will be of great significance in alleviating the contradiction between MES and MHQD, and in promoting the coordinated development of 3MMECs during the “14th Five-Year Plan” period.
China attaches great importance to “integrating development and security”, which has been incorporated into the guiding ideology of China’s economic and social development during the “14th Five-Year Plan” period. Meanwhile, MES and MHQD have become a powerful grip for “building a strong marine power with high quality”. Therefore, MES and MHQD should seek the best fit, and work together to achieve sustainable and stable spiral development. This provides policy and theoretical support for the construction of the coupling mechanism framework of MES and MHQD.
MES, starting from the perspective of human survival and development, promotes the harmonization of human-sea relations and the sustainable development of human society (Liu and Meng, 2021), ultimately contributing to the sustainable development of human society. The essence of MHQD is likewise livelihood-oriented, taking into account ecological and green development while enabling its economic results to benefit people’s lives in a sustainable manner. Therefore, MES and MHQD are complementary, interpenetrating, and mutually constraining. Here, we compare the logic of the interaction between the two systems and build a framework of the coupling mechanism of the composite system (Figure 1).
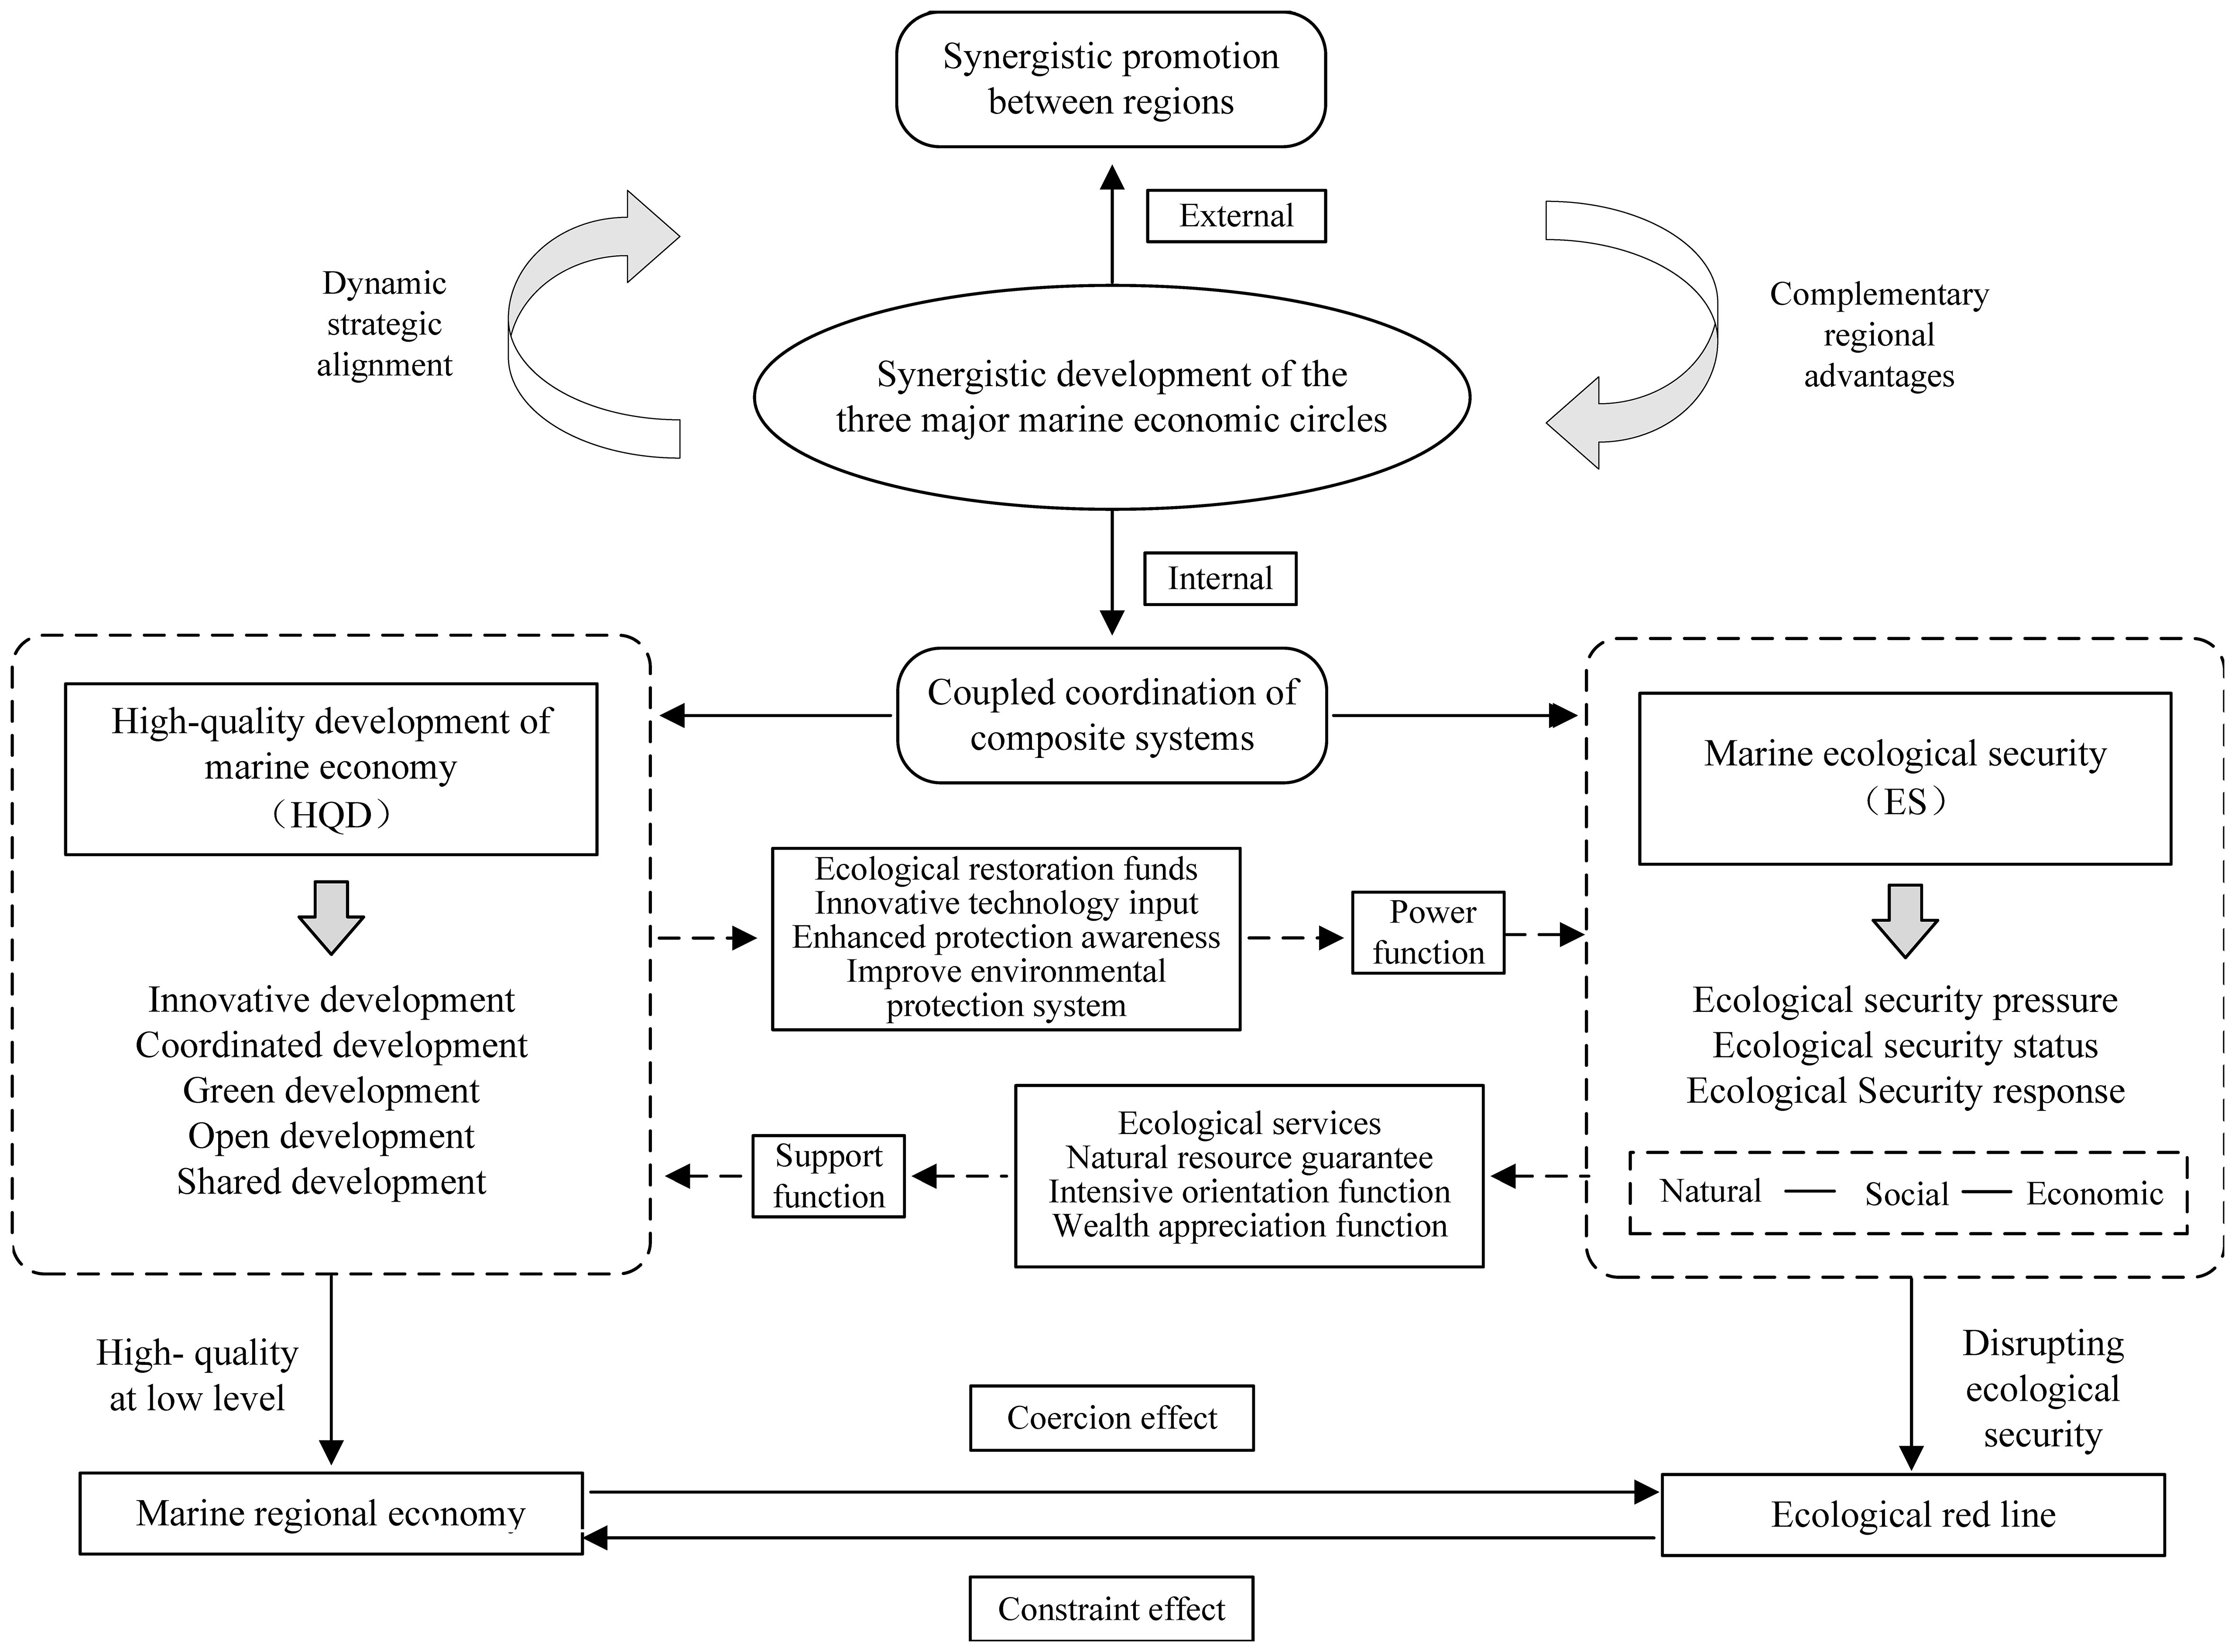
Figure 1 Framework of the coupling mechanism between MES and MHQD in 3MMECs.
MHQD empowers the prevention and control of marine environmental risks and promotes the ecological security system to achieve a virtuous cycle, which is the economic driving force to realize the ecological security of the national territory and build the marine community of destiny.
The role of MHQD on MES is as follows: (1) Provide financial guarantees and restoration funds. The establishment of MES barriers such as marine environmental pollution prevention and control, biodiversity protection, and orderly exploitation and utilization of resources is inseparable from the sustained and stable MHQD. MHQD can provide sufficient funds and advanced technology for the above MES construction links, ensure the implementation of MES early warning, green technology research and development, and specific pollution control projects, and effectively promote the smooth operation of the MES system. (2) Promote benign accumulation of the ecosystem. Green development is a particularly important part of MHQD. By optimizing the structure of marine industries, stimulating sea-related enterprises to innovate green production technologies, and investing in environmental technology R&D to counter the negative effects of sloppy production, we can reduce pollution emissions and resource waste, thus promoting the positive accumulation of marine ecosystems and improving MES. (3) The high-quality demands of the public drive the process of MES. MHQD reflects the desire of people in coastal areas for a high-quality living environment and the demand for sustainable development of the ocean. As people’s demand for high-quality green products and ecological services increases, the awareness of participation in environmental protection will also be enhanced. At the same time, the innovation requirements of MHQD can promote the improvement of MES-related regulations and systems and improve the modern governance system of MES. If the high-quality development is ignored, the extensive production mode will pose threats to the marine primitive ecology, resource environment, and human life, thus exerting a stressful effect on marine ecological security.
MES not only characterizes good marine ecological resources and natural environment but also indicates that the human activities and socio-economic complex system related to marine ecology maintain a relatively safe and stable health status. A good MES system not only provides sustainable and safe environmental conditions for MHQD but also provides support for its continuous optimization and upgrading.
The role of MES on MHQD is as follows: (1) Provide a safe environment and resource guarantees to lay a material foundation and production factors for high-quality development. A well-established marine ecosystem can protect nature, economy, and society from external threats, providing a sustainable safe environment for production and daily life in human society. Given that the quantity of ecological resources is finite, MES is the fundamental guarantee for the sustainable use of marine ecological resources. It can provide high-quality natural ecological resources and sufficient production factors to support MHDQ. (2) Utilizing the wealth-enhancing functions of ecosystems. The value transformation of ecosystem services and ecological products within the MES system can drive wealth enhancement for MHQD. Firstly, ecological resources are converted into ecological products through the processes of ‘valorisation’ and ‘marketisation.’ Secondly, the transformation of ecological resources into ecological assets is achieved through mechanisms such as ecological value compensation and green finance (Shujah-ur-Rahman et al., 2019). Finally, the conversion of ecological assets into ecological capital is realized through the operation of ecological services, thereby generating wealth, which effectively promotes the MHQD. (3) Providing a “source” of motivational mechanisms. The construction of an MES system requires a shift in thinking, achieving a transformation from “end-of-pipe governance” to “source prevention and front-end innovation.” This shift can drive the transformation of economic development momentum backwardly, promoting economic transition and industrial structure upgrading from the ‘source,’ thereby providing momentum for the MHQD. Simultaneously, the market-oriented concept of eco-intensification encourages businesses to seek the most efficient combination of production factors, prompting them to prioritize investments in technological capital, innovation, and R&D, while reducing their reliance on traditional resource-intensive inputs, thereby promoting higher-quality development. Overall, MES and MHQD can be two-way promotion and two-way inhibition, once touched ecological security “red line”, will also have a binding effect on quality development.
The establishment of a MES indicator system necessitates a dual consideration of the marine environment and resource status, while also thoroughly encompassing the pressures associated with emissions, consumption, and ecological restoration (Jiao et al., 2023). It should also account for the socio-economic system’s capacity to respond to and maintain ecological security pressures, facilitating comprehensive, multi-tiered, and multi-dimensional assessments. This process is both complex and pioneering. In terms of assessment logic, the International Organization for Economic Cooperation and Development (OECD) and the United Nations Environment Programme (UNEP) jointly proposed the “Pressure-State-Response” (PSR) model in 1990, which is widely used in ecological security assessment studies (Liu and Meng, 2021).The model is capable of reflecting the sustainability of ecosystems under human influence through dynamic causal relationships. By thoroughly collecting and organizing indicators for the previously studied PSR model (Wang et al., 2021a), we conducted theoretical analysis, field research, and expert consultations to construct an MES indicator system based on the classic PSR model (Table 1), which comprises 3 dimension layers and 13 indicator layers.

Table 1 Evaluation system of MES comprehensive development of 3MMECs.
The ecological security “pressure” dimension takes into account the negative impacts of human beings, society, and nature on MES; the ecological security “state” dimension covers the situation of the oceans themselves and their carrying capacity for human activities; the ecological security “response” dimension refers to the measures taken by governments, enterprises, and individuals to maintain MES within a reasonable range. It represents the human capacity to respond to pressures and negative conditions affecting MES.
The MHQD is an integration of various systems. Clarifying and quantifying the characteristics of the MHQD and measuring its level is a complex system engineering task. It is not exclusively centred on the growth of the economic system; instead, it also emphasizes the need for coordinated interaction between the economic system and external factors, including the environment and society (Wu et al., 2023). Consequently, the “Five Development Concepts” proposed by the nation have indeed become the action guidelines for pursuing high-quality development (Liu and Zhou, 2023). The five dimensions they encompass, namely “innovative, coordinated, green, open and shared development”, form the logical framework for China’s high-quality economic development. Among these, “innovative” acts as the core driving force, “coordinated” is an intrinsic requirement, “green” is the predominant form, “open” is the only path, and “shared development” is the ultimate value destination. These five dimensions collectively guide the pursuit of high-quality development in various fields, including the marine economy. With reference to the objectives and tasks of the national high-quality development strategy, we have constructed an index system comprising 5 dimension layers and 31 indicator layers by drawing on the results of the existing research (Ma et al., 2019; Liu P. et al., 2021; Sun et al., 2021), including “economic development”, “innovation driven”, “green cycle”, “improvement of people’s livelihood”, and “land-sea coordination” (Table 2). The selection of indicators fully considers multiple dimensions such as the economy, society, resources, and environment, ensuring they possess comprehensiveness, scientificity, and effectiveness.
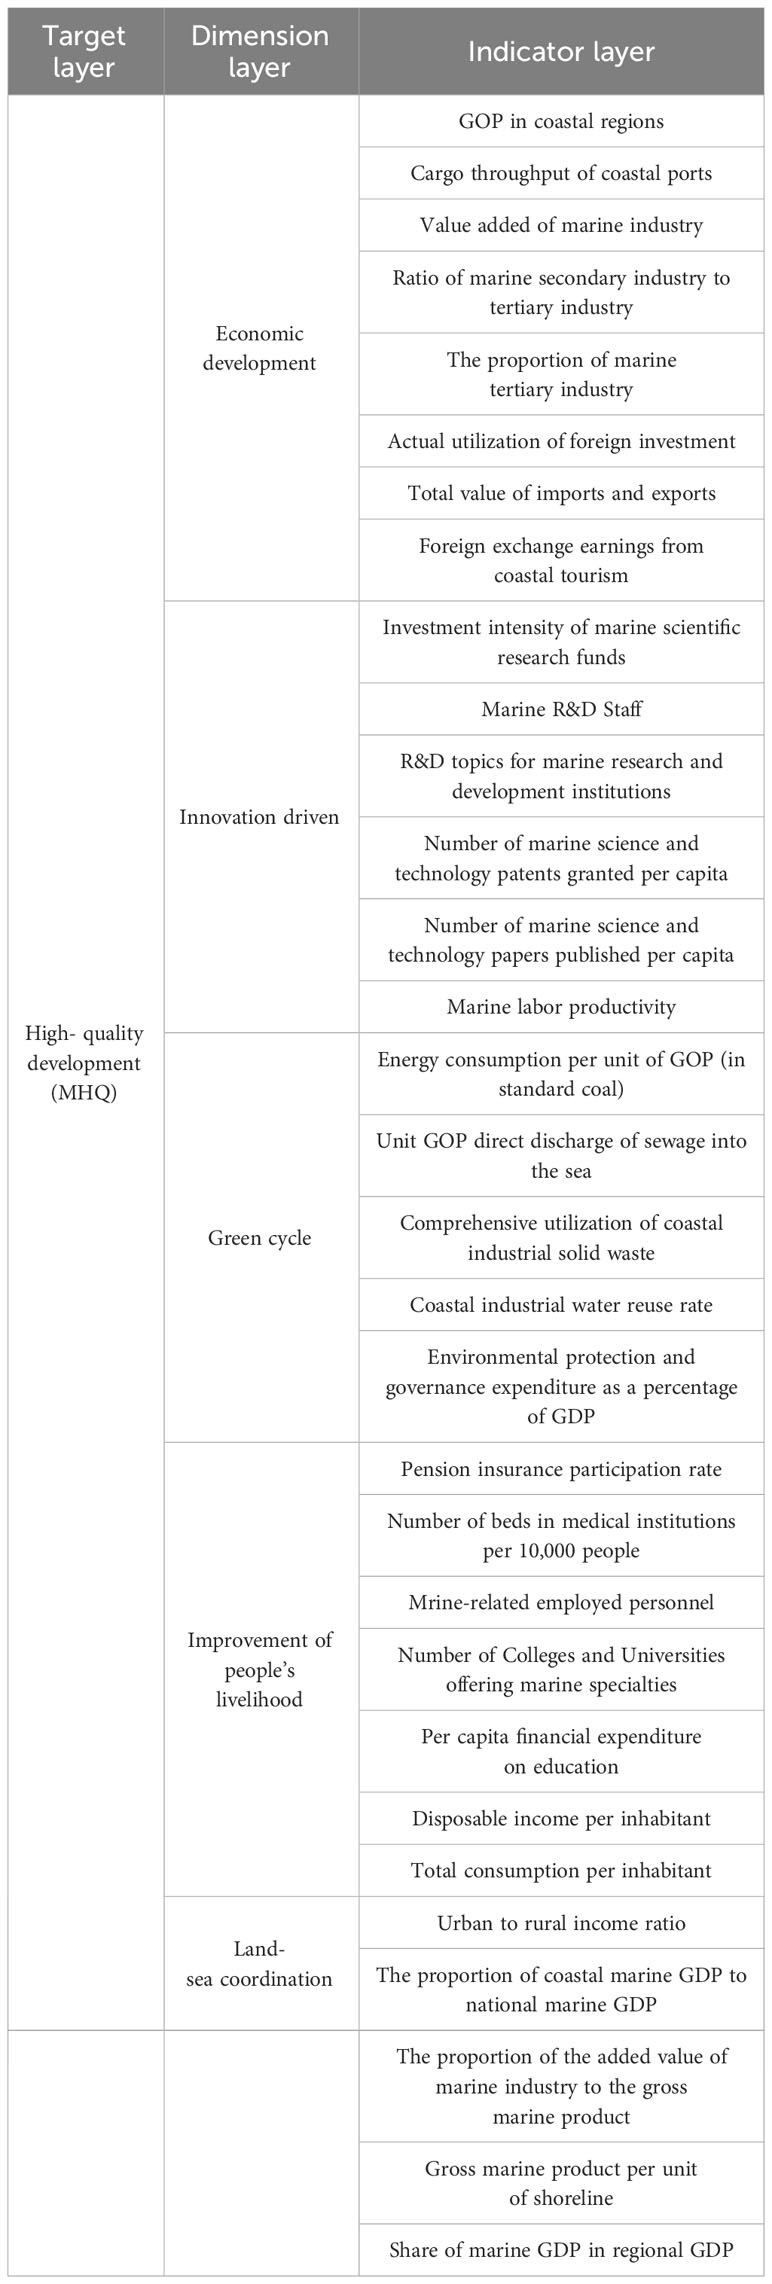
Table 2 Evaluation system of MHQD comprehensive development of 3MMECs.
The “economic development” serves as a measure of the operational status of the marine economy, manifesting in three aspects: economic scale, economic vitality, and economic openness. We employ a suite of indicators, including the “GOP in coastal regions”, the “cargo throughput of coastal ports”, and the “value added by the marine industry”, to quantify the economic scale. Additionally, we track the “ratio of marine secondary industry to tertiary industry” and the “proportion of marine tertiary industry” to gauge the economic vitality. Furthermore, to assess the level of economic openness, we consider metrics such as the “actual utilization of foreign investment”, the “total value of imports and exports”, and the “foreign exchange earnings from coastal tourism”. The “innovation driven “ is the core driving force for the MHQD, characterized by innovation resources and innovation efficiency. The “investment intensity of marine scientific research funds”, the “marine R&D Staff”, and the “R&D topics for marine research and development institutions” are three indicators that effectively reflect the driving force of innovation. In terms of innovation efficiency, we represent this aspect with the following three indicators: the “number of marine science and technology patents granted per capita”、the “number of marine science and technology papers published per capita”, and the “marine labour Productivity. The “green cycle” concept is instrumental in assessing the level of circular governance. It encompasses several secondary indicators, including the “energy consumption per unit of GOP”、the “comprehensive utilization of coastal industrial solid waste”, “coastal industrial water reuse rate”, and others. The concept of “improvement of people’s livelihood” embodies the essence and goal of high-quality economic development, which is fundamentally people-oriented. This focus on the well-being of the population is manifested in three key areas: social security, education development, and economic conditions. These areas are further defined by seven secondary indicators that encompass a broad spectrum of social well-being, including aging, education, employment, healthcare, and income. The “land-sea coordination” is a key measure for accelerating the construction of a maritime power. It emphasizes the overall regional development and promotes regional economic growth as indicators of assessment. Below are five secondary indicators: the “urban to rural income ratio”, the “proportion of coastal marine GDP to national marine GDP”, the “proportion of the added value of marine industry to the GOP”, and others.
MES and MHQD systems are complementary, interpenetrating, and constraining each other, the coupled coordination degree model we adopted to measure the level of synergistic development of the composite system is feasible (Bian et al., 2022):
In which and are the degree of coupling and coupling coordination between MES and MHQD, respectively (Equations 1, 3). The value interval is 0~1, the larger the value of , indicating that the stronger the coupling coordination of the composite system. is the integrated inter-system coordination index (Equation 2). is the coefficient to be determined and , in accordance with relevant national policies for integrated development and security, MES and MHQD systems are complementary and equally important (Geng and Ji, 2021) so take . represents the composite index of MES and MHQD. This paper examines the degree of coupling coordination of two subsystems, so the adjustment coefficient is taken as 2. is the integrated inter-system coordination index. In order to make a more accurate judgment of the degree of coupling coordination between the two systems in the study area, referring to the related research (Tsaur et al., 2006; Guo and Li, 2014; Song, 2021) we divided the coordination grade of the two systems based on the existing classification methods, the coupling coordination degree is classified by the median segmentation method (Cheng et al., 2019; Zameer et al., 2020; see Table 3).
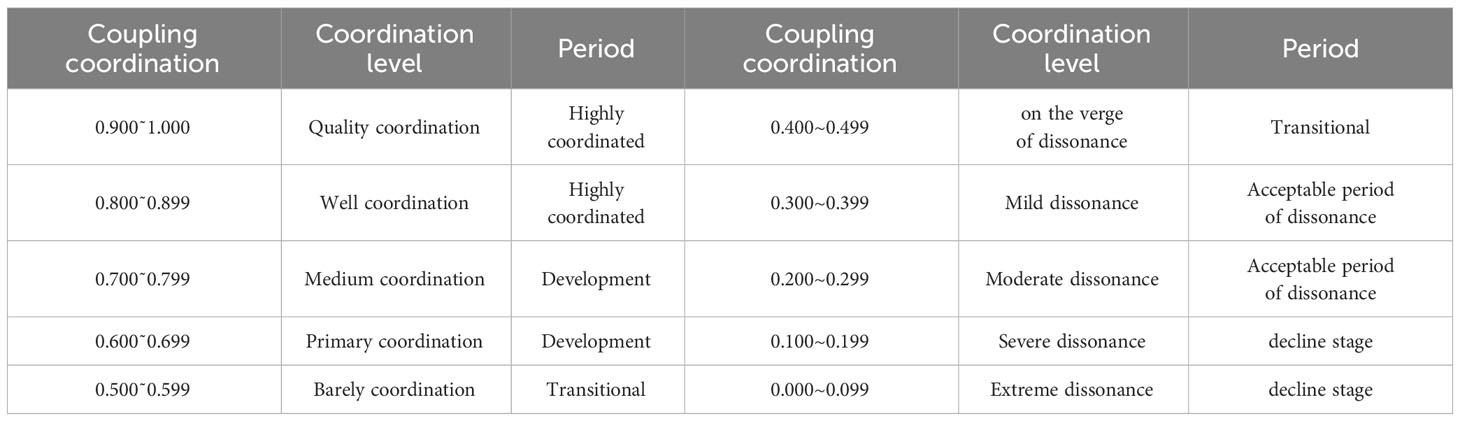
Table 3 Basis about coupling coordination degree level classification.
In order to clarify the extent to which inter-regional (among 3MMECs) and intra-regional (among provinces and cities) discrepancy affect the overall regional differences in the synergy of MES and MHQD, we use the method of Dagum Gini coefficient and its decomposition to explore the magnitude, sources and evolutionary dynamics of the differentiation in the level of synergy. The formula is as follows (Equation 4):
In which represents the total number of coastal regions, and is a regional subscript, indicating the number of provinces and cities, i and m indicating the subscripts for provinces and cities, respectively. represents the number of provinces and cities within region , is a measure of the level of synergistic development of the provinces and cities in region, while denotes the mean value of the coupling coordination of all examined Provinces and cities. The overall differences are decomposed into three parts: intra-group contribution (), inter-group net contribution (), and intensity of transvariation (), (Zhang et al., 2021a; Li et al., 2022).
Kernel density estimation is a method of applying continuous density profiles to describe the spatial distribution of a variable (Yu et al., 2021; Zhang et al., 2021a). We employ the method here to analyse the dynamic evolution trends of spatial patterns of distributional location, morphology, and polarization characteristics. We adopt the Gaussian kernel function in this paper (Chen et al., 2019).
The classical spatial econometric models are represented by three differentiated spatial interaction effects, including the spatial Durbin model, the spatial error model, and the spatial lag model (Yu and Xiu, 2018; Venkadavarahan et al., 2023). The setting of the spatial weight matrix in this paper will be developed in terms of economic significance (Wang, 2013). Assuming that there is a strong spatial interaction effect between spatial units with similar levels of coupling and coordination development, the spatial weight matrix can be set according to the degree of coupling and coordination between spatial units, which is expressed as follows (Equation 5):
In which is the weight assignment of spatial unit i to spatial unit ; and is the average level of coupling coordination for spatial unit and over the research period.
The synergy theory suggests that the key to the transformation of a complex system from disorder to order lies in the synergy mechanism that can occur within the subsystems of the complex system, which mainly emphasizes the association and synergy within the complex system, as well as the coordination and coupling between the subsystems of the complex system when the system is evolving (Xu et al., 2016). The MES-MHQD composite system is influenced by a comprehensive range of factors. In the evolution of the system, these factors interact with each other through constraints, competition, connection, and collaboration. Factors affecting the collaborative development of the composite system should be comprehensively considered from three levels: economic, social, and ecological (Geng and Ji, 2021).
Referring to the research of relevant scholars in the field, we mined the common influencing factors (Guo and Li, 2014; Wang et al., 2021b; Yan et al., 2023), we selected the following indicators for analysing the synergy of MES and MHQD. (1) Innovation-driven (innov), Innovation is the primary driving force for the MHQD, playing a crucial role in enhancing economic benefits and reducing ecological and environmental pressures (Chemmanur et al., 2010). A composite index obtained by using the entropy method to calculate the number of scientific and technological patents granted by marine scientific research institutions, the number of R&D projects and the number of marine scientific and technological papers published by marine scientific research institutions. (2) Optimization of industrial structure (struc). The optimization of the marine industry structure plays a promotional role in the integration of marine spatial resources, is an essential path for the MHQD, and is an important factor influencing the improvement of the ecological environment, expressed as a percentage of marine tertiary output to marine secondary output (Zhao et al., 2020). (3) Opening up to the outside world (open). Opening up to the outside world can stimulate market vitality and promote marine ecological safety under the guidance of environmental policies, which can be quantified by the actual utilization of foreign investment (Li et al., 2017). (4) Human capital (lab). Marine professional technical talents provide important support for the sustainable development of the marine sector, expressed as the proportion of marine science and technology personnel among the employed in marine-related industries (Hayes, 1990). (5) Degree of government intervention (inter). Government intervention primarily refers to the use of regulatory measures such as environmental regulations to protect and influence the development status of marine ecological security. This ensures the smooth and effective operation of the system of high-quality development of the marine economy and marine ecological security, which is a necessary condition for the coordinated development of the marine complex system (Ehlers, 2016). It can be expressed in terms of the proportion of investment in environmental governance to the GDP. (6) Improvement of people’s livelihoods (wellb). Improving the lives of the people is an important measure and fundamental guarantee for the coordinated development of MES and MHQD. It can comprehensively enhance the overall quality of workers, increase environmental protection awareness, and strengthen social responsibility (Bertrand and Mullainathan, 2003), expressed as the proportion of the consumption level of residents of coastal cities to the national consumption level.
We select the 3MMECs in China as a study area, involving 11 coastal provinces and cities (excluding Hong Kong, Macao, and Taiwan). Among them, the Northern Maritime Economic Circle (NMEC) consists of the regions of Tianjin, Hebei, Liaoning, and Shandong. The Eastern Maritime Economic Circle (EMEC) consists of the regions of Jiangsu, Shanghai, and Zhejiang while the Southern Maritime Economic Circle (SMEC) includes Fujian, Guangdong, Guangxi, and Hainan. The data are mainly obtained from the 2009-2020 China Marine Statistical Yearbook, China Marine Economy Statistical Bulletin, China Marine Ecological Environment Status Bulletin, and statistical yearbooks of coastal provinces and municipalities directly under the central government, etc. The missing data are estimated by using the trend extrapolation method and interpolation method.
We employed the ArcGIS10.8 software to explore the spatial distribution of the level of synergy of MES and MHQD. From 2009-2020, the evolution trend in the level of synergy between MES and MHQD has shown an incremental fluctuation, and there is a significant non-equilibrium development between different circles. EMEC had the highest coordination level, followed by NMEC and SMEC. The reason for this is that there are significant regional differences among these circles, leading to severe polarization and hindering the mutual promotion and coordinated development of the composite systems (Figure 2). The level of synergistic development of composite systems was distributed into four types, i.e., primary Coordinated, barely Coordination, on the verge of dissonance and mild dissonance (Figure 3; Table 3), and underwent the period of development, transitional and acceptable period of dissonance. Specifically, in 2009, Shandong, Jiangsu, Shanghai, and Guangdong as high-level regions were in the stage of barely coordinated, while Tianjin, Hebei, Liaoning, Zhejiang, and Fujian were on the verge of dissonance. From 2013 to 2017, the synergistic development of the composite system has undergone dynamic adjustments, resulting in an overall improvement. By 2020, with the advancement of the sustainable marine development goals, the regions that originally had a higher level of coordinated development among the 3MMEC are further developing. The characteristics are manifested by the fact that Shandong, Jiangsu, Shanghai, and Guangdong have consistently been high-level regions in the coordinated development of the marine complex system, belonging to the primary coordination and barely coordinated levels, indicating that there are regional high-level areas within each of the 3MMECs. The analysis also shows that Guangxi and Hainan have consistently been at a level of mildly dissonance and are considered low-level regions in terms of coordinated development. Liaoning, Zhejiang, and Fujian have transitioned from on the verge of dissonance in 2009 to a level of mildly dissonance in 2020, and these provinces are concentrated in the NMEC and SMEC. Tianjin and Hebei, which are located in the NMEC, are at a level of on the verge of dissonance. The results of these classifications indicate that there is significant regional heterogeneity among 3MMECs, and there is also a degree of spatial imbalance within each circle.
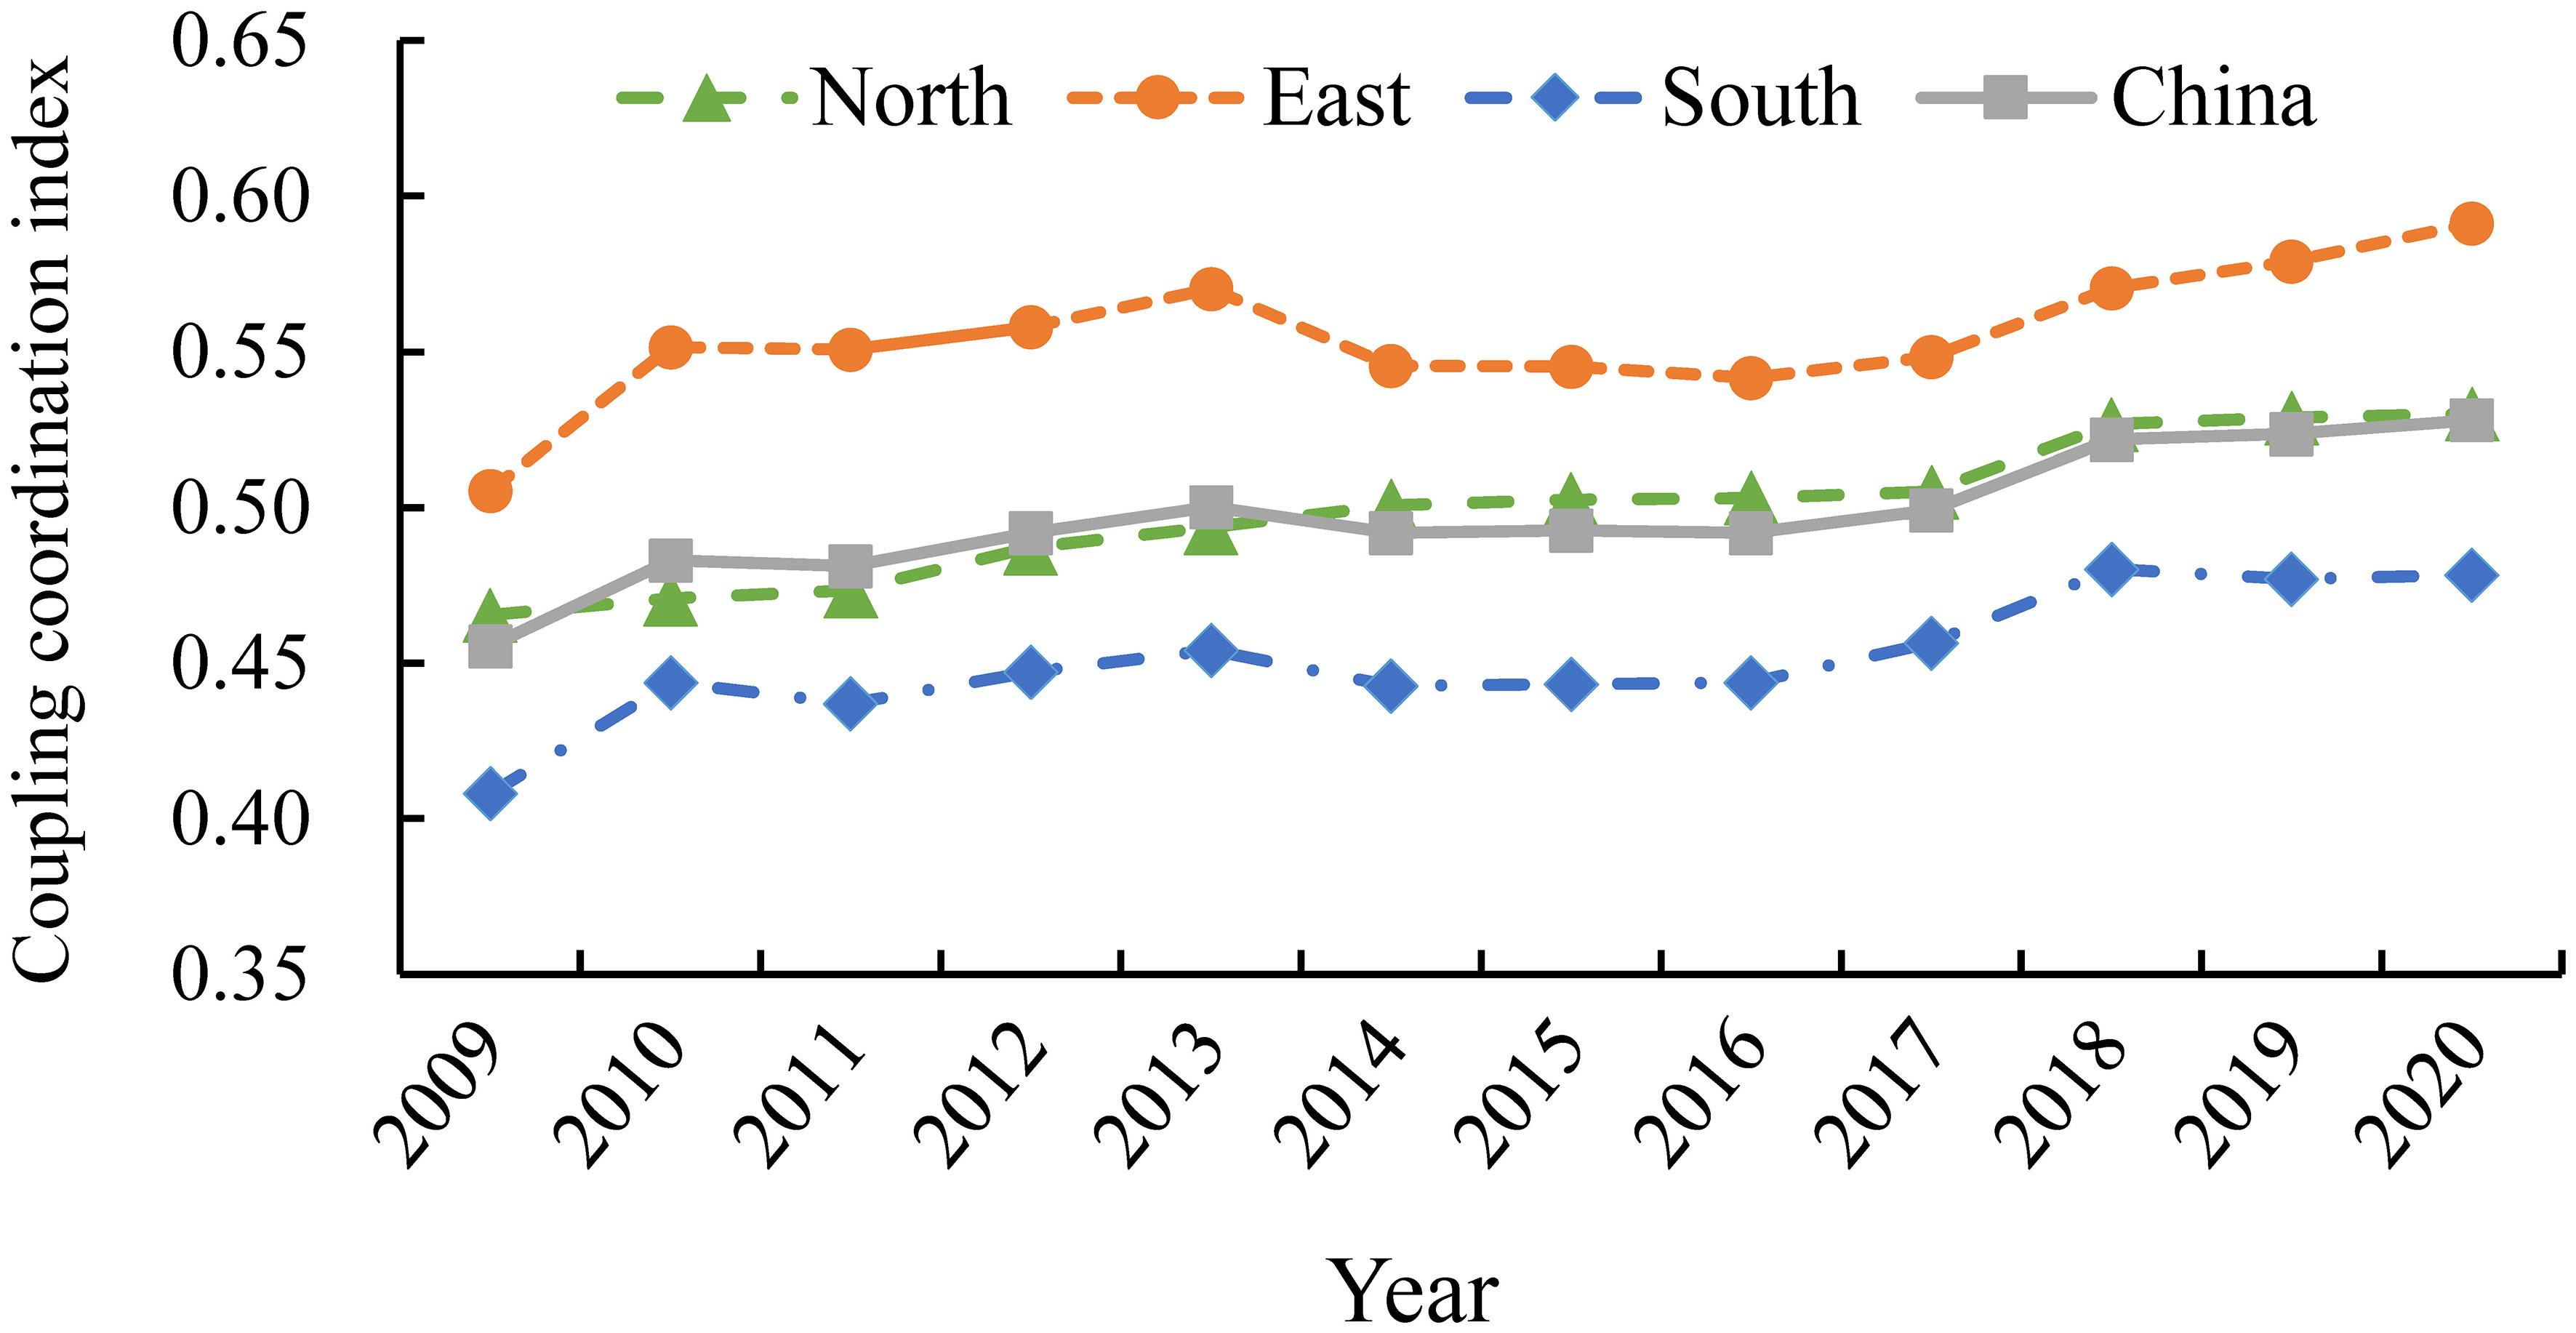
Figure 2 Evolution trend of synergistic development level between MES and MHQD in 3MMECs from 2009 to 2020.
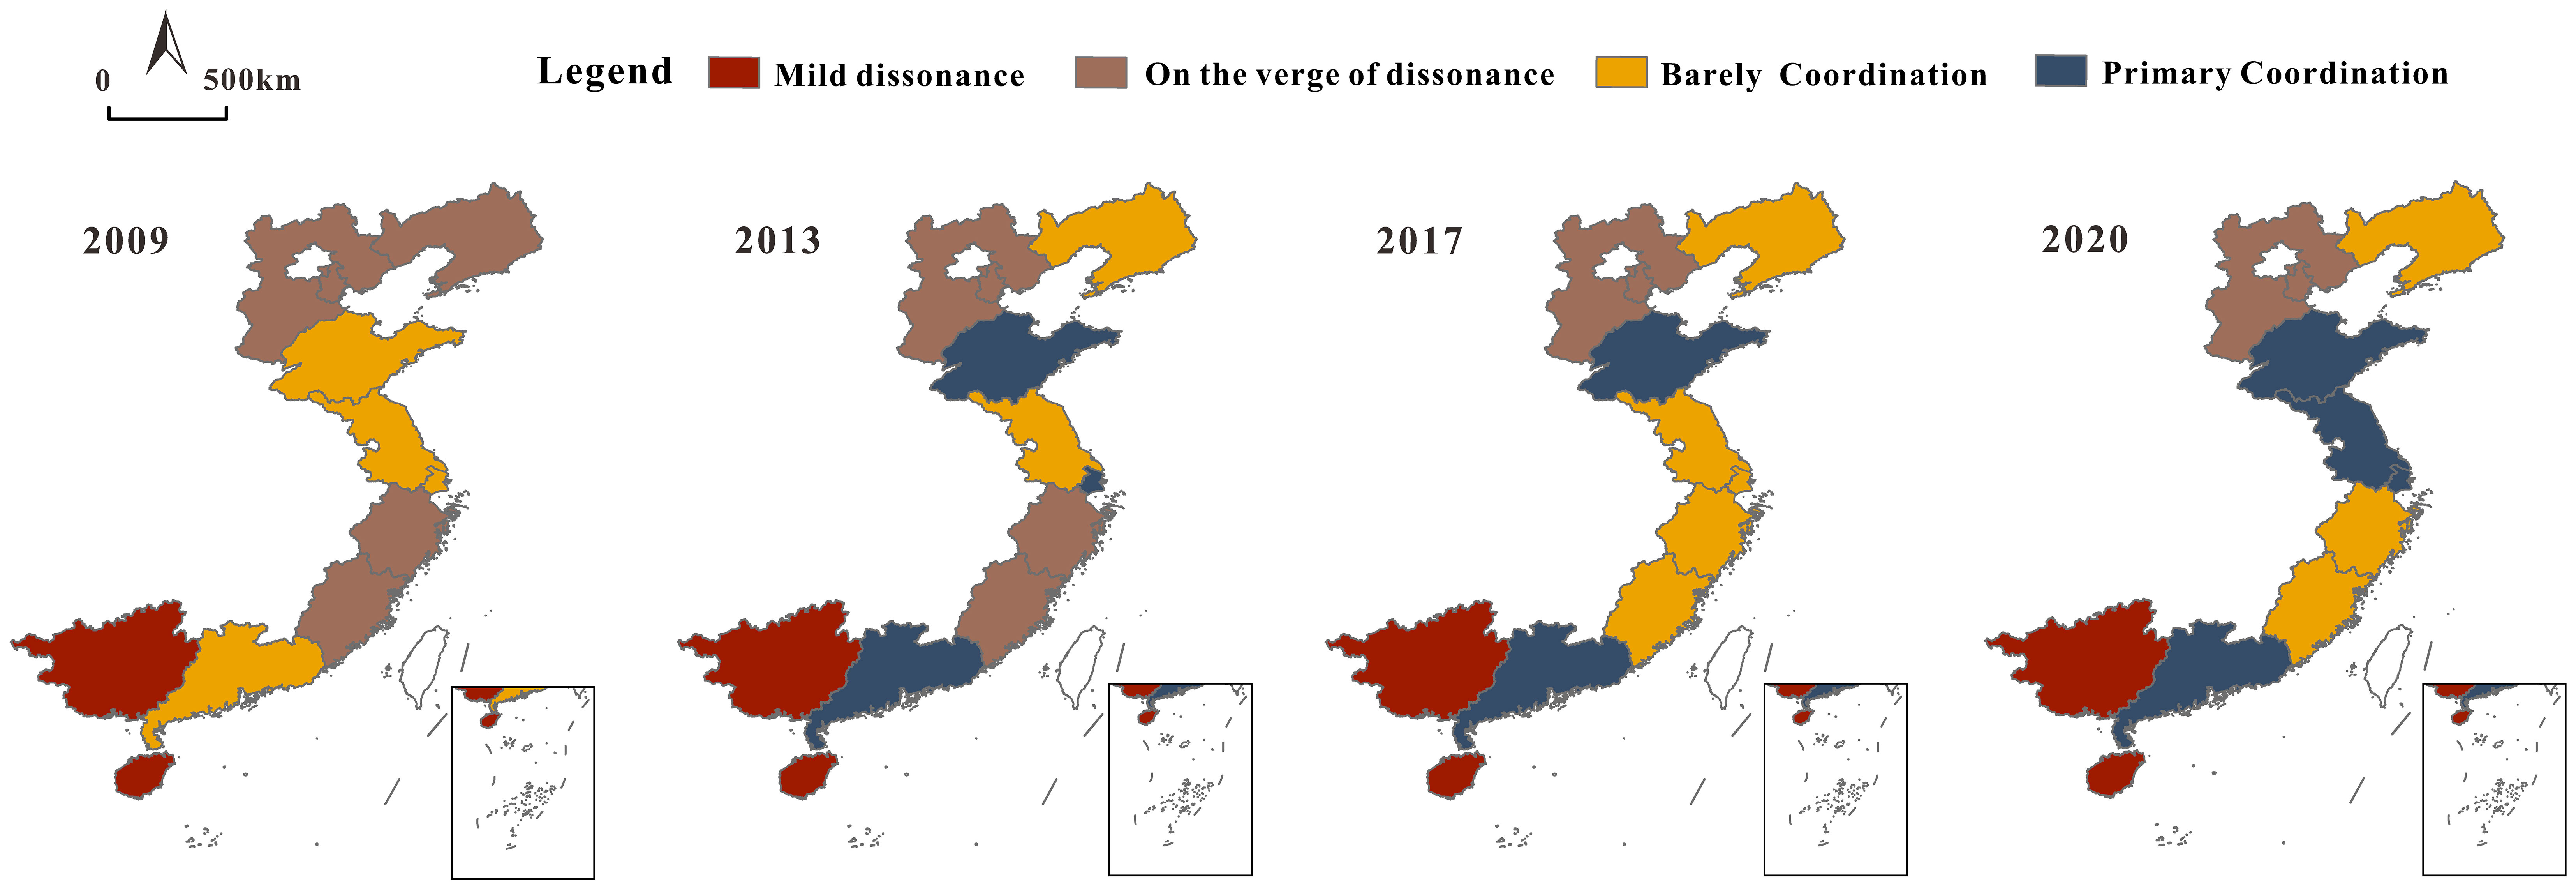
Figure 3 Spatial and temporal distribution of the level of synergistic development of MES and MHQD in China.
Overall differences in the level of synergy between MES and MHQD are increasing (Table 4), with a mean value of 0.1092. The highest value occurred in 2013 (0.1153) while the lowest value occurred in 2009 (0.1036). The evolution of the Gini coefficient can be roughly divided into two phases. The first phase is from 2009 to 2015, during which the curve of changes in the degree of coupled coordination differences experienced a peak in 2013, showing a fluctuating trend of “rising-declining-rising”, with an average annual growth rate is 0.15 percent. The second phase is from 2016 to 2020, which is in the crucial period of the “13th Five-Year Plan” for the marine economy. During this period, with the further optimization of the layout of 3MMECs, the degree of difference in synergistic development shows a yearly decline with an average annual decrease of 0.19 percent, but with a slight rebound in 2020.
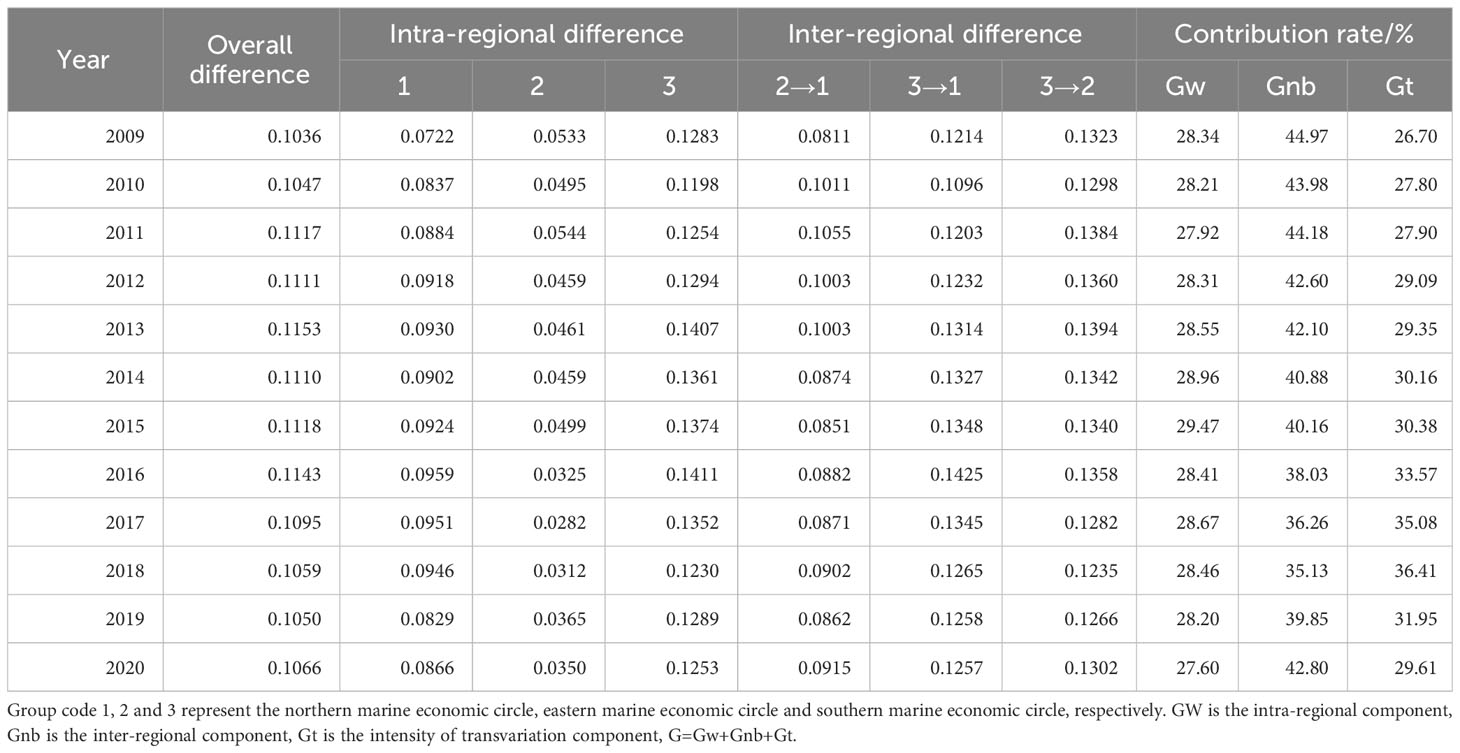
Table 4 Dagum Gini coefficient and its decomposition results.
Intra-regional differences in the level of MES-MHQD synergistic development have a clear hierarchical division (Figure 4A) and are ranked as SMEC> NMEC > EMEC. There is a serious polarization in SMEC, Guangdong and Fujian are ranked at the top while Guangxi and Hainan are relatively backward. EMEC has a minimum value, of less than 0.6. The Yangtze River Delta marine economy has expanded and upgraded from a double “V” shape to a “W” shape (Shen et al., 2023), and the integrated and synergistic development of the inter-region will be stepped up to a new level, which will contribute to the narrowing of the differences in synergistic development of the regional composite system. In terms of evolutionary trends, the intra-regional differences in the EMEC and SMEC show a fluctuating downward trend, while the NMEC shows an upward trend. In addition, in 2012, “the Ocean Power strategy” was promulgated and implemented, proposing the simultaneous promotion of marine economic development and ecological protection. This has, to a certain extent, increased the degree of regional equilibrium in the synergy of MES and MHQD in 3MMECs. Hence, the intra-regional differences in 3MMECs declined from 2013 to 2014.
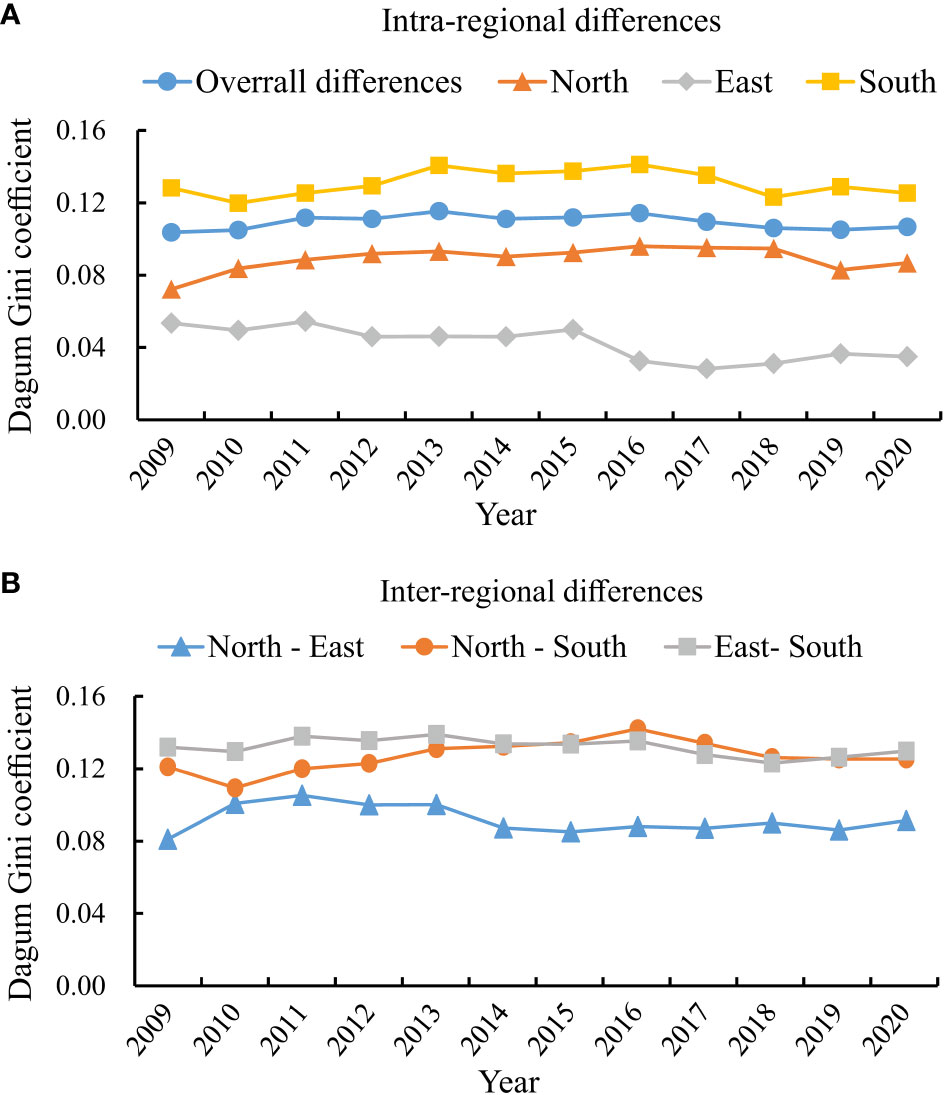
Figure 4 Evolution trend of regional differences in Level of synergistic development between MES and MHQD in 3MMECs.
The degree of inter-regional differences is in descending order of East-South, North-South, and North-East (Figure 4B). The evolutionary trend shows a decreasing trend in the East-South and an increasing trend in the North-East and North-South. Specifically, the East-South’s inter-regional differences show small amplitude fluctuations of “declining-rising “, with the peak occurring in 2013; North-South shows an inverted “N” pattern of “declining-rising-declining “; meanwhile, North-East shows an “N” pattern of “rising -decreasing- rising”. It is noted that NMEC and EMEC are the intersection and pioneer area of the national marine regional development plan and opening up to the outside world, which enhanced interregional synergies and openness, so the inter-regional differences value of North-East is minimal. Due to the “COVID-19 period” in 2020, the marine economy has been somewhat impacted, which has led to a further increase in synergistic development differentiation. Therefore, the value of the difference between regions in 2020 was slightly recovered in most of the groups.
In terms of evolutionary trends (Figure 5), the contribution of intra-regional differences fluctuated less, with an overall slow decline from 28.34 percent in 2009 to 27.60 percent in 2020. The contribution of inter-regional differences fluctuates considerably, showing a “declining-rising” pattern, falling to a minimum in 2018, followed by a rapid rise. The contribution of the intensity of transvariation has increased with small fluctuations from the beginning of the period to 2018, with an overall smoother evolution, showing a “rising- declining” pattern, and peaking at 36.41 percent in 2018. In terms of contribution rate, the inter-regional difference was overall high throughout the study period except for 2018, followed by the intensity of transvariation and intra-regional differences. Indicating that inter-regional difference is the main factor contributing to overall regional differences, significant spatial disequilibrium exists among the 3MMECs. In addition, while the issue of overlap between different regions exists, its impact on the overall gap is limited.
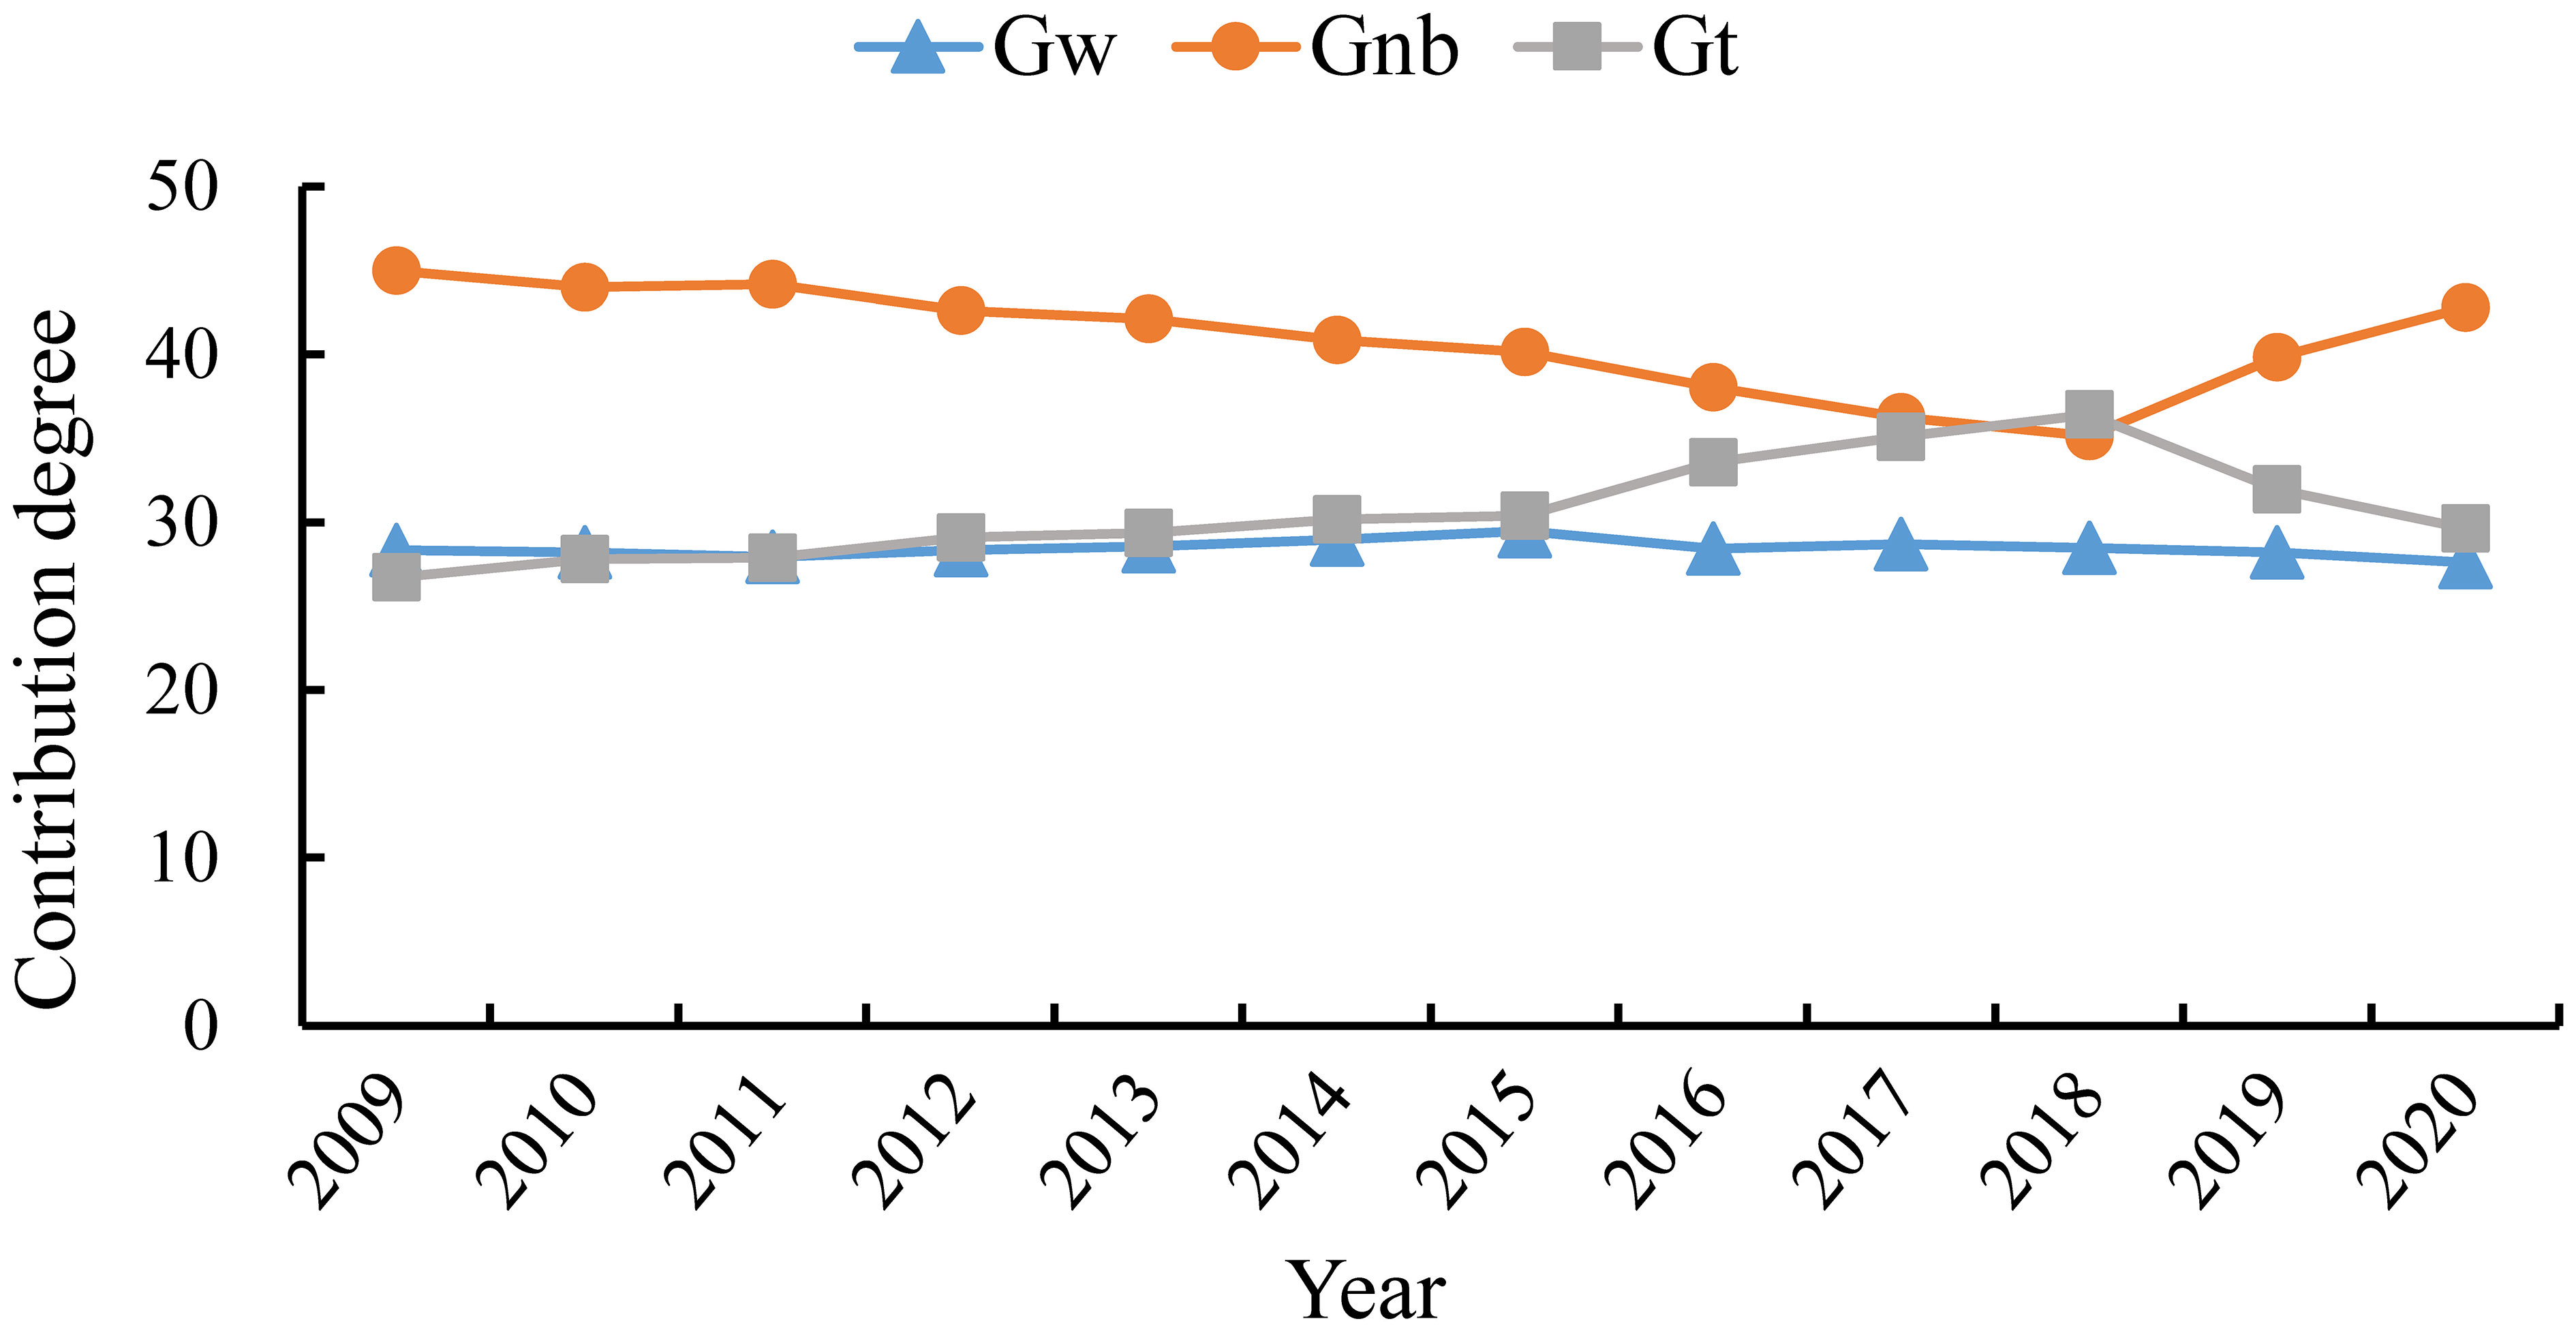
Figure 5 The origin of regional differences and contribution degree in the level of synergistic development.
From 2009 to 2020, the centres of the Kernel density curves nationwide and each of the 3MMECs show a clear rightward shift (Figure 6; Table 5), indicating a steady increase in the degree of coordination and a movement of the system towards mutual reinforcement, integration, and coordination. The curve of EMEC shifts rightward the most, indicating a large increase in the level of synergistic development. The rightward shift of the SMEC is smaller compared to the NMEC, indicating that the level of MES-MHQD synergistic development in the SMEC is relatively slow to improve and the synergistic pressure is high.
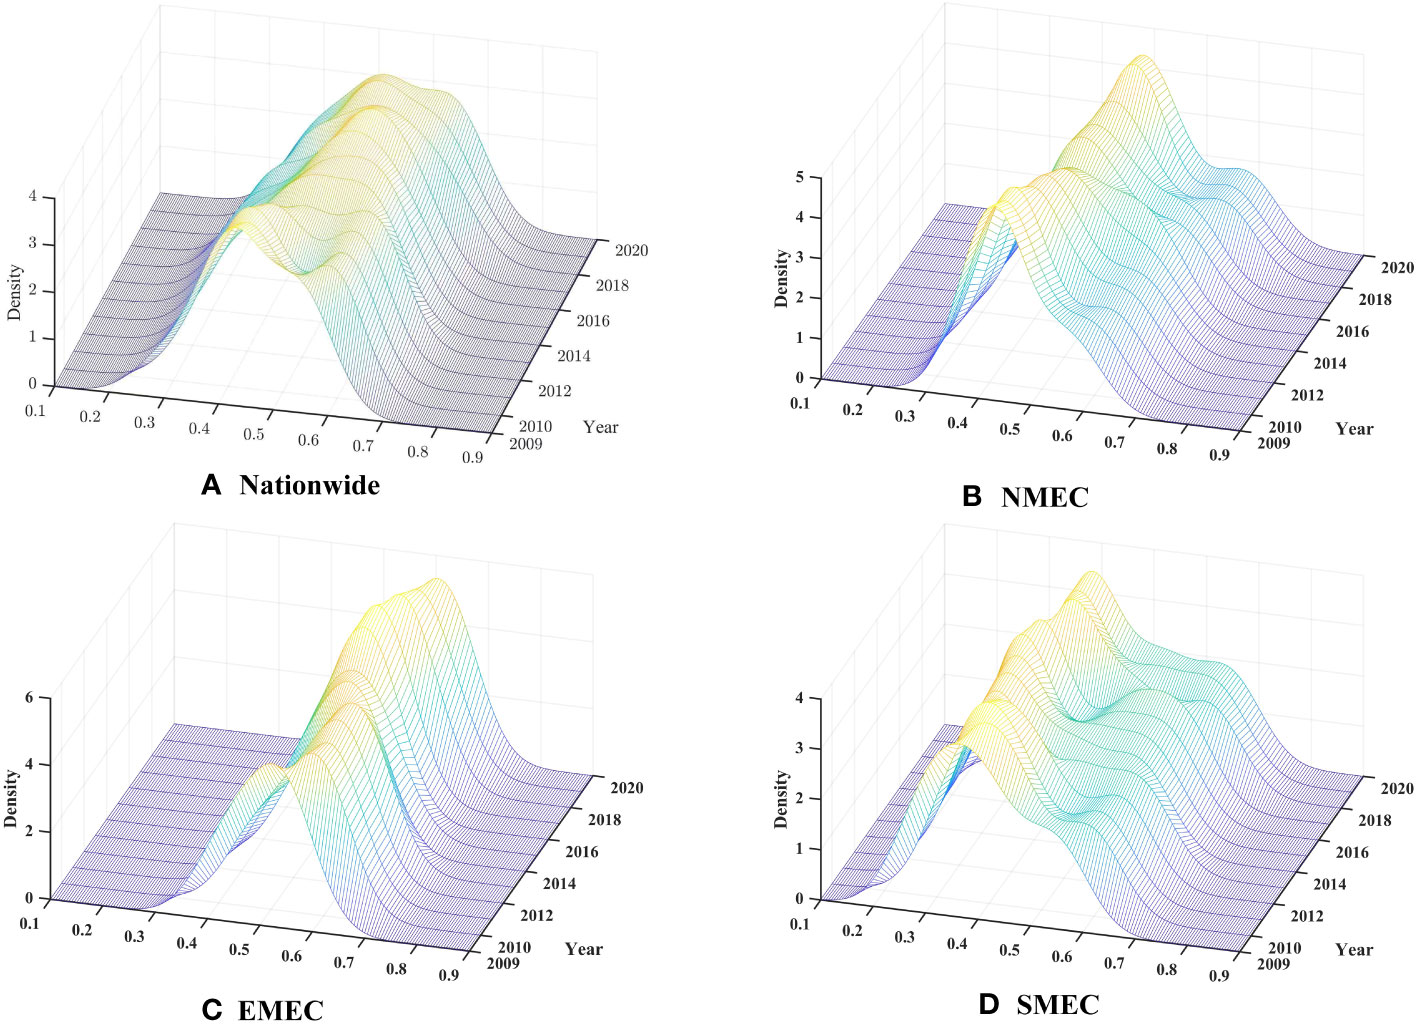
Figure 6 Kernel density of the coupled coordination degree of the composite system in nationwide and 3MMECs. Figure (A–D) shows the results at the national level (Nationwide), as well as for the Northern Marine Economic Circle (NMEC), the Eastern Marine Economic Circle (EMEC), and the Southern Marine Economic Circle (SMEC).
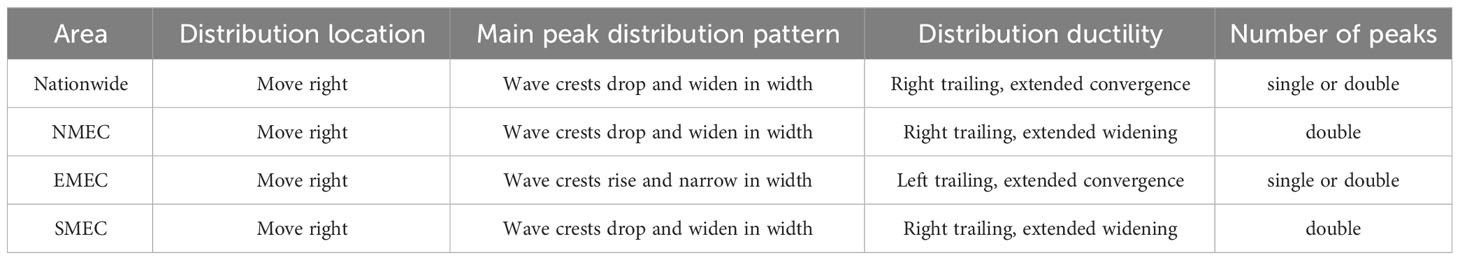
Table 5 Distribution and dynamic evolution characteristics of coupled coordination degree of the composite system in 3MMECs.
The distribution curves of nationwide, NMEC and, SMEC show an evolutionary trend of decreasing height and increasing width of the main peaks, indicating a gradual increase in the degree of dispersion. Due to the various bases of provinces, the ease of achieving synergistic development of composite systems varies considerably. The height of the main peak of the distribution curve of EMEC is increasing and its width is becoming smaller, indicating that the absolute difference in the level of synergistic development of the composite system is gradually narrowing. In 2017, the national side peaks exceeded the main peak, a further increase in the number of provinces and cities in the country with higher levels of coupled and coordinated marine composite systems, and the gap between regions continues to widen.
The distribution curves for the level of synergy between MES and MHQD in nationwide, NMEC, and SMEC have an obvious right-trailing phenomenon. Meanwhile, there are provinces with a higher level of synergistic development in each of 3MMECs. The left trailing phenomenon in EMEC is not significant. The distribution of synergistic development in nationwide and EMEC shows a converging trend, the gap between the higher-lower level and the average level is gradually narrowing. Core cities like Shanghai have led to the improvement of the level of synergy of the composite system in the neighbouring areas through the “radiation effect”. The curves of NMEC and SMEC show an extended broadening, provinces with higher scores have been further developed, and regional differences have increased, leading to the phenomenon of the “best of the best”.
The distribution curves of nationwide and EMEC show either a single peak or a double peak phenomenon, while NMEC and SMEC show bimodal characteristics, there is a polarization in the synergistic development of composite systems. Specifically, the distribution of curves at the national level undergoes a bimodal-unimodal-bimodal evolution. In a period of “bimodal”, regions with higher levels of synergistic development self-converge to higher values, which illustrates a certain gradient effect, but the degree of polarization is mitigated. EMEC showed a weak bipolar phenomenon in 2013, with the side peaks located to the left of the main peaks, other years showed an unimodal distribution. NMEC and SMEC have always been polarized, distance between peaks showing a tendency to expand, with bottlenecks in synergistic development in the low-value regions.
The previous sections (sections 4.3) revealed the spatial imbalance characteristics of the coordinated development level of MHQ-MES composite system. To further explore the factors influencing regional differences, we here construct a spatial weight matrix with economic implications and introduces a spatial econometric model to analyse the key driving factors causing the differences in the level of coordination of the composite system, as well as to examine their impact magnitude and spatial spillover effects. The results of the Hausman test indicate that a fixed effects model should be chosen (Table 6). The LM test results show that, except for the LM-err test which is not significant, both the Robust LM-err, LM-lag, and Robust LM-lag tests have passed the 1% significant level test. Overall, the spatial lag model appears to be slightly superior to the spatial error model; the LR test indicates that the spatial Dubin model (SDM) cannot be degenerated into a Spatial Autoregressive model (SAR) or a Spatial Error Model (SEM).
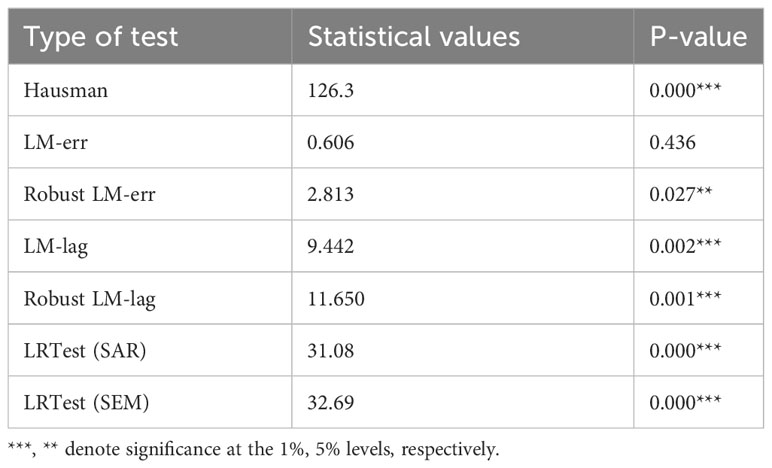
Table 6 Testing of spatial econometric models.
Therefore, we choose the SDM with spatial fixed effects for the analysis of influencing factors. We obtain the results of the total, direct, and indirect effects (Table 7), the sign of the spatial lag coefficient “ρ” is significantly positive, and there is a positive spatial correlation in the degree of coupling coordination of MES and MHQD among 3MMECs, with significant spatial spillover effects, which validates the rationality of the spatial measurement model construction.
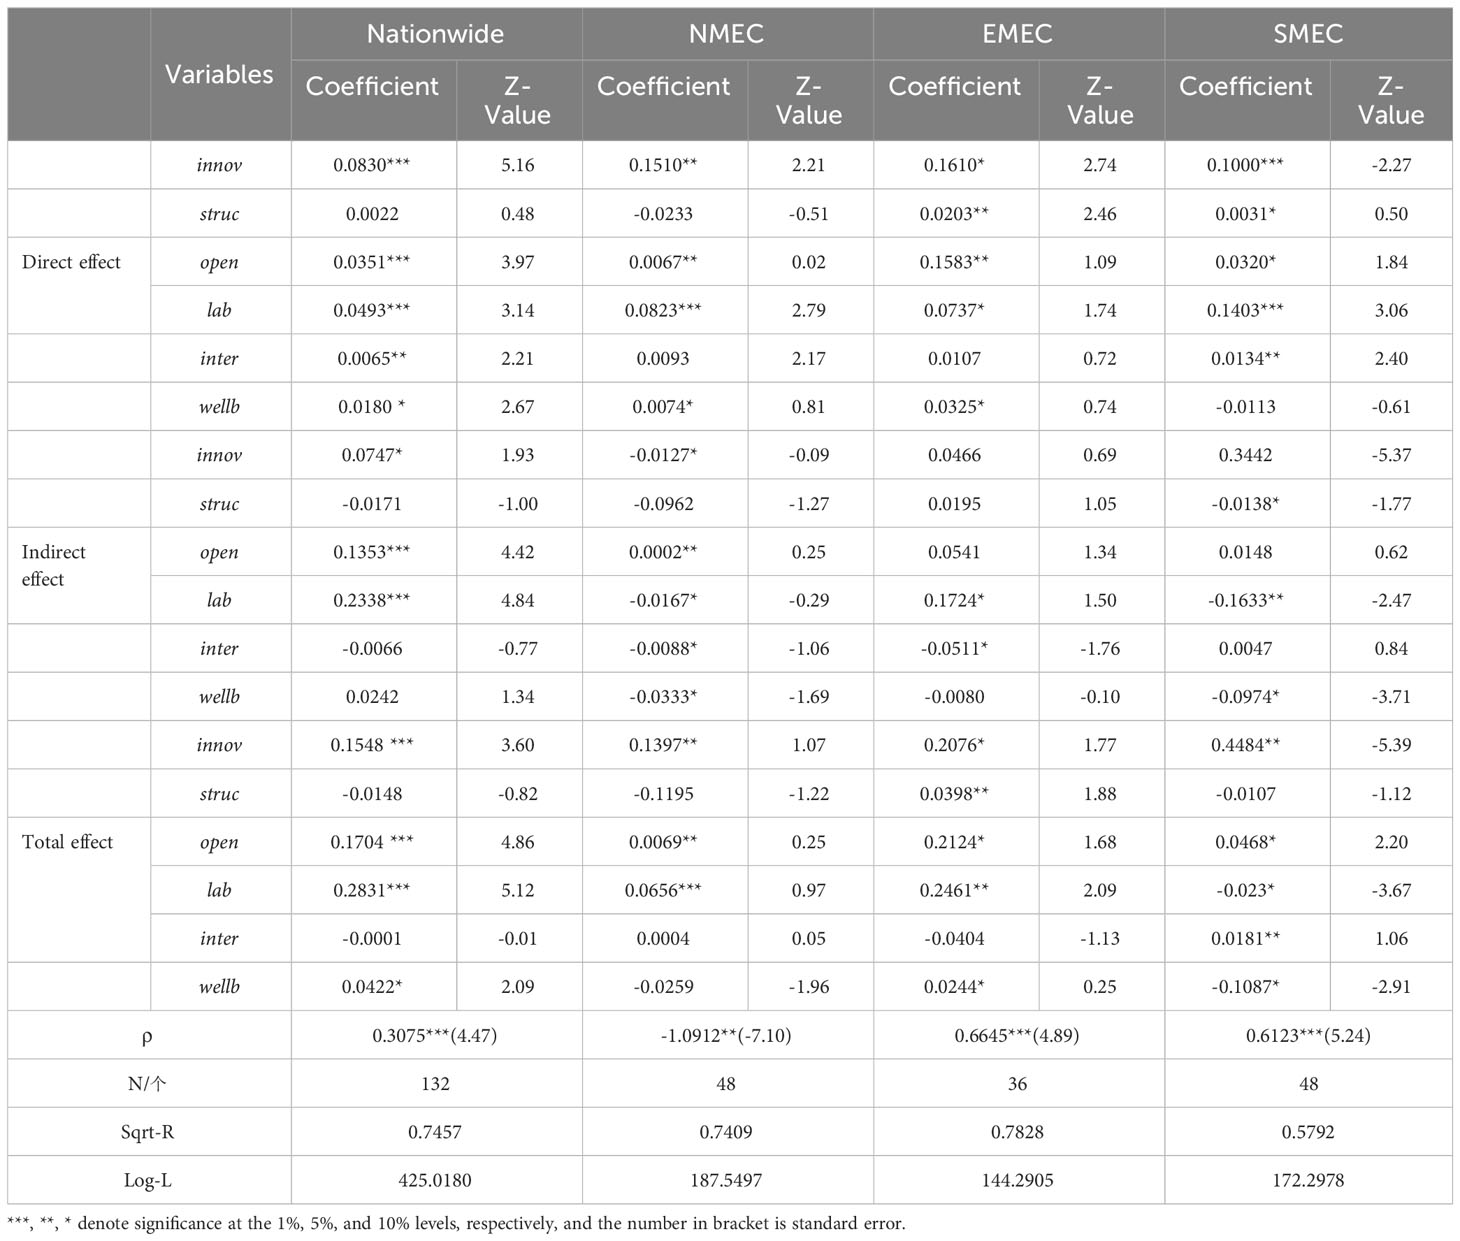
Table 7 Spatial effect decomposition of spatial Dubin model (SDM)based on fixed effects.
From the regression results at the national level, with the implementation of the “science and technology to develop the sea” strategy, “innov” has a positive driving effect on the synergy of MES and MHQD. The direct effect coefficient is 0.083, and the indirect effect coefficient is 0.0747, passing the test of significance level of 1% and 10%, respectively. The spatial spillover effect of “struc” on local and neighbouring areas is not significant. Industrial restructuring can revitalize economic vitality, but the spatial spillover effect of synergistic between MES and MHQD in local and neighbouring areas is not significant in a short period of time. The direct and indirect effects for “open” are 0.0351 and 0.1353, respectively, both of which pass the 1% significance level test. With the benefit of China’s reform and opening-up policy, the spatial spillover effect on neighbouring regions is significant, while the neighbouring regions can effectively benefit from the results of the region’s opening-up policy. The direct effect and indirect coefficient of “lab” both pass the 1% significance level test. Marine professionals, as a fundamental element in the growth of marine science and technology, play a decisive role in marine environmental protection. The positive indirect effect may be due to the sharing of scientific and technological achievements and the exchange of talents in the region, thus positively affecting the synergistic effect of the peripheral region-shaped composite system. The impact of “inter” on the local region has a positive but weak effect (0.0065), this probability is due to the lagged effect of policy adjustments. However, local impacts on neighbouring areas have not yet developed a statistically significant effect, so the focus is therefore on the influence of other factors. The direct effect coefficient of “wellb” is significantly positive, indirect effect is not significant. The reason may be that the social welfare policies of the region will attract the inflow of talents and other advantageous resources from the neighbouring regions, forming a “siphoning effect” on the neighbouring regions, thus making it difficult to promote the benign synergistic evolution of the composite system in the neighbouring regions.
We further discuss the effects of spatial effects by sub-region in order to compare the characteristics of the differences of different influencing factors of 3MMECs.
The direct effect coefficients of “innov” on the 3MMECs are all positive and pass the significance test of 1% and 5%, only the indirect effect coefficient for the NMEC passes the significance test and is significantly negative. Innovation-driven saves the consumption of resources and energy while promoting the transformation and upgrading of the marine economy, injecting new kinetic energy into the synergistic promotion of MES and MHQD. However, provinces of NMEC like Shandong with improved innovation capability enhance the “adsorption” effect on the innovation resources of the backward regions in the neighbourhoods, which further inhibits the benign spiral development of the composite system in the neighbouring regions.
The direct effect coefficients of “struc” on the EMEC and SMEC passed the significance level tests of 5% and 10%. The optimization and upgrading of industries have had a negative effect on the composite system of NMEC for a short period of time, but the overall impact is not significant. In terms of spatial spillovers, it shows a significant negative effect only on the SMEC. It shows that the industrial structure of the SMEC has obvious polarization effects and is susceptible to the negative influence of the “struc” from neighbouring provinces.
The direct effects of “open” on the 3MMECs are positive and tested at the 5% and 10% levels of significance, which are stronger than the indirect effects. This suggests that the implementation of marine international trade policies has a significant positive impact on the synergistic development of MES and MHQD, which is particularly strong in NMEC and EMEC. In terms of indirect effects, only the NMEC passes the significance test. The spatial “diffusion” effect led to a radiation-driven effect on the coordinated development of the neighbouring regions along the open route. At the same time, as an important “gateway” to the outside world, more attention has been paid to the restoration and improvement of the ecosystems.
The direct and indirect effects of “lab” on the 3MMECs passed the significance level tests of 1%, 5%, and 10%. In terms of spatial spillover effects, human capital has a significant positive contribution to the EMEC. There is a spatial “squeeze” effect of labour, which promotes the spillover of the coordinated development trend of the marine composite system in inter-regional exchanges, and effectively leads to the enhancement of the coordinated level of MES and MHQD in neighbouring provinces and cities. In SMEC and NMEC, the indirect effects are significantly negative. With economic and policy advantages, the “return effect” leads to the loss of human capital in neighbouring provinces, which in turn has a dampening effect on the coordinated development of composite systems.
The direct effect of “inter” did not pass the significance level test except for the SMEC. The coefficient of indirect effects on NMEC and EMEC are significantly negative. Local environmental regulation and preferential policies generate competitive advantages in relevant areas, which inhibits the coordinated development in the neighbouring regions. The central province led by Guangdong in SMEC, in collaboration with the remaining three provinces and cities, has effectively reduced the additional cost of marine environmental regulations by raising the standards of environmental regulations, and promoting the synergistic development of composite systems in the region.
The direct effect coefficients of “wellb” on the NMEC and EMEC are significantly positive while on the SMEC are insignificantly negative. The indirect effect coefficient on the NMEC and SMEC is significantly negative. The improvement of urban infrastructure support of NMEC and SMEC, especially the great abundance of education and medical resources, has produced a “siphon effect”, a phenomenon in which resource elements are gathered in resource-advantaged areas, which is conducive to the synergistic development of the region’s composite system.
The prominent “ecology-economy” contradiction, unbalanced, and uncoordinated regional development have been the key issues constraining the sustainable development of China’s oceans and seas (Cheng J. et al., 2023). We innovatively constructed a framework for analysing the mechanism of synergy between MES and MHQD, on the basis of which regional differences in the level of synergistic development of the composite system, as well as its distribution and evolution trends, were revealed. Meanwhile, the factors influencing regional differences and their spatial spillover effects are also elucidated. This study provides theoretical and practical support for narrowing down the regional differences in the development of the marine composite system and promoting the synergistic development of the composite system in 3MMECs. The main conclusions are drawn as follows:
(1) The level of synergistic development of MES and MHQD showed an increasing trend in 3MMECs, and there is a significant spatial non-equilibrium. The synergistic development belongs to four categories of primary and barely coordinated, on the verge of dissonance and mildly dissonance, has not yet reached a high level of harmonization. (2) The overall differences in the level of synergistic development show a fluctuating upward trend, with intra-regional differences ranked as SMEC > NMEC > EMEC. The degree of inter-regional differences is ranked as East-South > North-South > North-East. Inter-regional differences are the main cause of overall regional differences. (3) In nationwide, NMEC, and SMEC, the absolute differences are widening, and that there are areas of high values of the level of coordinated development while the absolute differences within EMEC show a narrowing trend. The spatial distribution of the level of synergy in composite systems shows “multipolarity”. (4) The synergistic development of composite systems has a strong positive spatial correlation and aggregation; except for optimization of industrial structure, other influences contribute positively to the synergistic development of composite systems in this region; innovation-driven, opening up to the outside world and human capital play an active role in promoting the synergistic development of the composite system in the neighbouring regions.
The findings suggest that the MES-MHQD composite system exhibits a moderate level of coordination overall. Notably, the level of collaborative development among the 3MMECs and within each circle (between provincial regions) is significantly different, and the overall difference is showing a trend of expansion. This is bound to become a constraint on China’s coastal regions in exploring sustainable development paths in the future. Accordingly, to effectively reduce the regional differences and differentiate evolutionary trends in the collaborative development of the MES and MHQD composite system, we propose policy recommendations from the following three aspects:
(1) We should optimize the spatial layout of the composite system to foster balanced and harmonious development within the 3MMECs. Based on the measurement of the collaborative development level of the composite system, the coordinated development level of MES and MHQD among the 11 coastal provinces and cities in China is generally low. The results of Dagum coefficient decomposition reveals significant spatial inequality in the collaborative development of the composite system within the 3MMECs, and the intra-regional differences are becoming entrenched. To alleviate such differences, two approaches should be taken into consideration. On one hand, for regions where the collaborative development level of the marine composite system is low, tailored government regulatory strategies should be implemented. These strategies should focus on improving the quality and efficiency of the economy, rationally allocating marine resources, and practicing eco-friendly maritime policies. By taking these measures, we can foster a positive cycle of interaction between marine economic and ecological systems, which, in turn, will enhance the level of synergistic development of the composite system in these regions. On the other hand, each economic circle should fully utilize the spatial spillover effects of the regions within their marine composite system that have a competitive advantage in collaborative development, and strengthen the internal linkages and cooperation. For instance, the SMEC exhibits the most significant regional differences. As the leading region in the collaborative development of the composite system, Guangdong should capitalize on the advantages of its special economic zones. It should extend the influence of its marine economy, deepen ecological cooperation with neighbouring areas, and proactively advocate for the integration of Hainan and Guangxi into an overarching marine development strategy.
(2) We should enhance inter-regional cooperation and exchange mechanisms to foster coordinated integration and development of the MES-MHQD in coastal regions. Based on the Gini coefficient and Kernel density estimation results, the differences among the 3MMECs are the main factors contributing to the overall regional differences. Therefore, it is necessary to enhance the exchanges and cooperation, break down regional market barriers, and promote the flow of innovative and green resource elements among the 3MMECs. At the same time, taking opportunities from domestic and international economic cooperation strategies such as the “Belt and Road” Initiative and the concept of “building a community with a shared future in the sea”, we should consolidate the strategic cooperative relationships within the NMEC, EMEC, and SMEC, to further enhance the collaborative development level of the composite systems and balanced development among marine regions. Taking the EMEC and SMEC, which have significant inter-regional differences, as examples, it is necessary to encourage provinces in the SMEC such as Hainan and Guangxi to enhance cooperation with the EMEC’s Shanghai and Jiangsu, leveraging the strategic advantages of their region. They should fully utilize the natural resource advantages and integrate the high-quality innovative resources of the EMEC into the regional marine green development chain. These measures will effectively accelerate the industrial transformation and upgrading, establish long-term momentum for green innovation, and promote the balanced development of the composite systems between the EMEC and SMEC.
(3) We should accurately identify the shortcomings in regional development and adopt a differentiated strategy to promote the coordinated development of the MES and the MHQD complex system. The regression results of the spatial econometric model indicate that innovation-driven is a powerful engine leading the coordinated development of the MES and the MHQD complex system. It is imperative to persistently advance the conversion of marine science and technology towards more innovative domains. This involves conducting comprehensive technical research and development efforts focused on core, generic, and cutting-edge technologies within the realm of new marine green industries. In addition, human capital and government environmental regulations remain the primary drivers for promoting the coordination of marine ecological security and high-quality development of the marine economy. Therefore, regions should strengthen the cultivation of talent in marine-related fields, focusing on improving the quality of labour in the marine industry; simultaneously, there should be an increase in macro-control and financial support for marine ecological pollution prevention, control, and ecosystem restoration, actively guiding the marine industry towards a green and sustainable development path. Moreover, it is crucial to persist in the opening-up policy under the MES system, to deeply participate in global competition and cooperation in the marine economy and marine ecological environment governance and protection, and to seek the harmonious development of MES-MHQD from a more open perspective. Finally, the improvement of people’s lives plays a significant positive role in the collaborative development of the MES and MHQD complex system. Local governments should strengthen infrastructure construction, ensure and improve the standard of living, enhance the public’s sense of happiness and social responsibility, and contribute to the collaborative advancement of the MES and the MHQD.
The original contributions presented in the study are included in the article/supplementary material. Further inquiries can be directed to the corresponding authors.
RN: Writing – review & editing, Writing – original draft, Software, Methodology, Investigation. HG: Writing – review and editing. YW: Writing – review and editing. YL: Writing – review and editing.
The author(s) declare financial support was received for the research, authorship, and/or publication of this article. This paper is supported by the Special Funds for Taishan Scholar Project [2023].
The authors declare that the research was conducted in the absence of any commercial or financial relationships that could be construed as a potential conflict of interest.
All claims expressed in this article are solely those of the authors and do not necessarily represent those of their affiliated organizations, or those of the publisher, the editors and the reviewers. Any product that may be evaluated in this article, or claim that may be made by its manufacturer, is not guaranteed or endorsed by the publisher.
Bennett N. J., Blythe J., White C. S., Campero C. (2021). Blue growth and blue justice: Ten risks and solutions for the ocean economy. Mar. Policy 125, 104387. doi: 10.1016/j.marpol.2020.104387
Bertrand M., Mullainathan S. (2003). Enjoying the quiet life? Corporate governance and managerial preferences. J. Polit. Econ. 111, 1043–1075. doi: 10.1086/376950
Bian D., Yang X., Xiang W., Sun B., Chen Y., Babuna P., et al. (2022). A new model to evaluate water resource spatial equilibrium based on the game theory coupling weight method and the coupling coordination degree. J. Clean. Prod. 366, 132907. doi: 10.1016/j.jclepro.2022.132907
Chemmanur T. J., Hu G., Huang J. (2010). The role of institutional investors in initial public offerings. Rev. Financ. Stud. 23, 4496–4540. doi: 10.1093/rfs/hhq109
Chen J., Li Z., Dong Y., Song M., Shahbaz M., Xie Q. (2020). Coupling coordination between carbon emissions and the eco-environment in China. J. Clean. Prod. 276, 123848. doi: 10.1016/j.jclepro.2020.123848
Chen M. H., Liu Y. X., Zhang X. M., Zhong C. Y. (2019). The measurement and trend evolution of the development level of the people’s livelihood in China’s urban agglomeration-an empirical study based on the urban DLI. China Soft Sci. 1, 45–61+81.
Cheng M., Li Q., Wen Z. (2023). Coupling coordination degree analysis and driving factors of innovation network and eco-efficiency in China. Environ. Impact Assess. Rev. 99, 107008. doi: 10.1016/j.eiar.2022.107008
Cheng K., Yao J., Ren Y. (2019). Evaluation of the coordinated development of regional water resource systems based on a dynamic coupling coordination model. Water Supply 19, 565–573. doi: 10.2166/ws.2018.102
Cheng J., Zhang X., Gao Q. (2023). Analysis of the spatio-temporal changes and driving factors of the marine economic–ecological–social coupling coordination: A case study of 11 coastal regions in China. Ecol. Indic. 153, 110392. doi: 10.1016/j.ecolind.2023.110392
CNR News. (2018). When Xi Jinping participated in the deliberation of the Shandong delegation at the first session of the 13th National People's Congress, he pointed out: "The ocean is a strategic location for high-quality development". Available online at: http://news.cnr.cn/native/gd/20180308/t20180308_524158141.html.
Dai L., Liu Y., Luo X. (2021). Integrating the MCR and DOI models to construct an ecological security network for the urban agglomeration around Poyang Lake, China. Sci. Total Environ. 754, 141868. doi: 10.1016/j.scitotenv.2020.141868
Di Q., Gao G., Yu Z. (2022). Evaluation and influencing factors of high-quality development of marine economy in China. Scientia Geographica Sin. 42, 650–661. doi: 10.13249/j.cnki.sgs.2022.04.010
Di Q., Yu Z., Xu L. (2019). Spatial-temporal coordination mode of marine economic development under the background of high quality growth: Based on the empirical study of prefecture-level cities in circum-Bohai Sea. Scientia Geographica Sin. 39, 1621–1630. doi: 2019 10.13249/j.cnki.sgs.2019.10.011
Du Y. W., Li X. X. (2022). Critical factor identification of marine ranching ecological security with hierarchical DEMATEL. Mar. Policy 138, 104982. doi: 10.1016/j.marpol.2022.104982
Ehlers P. (2016). Blue growth and ocean governance—how to balance the use and the protection of the seas. WMU J. Marit. Aff. 15, 187–203. doi: 10.1007/s13437-016-0104-x
European, C (2016). “European Commission, Blue Growth Opportunities for marine and maritime sustainable growth,” in Communication from the Commission to the European Parliament, the Council, the European Economic and Social Committee and the Committee of the Regions. Directorate-General for Maritime Affairs and Fisheries, vol. 494 final. (Publications Office of the European Union, COM, (2012) Luxembourg), 2012a.
European commission. (2021). Sustainable blue economy[EB/OL]. Available at: https://oceans-andfisheries.ec.europa.eu/ocean/blue-economy/sustainable-blue-economy_en.
Fernandes M. D. L., Sanz Larruga F. J., Alves F. L. (2022). Spatial characterization of marine socio-ecological systems: A Portuguese case study. J. Clean. Prod. 363, 132381. doi: 10.1016/j.jclepro.2022.132381
Geng B. J., Ji Q. S. (2021). Xi Jinping’s important discourse on ecological politics and its practice. Jiangsu Prov. Soc Sci. 1, 1-10+241. doi: 10.13858/j.cnki.cn32-1312/c.2021.01.023
Guo X. D., Li Y. F. (2014). Spatial differences and evolution characteristics of tourism economy and ecological environment coordinated development level in China. China Popul. ENVIRONMENT 24, 356–359.
Guo J., Yuan X., Song W. (2022). Driving forces on the development of China’s marine economy: Efficiency and spatial perspective. Ocean Coast. Manage. 224, 106192. doi: 10.1016/j.ocecoaman.2022.106192
Hayes A. C. (1990). Population quality and sustainable development in Indonesia: notes on a framework for the discussion of policy issues. Majalah Demografi Indonesia 34), 1–20.
Hussain S. S., Winrow-Giffin A., Moran D., Robinson L. A., Fofana A., Paramor O. A. L., et al. (2010). An ex ante ecological economic assessment of the benefits arising from marine protected areas designation in the UK. Ecol. Econ. 69, 828–838. doi: 10.1016/j.ecolecon.2009.10.007
Islam M. M., Shamsuddoha M. (2018). Coastal and marine conservation strategy for Bangladesh in the context of achieving blue growth and sustainable development goals (SDGs). Environ. Sci. Policy 87, 45–54. doi: 10.1016/j.envsci.2018.05.014
Ji J., Liu H., Yin X. (2023). Evaluation and regional differences analysis of the marine industry development level: The Case of China. Mar. Policy 148, 105445. doi: 10.1016/j.marpol.2022.105445
Ji J., Wang D. (2022). Regional differences, dynamic evolution, and driving factors of tourism development in Chinese coastal cities. Ocean Coast. Manage. 226, 106262. doi: 10.1016/j.ocecoaman.2022.106262
Jiao M., Yue W., Suo A., Zhang L., Li H., Xu P., et al. (2023). Construction and influencing factors of an early warning system for marine ranching ecological security: Experience from China’s coastal areas. J. Environ. Manage. 335, 117515. doi: 10.1016/j.jenvman.2023.117515
Jin D., Hoagland P., Morin Dalton T. (2003). Linking economic and ecological models for a marine ecosystem. Ecol. Econ. 46, 367–385. doi: 10.1016/j.ecolecon.2003.06.001
Li H., Gao Q., Wu F. (2017). Ecological environment response to marine economy development and the influence factors in Bohai Bay Rim Area. China population Resour. Environ. 27, 36–43.
Li X., He J., Yan H. (2022). Study on regional differentiation, distribution dynamics and influencing factors of marine economic development in three major marine economic circles of China. J. Nat. Resour. 37, 966. doi: 10.31497/zrzyxb.20220409
Li J. M., Jiang S. S. (2023). How can governance strategies be developed for marine ecological environment pollution caused by sea-using enterprises? A study based on evolutionary game theory. Ocean Coast. Manage. 232, 106447. doi: 10.1016/j.ocecoaman.2022.106447
Li J., Teng X. (2013). Study on the synergy effect and development trend of Tianjin marine and land industrial system—- take strategic emerging industries as the example. Sci. Technol. Prog. Policy 30, 39–44.
Lillebø A. I., Pita C., Garcia Rodrigues J., Ramos S., Villasante S. (2017). How can marine ecosystem services support the Blue Growth agenda? Mar. Policy 81, 132–142. doi: 10.1016/j.marpol.2017.03.008
Lin Y. (2020). Coupling analysis of marine ecology and economy: Case study of Shanghai, China. Ocean Coast. Manage. 195, 105278. doi: 10.1016/j.ocecoaman.2020.105278
Liu C., Cai W., Zhai M., Zhu G., Zhang C., Jiang Z. (2021). Decoupling of wastewater eco-environmental damage and China’s economic development. Sci. Total Environ. 789, 147980. doi: 10.1016/j.scitotenv.2021.147980
Liu Y. J., Meng Z. J. (2021). Study on the construction of marine ecological security index. Ecol. Econ. 37, 185–193,199.
Liu B., Xu M., Wang J., Xie S. (2017). Regional disparities in China’s marine economy. Mar. Policy 82, 1–7. doi: 10.1016/j.marpol.2017.04.015
Liu T., Zhou B. (2023). Evaluation and obstacle factors of high-quality development in coastal cities along the Yangtze River. Ocean Coast. Manage. 244, 106818. doi: 10.1016/j.ocecoaman.2023.106818
Liu P., Zhu B., Yang M. (2021). Has marine technology innovation promoted the high-quality development of the marine economy? ——Evidence from coastal regions in China. Ocean Coast. Manage. 209, 105695. doi: 10.1016/j.ocecoaman.2021.105695
Ma R., Ji S., Ma J., Shao Z., Zhu B., Ren L., et al. (2022). Exploring resource and environmental carrying capacity and suitability for use in marine spatial planning: A case study of Wenzhou, China. Ocean Coast. Manage. 226, 106258. doi: 10.1016/j.ocecoaman.2022.106258
Ma R., Luo H., Wang R. W. (2019). Study of evaluating high-quality economic development in Chinese Regions. China Soft Sci. 7, 60–67.
Martínez M. L., Intralawan A., Vázquez G., Pérez-Maqueo O., Sutton P., Landgrave R. (2007). The coasts of our world: Ecological, economic and social importance. Ecol. Econ. 63, 254–272. doi: 10.1016/j.ecolecon.2006.10.022
Masud M. M., Othman A., Akhtar R., Md S. (2021). The underlying drivers of sustainable management of natural resources: The case of marine protected areas (MPAs). Ocean Coast. Manage. 199, 105405. doi: 10.1016/j.ocecoaman.2020.105405
Pan X., Guo S. (2023). Dynamic decomposition and regional differences of urban emergy ecological footprint in the Yangtze River Delta. J. Environ. Manage. 326, 116698. doi: 10.1016/j.jenvman.2022.116698
Qian X. (2023). Research on the coordinated development model of marine ecological environment protection and economic sustainable development. J. Sea Res. 193, 102377. doi: 10.1016/j.seares.2023.102377
Ren W., Ji J. (2021). How do environmental regulation and technological innovation affect the sustainable development of marine economy: New evidence from China’s coastal provinces and cities. Mar. Policy 128, 104468. doi: 10.1016/j.marpol.2021.104468
Shen C., Zhang X., Li X. (2023). Revisiting the regional sustainable development from the perspective of multi-system factor flows–Evidence in the Yangtze River Delta of China. Heliyon 9, e18893. doi: 10.1016/j.heliyon.2023.e18893
Shujah-ur-Rahman, Chen S., Saleem N., Bari M. W. (2019). Financial development and its moderating role in environmental Kuznets curve: evidence from Pakistan. Environ. Sci. pollut. Res. 26, 19305–19319. doi: 10.1007/s11356-019-05290-z
Song J. (2021). Evaluation of the degree of coordination of the coupled population-economy-environment system in the Yellow River Basin. Stat Decision 37, 185–188. doi: 10.13546/j.cnki.tjyjc.2021.04.040
Sun Y., Cheng Y., Liu N. (2021). Spatiotemporal evolution of China’s high quality economic development and its driving mechanism of scientific and technological innovation. Resour. Sci. 43, 82–93. doi: 10.18402/resci.2021.01.07
Sun X., Zhang L., Lu S.-Y., Tan X.-Y., Chen K.-L., Zhao S.-Q., et al. (2020). A new model for evaluating sustainable utilization of coastline integrating economic output and ecological impact: A case study of coastal areas in Beibu Gulf, China. J. Clean. Prod. 271, 122423. doi: 10.1016/j.jclepro.2020.122423
Tang Y., Wang M., Liu Q., Hu Z., Zhang J., Shi T., et al. (2022). Ecological carrying capacity and sustainability assessment for coastal zones: A novel framework based on spatial scene and three-dimensional ecological footprint model. Ecol. Model. 466, 109881. doi: 10.1016/j.ecolmodel.2022.109881
Tsaur S.-H., Lin Y.-C., Lin J.-H. (2006). Evaluating ecotourism sustainability from the integrated perspective of resource, community and tourism. Tour. Manage. 27, 640–653. doi: 10.1016/j.tourman.2005.02.006
United Nations Environmental Program (UNEP). (2015). Blue Economy: Sharing Success Stories to Inspire Change, UNEP Regional Seas Report and Studies N°, Vol. 195.
Venkadavarahan M., Joji M. S., Marisamynathan S. (2023). Development of spatial econometric models for estimating the bicycle sharing trip activity. Sustain. Cities Soc 98, 104861. doi: 10.1016/j.scs.2023.104861
Wang S. K. (2013). Type and selection of weight matrix in spatial econometric model. J. Quant. Econ. 30, 57–63.
Wang S., Chen S., Zhang H., Song M. (2021a). The model of early warning for China’s marine ecology-economy symbiosis security. Mar. Policy 128, 104476. doi: 10.1016/j.marpol.2021.104476
Wang S., Li W., Xing L. (2022). A review on marine economics and management: how to exploit the ocean well. Water 14, 2626. doi: 10.3390/w14172626
Wang C., Lin A., Liu C. (2023). Marine ecological security assessment from the perspective of emergy ecological footprint. Front. Mar. Sci. 9. doi: 10.3389/fmars.2022.1090965
Wang Z., Lu H., Han Z. (2018). An analysis of the spatial and temporal differentiation and driving factors of the marine resource curse in China. Ocean Coast. Manage. 155, 60–67. doi: 10.1016/j.ocecoaman.2018.01.015
Wang S., Lu B., Yin K. (2021b). Financial development, productivity, and high-quality development of the marine economy. Mar. Policy 130, 104553. doi: 10.1016/j.marpol.2021.104553
Wang C., Wan G. H., Zhang X. (2019). Regional inequality and structural change: China 1978~2016. Manag World 35, 11–26+194.
Wang Q., Zhao L., Yu W. (2020). Spatial-temporal evolution characteristics and influencing factors of resilience of tourism economics system in China. Geogr. Geo-Inf. Sci. 36, 113–118. doi: 10.3969/j.issn.1672-0504.2020.06.017
Wu F., Cui F., Liu T. (2023). The influence of environmental regulation on high-quality development of marine economy from different subjects’ perspectives. Front. Mar. Sci. 10. doi: 10.3389/fmars.2023.1107666
Xu C., Feng Z., Meng Z. (2016). Affective experience modeling based on interactive synergetic dependence in big data. Future Gener. Comput. Syst. 54, 507–517. doi: 10.1016/j.future.2015.02.008
Yan J., Xue Y., Wu H., Li D., Mohsin M. (2023). Evaluation of sustainable development of the Bohai Sea Rim based on integrated land–sea management: a multi-system coupling and coordination study at coastal, provincial, and city level. Front. Mar. Sci. 10. doi: 10.3389/fmars.2023.1235783
Yu Z., Di Q. (2020). The coordination between maritime economies and marine carrying capacity and their spatiotemporal evolution in the cities of the bohai rim in China. Ecol. Model. 438, 109192. doi: 10.1016/j.ecolmodel.2020.109192
Yu G. Y., Xiu C. L. (2018). Impacts and spillover effects of urbanization on haze pollution in Liaoning Province. Econ. Geogr. 38, 100–108, 122–122. doi: 10.15957/j.cnki.jjdl.2018.04.012
Yu W., Zhang P., Ji Z. H. (2021). Study on regional difference, distribution dynamics and convergence of eco-efficiency of urban clusters in China. J. Quant. Tech. Econ. 01, 23–42.
Zameer H., Yasmeen H., Wang R., Tao J., Malik M. N. (2020). An empirical investigation of the coordinated development of natural resources, financial development and ecological efficiency in China. Resour. Policy 65, 101580. doi: 10.1016/j.resourpol.2020.101580
Zhang C., Quan Y., Zhong H. (2019). The building of marine ecological civilization and sustainable development: conference report. Mar. Policy 110, 103627. doi: 10.1016/j.marpol.2019.103627
Zhang H., Shao Y., Han X., Chang H. L. (2022). A road towards ecological development in China: The nexus between green investment, natural resources, green technology innovation, and economic growth. Resour. Policy 77, 102746. doi: 10.1016/j.resourpol.2022.102746
Zhang X., Sun D., Zhang X. F., Yang H. (2021b). Regional ecological efficiency and future sustainable development of marine ranch in China: An empirical research using DEA and system dynamics. Aquaculture 534, 736339. doi: 10.1016/j.aquaculture.2021.736339
Zhang L. N., Xu J., Pang Q. H. (2021a). Spatio-temporal differences and dynamic evolution of the adapt abilities between water resources and advanced industrial structure. J. Nat. Resour. 36, 2113–2124. doi: 10.31497/zrzyxb.20210815
Zhao J., Liu Y., Zhu Y., Qin S., Wang Y., Miao C. (2020). Spatiotemporal differentiation and influencing factors of the coupling and coordinated development of new urbanization and ecological environment in the Yellow River Basin. Resour. Sci. 42, 159–171. doi: 10.18402/resci.2020.01.16
Zhao P., Lu Z., Kou J., Du J. (2023). Regional differences and convergence of green innovation efficiency in China. J. Environ. Manage. 325, 116618. doi: 10.1016/j.jenvman.2022.116618
Zhou Y., Li G., Zhou S., Hu D., Zhang S., Kong L. (2023). Spatio-temporal differences and convergence analysis of green development efficiency of marine economy in China. Ocean Coast. Manage. 238, 106560. doi: 10.1016/j.ocecoaman.2023.106560
Keywords: three major marine economic circles, high-quality economic development and ecological security, synergistic development, regional differences, driving factors
Citation: Ni R, Guan H, Wang Y and Liu Y (2024) Spatial differences, distribution dynamics and driving factors of the synergy between marine ecological security and high-quality development in three major marine economic circles of China. Front. Mar. Sci. 11:1338154. doi: 10.3389/fmars.2024.1338154
Received: 14 November 2023; Accepted: 22 February 2024;
Published: 07 March 2024.
Edited by:
Andrés M. Cisneros-Montemayor, Simon Fraser University, CanadaReviewed by:
Yi-Che Shih, National Cheng Kung University, TaiwanCopyright © 2024 Ni, Guan, Wang and Liu. This is an open-access article distributed under the terms of the Creative Commons Attribution License (CC BY). The use, distribution or reproduction in other forums is permitted, provided the original author(s) and the copyright owner(s) are credited and that the original publication in this journal is cited, in accordance with accepted academic practice. No use, distribution or reproduction is permitted which does not comply with these terms.
*Correspondence: Yilin Liu, aGt5bHlsQDEyNi5jb20=; Hongjun Guan, amp4eWdoakAxMjYuY29t
Disclaimer: All claims expressed in this article are solely those of the authors and do not necessarily represent those of their affiliated organizations, or those of the publisher, the editors and the reviewers. Any product that may be evaluated in this article or claim that may be made by its manufacturer is not guaranteed or endorsed by the publisher.
Research integrity at Frontiers
Learn more about the work of our research integrity team to safeguard the quality of each article we publish.