 Jie Feng
- 1The Key Laboratory of Mariculture, Ministry of Education, Fisheries College, Ocean University of China, Qingdao, China
- 2Marine Fishery Technology Guiding Office of Ganyu, Lianyungang, China
Swimming crab (Portunus trituberculatus) are an important aquaculture species in eastern coastal areas of China. To improve the understanding of P. trituberculatus culture ecosystem functioning, the dynamics of energy flow and trophic structure of a P. trituberculatus polyculture system (co-culture with white shrimp Litopenaeus vannamei and short-necked clam Ruditapes philippinarum) were investigated in this study. Three Ecopath models representing the early, middle, and late culture periods of a P. trituberculatus polyculture ecosystem, respectively, were constructed to compare ecosystem traits at different culture periods. The results demonstrated that detritus was the main energy source in this polyculture ecosystem, and most of the total system throughput occurred at trophic levels I and II. Artificial food input and consumption by the culture organisms increased from early to middle and late periods, which produced marked impacts on biomass structure and primary production. R. philippinarum was considered to have a dominant influence on phytoplankton community dynamics which changed from nano- to pico-phytoplankton predominance, from the middle to the late period. Considering the low utilization efficiency of pico-phytoplankton production, large amounts of detritus accumulated in the sediment in the late period, which may constitute a potential risk for the ecosystem. Ecological network analyses indicated that the total energy flow and level of system organization increased from the early to the middle and late periods, whereas food web complexity and system resilience decreased from early to middle and late periods, which may indicate a trend of decreasing ecosystem stability. The system may be further optimized by increased stocking density of R. philippinarum and by introducing macro-algae at a suitable biomass to increase ecosystem stability, energy utilization efficiency, and aquaculture production.
1 Introduction
Most of the world’s fishing areas have reached their maximal potential for capture fishery production, while demand for seafood worldwide is steadily increasing (Pauly et al., 2002; FAO, 2014). Global production from aquaculture has been increasing steadily over the past decade (Soto-Zarazúa et al., 2014), and the constantly increasing demand for seafood can only be met by aquaculturing (Troell et al., 2003). However, potential increase in aquaculture production is limited by environmental challenges and resource constraints (Klinger and Naylor, 2012; FAO, 2020). Integrated multi-trophic aquaculture, which involves the cultivation of fed species (e.g., finfish or shrimps fed sustainable commercial diets) with extractive species (e.g., suspension-and deposit-feeders, or seaweeds or other aquatic vegetation), is considered an effective solution to meet the demands of aquaculture production and achieve sustainable aquaculture development (Chopin et al., 2001; Abreu et al., 2011; Dong et al., 2022).
The swimming crab Portunus trituberculatus is an important marine-culture species in China (Song et al., 2006), with a production of 100,895 tons in 2020 [FDAMC (Fisheries Department of Agriculture Ministry of China), 2021]. This species was typically cultured in ponds by small-holders or family farms in eastern coastal areas of China. Polyculture of P. trituberculatus, with shrimp (e. g. white shrimp Litopenaeus vannamei) and clam (e. g. short-necked clam Ruditapes philippinarum) in ponds is considered effective integrated multi-trophic aquaculture of this species (Zhang et al., 2016). P. trituberculatus consume large particles of food input (e.g., residue of imported fish and shellfish), and considerable amounts of small particles are not consumed; however, such small particles are a good food source for shrimps. Moreover, clams in polyculture systems inhabit the bottom of ponds and feed on phytoplankton and detritus (Xu et al., 1987; Zhang et al., 2016). Polyculture of these three organisms at suitable farming densities may thus constitute an effective use of food and space resources in P. trituberculatus polyculture pond systems.Aquaculture ponds are simple yet fragile ecosystems (Zhai, 2012; Feng et al., 2017), and system stability is susceptible to organic pollution, eutrophication, and emergence of diseases (Cai, 2006). Culture management and associated technologies (e.g., water and sediment quality regulation, feed management, and co-cultured species) are important for avoiding such threats, however, high-level culture management depends on a profound understanding of the respective aquaculture ecosystem. Various aspects of the P. trituberculatus pond ecosystem during the whole culture period have been investigated, including variations in biomass structure of phytoplankton (Mao et al., 2013), zooplankton (Mao et al., 2014), microbial communities (Zhang et al., 2015), variations in size-fractioned chlorophyll a concentration (Sun et al., 2012), and water quality (Zhang et al., 2015; Ban et al., 2015). Most of these studies concentrated on individual processes, which helped understand the P. trituberculatus pond ecosystems at population level. However, as ecosystems comprise numerous interacting factors, examination of any such factor in isolation cannot comprehensively explain ecosystem functioning (Likens, 1985; Allen, 1988; Patrício and Marques, 2006). The food web in a P. trituberculatus polyculture pond ecosystem was reconstructed in a previous study (Feng et al., 2018b), and energy flow and trophic structures of different P. trituberculatus pond culture ecosystems at ecosystem level were previously analyzed (Feng et al., 2017, Feng et al., 2018a). These studies improved our understanding of the structural and functional characteristics of P. trituberculatus pond culture ecosystems. However, the temporal dynamics of energy fluxes and trophic structures of P. trituberculatus pond ecosystems throughout the culture period remained unclear. This may hamper efforts to determine the impact of P. trituberculatus culture activities on pond ecosystems, and this lack precludes science-based management of P. trituberculatus pond culturing at ecosystem level.
Here, Ecopath modeling in combination with ecological network analyses was used to investigate temporal dynamics of energy fluxes and the trophic structure of a P. trituberculatus polyculture pond ecosystem. Ecopath is a mass-balanced ecosystem model, which presents a “snapshot” of the trophic flows between species in an ecosystem (Christensen et al., 2005). Ecological network analysis is a useful and efficient tool for quantifying the condition of an ecosystem, and to systematically analyze each defined ecosystem period (Dubois et al., 2012; Akoglu et al., 2014; Tecchio et al., 2015). The Ecopath model can be used in combination with ecological network analysis to analyze energy flow and trophic structures of aquaculture ecosystems (Ulanowicz, 2004; Zhou et al., 2015; Kluger et al., 2016b; Feng et al., 2017; Aubin et al., 2021; Dong et al., 2021a; Mayekar et al., 2022). Ecopath models also facilitate comparisons between different aquaculture ecosystems or within an ecosystem during different periods (Christensen and Pauly, 1992a; Días López et al., 2008; Feng et al., 2018a). In addition, this model was used to evaluate the carrying capacity of cultured species in aquaculture ecosystems (Jiang and Gibbs, 2005; Byron et al., 2011a; Byron et al., 2011b; Xu et al., 2011; Kluger et al., 2016a; Dong et al., 2021b). In this study, we used Ecopath to model energy flow in a P. trituberculatus polyculture pond ecosystem (co-cultured species included L. vannamei and R. philippinarum) during various culture periods (early, middle, and late). The produced insights may improve our understanding of temporal dynamics of biomass structure and system functioning in P. trituberculatus polyculture ecosystems.
2 Material and Methods
2.1 Pond and Enclosures
The P. trituberculatus polyculture experiment was conducted using the land-based experimental enclosures in a pond. Enclosure is an efficient tool to investigate aquatic ecosystem, which establishes a relatively closed ecosystem by enclosing the water body, and there is no water exchange with the surrounding water (Sun et al., 2011). Land-based enclosure in this study means the enclosure built on the bottom of the pond to simulate pond ecosystem (Li et al., 1998a), which was different from the floating enclosure (Li et al., 1993). The experimental pond located in Ganyu County, Jiangsu Province, China (34°58′17.30″ N, 119°11′53.70″ E), covered 2 ha, with a water column depth of 1.6–1.7 m at the study site. Four land-based enclosures, representing four replicates of the same size (length × width × depth = 5 × 5 × 2 m), were constructed in the pond, which were lined with polyethylene (water-proof) and supported with wood poles. The structure of the enclosures was previously described in detail (Wang et al., 1998; Tian et al., 2001). At the bottom of the enclosure, the walls were covered with mud from the same pond, and supported by posts at 2.5-m intervals. An aeration system consisting of a blower, PVC tubes, gas tubes, and air stones was used for aeration and water circulation. Five air stones connected by a gas tube were suspended approximately 20 cm from the bottom in each enclosure. The land-based enclosure can satisfactorily simulate a pond and be suitably used for aquacultural and ecological experiments (Li et al., 1998). The entire experiment was carried out for 90 days from July 13 to October 13, 2014. Detailed descriptions of the enclosure are provided in the Supplementary Material(part 1. Location and layout of the experiment).
2.2 Cultured Animals and Aquaculture Management
Juvenile swimming crabs (P. trituberculatus) were cultured with white shrimp L. vannamei and short-necked clam R. philippinarum in the four enclosures in the pond. All animals were purchased from Ganyu Jiaxin Aquatic Food Co., Ltd. (Ganyu, Jiangsu, China). The stocking densities of swimming crabs, white shrimps, and short-necked clams used in the four enclosures were 6 individuals/m2, 45 individuals/m2, and 30 individuals/m2, respectively. Swimming crabs, white shrimps, and short-necked clams were stocked with an initial individual wet weight of 0.58 ± 0.10 g, 0.05 ± 0.01 g, and 0.91 ± 0.10 g, respectively.
Crabs cultured in the four enclosures were fed with chilled blue clam (Aloidis laevis) twice per day (06:00 and 18:00). The amounts of A. laevis supplied to the crabs were adjusted according to Zhou et al. (2010). Shrimps were fed a commercial pellet diet (Lianyungang Chia Tai Feed Co., Ltd., Lianyungang, Jiangsu, China), the amount of which was determined according to the product specifications. To assess growth and health condition of crabs and shrimps, 15–20 individuals per enclosure were sampled every ten days using a cage net (0.60 × 0.40 × 0.15 m) designed to trap crabs and shrimps in each enclosure; individuals were returned to the enclosure when sampling was completed.
2.3 Model Construction
The early, middle, and late periods of P. trituberculatus polyculturing were at 0–30, 31–60, and 61–90 d of the 90-d culture period, respectively. Three mass-balanced Ecopath models representing early, middle, and late culture periods of the P. trituberculatus polyculture ecosystem were constructed.
Ecopath models were constructed according to two master equations (Christensen and Pauly, 1992a; Christensen and Pauly, 1992b). The first equation represents the production of each functional group utilized in the ecosystem. Production is divided into predation, migration, biomass accumulation, exports, and other mortality, and is expressed as follows (Christensen et al., 2005):
where Bi represents prey biomass (i), Bj represents predator biomass (j), (P/B)i represents the ratio of production to prey biomass (i), EEi is ecotrophic efficiency, Yi is catch biomass, (Q/B)j is the ratio of food consumption to predator biomass (j), DCij is the ratio of biomass (i) being consumed by (j) to the total consumption of (j), BAi is the prey biomass accumulation rate (i), and Ei is the difference between immigration and emigration of prey (i).
The second equation describes the consumption of a consumer group which is constituted by production, respiration, and unassimilated food:
where Ri is respiration and Ui is food which cannot be assimilated by consumers. The Ecopath model requires that at least three of the four parameters B, P/B, Q/B and EE are imported for each functional group. Because EE is difficult to obtain for each functional group, the EE value is typically estimated through the input of the other three parameters. Detailed descriptions of limitations, applicability, and methods of this model were published previously (Christensen and Walters, 2004).
We choose to simulate the dynamics of the polyculture ecosystem by constructing Ecopath steady-state models, rather than using dynamic simulation models such as an Ecosim model (Christensen et al., 2005). This is because aquaculture pond ecosystems are vulnerable to external disturbances such as weather changes. External disturbances may prevent Ecosims from accurate and comprehensive simulation of dynamic processes. With Ecopath, most of the model inputs can be obtained by field experiments directly. The modeled results may thus be more reliable than those of Ecosim models.
2.3.1 Functional Groups
According to the definition of the functional group and setting principles of the Ecopath model, 17 functional groups were used in the three Ecopath models. Phytoplankton was divided into three groups: pico-phytoplankton (< 10 µm), nano-phytoplankton (10–38 µm), and micro-phytoplankton (> 38 µm). Zooplankton were divided into macrozooplankton (copepods and planktonic mollusks, > 150 µm) and microzooplankton (copepodites and rotifers,< 150 µm). The zoobenthos was divided into macrobenthos (polychetes, > 500 µm) and microbenthos (polychetes and nematodes,< 500 µm). Bacteria were divided into benthic bacteria and bacterioplankton. Detritus was divided into detritus in sediment and detritus in water. The imported artificial food of A. laevis and shrimp feed were also set as the functional group, both were categorized as detritus groups. The other functional groups included P. trituberculatus, L. vannamei, R. philippinarum, and periphyton (Table 1).
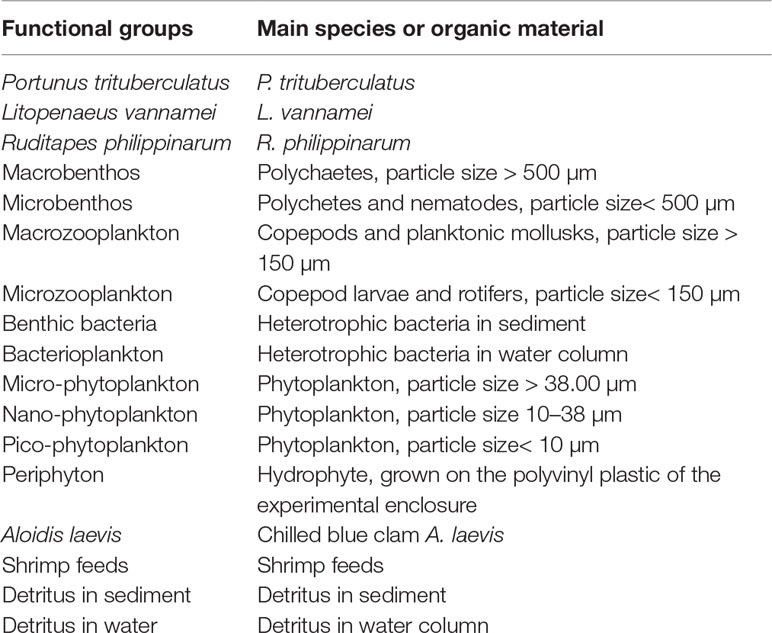
Table 1 Functional groups and main species included in models of polyculture ecosystem.
2.3.2 Field Data
During the experiment, data on parameters for the models were determined and collected. Input data for each model were the average values of sampling results collected during each culture period. These data were collected as follows:
The input data of biomass, P/B ratio, Q/B ratio, and diet composition of each group were estimated using data derived from field experiments and literature (Table 2). The biomass of each functional group, expressed as kJ m-2. The energy content of P. trituberculatus, L. vannamei, R. philippinarum, periphyton, macrobenthos, shrimp feed, blue clam A. laevis, and detritus of sediment were measured by an oxygen bomb calorimeter (PARR-1281, America). The energy content of microbenthos, micro-, nano-, and pico- phytoplankton, macro- and micro- zooplankton, bacterioplankton, benthic bacteria, and detritus in water were determined by measuring the organic carbon content first, then converted to energy content. The relation between organic carbon (g) and energy (kJ) was obtained from Salonen et al. (1976) (1g C = 46 kJ).
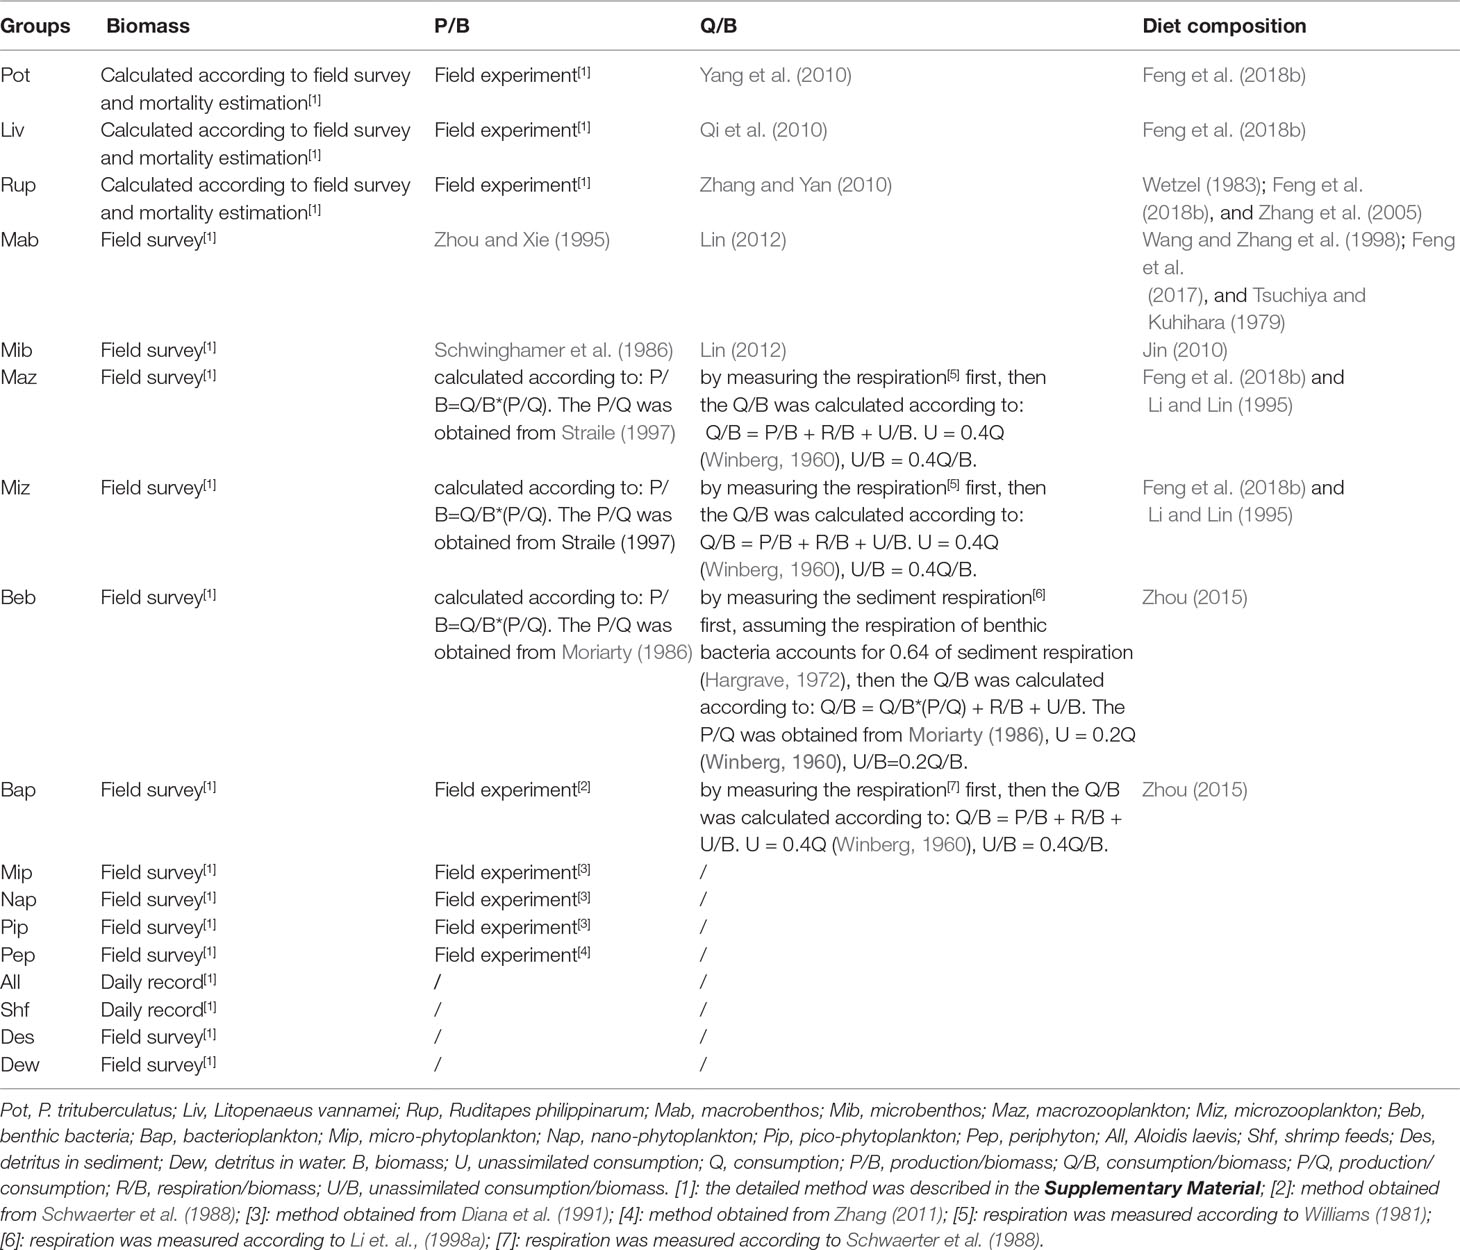
Table 2 Data sources of B, P/B, Q/B, and diet composition of each group in the Portunus trituberculatus polyculture ecosystem.
The unassimilated ratio of consumption of macrozooplankton, and microzooplankton were set at 0.40 (Winberg, 1960), those of macrobenthos and microbenthos were set at 0.4 and 0.30, respectively (Bradford-Grieve et al., 2003), and all other consumers were set at 0.20 (Winberg, 1960). Biomass accumulation of P. trituberculatus, L. vannamei, and R. philippinarum were obtained through field experiments. The detritus input of artificial feeds of shrimp feed and blue clam A. laevis were recorded every day by the pond manager.Detritus fate: according to Heymans et al. (2016), if more than one detritus group is defined, the detritus fate must be described in the model. In this study, it was set that the production, which was not used by the ecosystem (energy of flow to detritus) from the groups of P. trituberculatus, R. philippinarum, macrobenthos, microbenthos, benthic bacteria, A. laevis, and shrimp feed flowed into the detritus group of detritus in sediment; energy from detritus of the groups of macrozooplankton, microzooplankton, bacterioplankton, micro-phytoplankton, nano-phytoplankton, pico-phytoplankton, and periphyton flowed into the detritus group of detritus in water. Moreover, half of the energy of flow to detritus from the group of L. vannamei was set to flow into the detritus groups of detritus in sediment and detritus in water, respectively. The energy of detritus in water, which was not used by recycling, ultimately flowed to detritus in the sediment. This assumption was implemented because our field observations showed almost no biomass accumulation for detritus in water at the end of the experiment in the four ecosystems.
The methods of obtaining data of biomass, P/B ratios, Q/B ratios, unassimilated consumption rates, biomass accumulation, and detritus imports of the related functional groups are described in detail in the Supplementary Material (part 2. Input data of B, P/B, Q/B, unassimilated consumption rate, biomass accumulation, detritus import, and detritus fate); the diet matrix of the polyculture ecosystem in the early, middle, and late periods is also provided in theSupplementary Material (part 3. Diet composition).
2.3.3 Model Balancing and Uncertainties
We used EE values< 1 as the first criterion to balance the model; EE values > 1 indicated that the consumed biomass was larger than the produced biomass. Where this occurred, we modified the diet composition of each consumer group, which was expressed as a proportion; such changes in diet proportions never exceeded 0.05. This method was chosen because the diet composition of each consumer was the input data, which was associated with high uncertainty. Some other criteria were also considered, including that the respiration:assimilation ratios should be< 1, and the ratio of respiration:biomass should be higher for mobile consumer groups than for sedentary consumer groups. Moreover, we also ensured that the P/Q values of most of the functional groups were in the range of 0.10–0.30 (Christensen et al., 2005).
2.3.4 Ecological Network Analysis Indicators
Ecological network analysis is a system-oriented method for analyses of within-system interactions used for identifying holistic properties of ecosystems (Fath et al., 2007), which is considered an effective tool for assessing the attributes of system structure and function and to compare ecosystems. Ecopath models use a series of ecological network analysis indicators to assess ecosystem attributes (Christensen et al., 2005). Holistic ecological network analysis indices typically include total system throughput (TST), EE, Finn’s cycling index (FCI), Finn’s mean path length (FML), connectance index (CI), system omnivory index (SOI), average mutual information (AMI), flow diversity (H), relative ascendancy(A/C), etc. (Heymans et al., 2007).
TST is the sum of all flows in an ecosystem. It is estimated as the sum of four flow components: total consumption, total export, total respiration, and total flows to detritus. This index represents the size of the entire ecosystem in terms of flow (Ulanowicz, 1986). The EE value is calculated as the part of production that is used within or exported out of the system. Transfer efficiency is calculated as the ratio between the sum of exports from a given trophic level (TL) plus the flow that is transferred from one TL to the next and the throughput on the TL (Christensen et al., 2005). The FCI is the fraction of an ecosystem’s throughput that is recycled. FML represents the average number of compartments that a unit of energy passes through from its entry into the ecosystem until its leave (Christensen et al., 2005). The CI is the ratio of the number of actual links between functional groups to the number of theoretically possible links. The SOI is defined as the average omnivory index of all consumers weighted by the logarithm of each consumer’s food intake, which measures the diversity of consumer–prey relationships in an ecosystem (Christensen et al., 2005).AMI, H, ascendancy, total development capacity (C), and overhead (O) are indicators built on the foundation of information-theory concepts in ecological networks (Ulanowicz, 1986). H measures both the number of interactions and the evenness of flows in the food web, and the AMI measures the degree of specialization of flows in the food web (Ulanowicz, 1986). Ascendancy is a measure of the average mutual information in an ecosystem, scaled by TST (Ulanowicz and Norden, 1990) (ascendancy (A) = AMI × TST). C measures the potential for a system to develop and is the natural upper limit of ascendancy (C = H × TST) (Ulanowicz, 1986). O measures the uncertainty of energy flow of the network (Ulanowicz and Norden, 1990), and represents the unorganized part of C in an ecosystem (Bodini and Bondavalli, 2002) (O = C-A). The ascendency, O, and C can be split into contributions from imports, internal flow, exports and respiration. The relative overhead (O/C) is calculated as O to C. The A/C is calculated as ascendancy to C. A/C is the fraction of a potential food-web organization that is actually realized, and the O/C is the fraction of a potential food-web organization that is not realized (Ulanowicz, 1986).
3 Results
3.1 Parameters of Each Group of the Three Models
The basic input data and the estimated EE values of the three models are presented in Tables 3–5. The biomass of P. trituberculatus, L. vannamei, R. philippinarum, and benthic bacteria increased from the early to the middle and late period, while macro- and micro-benthos biomass showed a decreasing trend over these periods. The biomass of macro- and micro-zooplankton, bacterioplankton, and micro- and nano-phytoplankton increased from the early to the middle period, and then decreased from the middle to the late period. The biomass of pico-phytoplankton showed a marked increase from the middle to the late period. The groups of microbenthos and benthic bacteria had the lowest EE values in models of all three periods owing to the lack of consumers. The EE values of these two groups were all< 0.10. The periphyton also had low EE values in models of the early, middle, and late periods, with the values of 0.12, 0.11, and 0.04, respectively. Moreover, the EE value of pico-phytoplankton was also low in the model of the late period (0.24). The groups of P. trituberculatus, L. vannamei and R. philippinarum all had high EE values in the three models, and the EE values were higher than 0.90 in models of the middle and late period. The groups of blue clam A. laevis and shrimp feed also had high EE values (> 0.80, each) in models of all three periods. The detritus in sediment had high EE values in the early and middle periods (0.95 and 0.99, respectively). Other groups including microzooplankton and bacterioplankton had high EE values in the model of the late period (0.86 and 0.85, respectively).
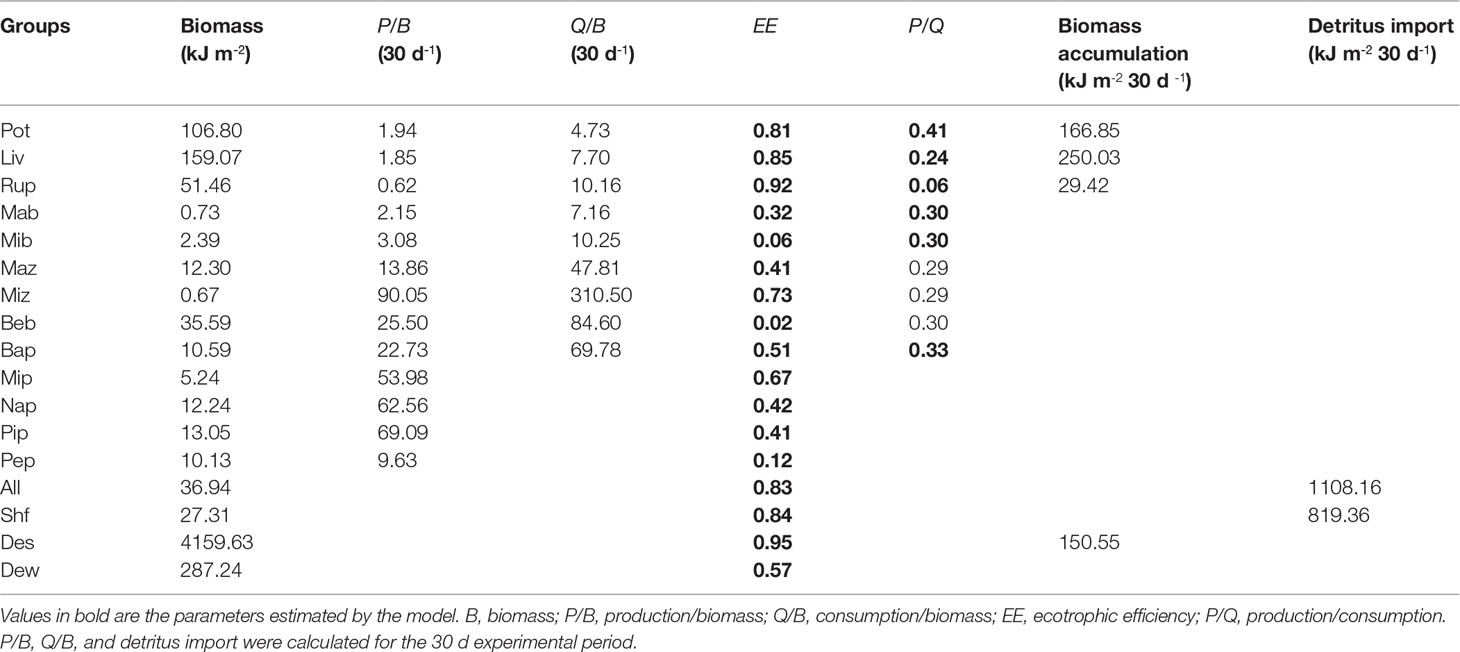
Table 3 Ecopath inputs and outputs for aPortunus trituberculatus polyculture ecosystem model during the early period.
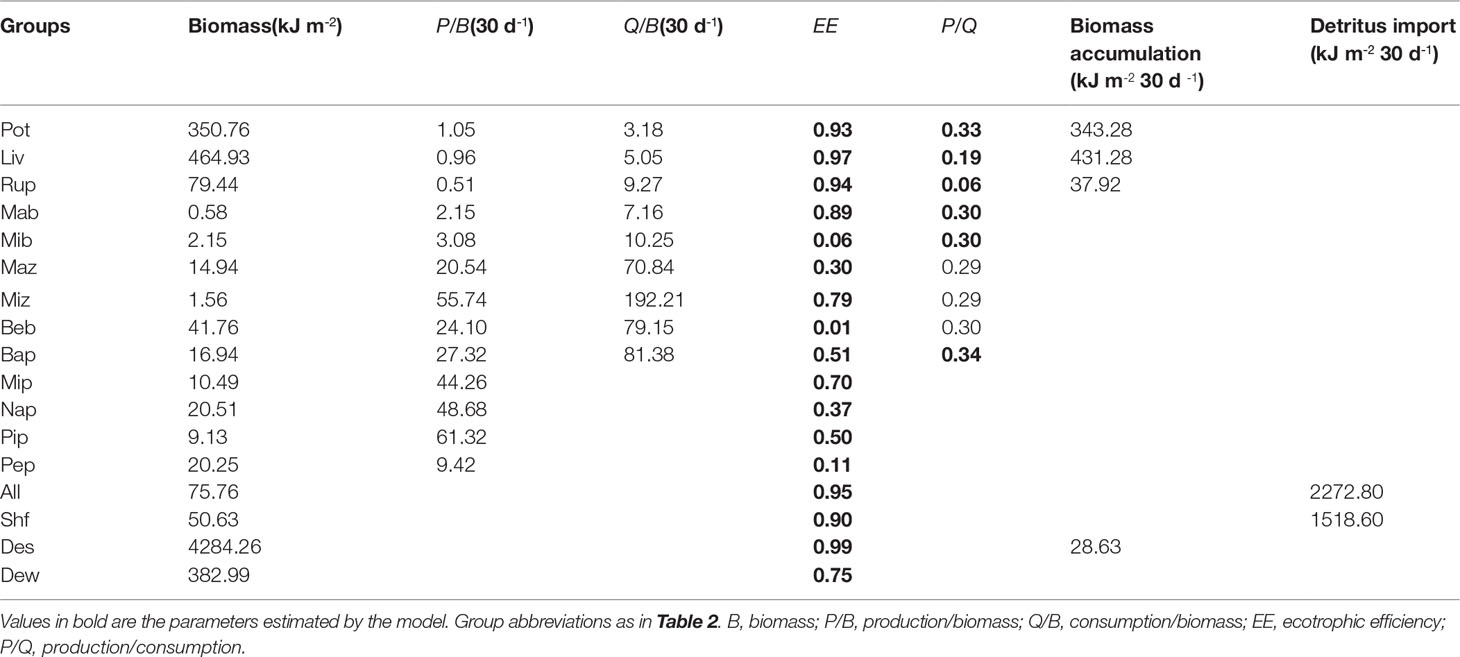
Table 4 Ecopath inputs and outputs for a Portunus trituberculatus polyculture ecosystem model during the middle period.
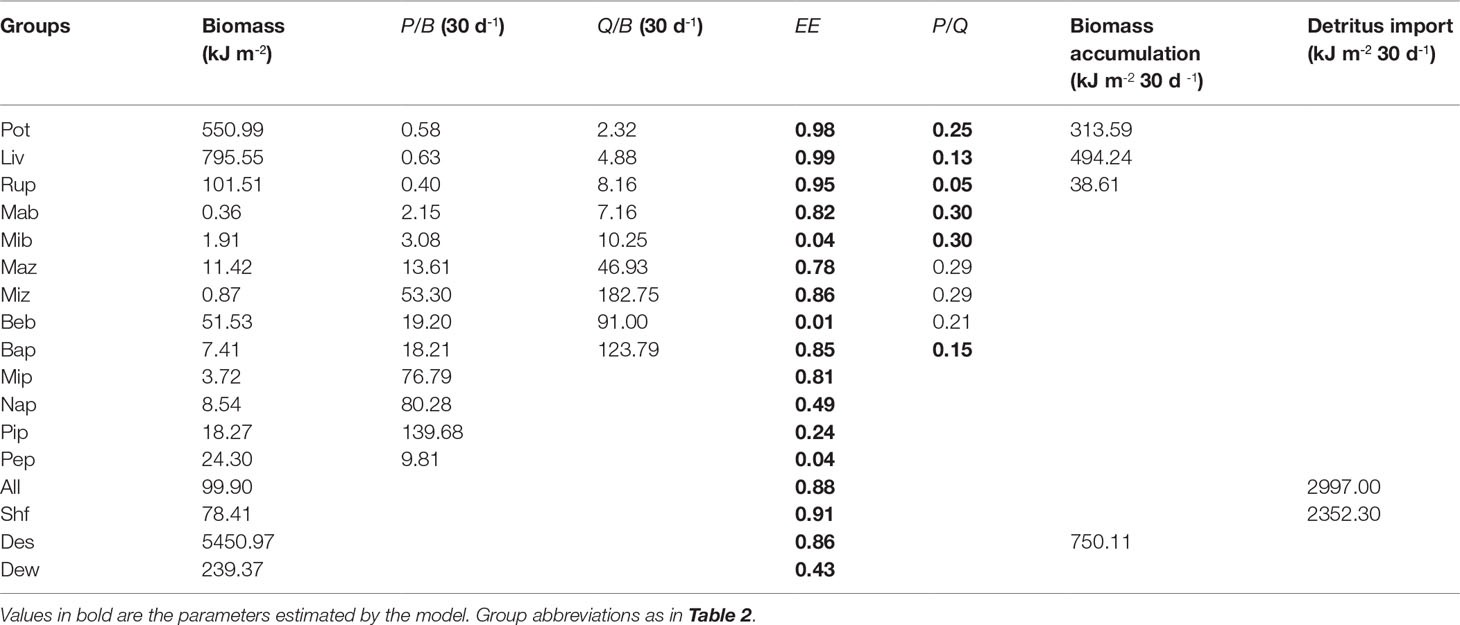
Table 5 Ecopath inputs and outputs for a Portunus trituberculatus polyculture ecosystem model during the late period.
Consumption by various groups in models of the three periods is presented in Figure 1. The total consumption increased from the early to the middle and late period. Benthic bacteria were the dominant consumers in all three culture periods, followed by L. vannamei. Bacterioplankton and macrozooplankton had the third and fourth largest consumption, respectively, in the early period, whereas bacterioplankton and P. trituberculatus had the third- and fourth-largest consumption, respectively, in both middle and late periods. Macrobenthos had the least consumption in all three culture periods, followed by microbenthos and microzooplankton.
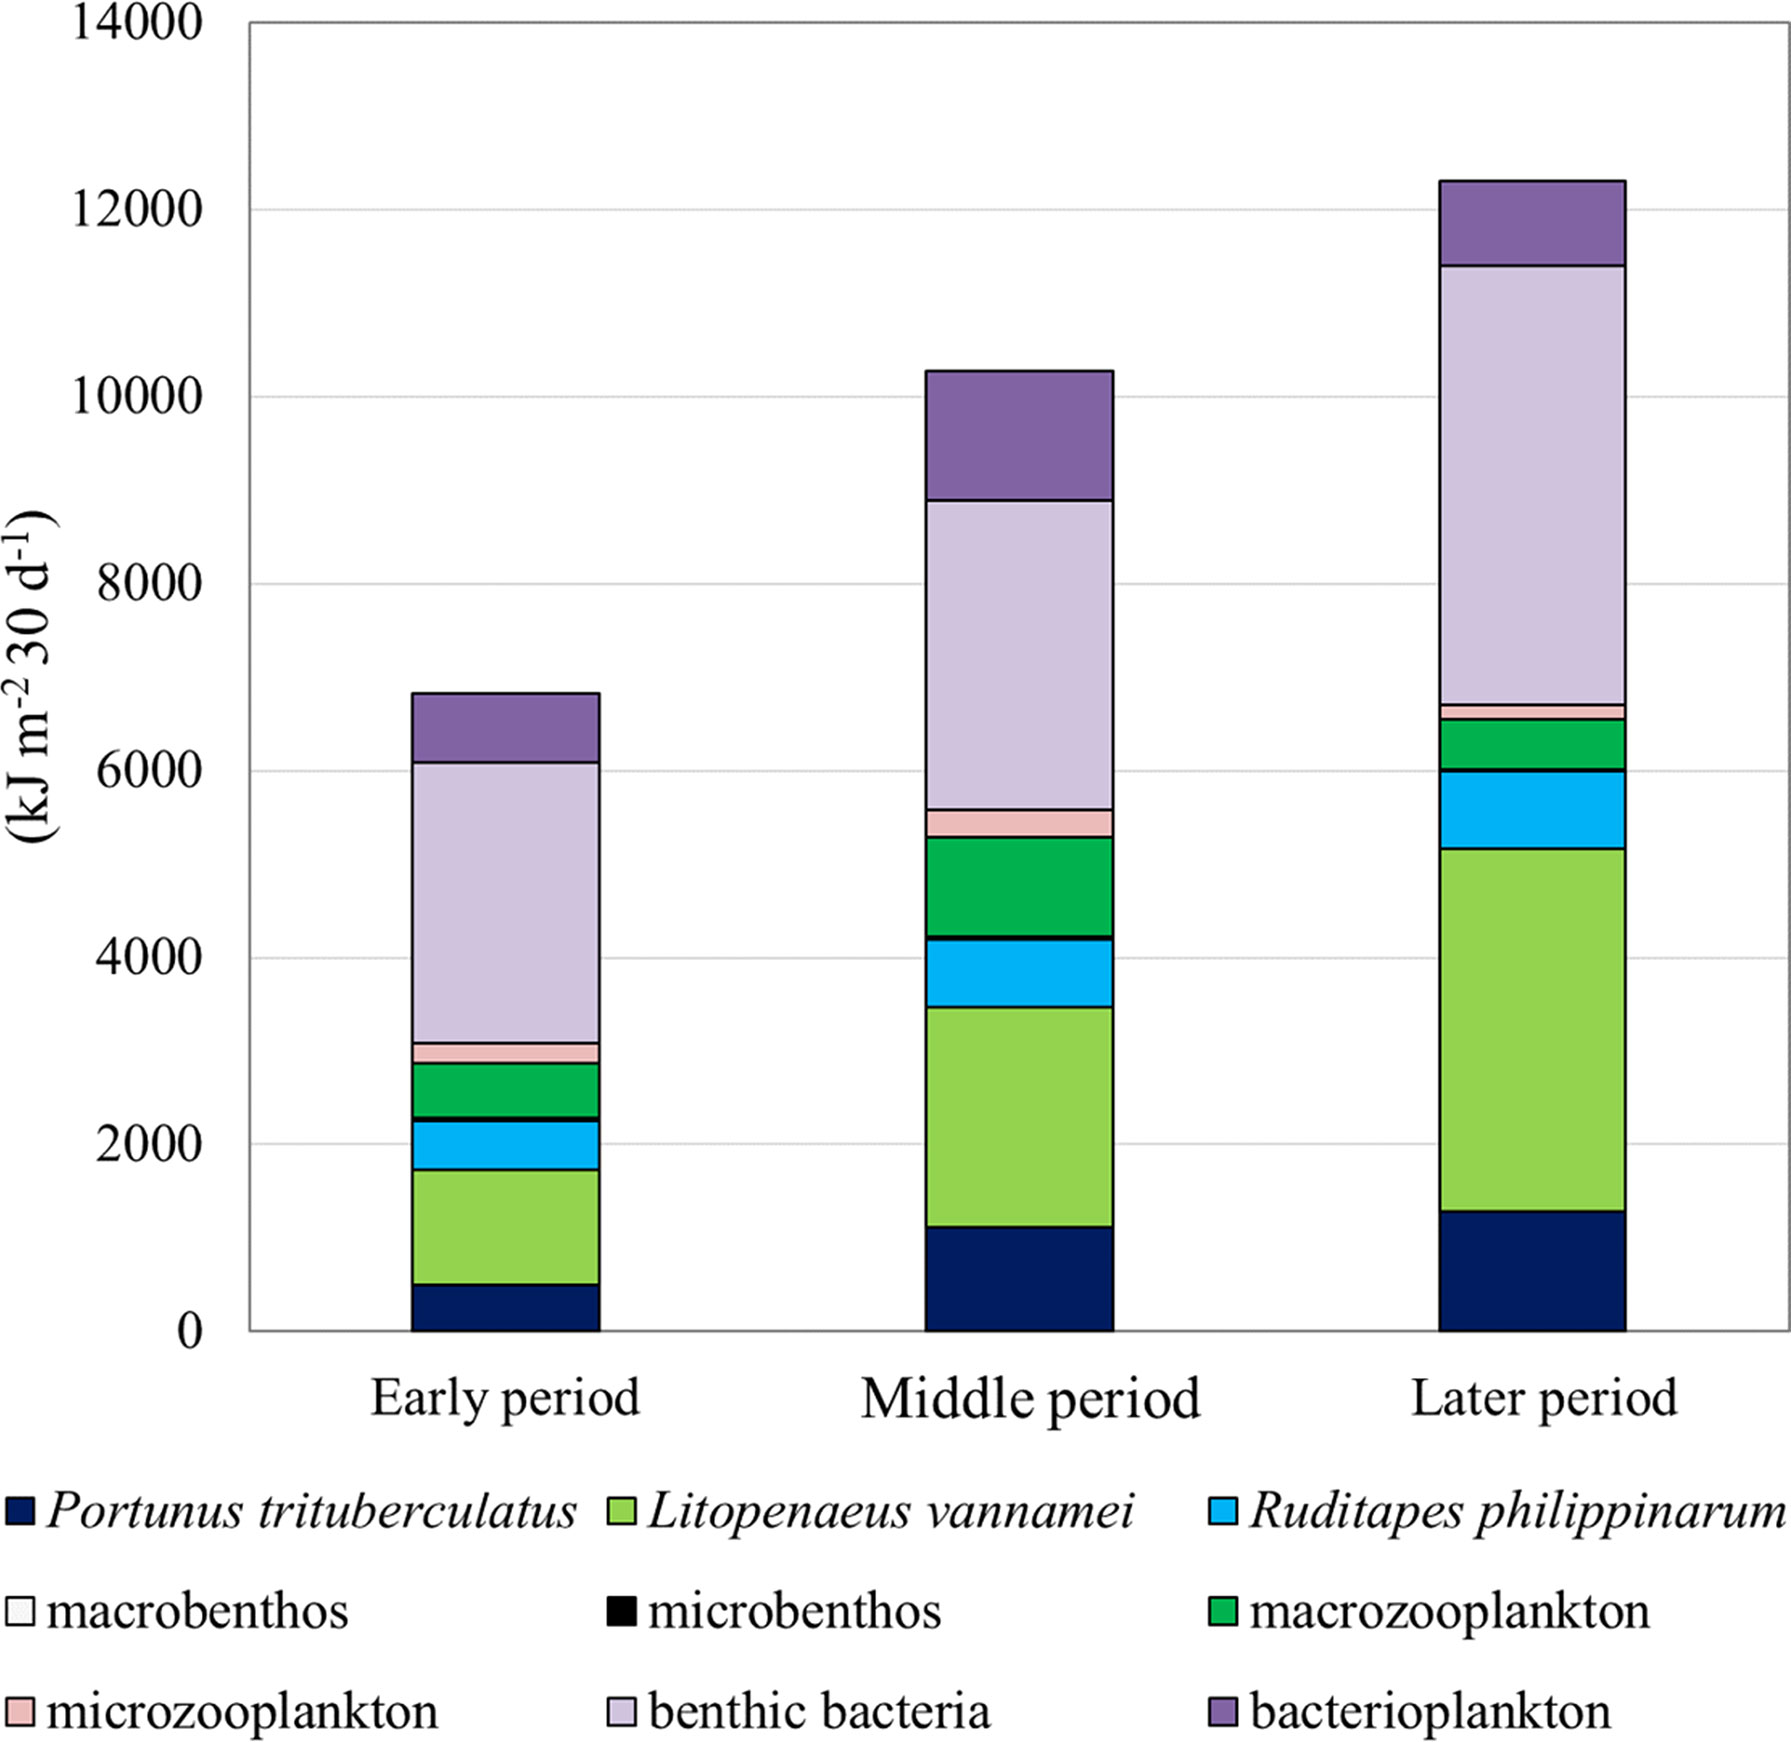
Figure 1 Allocations of total consumption (kJ m-2 30 d-1) of each consumer for a Portunus trituberculatus polyculture ecosystem during the early, middle, and late periods, respectively.
3.2 Energy Flow Structure of the Modeled Ecosystem
Aggregating the three modeled ecosystems into discrete TLs led to the identification of five integer trophic levels in the early, middle, and late periods (Tables 6–8). TL I in the three modeled ecosystems was composed of primary producers, including micro-, nano-, and pico-phytoplankton; periphyton; and the detritus groups of A. laevis, shrimp feed, detritus in sediment, and detritus in water. 75.76%, 82.17%, and 76.77% of the energy on TL I originated from detritus groups in the early, middle and late periods, respectively, whereas the remaining 24.24%, 17.83%, and 23.23% originated from the primary producers in the early, middle and late periods, respectively. Energy flows at TL II encompassed almost all the consumer groups in the early, middle and late periods in this ecosystem, except microbenthos, which was more relevant at TL III in this ecosystem during all three periods. Most of the energy flow of the 17 groups in the early, middle, and late periods in this ecosystem was distributed at TLs I and II. Energy flow at TLs IV and V during the three culture periods was negligible. Benthic bacteria had the highest energy of flow to detritus in the early and middle periods (1493.45 and 1703.20 kJ m-2, respectively), whereas in the late period, the highest energy flow to detritus was pico-phytoplankton (1950.37 kJ m-2). The second-highest energy flow to detritus was pico-phytoplankton (532.80 kJ m-2), macrozooplankton (638.61 kJ m-2), and benthic bacteria (1914.31 kJ m-2) in the early, middle, and late periods, respectively.
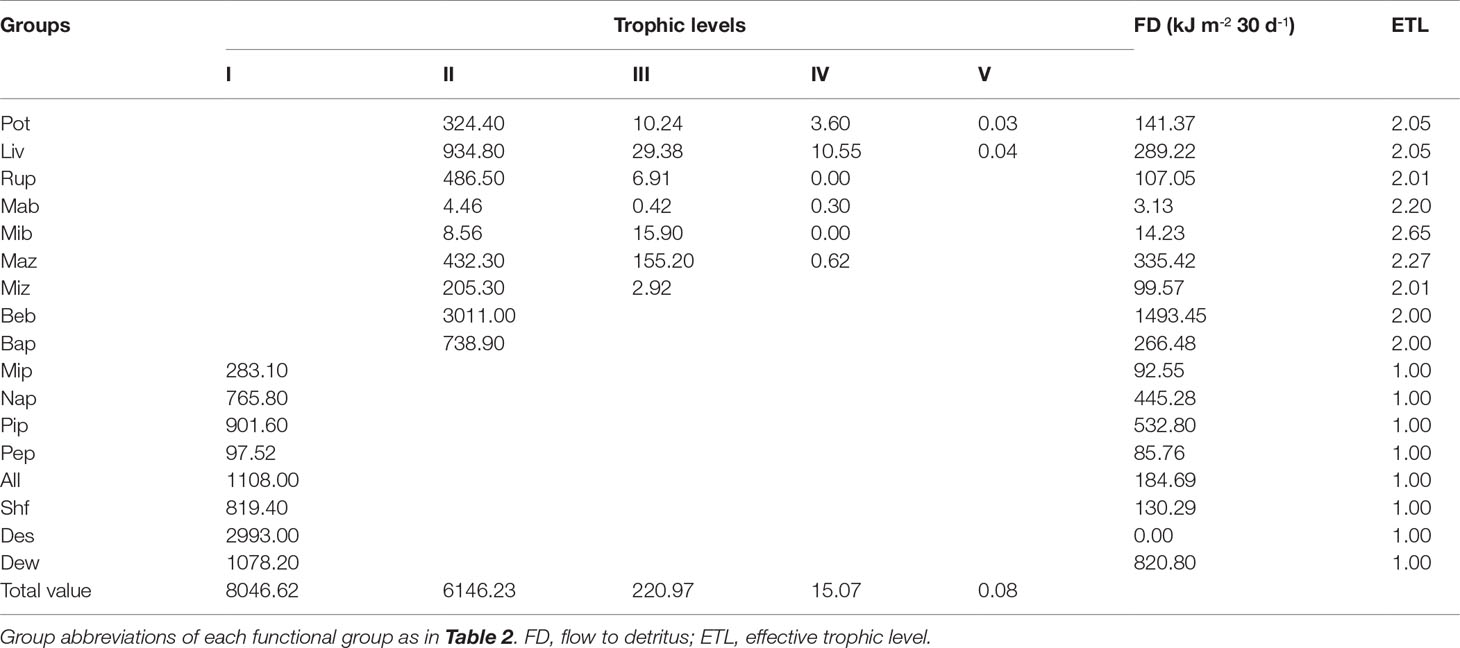
Table 6 Absolute flows of each group by trophic level decomposition of a Portunus trituberculatus polyculture ecosystem during the early period.
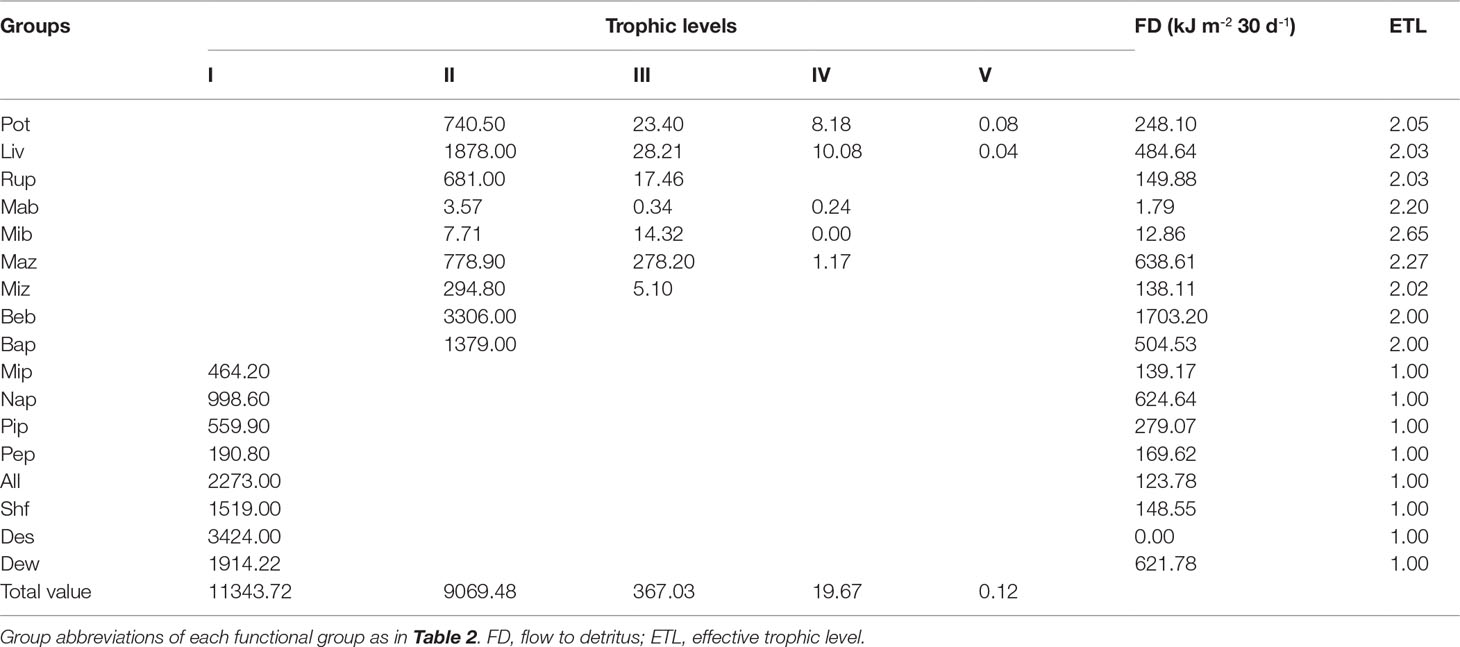
Table 7 Absolute flows of each group by trophic level decomposition of a Portunus trituberculatus polyculture ecosystem during the middle period.
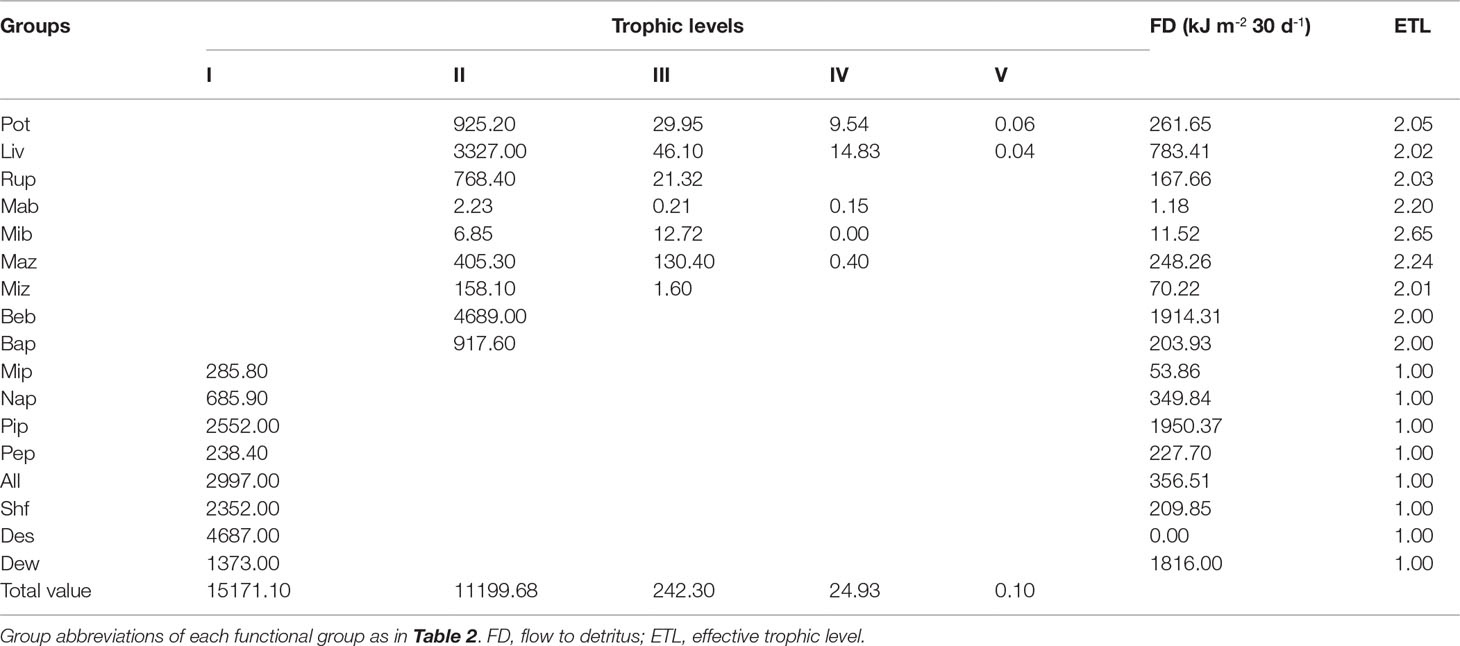
Table 8 Absolute flows of each group by trophic level decomposition of aPortunus trituberculatus polyculture ecosystem during the late period.
A Lindeman spine plot was constructed to represent flow and biomass for the models of the early, middle, and late culture periods (Figure 2). Primary production was calculated as 40.66, 60.38, and 54.84 kJ m-2 for the models of the early, middle, and late periods, respectively, which contributed approximately 11.92%, 8.78%, and 11.13%, respectively to the TST. In the early, middles, and late periods, 891.60, 1001.00, and 1180.00 kJ m-2 30 days-1, respectively, of primary production were consumed by its consumers, whereas 1156.00, 1213.00 and 2582.00 kJ m-2 30 days-1, respectively, of primary production flowed to the detritus groups. In the early, middle, and late periods, 5,683.00, 8,857.00, and 10,843.00 kJ m-2 30 days-1, respectively, of total energy flow to detritus was consumed by primary consumers, whereas 150.55, 28.63, and 750.11 kJ m-2 30 days-1, respectively, of the total energy flow to detritus was accumulated in the group of detritus in sediment. The energy transfer efficiencies from TL II to III in the early, middle, and late periods was 4%, 4%, and 2%, respectively. The transfer efficiencies were lower than the 10% energy transfer efficiency of typical natural ecosystems (Lindeman, 1942). Most of the TST was distributed at TLs I and II in all three models.
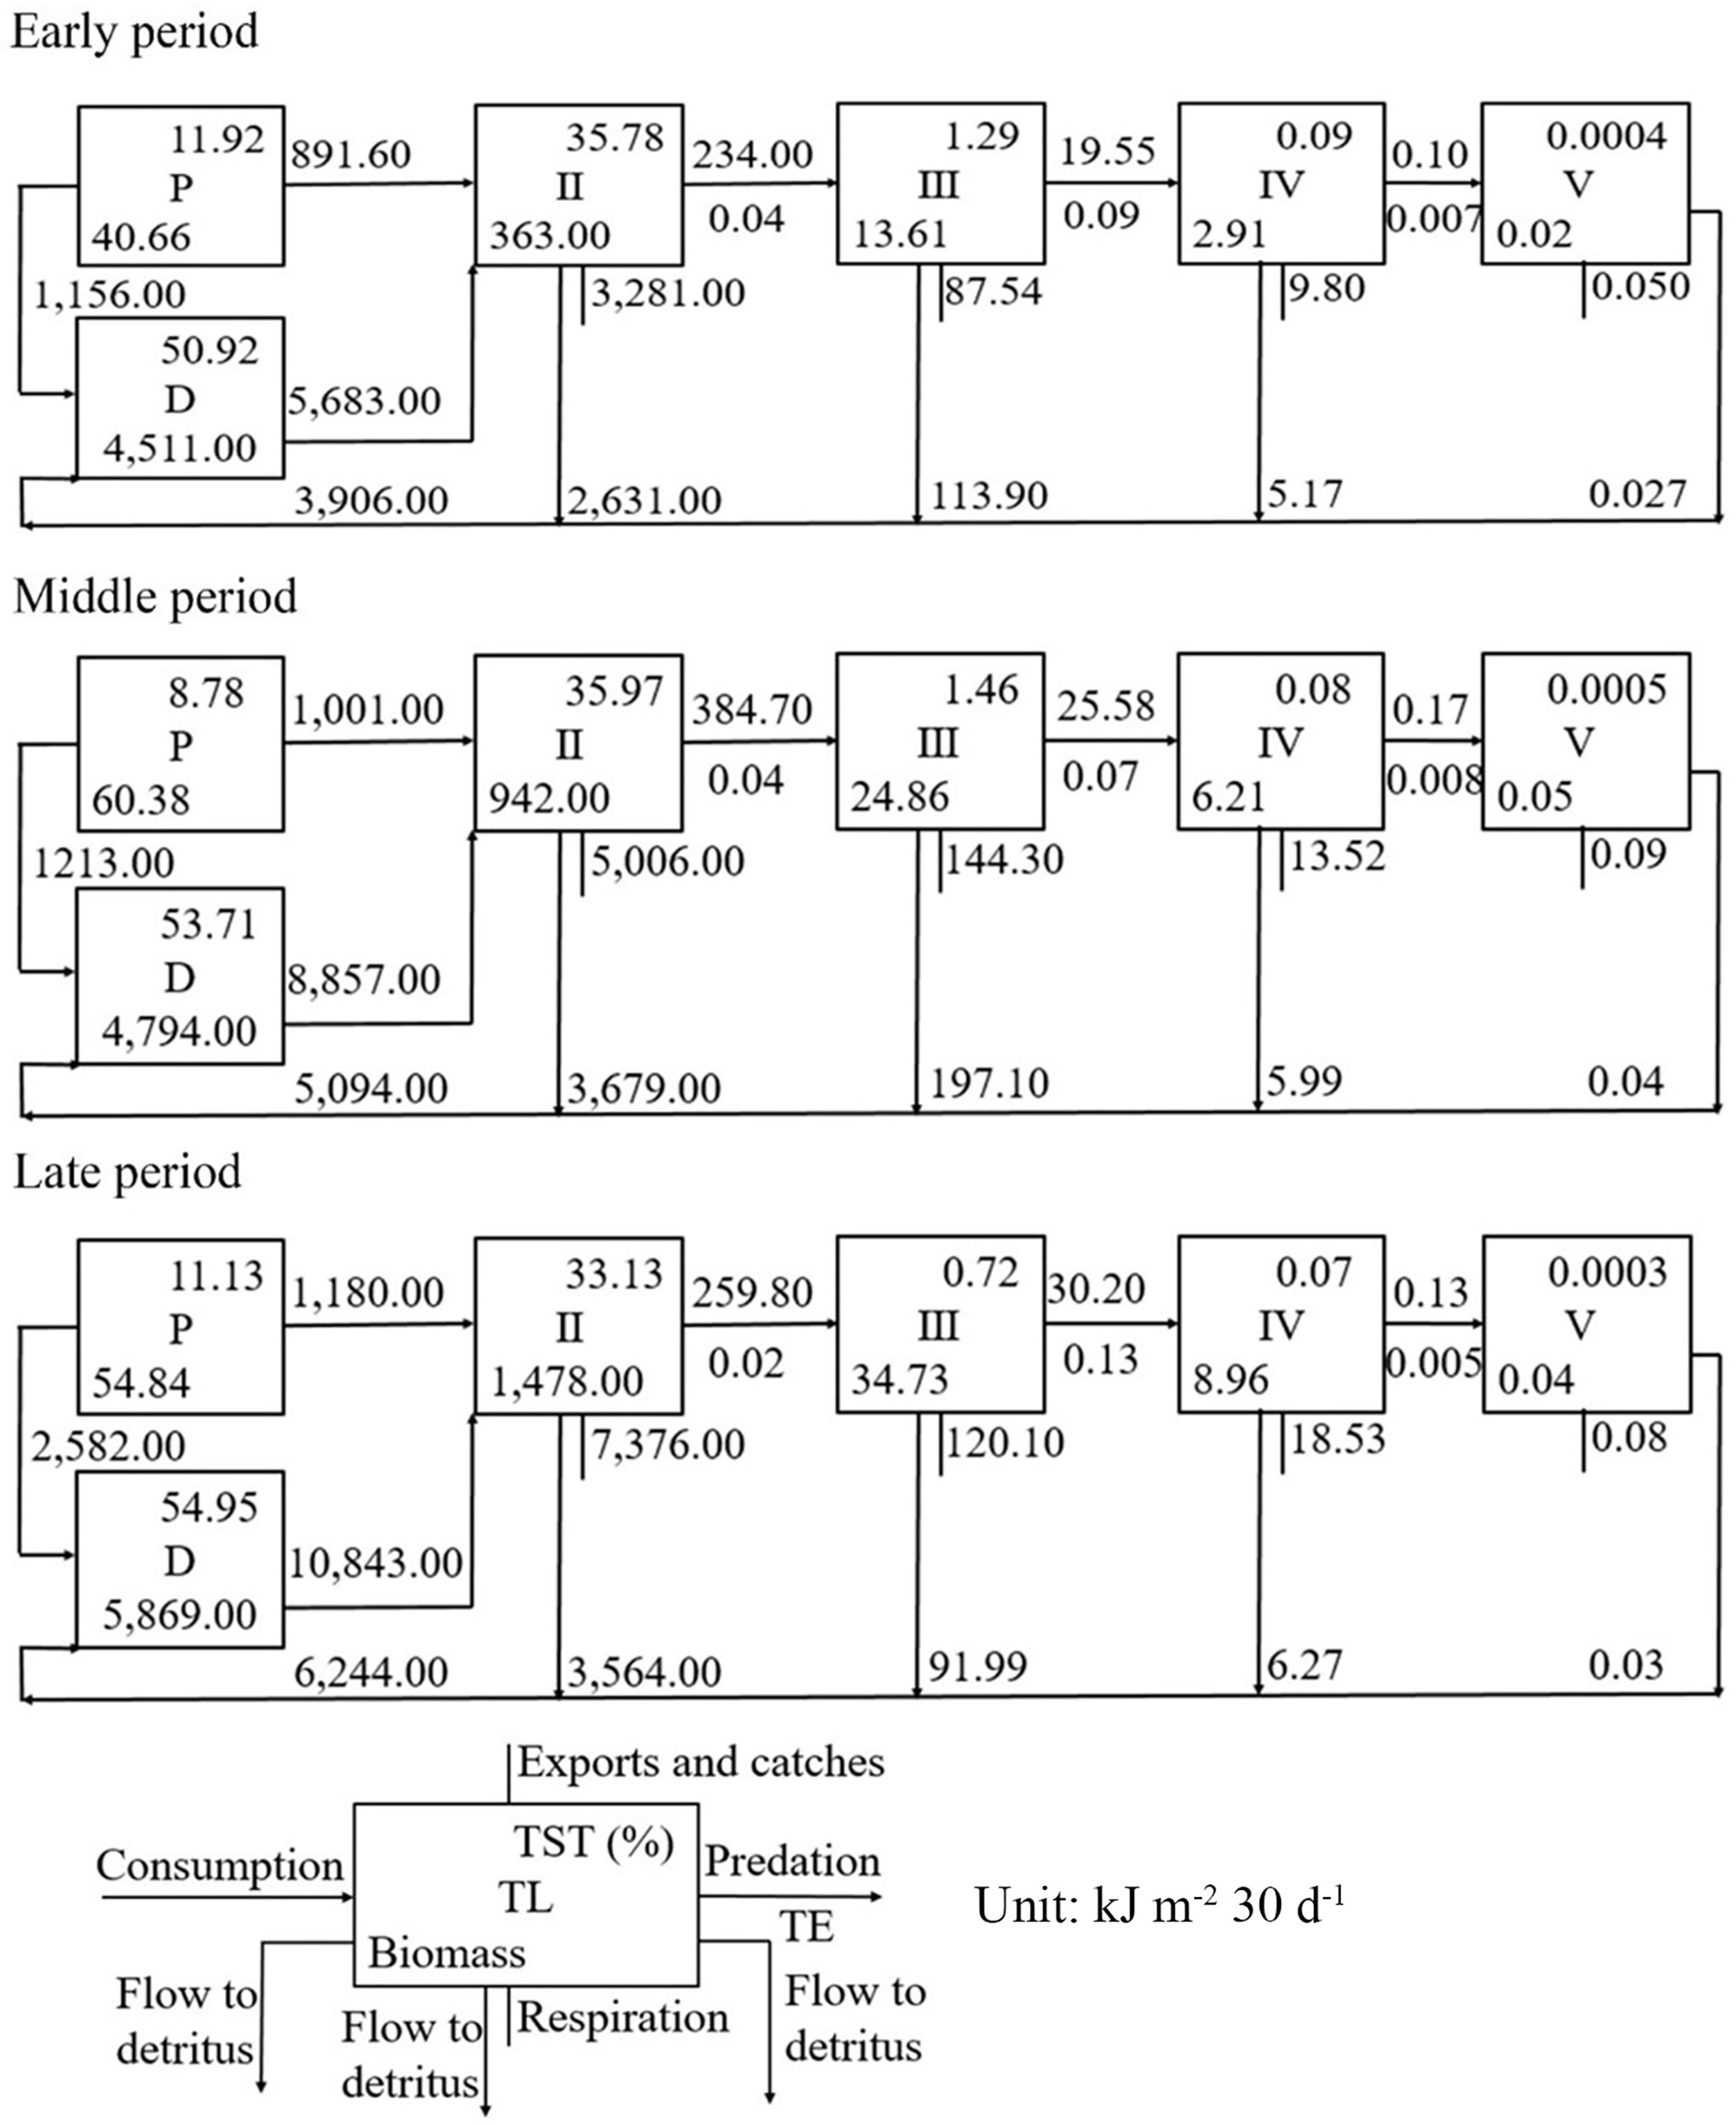
Figure 2 Aggregation of flows and biomass (kJ m-2 30 d-1) of a Portunus trituberculatus polyculture ecosystem during the early, middle, and late periods, respectively (D, detritus; P, primary production; TL, trophic level; TE, transfer efficiency; TST, total system throughput).
3.3 System Attributes of the Modeled Ecosystem
The system attributes of the three models are described in Table 9. The TST in this ecosystem comprised total respiration, total consumption, and total energy flow to detritus; TST increased from the early to the middle and late period, with the values of 17,176.73, 25,211.79, and 33,803.86 kJ m-2 30 days-1, respectively. Total primary production, total production, and total biomass also showed an increasing trend from the early to the middle and late period. The ratio of total primary production to total respiration (TPP/TR) was 0.61, 0.43, and 0.50 in the early, middle, and late periods, respectively. On account of the high energy import via the addition of A. laevis and shrimp feed to support the growth of the cultured organisms, net system production had values of -1330.67, -2950.29, and -3752.76 kJ m-2 30 days-1 in the early, middle, and late periods, respectively. FCI was calculated as 20.38%, 17.90%, and 12.28% for the early, middle, and late periods, respectively. FML decreased from the early to the middle and late period, with values of 5.08, 4.89, and 4.50, respectively. Values of ascendancy showed an increasing trend from the early to the middle and late period. The A/C in the early, middle, and late periods was 41.51%, 42.41%, and 45.05%, respectively, and a pronounced increase was noted in late period. The O/C in the early, middle, and late periods was 58.49%, 57.59%, and 54.95%, respectively, and a marked decrease was noted in the late period.
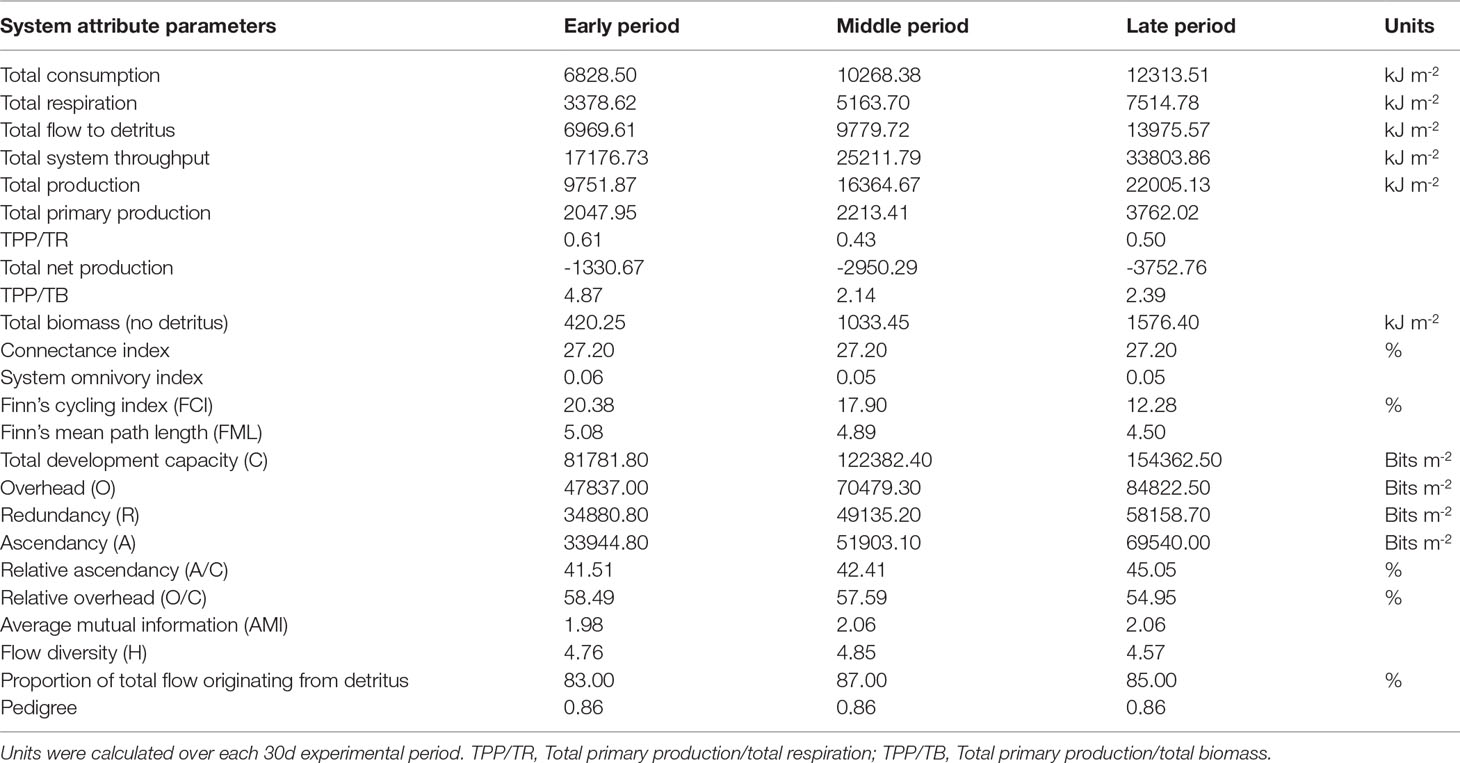
Table 9 System attributes for a Portunus trituberculatus polyculture ecosystem during the early, middle, and late period, respectively.
4 Discussion
4.1 Biomass Dynamics of Phytoplankton With Different Particle Sizes
During the 90-day culture period in the present study, the biomass of micro-, nano-, and pico-phytoplankton expressed varying fluctuating trends. The biomass of both micro- and nano-phytoplankton increased from the early to the middle period, and then decreased from the middle to the late period. In contrast, the biomass of pico-phytoplankton showed the opposite trend: it decreased from the early to the middle period, and then increased from the middle to the late period. The total phytoplankton biomass and primary production increased from early to middle and late periods. In line with Ban et al. (2015), inorganic nutrients (e.g., NH4+, NO3-, and NO2-) increased remarkably from the early to the middle period in this P. trituberculatus polyculture ecosystem, considering the input of artificial foods. It was speculated that the increase in inorganic nutrients may have led to the increase in total phytoplankton biomass and primary production from the early to the middle period (Ramírez et al., 2005). The dominant phytoplankton community changed from nano-phytoplankton to pico-phytoplankton from the middle to the late period. This phenomenon may be correlated with the polyculture of R. philippinarum. The filter-feeding R. philippinarum efficiently transfers particulate matter present in the water column to the sediments by filtration coupled with biodeposition (Kautsky and Evans, 1987). Prins et al. (1998) and Souchu et al. (2001) reported that the consumption of phytoplankton by filter feeders could induce a shift in the phytoplankton composition towards phytoplankton with smaller cells and faster growth rates. R. philippinarum exhibits the highest phytoplankton consumption in the late period compared to the early and middle periods; thus, phytoplankton consumption by R. philippinarum may induce a change in the phytoplankton composition, mainly comprising pico-phytoplankton, which has a higher turnover rate. However, the low EE value (0.24) of pico-phytoplankton in the late period indicates that phytoplankton consumption by R. philippinarum could not suppress the growth of pico-phytoplankton, and that R. philippinarum was not food limited in this ecosystem.
4.2 Analysis of Dynamics of Energy Flow Structure From Early to Late Period
The energy input in aquaculture pond ecosystems mainly comprises primary production and imported foods (Feng et al., 2015; Dong et al., 2017). Primary production and imported foods (blue clam A. laevis and shrimp feed) increased from early to late period in this ecosystem. Primary production accounted for 50.29%, 34.79%, and 39.71% of total energy input in the early, middle, and late periods, respectively. However, approximately 59.28%, 59.97%, and 73.29% of primary production was not utilized by consumers and flowed to detritus groups. Energy originating from detritus accounted for 83.00%, 87.00%, and 85.00% of total system throughput in early, middle, and late period, respectively. As a result, the polyculture ecosystem remained a detritus-dominated ecosystem throughout, which was in accordance with the results of Feng et al. (2017) and Feng et al. (2018a), showing that the detritus food chain is predominant in P. trituberculatus polyculture systems.
The group of benthic bacteria was the largest consumer over the entire culture period, thus the associated energy pathway of detritus in sediment to benthic bacteria was the main energy flow pathway. However, the energy flow structure showed some changing trends associated with organisms as total consumption by P. trituberculatus, L. vannamei, and R. philippinarum to total system consumption showed an increasing trend from early to middle and late periods, which accounted for 32.99%, 40.90%, and 48.64% of the total system consumption, respectively. Increased consumptions of these three functional groups led to increased energy flow to detritus during the entire culture period; moreover, pico-phytoplankton showed the highest energy flow to detritus in the late period. The total energy flow to detritus groups thus showed an increasing trend from the early to the middle and late period (4,221.29, 5,366.55, and 6,810.27 kJ m-2 30 days-1, respectively), and large amounts of energy were accumulated in the detritus group of detritus in sediment. Increased detritus accumulation was considered a potential risk to the ecosystem, which may cause deterioration of the bottom environment in a pond ecosystem (Lin et al., 2005). Management practices such as increasing bottom oxygen supply should be implemented to reduce this risk.
4.3 Analysis of Ecosystem Attribute Dynamics Using Ecological Network Analysis
Biomass change of each functional group during the entire culture period could lead to changes in ecosystem structure, which in turn could lead to changes in ecosystem function. The indices of TST, AMI, A/C, and O/C are assigned to a number of groups that describe ecosystem properties in terms of ecosystem structure (Tomczak et al., 2013). In the polyculture ecosystem of the present study, TST, AMI, and A/C all increased from the early to the late period. The increase in TST indicated that the ecosystem size increased from the early to the late period. The increase in AMI indicated that the inherent organization, i.e. the degree of specialization of flow in the network of this polyculture ecosystem, increased from the early to the late period, which represents a trend of simplification of the food web structure (Latham and Scully, 2002). The A/C, which is the ratio of AMI to H, showed a marked increase from the middle to the late period, because of the decrease in H and increase in AMI, and this indicated that the ecosystem had the highest level of system organization in the late period. The system overhead represents the resilience of an ecosystem against external perturbations (Ulanowicz and Norden, 1990; Christensen, 1995). The O/C in the late period was lower than that in the early and middle periods, indicating that the ecosystem was less resilient in late period than in the early and middle periods.
FCI and FML are indices that describe the system attributes of energy flow (Tomczak et al., 2013). The values of FCI and FML decreased from the early to the middle and late periods. The fluctuating trends of FCI was contrary to that of A/C. which was in accordance with Baird et al. (1991), who demonstrated an inverse relationship between FCI value and A/C. The decreased FCI value indicated that the proportion of the TST that is recycled decreased from the early to the late period. Considering that the food composition of each consumer was almost unchanged during culturing, the decreased FCI may explain the decreased FML during the entire culture period. The decreased FML also indicated a simplification of the food web structure.
4.4 Ecosystem Optimization
The polyculture system structure changed gradually to an ecosystem with larger size and higher level of organization from the early to middle and late periods. However, the overly increased TST and AMI may jeopardize the stability of ecosystem structure (Ulanowicz, 2003). It was demonstrated that the introduction of R. philippinarum may improve H through increasing total energy flow pathways (Feng et al., 2018a); improved H will decrease the AMI and increase system resilience (Ulanowicz, 2004). Moreover, as R. philippinarum was not food-limited in the late period, increasing the biomass of R. philippinarum may increase the EE value of pico-phytoplankton, thereby increasing the energy utilization of primary production. As a result, increasing the stocking density of R. philippinarum to maintain higher biomass may be an effective way to optimize such polyculture ecosystems.
Large amounts of detritus energy were accumulated in the group of detritus in sediment. Increased detritus accumulation may cause deterioration of the bottom environment of the pond ecosystem, which would further affect growth of organisms, especially the cultured organisms (Lin et al., 2005). In the present study, energy flow from pico-phytoplankton contributed the largest part of the total energy flow to the detritus. As the growth of phytoplankton was mainly supported by inorganic nutrients (Ban et al., 2015), introduction of macro-algae at a suitable biomass into this ecosystem may help absorb superfluous inorganic nutrients, thereby reducing phytoplankton production, detritus accumulation, and increase ecosystem stability. Moreover, macro-algae can also be used as aquatic products.
5 Conclusions
The dynamics of biomass composition, energy flow structure, and system function of P. trituberculatus was investigated by using the Ecopath model. This study illustrated that the growth of cultured organisms and aquaculture activities such as imported artificial food showed large impacts on the biomass structure of the polyculture ecosystem. R. philippinarum was considered to have a dominant influence on the phytoplankton community, which changed from nano- to pico-phytoplankton-dominated from the middle to the late period. Because of the increased primary production, imported artificial food, and consumption of the cultured organisms, the energy flow structure showed some remarkable changes from the early to the middle and late period, and large amounts of detritus energy were accumulated in the sediment in the late period. System network analysis indicated that ecosystem size and level of system organization increased from the early to the middle and late periods, whereas food web complexity and system resilience decreased from the early to the middle and late periods, which may indicate decreasing ecosystem stability. Increasing the stocking density of R. philippinarum may help increase the energy flow diversity of this ecosystem, which would also increase the system’s resilience and energy utilization. Moreover, introducing macro-algae to this ecosystem may help reduce superfluous inorganic nutrients, which may decrease phytoplankton production and detritus accumulation. These two measures are thus proposed to optimize such ecosystems.
Data Availability Statement
The original contributions presented in the study are included in the article/Supplementary Material, further inquiries can be directed to the corresponding author.
Author Contributions
JF carried out the experiments, constructed the models and drafted the manuscript. X-LT and S-LD contributed to the design of the experiment and revised the manuscript. R-PH, KZ, and D-XZ prepared materials and carried out the experiments. D-XZ and Q-QZ revised the manuscript. All authors contributed to the article and approved the submitted version.
Funding
This study was supported by the National Key R&D Program of China (2020YFD0900200), National Great Project of Scientific and Technical Supporting Program (Grant No. 2011BAD13B03), and the Program for Excellent Youth Foundation of Shandong Province (Grant No. JQ201009).
Conflict of Interest
The authors declare that the research was conducted in the absence of any commercial or financial relationships that could be construed as a potential conflict of interest.
Publisher’s Note
All claims expressed in this article are solely those of the authors and do not necessarily represent those of their affiliated organizations, or those of the publisher, the editors and the reviewers. Any product that may be evaluated in this article, or claim that may be made by its manufacturer, is not guaranteed or endorsed by the publisher.
Acknowledgments
We thank Mingliang Gao, Wenbo Ban, and Run Wang for assisting with the experiments and sampling.
Supplementary Material
The Supplementary Material for this article can be found online at: http://www.frontiersin.org/articles/10.3389/fmars.2022.873643/full#supplementary-material
References
Abreu M. H., Rui P., Yarish C., Buschmann A. H., Sousa-Pinto I. (2011). IMTA With Gracilaria Vermiculophylla: Productivity and Nutrient Removal Performance of the Seaweed in a Land-Based Pilot Scale System. Aquaculture 312 (1–4), 77–87. doi: 10.1016/j.aquaculture.2010.12.036
Akoglu E., Salihoglu B., Libralato S., Oguz T., Solidoro C. (2014). An Indicator-Based Evaluation of Black Sea Food Web Dynamics During 1960–2000. J. Mar. Syst. 134 (4), 113–125. doi: 10.1016/j.jmarsys.2014.02.010
Allen P. M. (1988). “Evolution: Why the Whole is Greater Than the Sum of the Parts. Ecodynamics: Contributions to Theoretical Ecology, Part 1: Evolution,” in Proceedings of an International Workshop. Eds. Wolffand W., Soeder C. J., Drepper F. R. (Berlin: Springer-Verlag), 2–30.
Aubin J., Baizeau V., Jaeger C., Roucaute M., Gamito S. (2021). Modeling Trophic Webs in Freshwater Fishpond Systems Using Ecopath: Towards Better Polyculture Management. Aquacult. Env. Interac. 13, 311–322. doi: 10.3354/aei00406
Baird D., McGlade J. M., Ulanowicz R. E. (1991). The Comparative Ecology of Six Marine Ecosystems. Philos. Trans. R Soc. Lond B Biol. Sci. 333, 15–29. doi: 10.1098/rstb.1991.0058
Ban W. B., Tian X. L., Dong S. L., Zhang K., Gao M. L., Zhang D. X., et al. (2015). An Experimental Study on Structure Optimization for Polyculture of Portunus Trituberculatus, Litopenaeus Vannamei, Ruditapes Philippinarum, and Gracilaria Lichevoides. Hebei Fisheries 8, 12–18. doi: 10.3969/j.issn.1004-6755.2015.08.003
Bodini A., Bondavalli C. (2002). Towards a Sustainable Use of Water Resources: A Whole-Ecosystem Approach Using Network Analysis. Int. J. Environ. pollut. 18, 463–485. doi: 10.1504/IJEP.2002.002340
Bradford-Grieve J. M., Probert P. K., Nodder S. D., Thompson D., Hall J., Hanchet S., et al. (2003). Pilot Trophic Model for Subantarctic Water Over the Southern Plateau, New Zealand: A Low Biomass, High Transfer Efficiency System. J. Exp. Mar. Biol. Ecol. 289 (2), 223–262. doi: 10.1016/S0022-0981(03)00045-5
Byron C., Link J., Costa-Pierce B., Bengtson D. (2011a). Calculating Ecological Carrying Capacity of Shellfish Aquaculture Using Mass-Balance Modeling: Narragansett Bay, Rhode Island. Ecol. Model. 222 (10), 1743–1755. doi: 10.1016/j.ecolmodel.2011.03.010
Byron C., Link J., Costa-Pierce B., Bengtson D. (2011b). Modeling Ecological Carrying Capacity of Shellfish Aquaculture in Highly flushed Temperate Lagoons. Aquaculture 314, 87–99. doi: 10.1016/j.aquaculture.2011.02.019
Cai H. F. (2006). Primary Studies on the Application of Carrier-Microbe Compound in Bioremediation of the Polluted Sediment of Aquaculture Pond (Ningbo: Ningbo University) (in Chinese with English abstract).
Chopin T., Buschmann A. H., Halling C., Troell M., Kautsky N., Neori A., et al. (2001). Integrating Seaweeds Into Marine Aquaculture Systems: A Key Toward Sustainability. J. Phycol. 37, 975–986. doi: 10.1046/j.1529-8817.2001.01137.x
Christensen V. (1995). Ecosystem Maturity — Towards Unification. Ecol. Model. 77, 3–32. doi: 10.1016/0304-3800(93)E0073-C
Christensen V., Pauly D. (1992a). A Guide to the Ecopath II Software Systems (Version 2.1), ICLARM Software 6 (Manila: International Center for Living Aquatic Resources Management (ICLARM), p72.
Christensen V., Pauly D. (1992b). Ecopath II: A Software for Balancing Steady-State Ecosystem Models and Calculating Network Characteristics. Ecol. Model. 61 (3–4), 169–186. doi: 10.1016/0304-3800(92)90016-8
Christensen V., Walters C. J. (2004). ECOPATH With ECOSIM: Methods, Capabilities and Limitations. Ecol. Model. 172, 109–139. doi: 10.1016/j.ecolmodel.2003.09.003
Christensen V., Walters C. J., Pauly D. (2005). Ecopath With Ecosim: A User’s Guide (Version 5.1) (Vancouver, Canada: Fisheries Centre, University of British Columbia), p154.
Diana J. S., Lin C. K., Schneeberger P. J. (1991). Relationships Among Nutrient Inputs, Water Nutrient Concentrations, Primary Production, and Yield of Oreochromis Niloticus in Ponds. Aquaculture 92, 323–341. doi: 10.1016/0044-8486(91)90038-9
Días López B., Bunke M., Shirai J. A. B. (2008). Marine Aquaculture Off Sardinia Island (Italy): Ecosystem Effects Evaluated Through a Trophic Mass Balance Model. Ecol. Model. 212, 292–303. doi: 10.1016/j.ecolmodel.2007.10.028
Dong S. L., Dong Y. W., Cao L., Verreth J., Olsen Y., Liu W. J., et al. (2022). Optimization of Aquaculture Sustainability Through Ecological Intensification in China. Rev. Aquac. 00, 1–11. doi: 10.1111/raq.12648
Dong S. P., Gao Y. F., Gao Y. P., He M. D., Liu F., Yan F. J., et al. (2021a). Evaluation of the Trophic Structure and Energy Flow of a Rice-Crayfish Integrated Farming Ecosystem Based on the Ecopath Model. Aquaculture 2), 736626. doi: 10.1016/j.aquaculture.2021.736626
Dong S. P., Wang F., Zhang D. X., Yu L. Y., Pu W. J., Xu X., et al. (2021b). Assessment of the Carrying Capacity of Integrated Pond Aquaculture of Portunus Trituberculatus at the Ecosystem Level. Front. Mar. Sci. 8, 747891. doi: 10.3389/fmars.2021.747891
Dubois S., Del Amo Y., Grami B., Jude F., Marquis E., David V., et al. (2012). Network Analysis of the Planktonic Food Web During the Spring Bloom in a Semi Enclosed Lagoon (Arcachon, SW France). Acta Oecologica 40, 40–50. doi: 10.1016/j.actao.2012.02.002
FAO (2014). The State of World Fisheries and Aquaculture 2013 (Rome: Food and Agriculture Organization of the United Nations).
FAO (2020). “The State of World Fisheries and Aquaculture 2020,” in Sustainability in Action (Rome: Food and Agriculture Organization of the United Nations).
Fath B. D., Scharler U. M., Ulanowicz R. E., Hannon B. (2007). Ecological Network Analysis: Network Construction. Ecol. Model. 208 (1), 49–55. doi: 10.1016/j.ecolmodel.2007.04.029
FDAMC (Fisheries Department of Agriculture Ministry of China) (2021). China Fisheries Yearbook (Beijing: China Agriculture Press).
Feng J., Tian X. L., Dong S. L., He R. P., Zhang K., Zhang D. X., et al. (2018a). Comparative Analysis of the Energy Fluxes and Trophic Structure of Polyculture Ecosystems of Portunus Trituberculatus Based on Ecopath Model. Aquaculture 496, 185–196. doi: 10.1016/j.aquaculture.2018.07.020
Feng J., Tian X. L., Dong S. L., He R. P., Zhang K., Zhang D. X., et al. (2017). Model-Based Analysis of the Energy Fluxes and Trophic Structure of a Portunus Trituberculatus Polyculture Ecosystem. Aquacult. Env. Interac. 9, 479–490. doi: 10.3354/aei00247
Feng J., Tian X. L., Dong S. L., Li D., He R. P., Zhang K., et al. (2018b). Trophic Interaction in a Portunus rituberculatus Polyculture Ecosystem Based on Carbon and Nitrogen Stable Isotope Analysis. Oceanic Coast. Sea Res. 17 (6), 1432–1440. doi: 10.1007/s11802-018-3655-y
Feng J., Tian X. L., Dong S. L., Zhang K., Dong J. (2015). Studies on the Energy Budget of Different Polyculture Systems of Swimming Crab. Period Ocean Univ China. 45, 9–47 (in Chinese with English abstract). doi: 10.16441/j.cnki.hdxb.20140028
Hargrave B. T. (1972). Aerobic Decomposition of Sediment and Detritus as a Function of Particle Surface Area and Organic Content. Limnol Oceanogr. 17, 583–586. doi: 10.4319/lo.1972.17.4.0583
Heymans J. J., Coll M., Link J. S., Mackinson S., Steenbeek J., Walters C., Christensen V. (2016). Best Practice in Ecopath with Ecosim Food-Web Models for Ecosystem-Based Management. Ecol. Model. 331, 173–184.
Heymans J. J., Guénette S., Christensen V. (2007). Evaluating Network Analysis Indicators of Ecosystem Status in the Gulf of Alaska. Ecosystems 10, 488–502. doi: 10.1007/s10021-007-9034-y
Jiang W. M., Gibbs M. T. (2005). Predicting the Carrying Capacity of Bivalve Shellfish Culture Using a Steady, Linear Food Web Model. Aquaculture 244, 171–185. doi: 10.1016/j.aquaculture.2004.11.050
Jin B. C. (2010). Using Stable Isotope to Evaluate Food Sources of Pond-Cultured Sea Cucumber (Apostichopus Japonicus) (Qingdao: Ocean University of China) (in Chinese with English abstract).
Kautsky N., Evans S. (1987). Role of Biodeposition by Mytilis Edulis in the Circulation of Matter and Nutrients in a Baltic Coastal Ecosystem. Mar. Ecol. Prog. Ser. 38, 201–212. doi: 10.3354/meps038201
Klinger, D., and Naylor, R. (2012). Searching for Solutions in Aquaculture: Charting a Sustainable Course. Annu Rev Environ Resour. 37 (1), 247− 276.
Kluger L. C., Taylor M. H., Mendo J., Tam J., Wolff M. (2016a). Carrying Capacity Simulations as a Tool for Ecosystem-Based Management of a Scallop Aquaculture System. Ecol. Model. 331, 44–55. doi: 10.1016/j.ecolmodel.2015.09.002
Kluger L. C., Taylor M. H., Rivera E. B., Silva E. T., Wol, ff M. (2016b). Assessing the Ecosystem Impact of Scallop Bottom Culture Through a Community Analysis and Trophic Modelling Approach. Mar. Ecol. Prog. Ser. 547, 121–135. doi: 10.3354/meps11652
Latham L. G., Scully E. P. (2002). Quantifying Constraint to Assess Development in Ecological Networks. Ecol Model 154 (1-2), 25–44. doi: 10.1016/s0304-3800(02)00032-7
Likens G. E. (1985). An Ecosystem Approach to Aquatic Ecology: Mirror Lake and its Environment (New York: Springer-Verlag).
Li C. H., Lin W. L. (1995). Grazing Rate of Zooplankton on Bacterioplankton in Donghu Wuhan. Acta Ecol. Sin. 15, 142–147.
Lindeman R. L. (1942). The Trophic-Dynamic Aspect of Ecology. Ecology 23, 399–418. doi: 10.2307/1930126
Lin L. S., Miao W. M., Yuan X. H., Yue C. M. (2005). A Review: Purification of Water in Fish Ponds by Submerged Macrophytes. Fisheries Sci. 24 (12), 45–47 (in Chinese with English abstract). doi: 10.16378/j.cnki.1003-1111.2005.12.015
Lin, Q. (2012). Studies on the ecosystem energy transfer and function in the typical waters of Yellow and Bohai Sea (Qingdao: Ocean University of China) (In Chinese with English abstract).
Li D. S., Xiong B. X., Li Q., Yuan J. F. (1993). A Floating Enclosure Device Suitable for Inland Water Ecological Experiments. Oceanologia Limnologia Sin. 24 (5), 547–552. (in Chinese with English abstract).
Li D. S., Lu J. R., Xu N., Liu G. C. (1998a). A Device of in Situ Sediment Respiration Determining Apparatus Used in Pond. J Ocean Univ Qingdao. 28 (2), 205–209 (in Chinese with English abstract). doi: 10.16441/j.cnki.hdxb.1998.02.006
Mao X. X., Jiang X. M., Wang R. Y., Wang C. L. (2013). Comparison on Phytoplankton and Output in Two Polyculture Modes With Portunus Trituberculatus. J. Biol. 30 (6), 36–40. doi: 10.3969/j.issn.2095-1736.2013.06.036
Mao X. X., Jiang X. M., Wang C. L., Yi X. L. (2014). Investigation of Zooplankton in Two Polyculture Modes as Dominant Stocking Species of the Swimming Crab Portunus Trituberculatus. J. Biol. 31 (4), 38–41 (in Chinese with English abstract). doi: 10.3969/j.issn.2095-1736.2014.03.038
Mayekar T. S., Sreekanth G. B., Paramesh V., Kumar P., Patil A. S., Mujawar S. Y., et al. (2022). Energy Transfer and Trophic Organization in an Integrated Fish-Livestock-Horticulture System (IFLH) From Bicholim (Goa), the Western Coast of India. Aquaculture 554, 738164. doi: 10.1016/j.aquaculture.2022.738164
Moriarty D. J. (1986). Bacterial Productivity in Ponds Used for Culture of Penaeid Prawns. Microb. Ecol. 12, 259–269. doi: 10.1007/BF02011169
Patrício J., Marques J. C. (2006). Mass Balanced Models of the Food Web in Three Areas Along a Gradient of Eutrophication Symptoms in the South Arm of the Mondego Estuary (Portugal). Ecol. Model. 197, 21–34. doi: 10.1016/j.ecolmodel.2006.03.008
Pauly D., Christensen V., Guenette S., Pitcher T. J., Sumaila U. R., Walters C. J., et al. (2002). Towards Sustainability in World Fisheries. Nature 418, 689–695. doi: 10.1038/nature01017
Prins T., Smaal A., Dame R. (1998). A Review of the Feedbacks Between Grazing and Ecosystem Processes. Aquat Ecol. 31, 349–359. doi: 10.1023/A:1009924624259
Qi M., Shen Y. H., Zhu C. H., Wu Z. H., Huang X. H. (2010). A Primary Study on Conversion Efficiency of Litopenaeus Vannamei Feed on Artificial Diets. Fish Modern. 37, 34–37. (in Chinese with English abstract).
Ramírez T., Cortés D., Mercado J. M., Vargas-Yanez, Sebastián M., Lige E., , (2005). Seasonal Dynamics of Inorganic Nutrients and Phytoplankton Biomass in the NW Alboran Sea. Estuar. Coast. Shelf Sci. 65 (4), 654–670. doi: 10.1016/j.ecss.2005.07.012
Salonen K., Sarvala J., Hakala I., Viljanen M. L. (1976). The Relation of Energy and Organic Carbon in Aquatic Invertebrates. Limnology Oceanography 21 (5), 724–730. doi: 10.4319/lo.1976.21.5.0724
Schwaerter S., Søndergaard M., Bo R., Jensen L. M. (1988). Respiration in Eutrophic Lakes: The Contribution of Bacterioplankton and Bacterial Growth Yield. J. Plankton Res. 10, 515–531. doi: 10.1093/plankt/10.3.515
Schwinghamer P., Hargrave B., Peer D., Hawkins C. M. (1986). Partitioning of Production and Respiration Among Size Groups of Organisms in an Intertidal Benthic Community. Mar. Ecol. Prog. Ser. 31, 131–142. doi: 10.3354/meps031131
Song H. T., Yu C. G., Xue L. J., Yao G. Z. (2006). The East China Sea Economic Crab (Beijing: Ocean Press), p83–p86. (in Chinese).
Soto-Zarazúa G. M., Fernando, García-Trejo J., Toledano-Ayala M., Rivas-Araiza E. (2014). “Aquatic Biosystems: Applications in Aquacultural Engineering as a Sustainable Technology,” in Biosystems Engineering: Biofactories for Food Production in the Century XXI. Eds. Guevara-Gonzalez R., Torres-Pacheco I. (Cham: Springer).
Souchu p., Vaquer A., Collos Y., Landrein S., Deslouspaoli J. M., Bibent B. (2001). Influence of Shellfish Farming Activities on the Biogeochemical Composition of the Water Column Inthau Lagoon. Mar. EcolProgSer. 218, 141–152. doi: 10.3354/meps218141
Straile D. (1997). Gross Growth Efficiencies of Protozoan and Metazoan Zooplankton and Their Dependence on Food Concentration, Predator-Prey Weight Ratio, and Taxonomic Group. Limnol Oceanogr. 42, 1375–1385. doi: 10.4319/lo.1997.42.6.1375
Sun Z., Wang Y. B., Lu J. X. (2012). On the Variation and Size-Fractionated Chlorophyll a in Ponds With Portunus Trituberculatus Cultured in Different Models. Mar. Fisheries 34 (2), 177–182, (in Chinese with English abstract), doi: 10.1007/s11783-011-0280-z
Sun L. Y., Wen X. M., Yu N., Chen L. Q. (2011). In-Situ Enclosures and Applications in Aquatic Ecology. J. Hydroecology 32 (2), 108–114 , (in Chinese with English abstract) doi: 10.15928/j.1674-3075.2011.03.019
Tecchio S., Rius A. T., Dauvin J.-C., Lobry J., Lassalle G., Morin J., et al. (2015). The Mosaic of Habitats of the Seine Estuary: Insights From Food-Web Modelling and Network Analysis. Ecol. Model. 312, 91–101. doi: 10.1016/j.ecolmodel.2015.05.026
Tian X. L., li D. S., Dong S. L., Yan X. Z., Qi Z. X., Liu G. C., et al. (2001). An Experimental Study on Closed-Polyculture of Penaeid Shrimp With Tilapia and Constricted Tagelus. Aquaculture 202, 57–71. doi: 10.1016/S0044-8486(01)00559-2
Tomczak M. T., Heymans J. J., Yletyinen J., Niiranen S., Otto S. A., Blenckner T. (2013). Ecological Network Indicators of Ecosystem Status and Change in the Baltic Sea. PLos One 8 (10), e75439. doi: 10.1371/journal.pone.0075439
Troell M., Halling C., Neori A., Chopin T., Buschmann A. H., Yarish C., et al. (2003). Integrated Mariculture: Asking the Right Questions. Aquaculture 226 (1), 69–90. doi: 10.1016/S0044-8486(03)00469-1
Tsuchiya M., Kurihara Y. (1979). The Feeding Habits and Food Sources of the Deposit-Feeding Polychaete, Neanthes Japonica, (Izuka). J. Exp. Mar. Biol. Ecol. 36, 79–89. doi: 10.1016/0022-0981(79)90101-1
Ulanowicz R. E. (1986). Growth and Development: Ecosystem Phenomenology (New York: Springer Verlag).
Ulanowicz R. E. (2003). Some Steps Toward a Central Theory of Ecosystem Dynamics. Comput. Biol. Chem. 27, 532–0. doi: 10.1016/S1476-9271(03)00050-1
Ulanowicz R. E. (2004). Quantitative Methods for Ecological Network Analysis. Comput. Biol. Chem. 28, 312–339. doi: 10.1016/j.compbiolchem.2004.09.001
Ulanowicz R. E., Norden J. S. (1990). Symmetrical Overhead in Flow Networks. Int. J. Syst. Sci. 21, 429–437. doi: 10.1080/00207729008910372
Wang J. Q., Li D., Dong S., Wang K., Tian X. L. (1998). Experimental Studies on Polyculture in Closed Shrimp Ponds. I. Intensive Polyculture of Chinese Shrimp (Penaeus Chinensis) With Tilapia Hybrids. Aquaculture 163, 11–27. doi: 10.1016/S0044-8486(98)00165-3
Wang S. H., Zhang Z. N. (1998). Study of Neanthes Japonica Feeding on Natural Sediment. J. Ocean Univ Qingdao. 28, 587–592 (in Chinese with English abstract).
Williams P. J. L. B. (1981). Microbial Contribution to Overall Marine Plankton Metabolism: Direct Measurements of Respiration. Oceanol Acta 4, 359–364.
Winberg G. G. (1960). Rate of Metabolism and Food Requirements of fishes. Fish. Res. Board. Can. 194, 185–202.
Xu S. N., Chen Z. Z., Li C. H. (2011). Assessing the Carrying Capacity of Tilapia in an in Tertidal Mangrove-Based Polyculture Ecosystem of Pearl River Delta, China. Ecol. Model. 222, 846–856. doi: 10.1016/j.ecolmodel.2010.11.014
Xu G. Z., Zhen C. W., Tang T. D., Li W. J., Liang S. J., Sun Q. H., et al. (1987). Barracuda Culture (Beijing: Chinese Agricultural Press), 11–13, (in Chinese).
Yang H., Ma S., Su Y. P. (2010). Differences of Food Consumption, Metabolism and Growth of the Crab (Portunus Trituberculatus) Fed Fresh, Frozen and Oven-Dried Clam (Ruditapes Philippinarum) Meat. Period Ocean Univ China. 40, 65–70 (in Chinese with English abstract), doi: 10.16441/j.cnki.hdxb.2010.s1.010
Zhai H. J. (2012). Study on Sediment Microbial Community Structure in Different Model Culture Ponds (Ningbo: Ningbo University) (in Chinese with English abstract).
Zhang T. W. (2011). The Model of Carbon Flux in Intensive Penaeid Shrimp Culture and Ecological Cultivation (Qingdao: Ocean University of China) (in Chinese with English abstract).
Zhang K. (2014). Study on Total Organic Carbon Budgets and Bacterial Productivity and Metabolism of Polyculture System of Portunus Trituberculatus, Litopenaeus Vannamei and Ruditapes Philippinarum (Qingdao: Ocean University of China) (in Chinese with English abstract).
Zhang J. H., Feng J. X., Sun S., He Y., Zhang F. (2005). Clearance Rate, Ingestion Rate and Absorption Efficiency of Cultivated Clam Ruditapes Philippinarum in Jiaozhou Bay, China. Oceanol Limnol Sin. 36, 548–555 (in Chinese with English abstract).
Zhang K., Tian X. L., Dong S. L., Feng J., He R. P. (2016). An Experimental Study on the Budget of Organic Carbon in Polyculture Ecosystems of Swimming Crab With White Shrimp and Short-Necked Clam. Aquaculture 451, 58–64. doi: 10.1016/j.aquaculture.2015.08.029
Zhang K., Tian X. L., Dong S. L., Yan F. J., Yang G., Liu R. J., et al. (2015). Variation of Functional Diversity of Microbial Communities in Water of Polyculture of Portunus Trituberculatus, Litopenaeus Vannamei and Ruditapes Philippinarum. Israeli J. aquaculture = Bamidgeh 67, 1–12.
Zhou B. (2015). Research on Grass Carp (Ctenopharyngodon Idella) Integrated Aquaculture Pond Ecosystem: Based on EwE Model (Qingdao: Ocean University of China) (in Chinese with English abstract).
Zhou B., Dong S. L., Wang F. (2015). Trophic Structure and Energy fluxes in a Grass Carp (Ctenopharyngodon Idellus) Cultured Pond Ecosystem. Aquacult. Int. 23, 1313–1324. doi: 10.1007/s10499-015-9886-7
Zhou Y. G., Ma S., Su Y. P., Yan B. L., Wang X. Q., Liu Y. K. (2010). Studies on the Effects of Polyculture of Litopenaeus Vannamei With Portunus Trituberculatus. Period Ocean Univ China. 40, 11–16, (in Chinese with English abstract) doi: 10.16441/j.cnki.hdxb.2010.03.003
Keywords: Portunus trituberculatus, polyculture, trophic structure, dynamics, Ecopath, ecological network analysis
Citation: Feng J, Tian X-L, Dong S-L, He R-P, Zhang K, Zhang D-X and Zhang Q-Q (2022) Temporal Dynamics in Energy Fluxes and Trophic Structure of a Portunus trituberculatus Polyculture Ecosystem During Different Culture Periods. Front. Mar. Sci. 9:873643. doi: 10.3389/fmars.2022.873643
Received: 11 February 2022; Accepted: 09 June 2022;
Published: 14 July 2022.
Edited by:
Øivind Strand, Norwegian Institute of Marine Research (IMR), NorwayReviewed by:
Daniele Brigolin, Università Iuav di Venezia, ItalyXugan Wu, Shanghai Ocean University, China
Copyright © 2022 Feng, Tian, Dong, He, Zhang, Zhang and Zhang. This is an open-access article distributed under the terms of the Creative Commons Attribution License (CC BY). The use, distribution or reproduction in other forums is permitted, provided the original author(s) and the copyright owner(s) are credited and that the original publication in this journal is cited, in accordance with accepted academic practice. No use, distribution or reproduction is permitted which does not comply with these terms.
*Correspondence: Xiang-Li Tian, eGlhbmdsaXRpYW5Ab3VjLmVkdS5jbg==