 Zepeng Li1†Yan Chen2†
 Gang Wang3Jiandong Mu4
 Yanfeng Sun1
 Haolin Yu5Jiangling Xu6,7Ying Yan1Shuangyue Luo1Fuqiang Han1
 Jie Feng5,6,7*
 Zhe Pan1*
- 1Ocean College, Hebei Agricultural University, Qinhuangdao, China
- 2Fisheries Science Institute, Beijing Academy of Agriculture and Forestry Sciences, Beijing, China
- 3Marine Ecological Restoration and Smart Ocean Engineering Research Center of Hebei Province, Department of Science and Technology of Hebei Province, Qinhuangdao, China
- 4Hebei Marine Living Resources and Environment Key Laboratory, Department of Science and Technology of Hebei Province, Qinhuangdao, China
- 5CAS Key Laboratory of Marine Ecology and Environmental Sciences, Institute of Oceanology, Chinese Academy of Sciences, Qingdao, China
- 6North China Sea Marine Forecasting Center of State Oceanic Administration, State Oceanic Administration, Qingdao, China
- 7Shandong Provincial Key Laboratory of Marine Ecological Environment and Disaster Prevention and Mitigation, State Oceanic Administration, Qingdao, China
Introduction: Shellfish play an important role in ecological restoration and as carbon (C) sinks, but studies on their ecological carrying capacity (ECC) and C sequestration potential are sparse.
Methods: In this study, we selected a 57-hectare artificial oyster reef in a typical marine ranching in Bohai Bay, China, to evaluate the ECC and their C sequestration potential of bivalve shellfish, and projecting their impact on functional groups in the system, with an Ecopath with Ecosim (EwE) food web model. We conducted four biological surveys to obtain the biomass measurements, with one conducted in each of the summer, autumn, and winter of 2019 and one in the spring of 2020; and the functional groups included in the surveys comprised fish, cephalopods, crustaceans, snails, bivalve shellfish, annelids, other macrobenthos, meiobenthos, starfish, sea cucumbers, zooplankton, phytoplankton, and detritus.
Results and Discussion: The EwE model prediction results showed that the ECC of bivalve shellfish was established to be 282.66 t/km2, far more than the existing quantity of 187.76 t/km2. Therefore, at present, the ecosystem of the study marine ranching is not yet mature. Moreover, our ecological network analysis parameters indicated that the marine ranching ecosystem will be mature and stable when the bivalve shellfish population reaches its ECC. However, the increase in bivalve shellfish biomass will result in a decrease in the population sizes of species competing for food resources with bivalve shellfish, mainly gobiid fish such as Tridentiger bifasciatus, Tridentiger trigonocephalus, Tridentiger barbatus. Simultaneously, when the bivalve shellfish reach their ECC, 29.23 t of CO2 can be sequestrated by bivalve shellfish, comprising 14.32 t being removed from the ecosystem as prey and 14.91 t being stored on the seafloor through biodeposition.
Conclusion: Therefore, the research demonstrated that, within the scope of ECC, the increasing bivalve shellfish can improve the C sequestration capacity of the marine ranch ecosystem, and effective management of bivalve shellfish in marine ranching can improve the economic benefits and C sink service functions of marine ranching.
1 Introduction
Increasing global greenhouse gas concentrations result in a series of environmental problems, such as global warming, ocean acidification, and extreme weather events (Pachauri et al., 2014; Yu et al., 2021). Coastal wetlands display a powerful carbon sink function, playing an important role in reducing carbon dioxide (CO2) concentration and mitigating global climate change (Duarte et al., 2013). The carbon sequestered by coastal wetlands and seagrass beds is called coastal blue carbon (Zhao and Hu, 2019). During the coastal wetlands, marine ranching is a special offshore ecosystem (Dutta et al., 2019) that can sequester significant carbon (C) and mitigate the greenhouse effect (Shen et al., 2020). Bivalve shellfish is a key component in marine ranching, which represents important marine biological C sink due to high biodeposition, calcification rates (Pan et al., 2019a; Pan et al., 2019b). For example, oyster reefs exhibiting a strong C sequestration capability and serve as remarkable C reservoir (Grabowski and Peterson, 2007). However, the high population density of bivalve shellfish has negative–impacts on marine ecosystems, such as depressing the growth of phytoplankton and deteriorating bottom environments (Velasco et al., 2009). Therefore, it is critical to understand not only the C sequestration potential but also the ecological carrying capacity (ECC) of bivalve shellfish.
Carrying capacity is defined as the maximum biomass of a specific population that the ecosystem can support under specific environmental conditions, such as food and habitat availability (Filgueira et al., 2021). Inglis et al. (2000) classified the carrying capacity of shellfish into four categories: physical, productive, ecological, and social carrying capacity. ECC is the maximum biomass of a target species that does not cause unsustainable impacts on the species or ecosystem (McKindsey et al., 2006). Thus, to assess the ECC of bivalve shellfish, their impact on the ecosystem structure, function, and other functional groups needs to be examined at a holistic level. Food web models provide the means to conduct such research at the ecosystem level, with the Ecopath with Ecosim (EwE) model currently being one of the most popular models (Feng et al., 2022a). This model has been widely applied, for example, to calculate an ECC of 65 t/km2 for Perna canaliculus in the Tasman and Golden Bays (Jiang and Gibbs, 2005), 297 t/km2 for oysters farmed in Narragansett Bay (Byron et al., 2011), and 976 t/km2 for Crassostrea gigas in Sanggou Bay (Gao et al., 2020). Feng et al. (2022a) also used the EwE model to calculate the ECC of Mercenaria mercenaria soft tissue in monoculture and mixed culture ponds as 41.42 g/m2 and 470.00 g/m2, respectively. It assesses the ECC of shellfish based on the principle of trophic dynamics and from the perspective of material and capacity balance, which fully considers the competitive relationship between species and trophic groups (Srithong et al., 2021).
The Bohai Bay, located on the east coast of China, has fertile water quality and abundant germplasm resources. Numerous oyster reefs and shell ridges once existed along its northwestern reaches (Yue et al., 2012), but currently, only patches of oyster reefs remain, distributed in the estuaries and shallows. This decline resulted from the rapid increase in destructive fishing activities and human interference in the coastal areas of the Bohai Bay, coinciding with advancing urbanization (Jin and Deng, 2000). To alleviate this ecosystem decline, the construction of artificial oyster reefs via marine ranching have been implemented at the confluence of the Liuan River and Bohai Bay since 2011. The marine ranching study located in Bohai Bay was recognized as one of the first National Marine Ranching Demonstration Areas in China in 2015. We hypothesized that a high bivalve shellfish biomass may have an adverse effect on the stability of system maturity and the abundance of other species in the region. As a result, the EwE model was implemented in this study to evaluate the ECC of bivalve shellfish in marine ranching areas and to estimate their C sequestration potential. The research results may offer a scientific reference for future assessments of the ecological service function of marine ranching and the sustainable development of the coastal region.
2 Materials and methods
2.1 Study area
The study area was located in Bohai Bay, China (39°11’49.9” N, 118°59’25.3” E) (Figure 1), in which 93,0000 m3 of various artificial reefs had been deployed by the end of 2018, including two artificial oyster reef areas of 200 and 57 ha, respectively. This study focused on the 57 ha oyster reef, for which construction was initiated in December 2017 and the reef was completed in June 2018. The artificial reef comprises granite stones or caisson-components consisting of reinforced concrete structures. It provided the habitat for a large number of Mytilus edulis to attach. The water depth in this area is 8.22 m, the average annual water temperature is 13.22°C, the average current velocity is 0.28–0.37 m/s, and there are no macroscopic features.
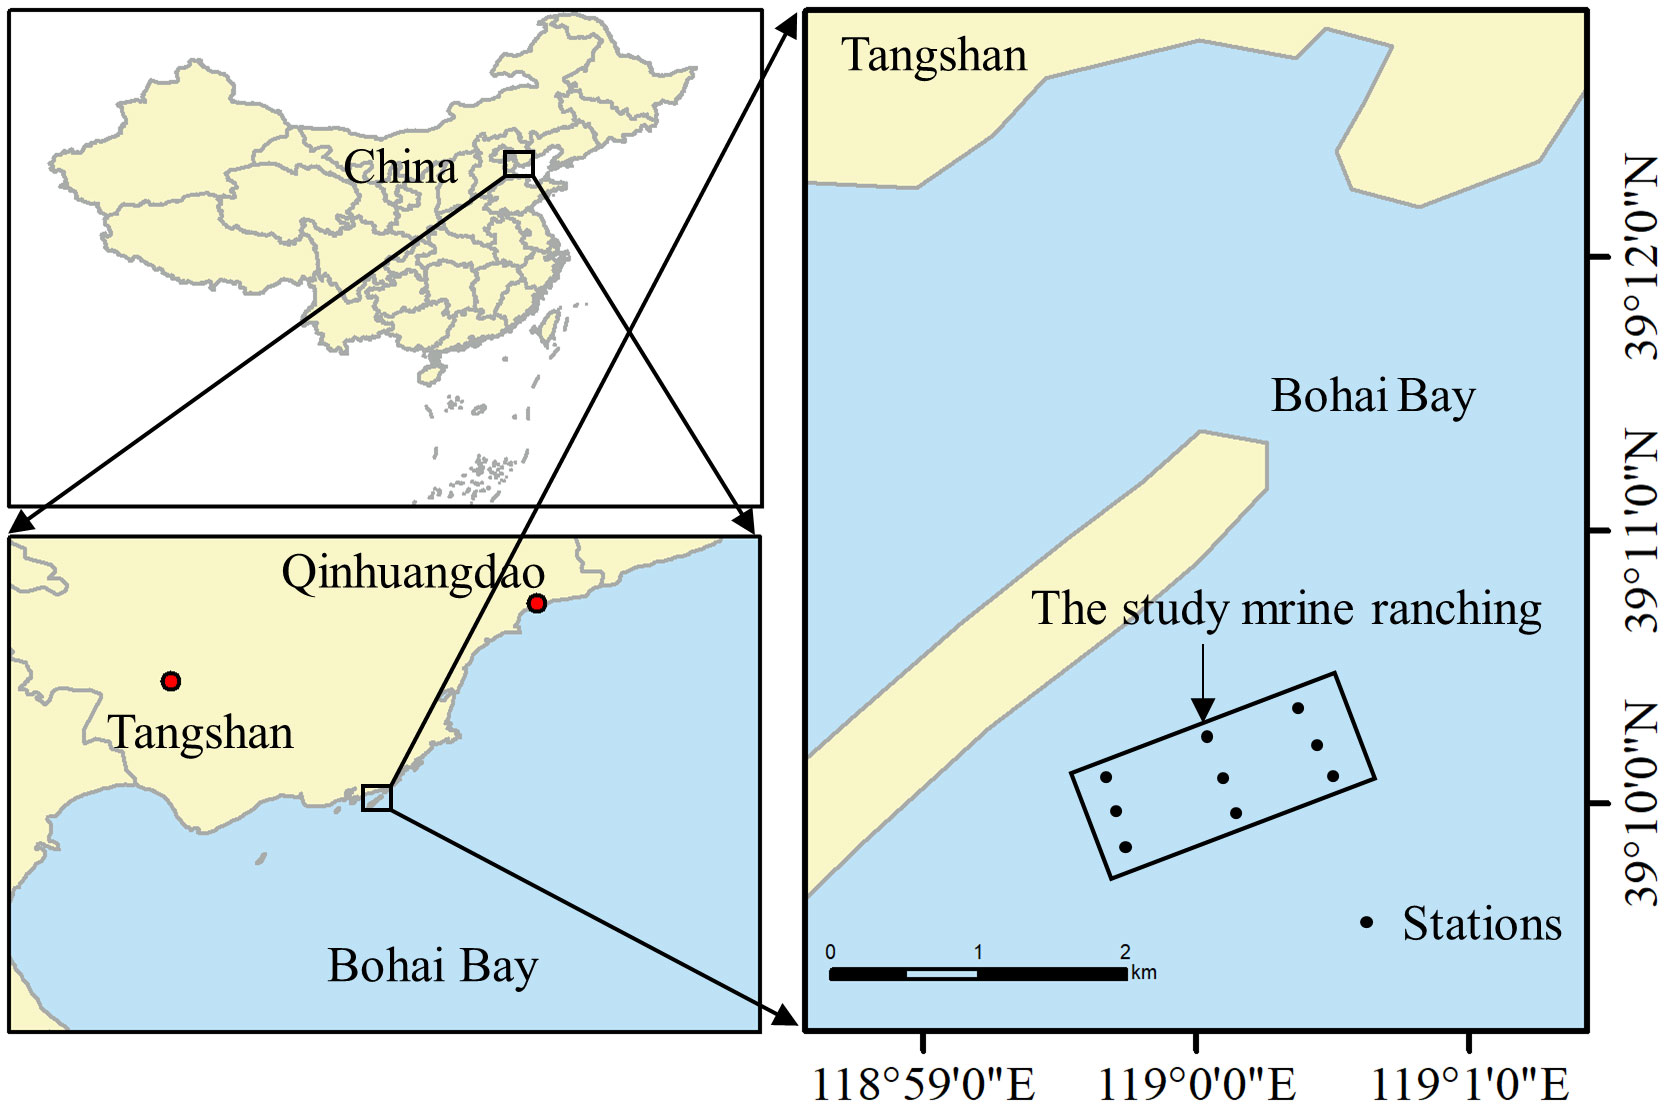
Figure 1 Geographical location of the artificial oyster reef area in the study marine ranching in Bohai Bay, China.
2.2 Ecological model construction
2.2.1 Ecopath model construction
The Ecopath model is commonly used to quantitatively estimate mass transfer and energy flow in an ecosystem (Christensen and Walters, 2004; Christensen et al., 2005). According to thermodynamic theories, the energy input and output of a certain biological functional group should be balanced, with productivity equaling the sum of mortalities (Equation 1). Another equation was used to determine the inner mass balance of the group (Equation 2), where the consumption (Q) of each group was equal to the sum of the production (P), respiration (Ri), and unassimilated food (Ui) of the group. The equations are as follows:
where Bi is the biomass of functional group i, (P/B)i is the production ratio, (Q/B)i is the consumption ratio, EEi is the ecotrophic efficiency (the proportion of production utilized in the system), DCij is the proportion of prey i in the diet of predator j, Yi is the fishery mortality, BAi is the biomass accumulation rate, and Ei is the net migration rate. In the parameter input process, Bi, (P/B)i, (Q/B)i, and DCij are required. If one of the first three values is missing, the corresponding EE value can be designated. In addition, Ei and catches are also required.
2.2.2 Ecosim dynamic simulation
Ecosim is a time-scale based dynamic model based on Ecopath (Christensen and Walters, 2004). It incorporates a time-dynamic aspect by varying the Ecopath model over time increments, simulating systemic response changes over the time series. The equation used is as follows:
where dBi/dt is the rate of change in biomass, gi is the net growth efficiency, Qji is the consumption rate of function group j to function group i, Ii is the emigration rate, Fi is the fishing mortality rate, Moi is the non-predatory natural mortality, ei is the move-in rate, and Bi is the biomass of functional group i (Christensen and Walters, 2004).
2.3 Input data
2.3.1 Division of functional groups
We constructed 21 functional groups based on the ecological habits, economic values, and ecological roles of the marine ranching species in the study area. Among them, the bivalve shellfish comprised C. gigas and M. edulis, accounting for 86.00% and 14.00% of the bivalve shellfish biomass, respectively. The constructed functional groups covered the main energy flow in the 57-ha oyster reef area (Table 1).

Table 1 Division of functional groups and their species composition in the study marine ranching ecosystem model in Bohai Bay, China.
2.3.2 Source of parameters
The units for system energy flow in our EwE model were all wet-weight units (t/km2). Biomass measurements were obtained via four biological surveys (summer: June 2019, autumn: September 2019, winter: December 2019, spring: March 2020), in which fish and cephalopod biomass were estimated mainly from trap and gill nets, while trawling and underwater video footage were used for corrections. Fishing was conducted for one 72 h period during each of the four surveys; the nets used had a mesh size of 2 cm with the section, length, width, and height dimensions of a net being 5 m, 8 m, 30 cm, and 20 cm, respectively. Fish biomass was derived using the method described by Li et al. (2021). Macrobenthic biomass was estimated by combining the videos and SCUBA grasping. Bivalve shellfish were collected from the oyster reefs by SCUBA diver using 0.5×0.5 m quadrats, with the locations of 3-6 replicates being evenly distributed in each season. Meiobenthos fauna was sampled at each site using box samplers (0.05 m2). Zooplankton samples were obtained via vertical towing of a plankton net with a mesh size of 169 μm. Phytoplankton biomass was calculated from chlorophyll readings as measured using standard procedures described by Parsons et al., 1984. Detritus was obtained as the organic matter in the water column by filtering 1 L of subsurface and bottom seawater through a mesh size of 77 µm. Physical factors were measured in situ using a YSI meter (EXO2, Yellow Springs, OH, United States).
The P/B (production ratio) of fish is equal to the total instantaneous fish mortality value, which is equal to the sum of the natural mortality (M) and fishing mortality (Palomares and Pauly, 1989). The calculation formula is as follows:
where Y is the catch, B is the biomass, K is the curvature of von Bertalanffy growth equation, L∞ is the asymptotic body length (total length, cm), and Tc is the average water temperature (°C). The P/B of invertebrates is calculated as follows (Tumbiolo and Downing, 1994).
where B is the biomass and W is the mean individual mass. The formula used to calculate the consumption value (Q/B) is as follows:
where Winf is the asymptotic weight (g), T is the average annual water temperature in the water body (T = 1000/K), A is the ratio of caudal fin length to width of fish (, where hc is the height and s is the surface area of the caudal fin), h is the set index of variable food types (1 for omnivorous, 0 for carnivorous and herbivorous), and d is the dummy variable (d = 0 for herbivorous and carnivorous fish, and d = 1 for detritivorous fish).
The P/B and Q/B values of other functional groups were derived from relevant studies conducted at the same latitude and in adjacent seas (Lv et al., 2018). Food composition matrices were obtained by gastric content analysis and by reference to studies in nearby seas (Zhang, 2018) and the FishBase database (www.fishbase.de). (The edibility matrix is provided in Table S1, and the specific parameter sources are listed in Table S2).
The vulnerability value in Ecosim determines the trophic control relationship between the predator and prey (i.e., upstream, downstream, and intermediate effects). In this study, we referred to the calculations by Kluger et al. (2016). The formula used to calculate the vulnerability value is as follows:
where TLi is the trophic level of functional group i. The vulnerability takes values range from 0 to 1, where 0.1–0.3 indicates a downward control, 0.3 a mixed control, and 0.3–1 an upward control effect (Christensen and Walters, 2004). The range of vulnerability in Ecosim is 1 to ∞; thus, vi must be converted to vnew:
2.4 ECC estimation and dynamic simulation
To reflect a balance and stability of the marine ecosystem in the Ecopath model, the biomass of economically and ecologically important organisms in the ecosystem is gradually increased until the ecotrophic efficiency (EE) value of any group is 1; at this point, the ECC of that species group is obtained (Byron et al., 2011).
Three scenarios were investigated through dynamic simulation: maintaining the status quo (current) in terms of population size, reaching the ECC, and exceeding the ECC by 20%. The target species stocking expansion was simulated for a period of 30 years under scenarios of differing final enhancement biomass, which was implemented through a linear increase in stock from 2 to 6 years and then held constant for the remaining 24 years. The time series of changes in the relative biomass was extracted for each simulated scenario. The C budget parameters of both C. gigas and M. edulis were obtained from Ren (2014).
2.5 Model equilibrium and uncertainty analysis
The Ecopath model equilibrium was evaluated according to the parameters employed by Heymans et al. (2016). A model was considered balanced when it satisfied the following three requirements: (1) The EE values were less than 1; (2) the nutrient conversion efficiency P/Q was between 0.1 and 0.3, with potentially lower and higher values for top predators and fast-growing species, respectively; and (3) the net nutrient conversion efficiency of all functional groups were less than 1.
To test whether the parameters modified by balancing were in accordance with the basic rules of ecosystem ecology, P/B and Q/B pre-balancing between taxa and trophic levels was performed using the PREBAL module (Link, 2010).The prerequisites were: (1) functional group biomass should span 5–7 orders of magnitude; (2) the slope of functional group biomass on a logarithmic scale should decrease by 5–10% across all taxa relative to the trophic arrangement; and (3) P/B and Q/B across taxa and trophic levels should decrease with increasing trophic levels. The results of the pre-balance analysis are shown in Supplementary Figure 1.
For the B, P/B, Q/B, and DC values, the spectrum index can evaluate the overall quality of the ecosystem model by assigning uncertainty indices according to the data source and combining the uncertainty of each functional group. The sensitivity of the Ecosim results to the Ecopath input parameters (B, P/B, and Q/B) was evaluated by performing 500 Monte Carlo simulations of these input parameters, where each parameter was set to vary by 10%.
2.6 Ecological network analysis
An ecological network analysis plug-in was built into the EwE software for direct analysis (Christensen and Walters, 2004), and a set of ecological indices described the structure and function of ecosystems. The following indicators were used to characterize the overall ecosystem: total system throughput (TST), total primary production (TPP), total biomass (TB), and total respiration (TR), which describe the overall activity and size of the ecosystem (Latham, 2006; Ortiz et al., 2015). We assessed the ratios of TPP/TR and TPP/TB as important indicators of ecosystem stability and maturity (Odum, 1969). Finn’ s cycling index (FCI), connectance index (CI), systematic omnivory index (SOI), and finn’s mean path length (FMPL) expressed the complexity of food webs (Finn, 1976; Christensen and Walters, 2004; Libralato, 2013). Ascendency (A) expressed the development and maturity of the ecosystem, and overhead (O) indicated the ability of the ecosystem to resist disturbances (Ulanowicz, 1986). Entropy (H) indicated the amount of energy interaction between all groups of organisms in the system, and the average degree of system energy flow (Baird et al., 2007). Average interaction information (AMI) represented the determinism of the degree of connectedness (i.e., energy flow), among the biological groups of the system (Ulanowicz, 2004). Trophic transfer efficiency (TE) is the ratio between, on the one side, the sum of the exports and the flow transferred to the next TL, and, on the other side, the throughput on the TL; this study used a mean TE for TL > 2. The Shannon diversity index (SDI) was assessed as a relative measure of biodiversity. Finally, radar plots were drawn to show the magnitude of the changes in the ecological network finger table and to describe the changes in energy transfer before and after oyster value addition using Lindeman energy flow diagrams.
3 Results
3.1 Ecological model quality analysis
The PREBAL diagnostic results were consistent with the general trend displayed by the model (Heymans et al., 2016), with the high biomass of bivalve shellfish being the result of the construction of an artificial oyster reef. Phytoplankton and zooplankton displayed a high P/B ratio because they were the main food sources for the bivalve shellfish (Supplementary Figure 1).
The confidence index of the Ecopath model was 0.603, indicating that the input data was reasonable and provided a good confidence level. The results of the Monte Carlo simulations showed that the optimal input parameters for B, P/B, and Q/B were consistent with our actual input parameters and did not change, except for the bioaccumulation value for Stichopus japonicus, which should be raised to 0.20.
3.2 Evaluation of the ECC of bivalve shellfish
The output parameters of the Ecopath model are presented in Table 2. The highest biomass in the marine ranching ecosystem was that of bivalve shellfish (187.76 t/km2), followed by detritus (40.00 t/km2), while Hexagrammos otakii fish had the lowest biomass (0.20 t/km2). In this ecosystem, gobiid fish and annelids shared the highest EE value of 0.97; Starfish had the lowest EE value (0.00), followed by skeleton shrimp (0.11). In our modeling of bivalve shellfish ECC, the EE of phytoplankton was equal to1 when the bivalve shellfish biomass reached 282.66 t/km2. When the bivalve shellfish biomass was increased to 339.19 t/km2, the EE value of phytoplankton was greater than 1, and the Ecopath model was unbalanced (Table 3). As a result, it was concluded that the ECC of bivalve shellfish in the study marine ranching is 282.66 t/km2.
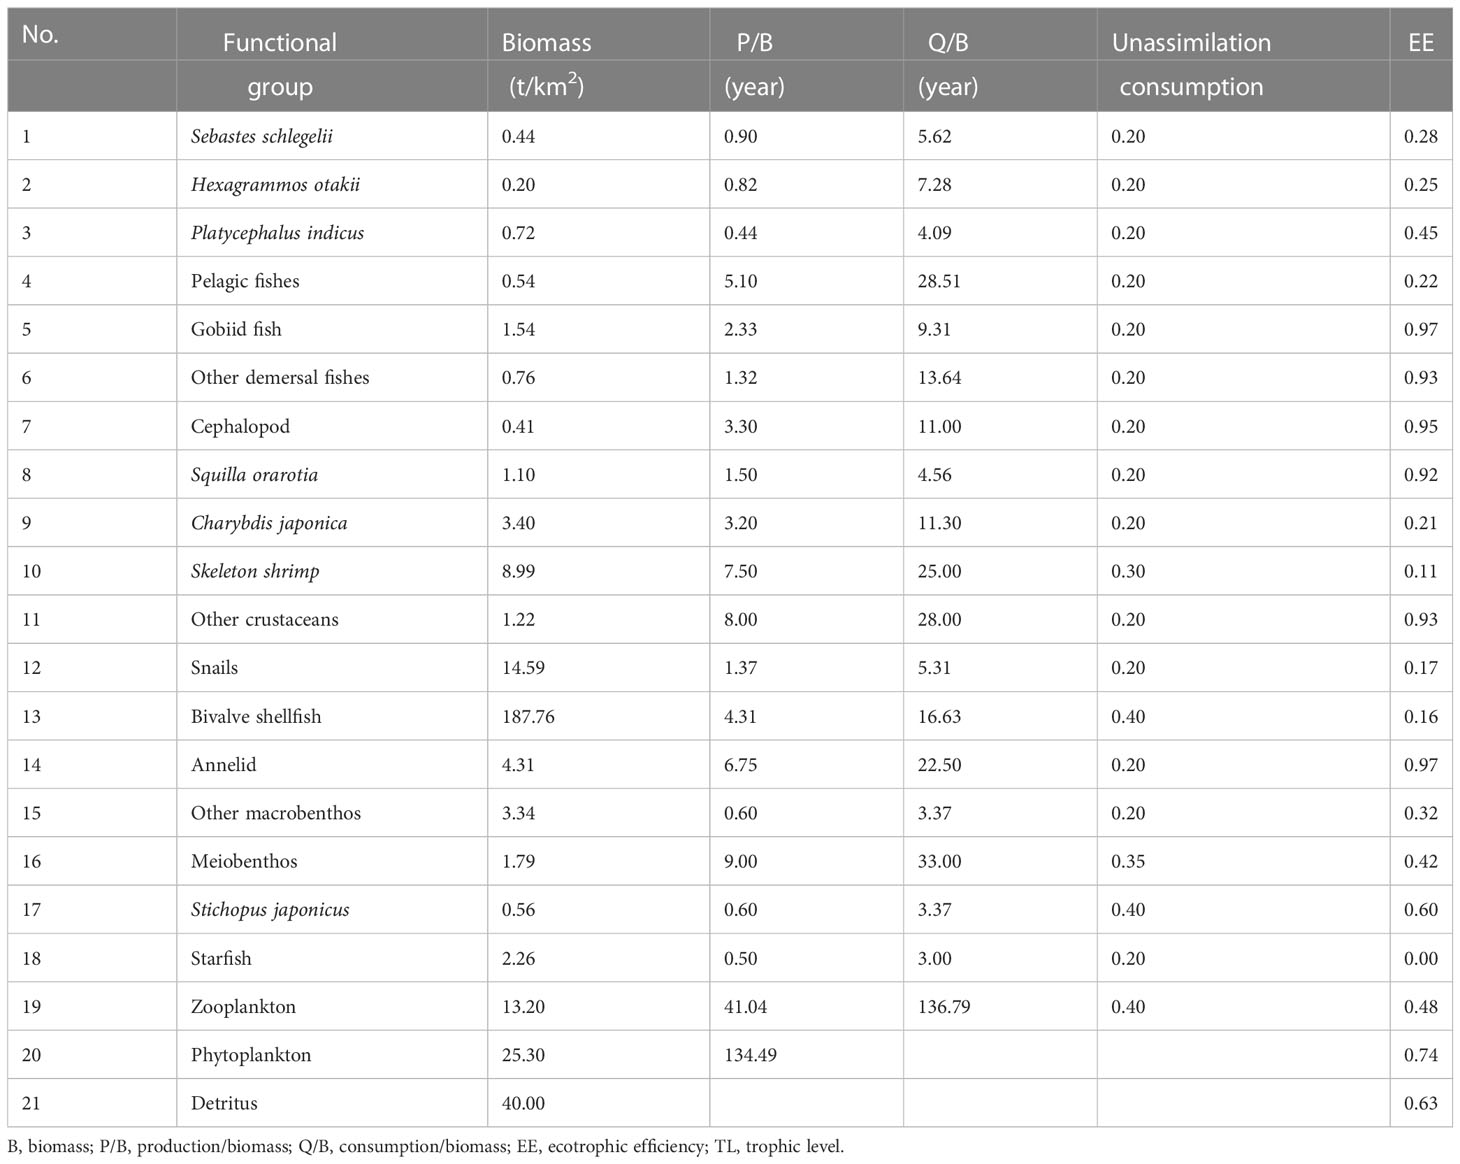
Table 2 B, P/B, Q/B, EE, and TL of the study marine ranching ecosystem in Bohai Bay, China.
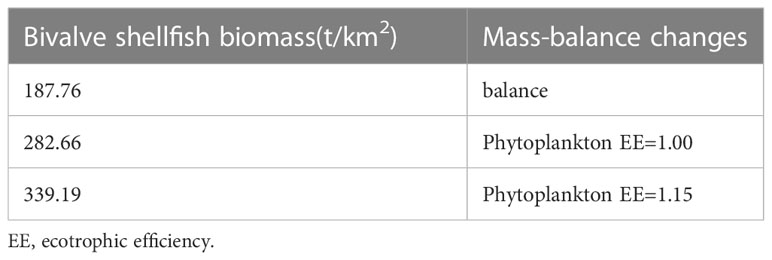
Table 3 Variation of other parameters in estimating the ecological carrying capacity of bivalve shellfish using the Ecoapth model.
3.3 Analysis of the overall characteristics of the study marine ranching ecosystem
The TLs of each functional group in the study marine ranching ecosystem are presented in Table 4. Cephalopods had the highest TL (4.15), followed by the fish Platycephalus indicus (3.77) and Sebastes schlegelii (3.58). The energy transfer in the marine ranching of the study marine ranching was mainly concentrated in TL I and TL II, with the highest energy throughput of detritus in TL I and the highest energy throughput of bivalve shellfish in TL II.
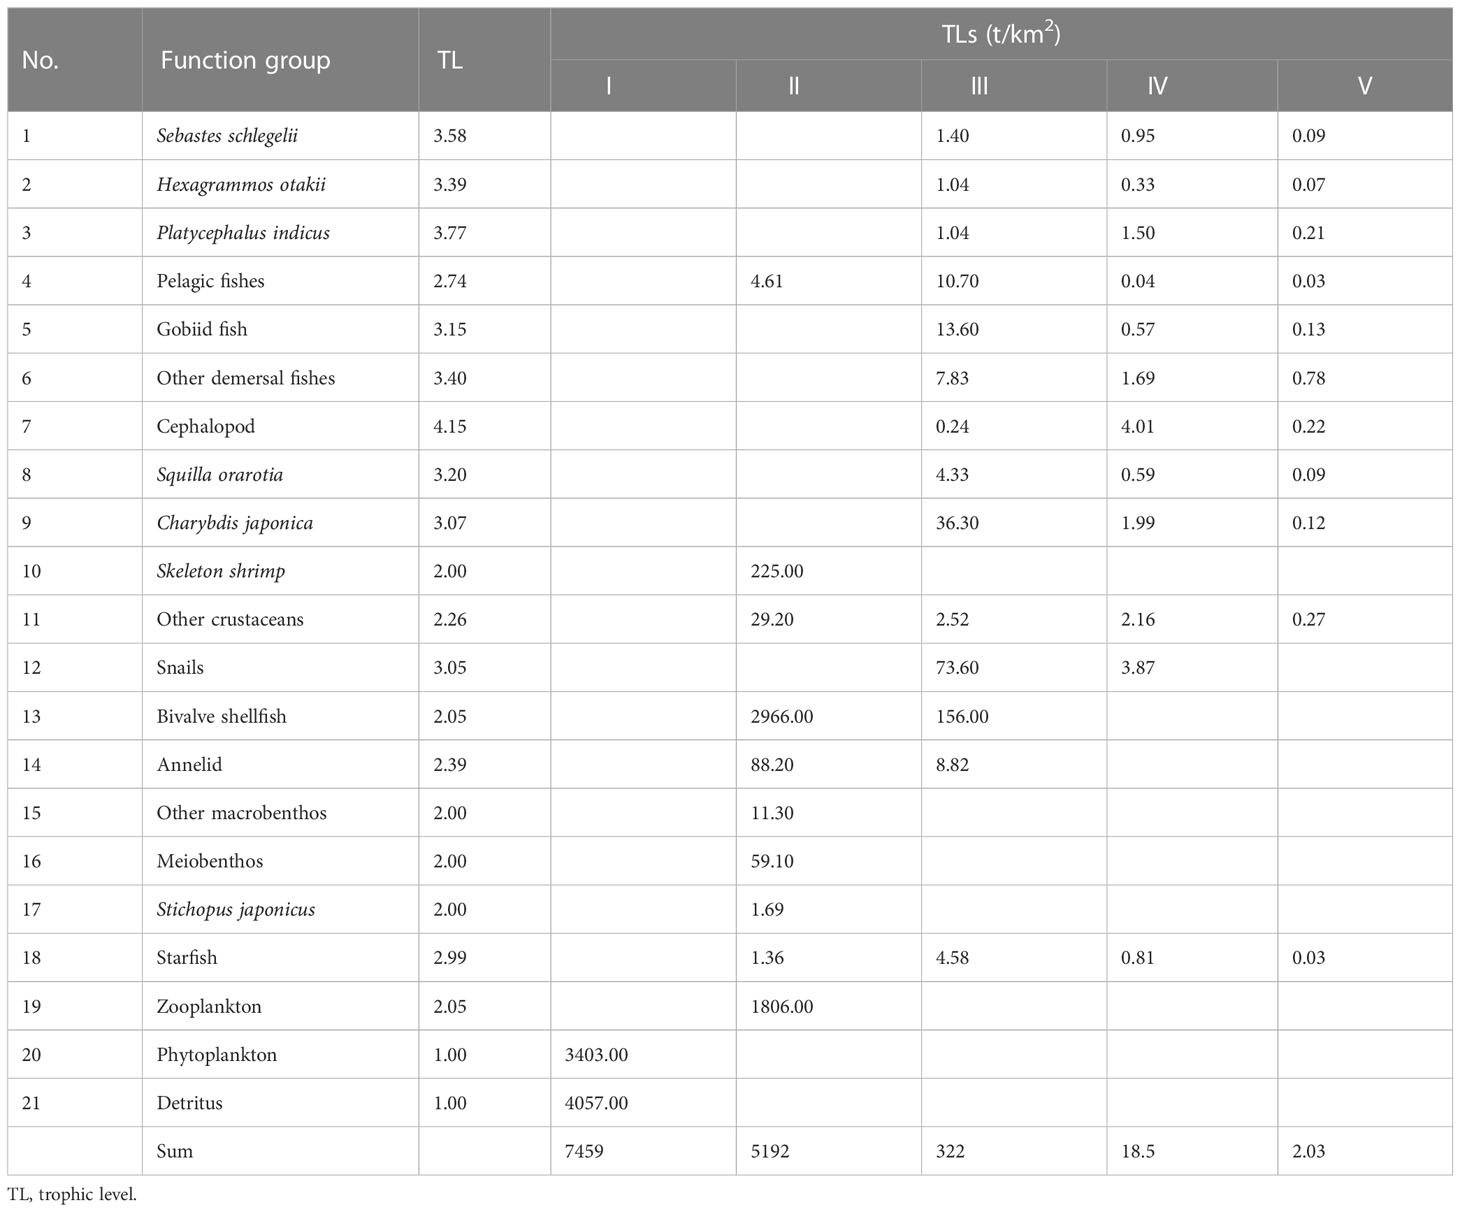
Table 4 Trophic flow matrix of the study marine ranching ecosystem according to model groups and TLs.
Radar plots of the ecological network analysis showed that system parameters responded to different degrees as the biomass of bivalve shellfish was simulated to increase (Figure 2). The TST, TB, TR, and TPP (which characterize the system size) showed an increasing trend, with the most obvious increasing parameter being TB. Among the parameters characterizing system maturity and stability, TPP/TR, TPP/TB, H and O/C decreased, whereas FMPL, FCI, A/C, and AMI increased. SOI and CI did not change. We also found that TE, which describes energy transfer, and SDI, which characterizes system biodiversity, showed decreasing trends (see Table S3 for specific parameters).
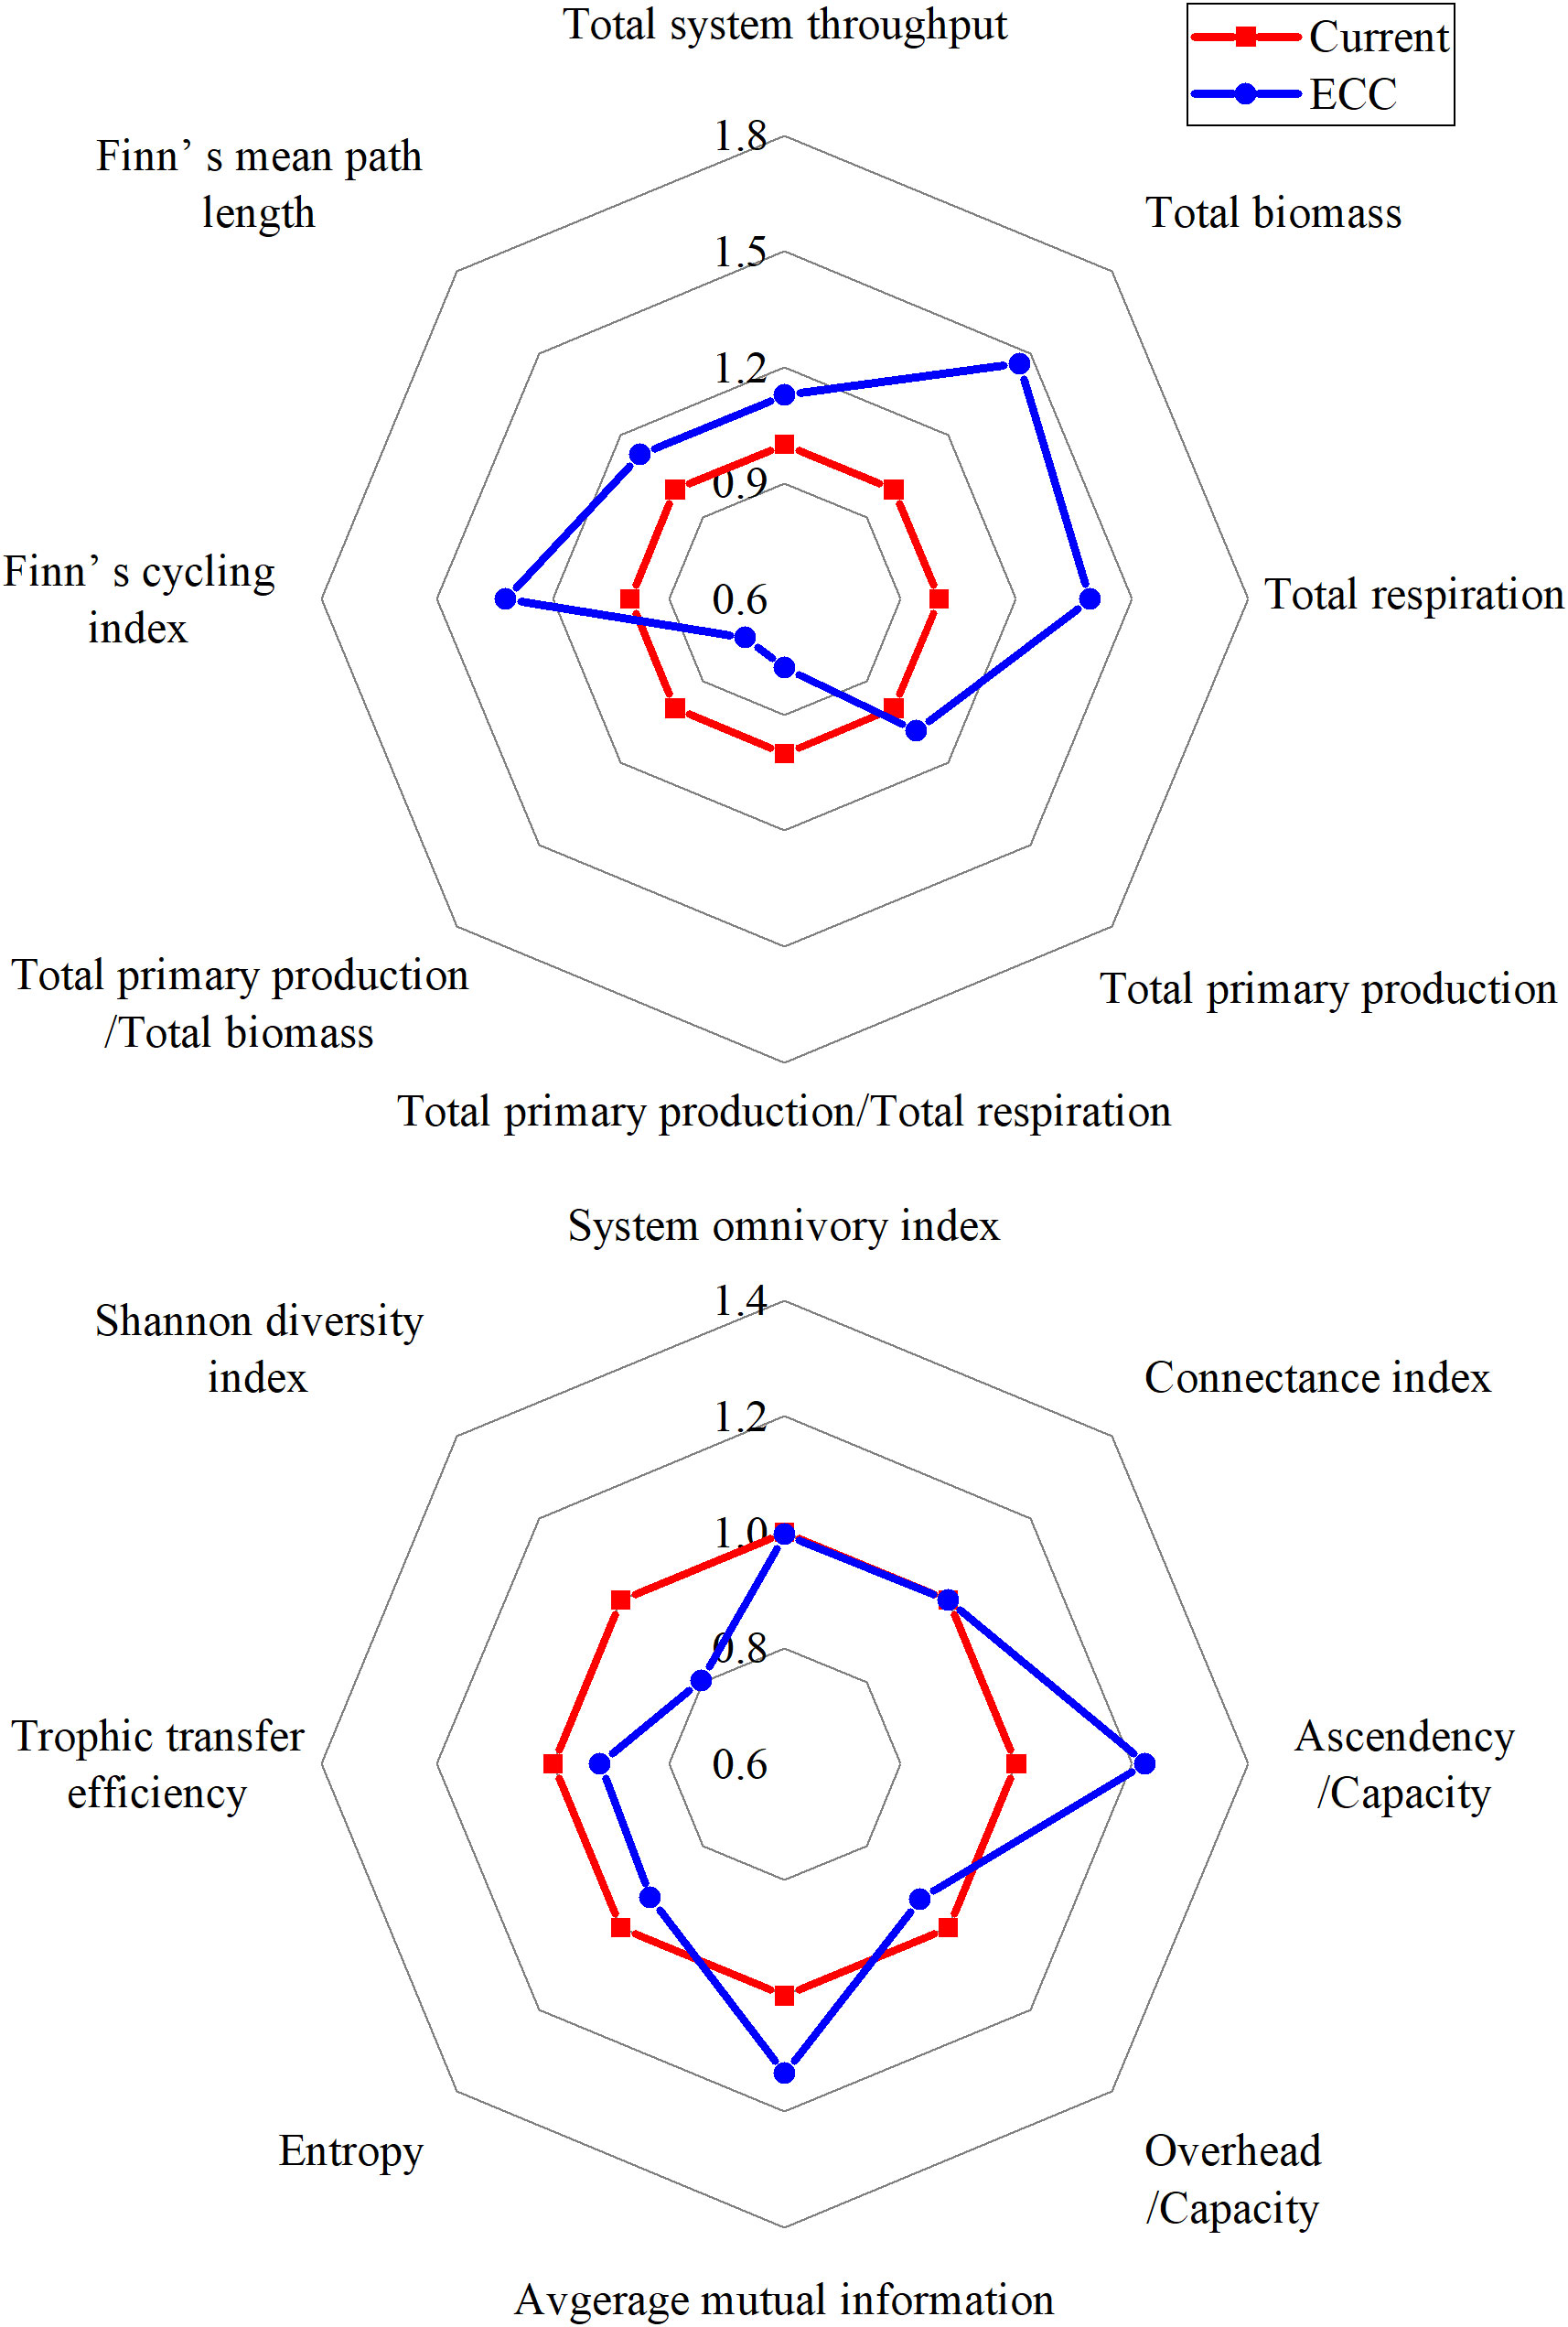
Figure 2 Radar plots show the relative changes in the analyzed indices of ecological forgetfulness for the two scenarios (current, ECC) predicted according to the EwE model. ECC, ecological carrying capacity; EwE, ecopath with ecosim.
The Lindeman energy flow diagram (Figure 3) revealed that the total energy transfer efficiency of the system decreased as the bivalve shellfish biomass increased, but the transfer efficiency of primary producers and detritus to TL II increased, where primary producers were elevated more than detritus. There was a slight decrease in TL II III and TL III IV.
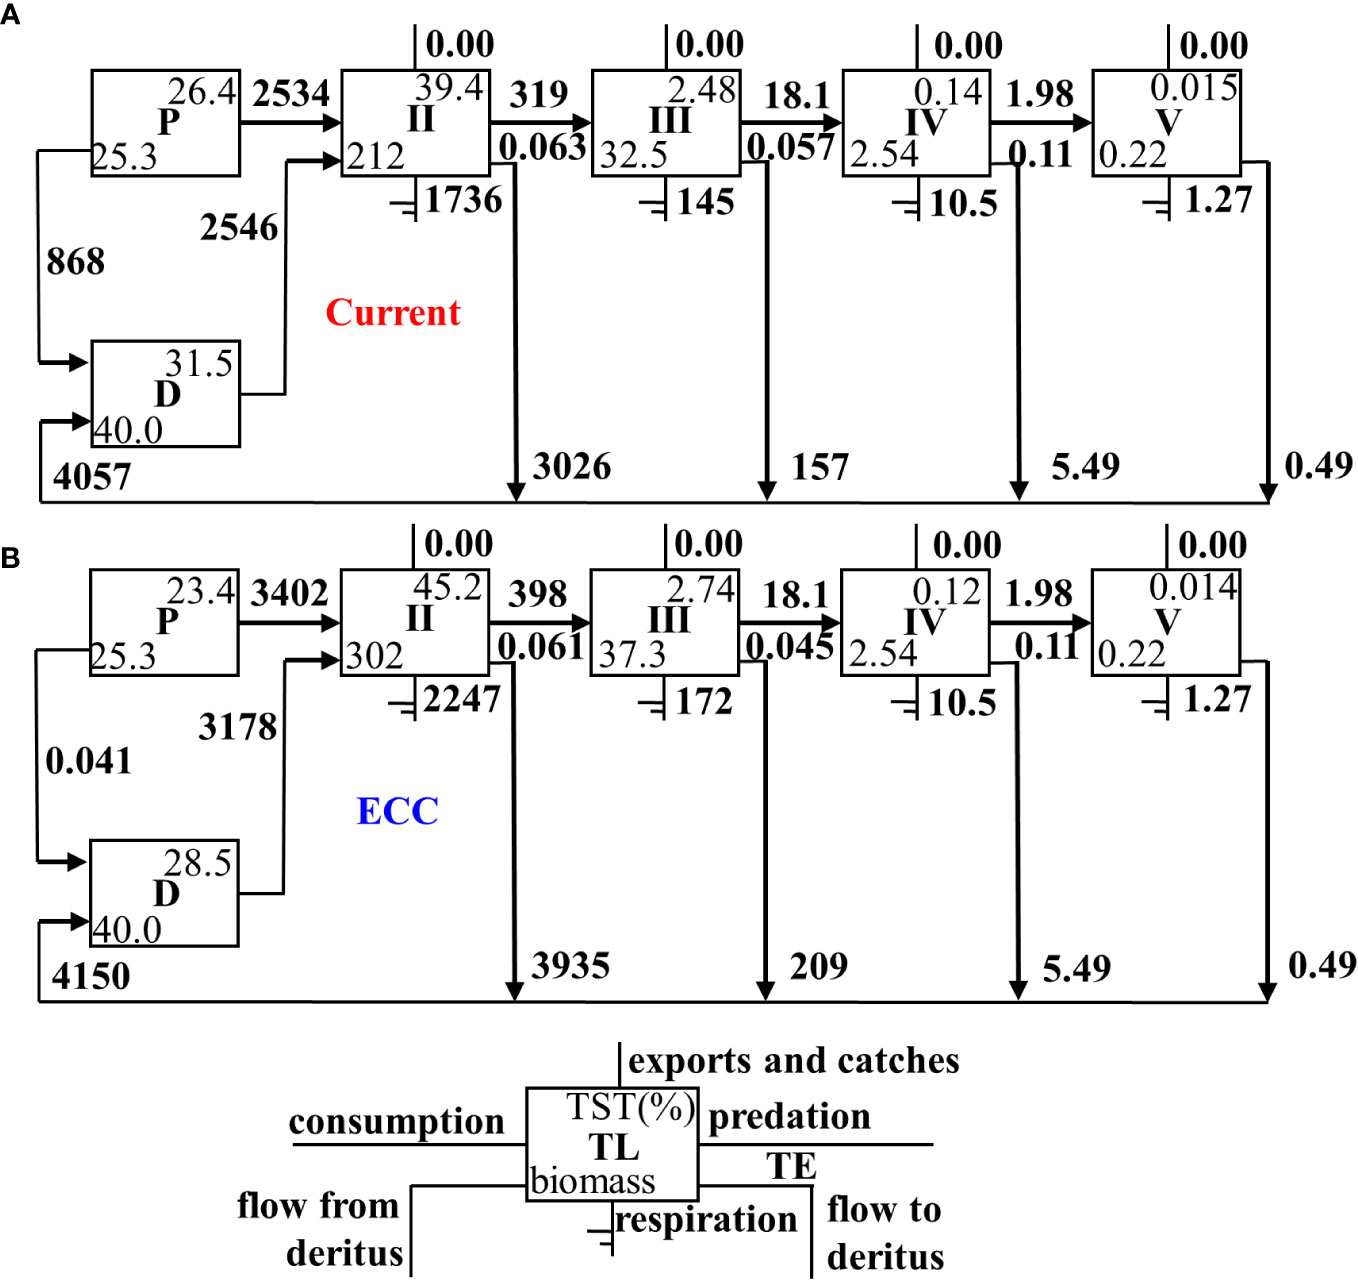
Figure 3 Lindeman energy flow diagram between trophic levels for two scenarios for (A) current and (B) ECC. ECC, ecological carrying capacity; D, detritus; P, primary producers; TL, trophic level; TE, transfer efficiency; TST, total system throughput.
3.4 Effect of bivalve shellfish proliferation on other functional groups
The Ecosim dynamic simulations showed that the other functional groups were affected to varying degrees by increasing bivalve shellfish biomass in our three scenarios (Figure 4). As bivalve shellfish proliferated to their ECC, the biomass of H. otakii, pelagic fishes, gobiid fish, skeleton shrimp, annelids, other macrobenthos, meiobenthos, S. japonicus, zooplankton, phytoplankton, and detritus decreased. The most severe negative effect was observed for gobiid fish, which showed a 99.38% reduction in biomass compared in the 10th year of the simulation that continued to decrease. The biomass of phytoplankton, the main food source of bivalve shellfish, did not fall below 85.00% of the initial biomass by the end of the simulation. The biomass with the highest increase was that of snails, with a maximum fold change of 7.18.
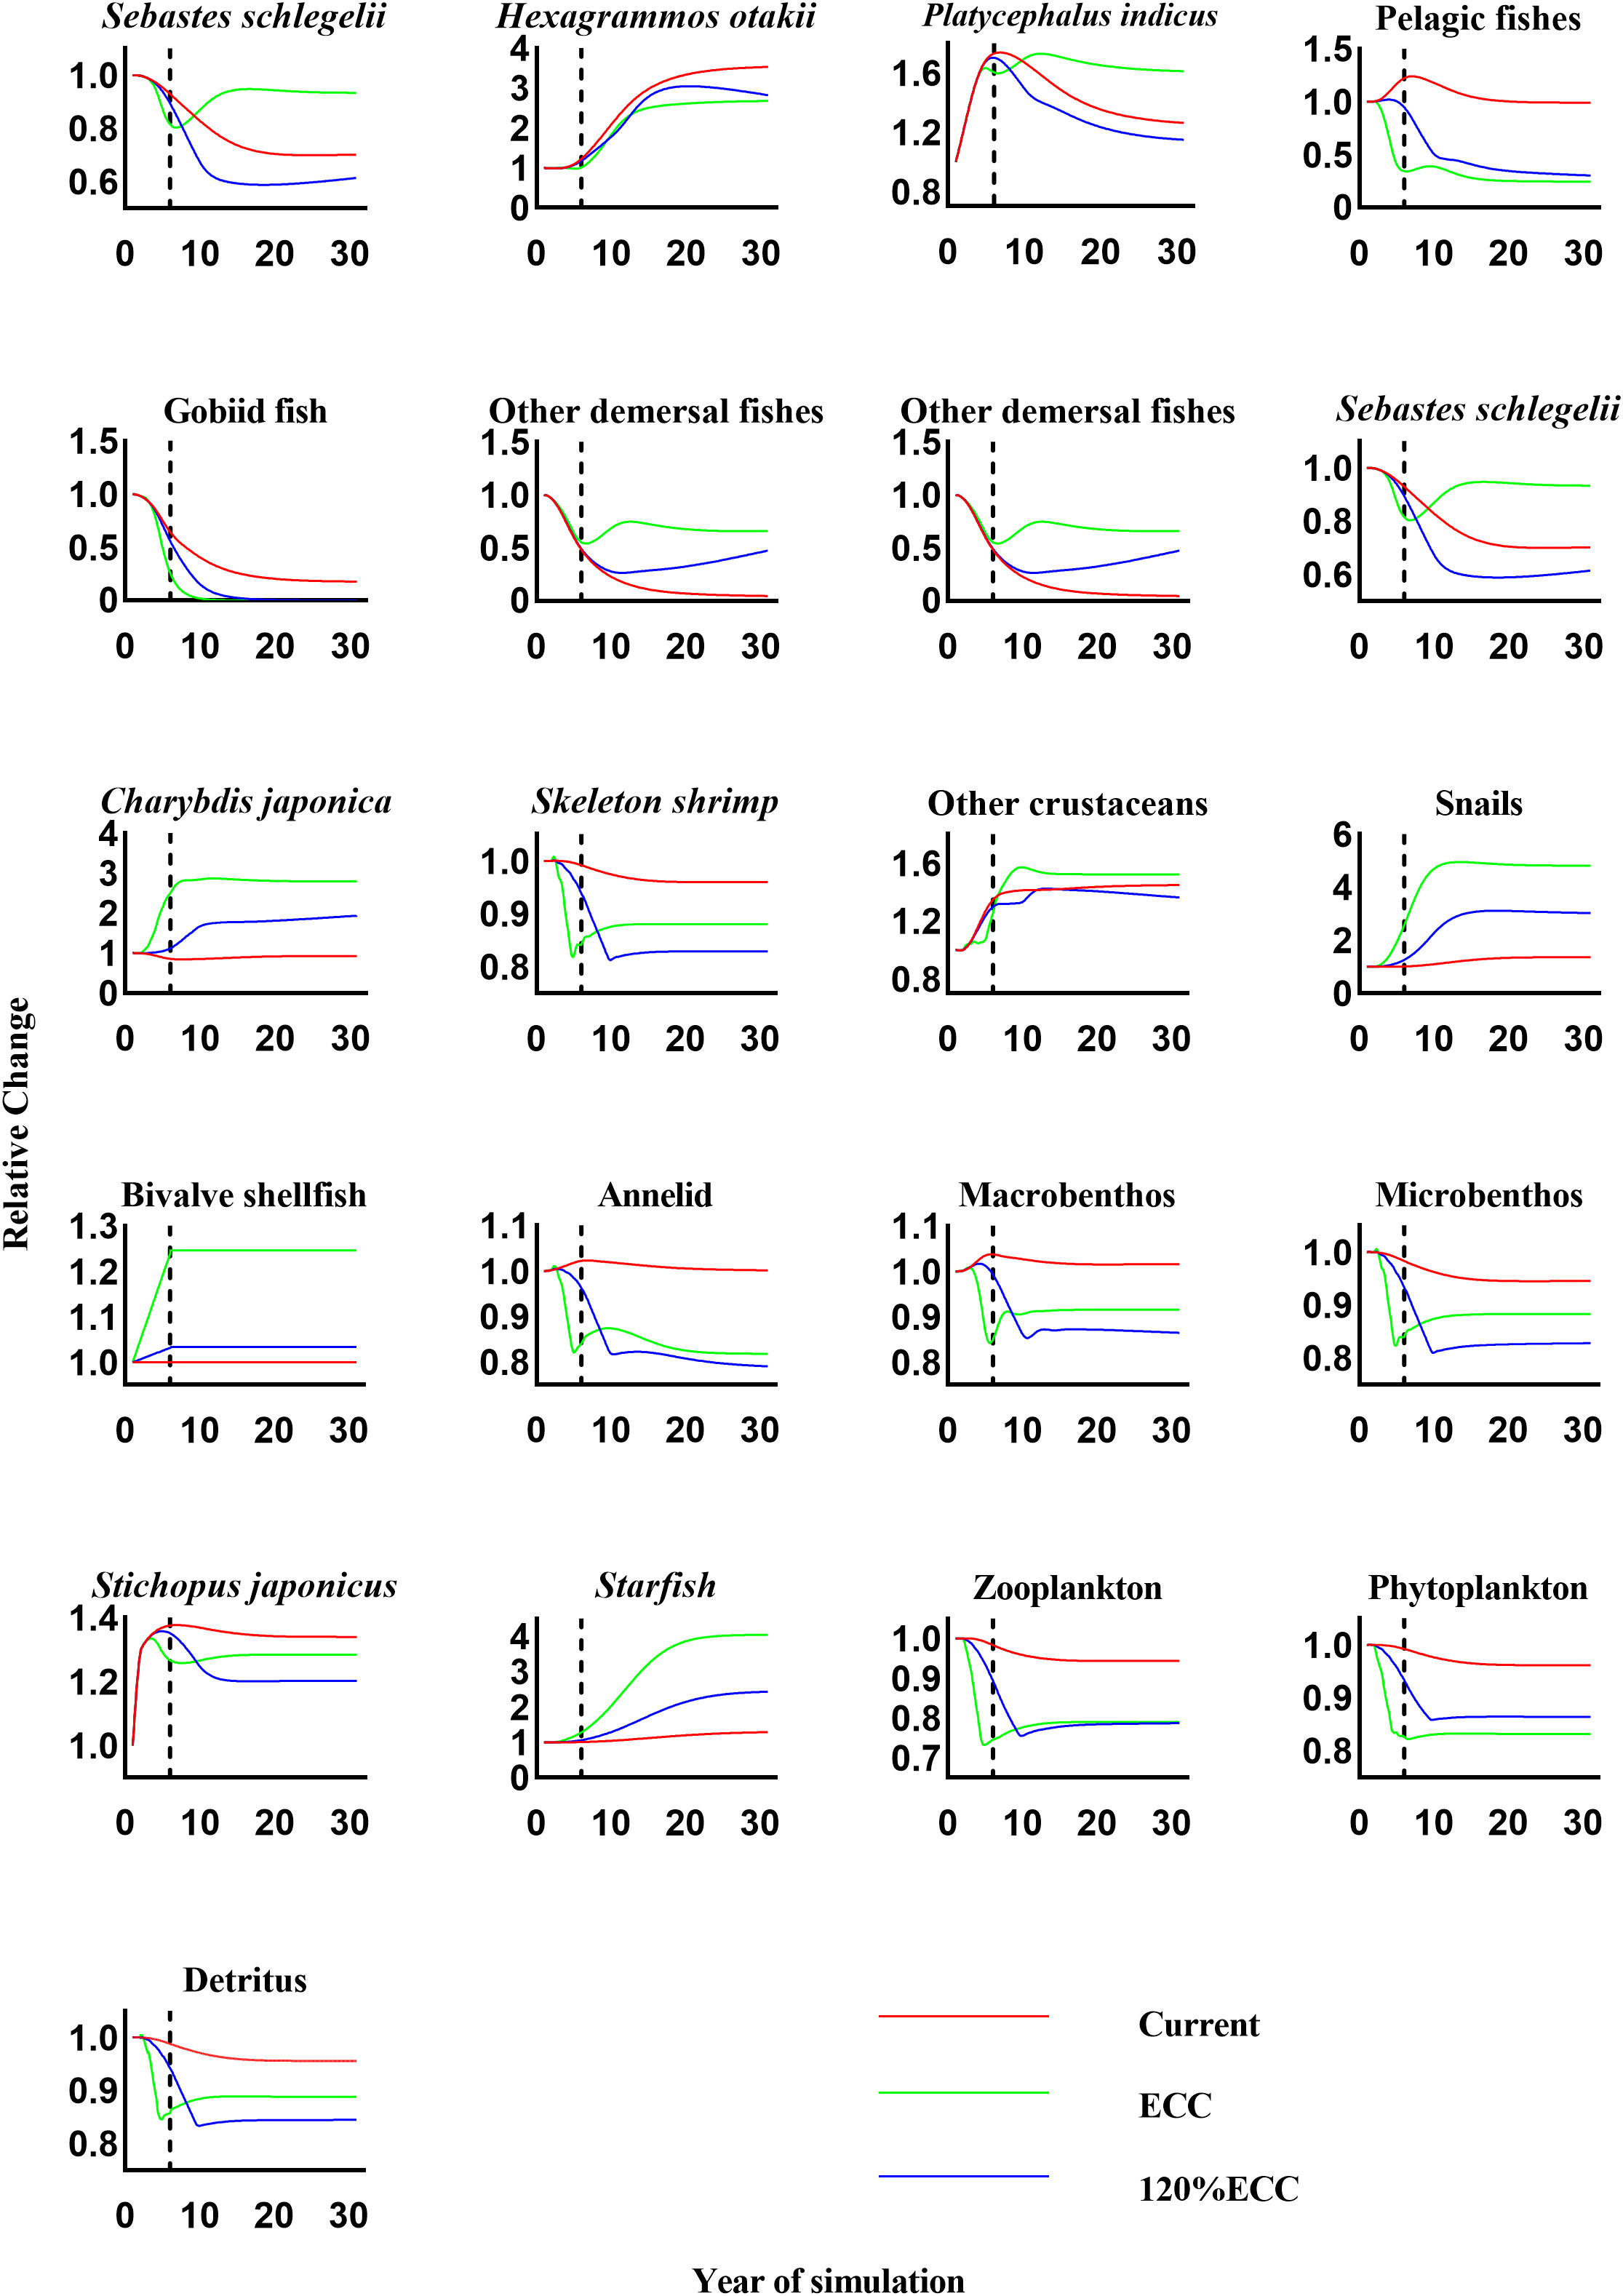
Figure 4 The relative changes in biomass of each functional group under three scenarios (current, ECC, and 120% ECC) of bivalve biomass augmentation in the study marine ranching ecosystem model were predicted. The biomass of bivalves was kept constant after the dashed line. ECC, ecological carrying capacity; 120%ECC, 120% ecological carrying capacity.
When the bivalve shellfish biomass was simulated to exceed their ECC by more than 20%, the biomass of skeleton shrimp, annelids, other macrobenthos, meiobenthos, S. japonicus, and detritus showed the opposite response to the scenario under bivalve shellfish proliferation to ECC; the biomass of bivalve shellfish decreased when they proliferated to ECC but increased when they proliferated to 120%ECC. By the end of the simulation, the biomass of other macrobenthos, meiobenthos, and S. japonicus exceeded that of scenario 1. Biomass changes in the remaining functional groups were consistent with those observed under bivalve shellfish proliferation to ECC.
3.5 C budget levels of individuals and populations of bivalve shellfish
During one growth cycle (360 d), one C. gigas individual ingested 14.97 g of C, of which 22.19% was stored on the seafloor through biodeposition, 26.92% was removed from the water through harvesting (with 89.33% of this amount being used for shell formation), and 50.89% was released into the water through respiration, calcification, reproduction, and excretion. Over the same period, one M. edulis ingested 9.19 g of C, of which 38.10% was stored on the seafloor through biodeposition, 11.49% was harvested from the water (with shell formation accounting for 79.25% of the C usage), and 50.41% was released into the water through respiration, calcification, reproduction, and excretion (Figure 5).
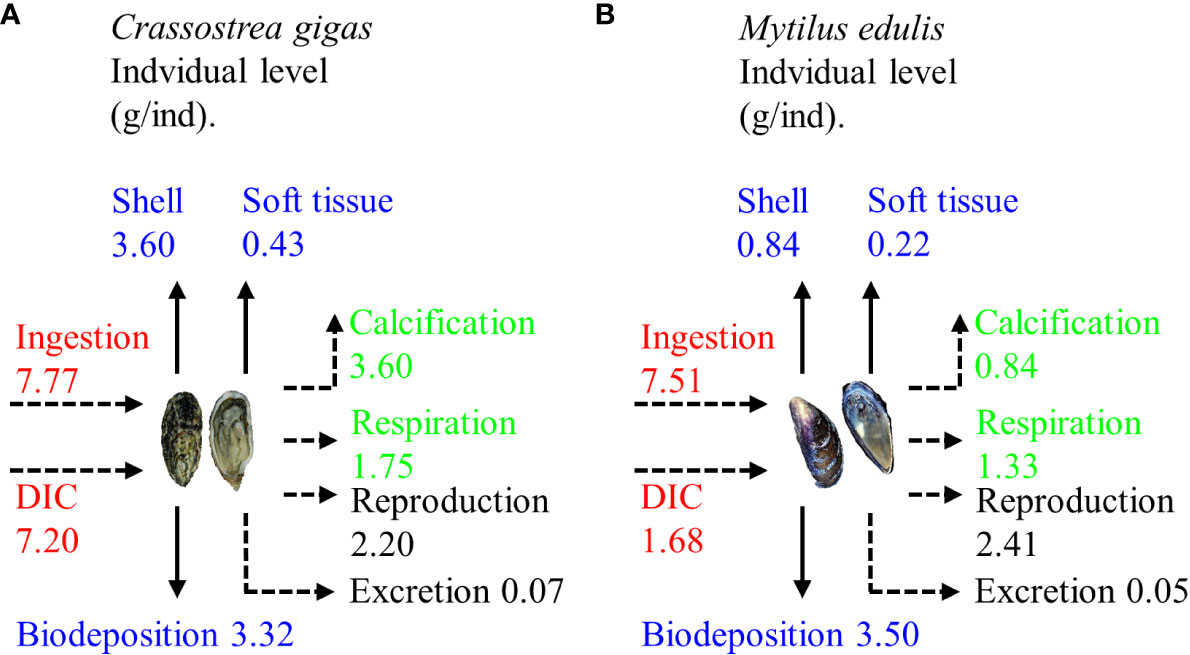
Figure 5 Carbon budget in one growth cycle of (A) Crassostrea gigas and (B) Mytilus edulis (Modified from Ren, 2014). DIC, dissolved inorganic carbon.
The average wet weight of C. gigas and M. edulis was 42.71 ± 6.08 g and 19.11 ± 3.20 g, respectively. Based on the total bivalve shellfish biomass in the study area (187.76 t/km2), these values correspond with population sizes of 2.16 million and 0.79 million for C. gigas and M. edulis, respectively, in the study marine ranching. In total, these bivalve shellfish ingested 39.52 t of C in 360 d, of which 9.92 t was stored on the seafloor through biodeposition, 9.52 t was removed from the water through harvesting (including 8.42 t being absorbed for shell formation), and 20.08 t was used for respiration, calcification, reproduction, and excretion, and then released back into the water body. When the biomass of the bivalve shellfish reached ECC (282.66 t/km2) in our model, their number increased to3.24 million, and that of M. edulis increased to 1.18 million. This translated to the ingestion of 59.41 t of C during the 360 d growth cycle, of which 14.91 t was biodeposited on the seafloor, 14.32 t was harvested from the water (including 12.67 t being absorbed by shell formation, and 30.18 t was used for respiration, calcification, reproduction, and excretion and was released back into the water body (Figure 6).
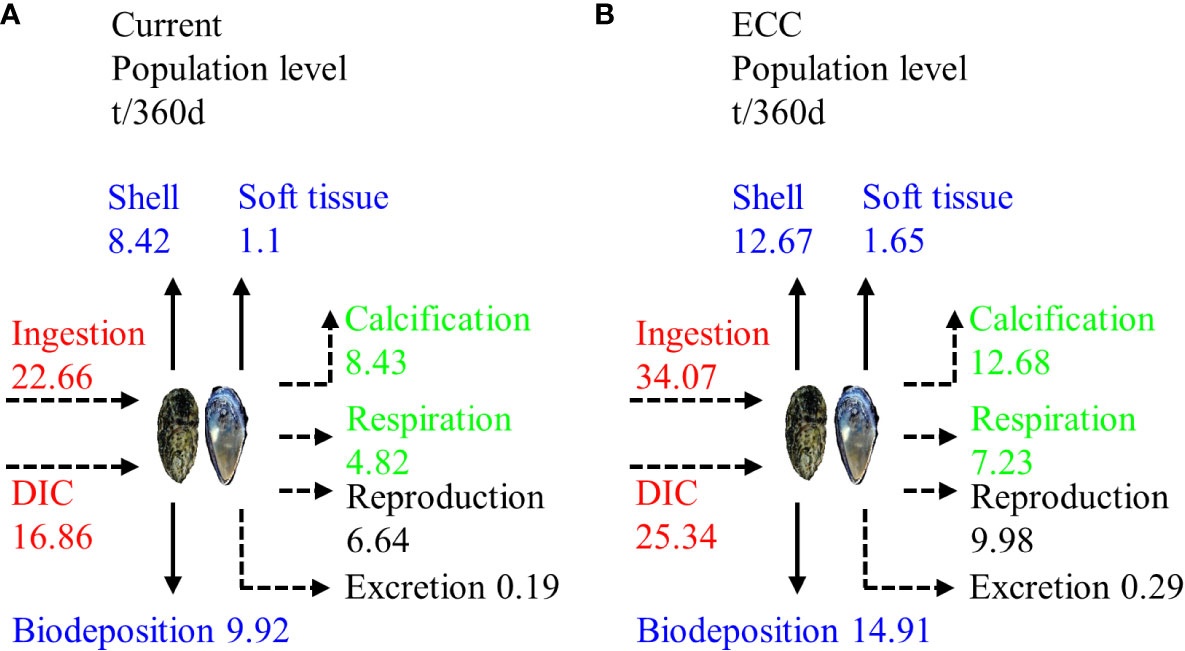
Figure 6 Carbon budget of bivalve shellfish populations in the study marine ranching under two scenarios for (A) current and (B) ECC. ECC, ecological carrying capacity; DIC, dissolved inorganic carbon.
4 Discussion
4.1 Overall maturity and stability of the study marine ranching ecosystem
In this study, we analyzed ecosystem scale, system maturity, stability, and trophic transfer to predict the potential impact of an increased bivalve shellfish biomass on the study marine ranching ecosystem.
An increase in bivalve shellfish biomass resulted in an increase in the TST, TB, TR and TPP of the ecosystem, indicating that the overall scale of the system gradually expanded. According to Odum (1969) and Christensen et al. (2005), both TPP/TR and TPP/TB are important parameters that respond to ecosystem maturity: when an ecosystem develops maturely, both TBB/TR and TPP/TB approach 1. In this study, TPP/TR and TPP/TB showed a decreasing trend with an increase in bivalve shellfish biomass and were 1.40 and 9.26, respectively, when the bivalve shellfish reached ECC. This indicated that the system matured with the increase in bivalve shellfish biomass. As an ecosystem matures, the food chain changes from linear to reticulate, with increased values of TST, FCI, FMPL, CI and SOI (Libralato, 2013). In our study, FCI and FMPL both increased significantly as bivalve shellfish biomass increased, comparable to the rates described by Heymans et al. (2011) for the 1–10 km2 ecosystem. This increase in FCI and FMPL can also indicate that the energy utilization of the detritus functional group improved and that the path of material circulation is longer. This marine ranching ecosystem was compared with the models proposed by Wu et al. (2016) and Heymans et al. (2011). The SOI and CI values before and after bivalve shellfish proliferation in this area were relatively low, indicating that the food web of the system was simple and linear.
At the same time, A/C and O/C are parameters that characterize the stability and maturity of the ecosystem. The relatively high A/C ratio indicates that the ecosystem is well organized and unlikely to disintegrate spontaneously. However, a decrease in the O/C value may make the system vulnerable to external pressure (Feng et al., 2022b), and the system is the most stable when the ratio of A to C is 45.96 (Ulanowicz, 2012). In our study area, the prevailing A/C value was 23.61%, indicating that the ecosystem was not sufficiently stable. However, as we modeled at bivalve shellfish biomass increased to ECC, the A/C increased to 28.88%, indicating that it had stronger self-regulation ability, but that it was still not sufficiently stable. The A, C to TST ratios, AMI and H are also important parameters for describing the stability of system maturity. According to Odum (1969) and Finn (1976), a mature ecosystem should have a high FCI and low H value. In this study, as the bivalve shellfish biomass increased to the ECC, FCI increased by 1.32 times and H decreased by 7.30%, implying that the ecosystem displayed a higher maturity and stability at this time point. The corresponding increase in AMI (from 0.91 to 1.04bits) indicates that the ecosystem is more restricted at this time and energy flows along a more fixed path.
Through ecological network analysis, we found that the SDI decreased with an increase in bivalve shellfish biomass. As SDI characterizes the diversity of a system, this result indicated that a higher bivalve shellfish biomass would have a negative impact on ecosystem biodiversity. We also found a slight decrease in the total system TE when ECC was reached. Lindeman energy flow diagrams indicated, that the TE from detritus and primary production to TL II increased as the bivalve shellfish biomass reached the ECC, with a more pronounced increase in the transfer efficiency of primary production. The main reason for this is that bivalve shellfish account for more than 70.00% of TL II, and they mainly feed on phytoplankton, which leads to an increase in phytoplankton utilization. Simultaneously, bivalve shellfish effectively store energy in macrobenthos through predation (Wang et al., 2022). Therefore, an increase in bivalve shellfish can better sustain the biomass of economically important macroinvertebrates, which can generate considerable economic benefits.
We could conclude that the study marine ranching ecosystem is not yet mature, but the system can be expected to mature and stabilize as the bivalve shellfish biomass increases towards the ECC.
4.2 Effect of bivalve shellfish proliferation on other functional groups
According to the results of the Ecosim simulation, an increase in bivalve shellfish biomass can have an indirect or direct effect on other functional groups. We first examined changes in other functional groups as the bivalve shellfish biomass was simulated to increase from its current level to its ECC. The main food of bivalve shellfish is phytoplankton; therefore, phytoplankton availability is the biggest limiting factor and hypothetical contradiction. We found that the biomass of phytoplankton never decreased to less than 85.00% of the initial biomass at any time during simulations. This may be due to the low vulnerability and low EE value of bivalve shellfish, which ultimately limits the increase in the predation pressure on phytoplankton. As a result, bivalve shellfish have the opportunity to proliferate without running out of food resources. However, the decrease in phytoplankton biomass affected other functional groups that compete with bivalve shellfish for phytoplankton as a food source. Gobiid fish was the most drastically affected, displaying a 99.99% reduction in their biomass by the end of the simulation. One explanation is the bivalve shellfish proliferation, because gobiid fish and bivalve shellfish have more than 50% of their prey in common, such as skeleton shrimp, annelids, and zooplankton; another explanation is that the construction of oyster reefs may also reduce the gobiid living space. Zooplankton species are some of the most important food competitors of bivalve shellfish, and the biomass of bivalve shellfish is understandably reduced by an increase in zooplankton biomass. However, the biomass of zooplankton in our study never dropped below 85.00% of their original biomass. This may be because that pelagic fish are the main predators of zooplankton in the study area and are also competitors for bivalve shellfish prey. The increase in bivalve shellfish biomass led to a decrease in the biomass of the pelagic fish population, which indirectly reduced their predation pressure on zooplankton, resulting in a relatively small drop in zooplankton biomass. Furthermore, the increase in bivalve shellfish biomass also led to an increase in the biomass of Charybdis japonica, snails, and starfish.
When the bivalve shellfish biomass was expanded to 120%ECC, the biomass of some functional groups showed the opposite trend compared to their response to a 100%ECC bivalve shellfish proliferation. This may be since that the further proliferation of bivalve shellfish caused a large reduction of pelagic and gobiid fish, which mainly prey on phytoplankton and zooplankton and therefore compete with bivalve shellfish for food resources. This could result in a corresponding increase in the biomass of other organisms that feed on plankton, which in turn allows an in the biomass of some higher trophic levels. Starfish no natural enemies in the study area and bivalve shellfish are their main food source. Therefore, an increasing bivalve shellfish biomass causes the starfish population to expand continuously. Starfish have low economic value in this region, but to avoid them overfeeding on bivalve shellfish, they must be adequately harvested. We believe that the appropriate harvesting of higher trophic-level species is required in the later stages of marine ranching management to ensure ecosystem stability.
Bivalve shellfish are considered the most sustainable aquaculture species, mainly because they prey on naturally occurring phytoplankton and do not require external bait inputs (Dumbauld et al., 2009). The proliferation of bivalve shellfish generally requires the addition of settlement structures for them, thus changing environmental conditions while potentially providing habitat for other organisms and contributing to an increased species diversity (Filgueira et al., 2021). However, the expansion of bivalve shellfish biomass can have certain negative effects on ecological structure and species diversity. To alleviate the drastic decline in the biomass of other species during bivalve shellfish stocking, while also increasing primary production in the water column, the appropriate proliferation of macroalgae as a food source may be a solution. Our results further showed that an increase in bivalve shellfish resulted in a moderate increase in the biomass of the main economic species in the area, which could increase the economic benefits of the area, in agreement with the findings of López-Jamar et al. (1984). Ecosim simulations of future scenarios indicate that the biomass of bivalve shellfish can be expanded to a maximum of 282.66 t/km2, above which the impact on other species is relatively large. Our study also shows that it is necessary to model the ecosystem of marine ranching before multiplication and release activities are implemented.
4.3 C budget at the population level of bivalve shellfish in the study marine ranching
Tang and Hui (2016) showed that shellfish function by filtering water, calcification, and biological deposition, and their physiological characteristics make them an important biological C sink. Chauvaud et al. (2003) proposed that shellfish not only achieve C sequestration through biological deposition and harvesting, but also emit C through respiration, calcification, and reproductive excretion; therefore, shellfish are not pure C sequestrators. Generally, if more C is used than released by an organism, it is a C sink; if not, it is a C source. In the process of shellfish calcification, for every 1 mol of CaCO3 formed, 1 mol of CO2 is released, but 2 mol of can be absorbed, which indicates that the removal of C is greater than its release (Zhang et al., 2005). Zhao et al. (2019) showed that the CO2 produced by bivalve shellfish is not directly released into the atmosphere, phytoplankton and macroalgae absorb some of the CO2, the bivalve shellfish themselves reuse a proportion to form shells, and the rest is released into the atmosphere. Overall, bivalve shellfish and macroalgae such as phytoplankton can synergize to enhance the C sink capacity of coastal zone ecosystems (Feng et al., 2022c). According to our model, if the biomass of bivalve shellfish is increased to the ECC in the marine ranching, the C intake of the bivalve shellfish will increase by 19.89 t, C biodeposits on the ocean floor will increase by 4.99 t, harvested C will increase by 4.80 t, and the C redischarged into the water by respiration and excretion will increase by 10.10 t. Furthermore, bivalve shellfish proliferation is generally achieved by placing artificial reefs, and the physical deposition of C on reefs populated with bivalve shellfish is an important process (Newell et al., 2005). Reefs generally have a complex physical structure, which helps to slow down the water current reduce wave energy and suspended matter deposition, thus promoting sediment accumulation and organic C burial (Chowdhury et al., 2019).
This study has several limitations. First, due to the short completion time of the Ecosim model, the lack of previous data did not fit the time series, which may induce some uncertainties in our results. Second, we used stomach content analyses to construct the diet matrix in this region; however, such an analysis can easily affect the reliability of the data by only reflecting an instantaneous prey composition (Gee, 1989) of an organism, not its long-term feeding characteristics. In future research, stable C and nitrogen isotopes can completely retain ingestion information to clarify food sources (Fry, 2006).
5 Conclusion
In recent years, under the multiple pressures of global climate change and human activities, the Chinese marine environment has changed, and the degradation of offshore biological resources has become increasingly serious. Resultantly, the construction of artificial reefs and stocking activities via marine ranching has been accelerated with the of repairing damaged habitats and conserving biological resources. This study used ecotrophic modeling and dynamic simulations to estimate an ECC of 282.66 t/km2 for bivalve shellfish in the study marine ranching in Bohai Bay, which would be beneficial to the general development of the ecosystem but may inflict a negative impact on some species. In our simulation, negative responses to bivalve shellfish proliferation were mainly due to the lack of primary productivity, but the addition of macroalgae can alleviate these effects while assisting with C sequestration (Watanabe et al., 2020). Via the synergistic ecological functions of bivalve shellfish and macroalgae, the C sequestration capacity of ecosystems can be effectively improved.
Data availability statement
The original contributions presented in the study are included in the article/Supplementary Material. Further inquiries can be directed to the corresponding authors.
Author contributions
ZL & YC: Investigation, Methodology, Writing - original draft. JF & ZP: Supervision, Conceptualization, Writing-review & editing. GW, JM: Conceptualization; YS: Sample analysis. JX, SL & FH: Writing-reviewing. All authors contributed to the article and approved the submitted version.
Funding
This research was funded by the National Natural Science Foundation of China (Grant Nos. 42106102), Marine Ecological Restoration and Smart Ocean Engineering Research Center of Hebei Province (Grant Nos. HBMESO2303), the Natural Science Foundation of Hebei Province, China (Grant Nos. C2020204151 & C2021204059), Special Fund for Talent Introduction of Hebei Agricultural University, China (Grant Nos. YJ2020019 & YJ2020026), 2021 Hebei Agricultural University Provincial Universities Basic Research Business Fee Research Project (Grant Nos. KY2021013), and College of Oceanography, Hebei Agricultural University Entrepreneurship Project (Scientific Research) (2021KY04).
Acknowledgments
We gratefully acknowledge Xu Wang, Chen Cui, and Jia Yu for their assistance during the fieldwork. We also thank Yan-Miao Tan and Pei-Qiao Jia for their helpful discussion and proofreading in the course of writing articles.
Conflict of interest
The authors declare that the research was conducted in the absence of any commercial or financial relationships that could be construed as a potential conflict of interest.
Publisher’s note
All claims expressed in this article are solely those of the authors and do not necessarily represent those of their affiliated organizations, or those of the publisher, the editors and the reviewers. Any product that may be evaluated in this article, or claim that may be made by its manufacturer, is not guaranteed or endorsed by the publisher.
Supplementary material
The Supplementary Material for this article can be found online at: https://www.frontiersin.org/articles/10.3389/fmars.2023.1174235/full#supplementary-material
References
Baird D., Asmus H., Asmus R. (2007). Trophic dynamics of eight intertidal communities of the sylt-rømø bight ecosystem, northern wadden Sea. Mar. Ecol. Prog. Ser. 351, 25–41. doi: 10.3354/meps07137
Byron C., Link J., Costa-Pierce B., Bengtson D. (2011). Calculating ecological carrying capacity of shellfish aquaculture using mass-balance modeling: Narragansett bay, Rhode island. Ecol. Modell. 222, 1743–1755. doi: 10.1016/j.ecolmodel.2011.03.010
Chauvaud L., Thompson J. K., Cloern J. E., Thouzeau G. (2003). Clams as CO2 generators: The Potamocorbula amurensis example in San Francisco bay. Limnol. Oceanogr. 48, 2086–2092. doi: 10.4319/lo.2003.48.6.2086
Chowdhury M. S. N., Walles B., Sharifuzzaman S. M., Shahadat Hossain M., Ysebaert T., Smaal A. C. (2019). Oyster breakwater reefs promote adjacent mudflat stability and salt marsh growth in a monsoon dominated subtropical coast. Sci. Rep. 9, 8549. doi: 10.1038/s41598-019-44925-6
Christensen V., Walters C. J. (2004). Ecopath with ecosim: Methods, capabilities and limitations. Ecol. modell. 172, 109–139. doi: 10.1016/j.ecolmodel.2003.09.003
Christensen V., Walters C., Pauly D. (2005). Ecopath with Ecosim:A user’s guide (V Ancouver: Fisheries Centre of University of British Columbia).
Duarte C. M., Losada I. J., Hendriks I. E., Mazarrasa I., Marbà N. (2013). The role of coastal plant communities for climate change mitigation and adaptation. Nat. Climate Change 3 (11), 961–968. doi: 10.1038/nclimate1970
Dumbauld B. R., Ruesink J. L., Rumrill S. S. (2009). The ecological role of bivalve shellfish aquaculture in the estuarine environment: A review with application to oyster and clam culture in West coast (USA) estuaries. Aquaculture 290, 196–223. doi: 10.1016/j.aquaculture.2009.02.033
Dutta D., Schimel D. S., Sun Y., van der Tol C., Frankenberg C. (2019). Optimal inverse estimation of ecosystem parameters from observations of shellfish and energy fluxes. Biogeosciences 16, 77–103. doi: 10.5194/bg-16-77-2019
Feng J., Tian X. L., Dong S. L., He R. P., Zhang K., Zhang D. X., et al. (2022b). Temporal dynamics in energy fluxes and trophic structure of a Portunus trituberculatus polyculture ecosystem during different culture periods. Front. Mar. Sci. 9. doi: 10.3389/fmars.2022.873643
Feng J., Zhang T., Ma P. Z., Bai T., Xu J. L., Wang H. Y., et al. (2022c). Research progress and the prospect of oyster reef carbon source and sink functions. Prog. Fish. Sci. 43, 115–125. doi: 10.19663/j.issn2095-9869.20220222003
Feng J., Zhang T., Song H., Yu Z. L., Yang M. J., Hu Z., et al. (2022a). Assessing the carrying capacity of Mercenaria mercenaria using a steady linear food web model in two pond-culture ecosystems. Aquacult Res. 00, 1–17. doi: 10.1111/are.16142
Filgueira R., Guyondet T., Thupaki P., Sakamaki T., Grant J. (2021). The effect of embayment complexity on ecological carrying capacity estimations in bivalve aquaculture sites. J. Cleaner Prod. 288, 125739. doi: 10.1016/j.jclepro.2020.125739
Finn J. T. (1976). Measures of ecosystem structure and function derived from analysis of flows. J. Theor. Biol. 56, 363–380. doi: 10.1016/S0022-5193(76)80080-X
Gao Y., Fang J., Lin F., Li F., Li W., Wang X., et al. (2020). Simulation of oyster ecological carrying capacity in sanggou bay in the ecosystem context. Aquacult. Int. 28, 2059–2079. doi: 10.1007/s10499-020-00576-3
Gee J. M. (1989). An ecological and economic review of meiofauna as food for fish. Zool. J. Linn. Soc 96, 243–261. doi: 10.1111/j.1096-3642.1989.tb02259.x
Grabowski J. H., Peterson C. H. (2007). Restoring oyster reefs to recover ecosystem services. Ecosyst. Eng. Plants Protists. 4, 281–298. doi: 10.1016/S1875-306X(07)80017-7
Heymans J., Coll M., Libralato S., Christensen V. (2011). Ecopath theory, modeling, and application to coastal ecosystems. Treatise Estuar. Coast. Sci. (Oxford), 93–113.
Heymans J. J., Coll M., Link J. S., Mackinson S., Steenbeek J., Walters C., et al. (2016). Best practice in ecopath with ecosim food-web models for ecosystem-based management. Ecol. Modell. 331, 173–184. doi: 10.1016/j.ecolmodel.2015.12.007
Inglis G., Hayden B. J., Ross A. H. (2000). An overview of factors affecting the carrying capacity of coastal embayments for mussel culture. (Christchurch: National Institute of Water & Atmospheric Research), 69 vi + 31p.
Jiang W. M., Gibbs M. T. (2005). Predicting the carrying capacity of bivalve shellfish culture using a steady, linear food web model. Aquaculture 244, 171–185. doi: 10.1016/j.aquaculture.2004.11.050
Jin X. S., Deng J. Y. (2000). Variations in community structure of fishery resources and biodiversity in the laizhou bay, Shandong. Biodiversity. Sci. 8, 65. doi: 10.17520/biods.2000009
Kluger L. C., Taylor M. H., Mendo J., Tam J., Wolff M. (2016). Carrying capacity simulations as a tool for ecosystem-based management of a scallop aquaculture system. Ecol. Modell. 331, 44–55. doi: 10.1016/j.ecolmodel.2015.09.002
Latham L. G. (2006). Network flow analysis algorithms. Ecol. Model. 192, 586–600. doi: 10.1016/j.ecolmodel.2005.07.029
Li X., Yang W., Sun T., Gaedke U. (2021). Quantitative food web structureand ecosystem functions in a warm-temperate seagrass bed. Mar. Biol. 168, 74. doi: 10.1007/s00227-021-03878-z
Libralato S. (2013). “System omnivory index,” in Encyclopedia of ecology. Eds. Jørgensen S. E., Fath B. D. (Oxford: Elsevier), 481–486. doi: 10.1007/s00227-021-03878-z
Link J. S. (2010). Adding rigor to ecological network models by evaluating a set of pre-balance diagnostics: A plea for PREBAL. Ecol. Model. 221, 1580–1591. doi: 10.1016/j.ecolmodel.2010.03.012
López-Jamar E., Iglesias J., Otero J. J. (1984). Contribution of infauna and mussel-raft epifauna to demersal fish diets. Mar. Ecol. Prog. Ser. 15, 13–18. doi: 10.3354/meps015013
Lv X., Wang X., Wu Y., Jiang W., Fang J., Fang J. (2018). Effect oftemperature on the energy budget of Arcuatula senhousei. Prog. Oceanogr. 39, 119–125. doi: 10.19663/j.issn2095-9869.20170420002
McKindsey C. W., Thetmeyer H., Landry T., Silvert W. (2006). Review of recent carrying capacity models for bivalve culture and recommendations for research and management. Aquaculture 261, 451–462. doi: 10.1016/j.aquaculture.2006.06.044
Newell R. I., Fisher T. R., Holyoke R. R., Cornwell J. C. (2005). “Influence of eastern oysters on nitrogen and phosphorus regeneration in Chesapeake bay, USA,” in The comparative roles of suspension-feeders in ecosystems (Springer), 93–120. doi: 10.1007/1-4020-3030-4-6
Odum E. P. (1969). The strategy of ecosystem development. Science 164, 262–270. doi: 10.1126/science.164.3877.262
Ortiz M., Berrios F., Campos L., Uribe R., Ramirez A., Hermosillo-Núñez B., et al. (2015). Mass balanced trophic models and short-term dynamical simulations for benthic ecological systems of mejillones and antofagasta bays (SE pacific): Comparative network structure and assessment of human impacts. Ecol. Modell. 309, 153–162. doi: 10.1016/j.ecolmodel.2015.04.006
Pachauri R. K., Meyer L. A., Plattner G. K., Stocker T. (2014). Synthesis report. contribution of working groups I, II and III to the fifth assessment report of the intergovernmental panel on climate change (Geneva, Switzerland: Intergovernmental Panel on Climate Change).
Palomares M. L., Pauly D. (1989). A multiple regression model for prediction the food consumption of marine fish populations. Mar. Freshw. Res. 40, 259–273. doi: 10.1071/MF9890259
Pan Z., Gao Q. F., Dong S. L., Wang F., Jiang X. Y., Zhang G., et al. (2019a). Remineralization and preservation of sedimentary organic carbon, and authigenic mineral formation in alian bay and its adjacent areas, China: Implication for the influence of abalone (Haliotis discus hannai ino) and kelp (Saccharina japonica) mariculture. Aquaculture 507, 301–312. doi: 10.1016/j.aquaculture.2019.04.051
Pan Z., Gao Q. F., Dong S. L., Wang F., Li H. D., Zhao K., et al. (2019b). Effects of abalone (Haliotis discus hannai ino) and kelp (Saccharina japonica) mariculture on sources, distribution, and preservation of sedimentary organic carbon in ailian bay, China: Identified by coupling stable isotopes (δ13C and δ15N) with C/N ratio analyses. Mar. pollut. Bull. 141, 387–397. doi: 10.1016/j.marpolbul.2019.02.053
Parsons T. R., Maita Y., Lalli C. M. (1984). “Determination of chlorophyllsand total carotenoids: Spectrophotometric method,” in A manual of chemical& biological methods for seawater analysis. Eds. Parsons T. R., Maita Y., Lalli C. M. (Amsterdam: Pergamon), 101104. doi: 10.1016/b978-0-08-030287-4.50032-3
Ren L. H. (2014). Study on the carbon sequestration function of raft-farmed crassostrea gigas and their main filter-feeding attached organisms in sanggou bay (Graduate School of Chinese Academy of Sciences). (Institute of Oceanography).
Shen J. S., Jinnuo Lv, Rongjian L. (2020). Exploring the design of blue carbon sink compensation scheme for china’s marine rangelands. J. Ocean Univ. China. 3, 68–75. doi: 10.16497/j.cnki.1672-335X.202003007
Srithong N., Jensen K. R., Jarernpornnipat A. (2021). Application of the ecopath model for evaluation of ecological structure and function for fisheries management: A case study from fisheries in coastal Andaman Sea, Thailand. Reg. Stud. Mar. Sci. 47, 101–972. doi: 10.1016/j.rsma.2021.101972
Tang Q. S., Hui L. (2016). Strategy for carbon sink and its amplification in marine fisheries. Strategic Study CAE. 18, 68–73. doi: 10.15302/J-SSCAE-2016.03.011
Tumbiolo M. L., Downing J. A. (1994). An empirical model for the prediction of secondary production in marine benthic invertebrate populations. Mar. Ecol. Prog. Ser. 114, 165–174. doi: 10.3354/meps114165
Ulanowicz R. E. (1986). Growth and development: Ecosystems phenomenology (New York, NY: Springer-Verlag).
Ulanowicz R. E. (2004). Quantitative methods for ecological network analysis. Comput. Biol. Chem. 28, 321–339. doi: 10.1016/j.compbiolchem.2004.09.001
Ulanowicz R. E. (2012). Growth and development: ecosystems phenomenology (Springer Science & Business Media).
Velasco L. A., Barros J., Guerrero A. (2009). Effect of the density on the growth and survival of the Caribbean scallops argopecten nucleus and nodipecten nodosus in suspended culture. Aquacult Res. 40, 687–695. doi: 10.1111/j.1365-2109.2008.02145.x
Wang X., Feng J., Lin C., Liu H., Chen M., Zhang Y. (2022). Structural and functional improvements of coastal ecosystem based on artificial oyster reef construction in the Bohai Sea, China. Front. Mar. Sci. 9. doi: 10.3389/fmars.2022.829557
Watanabe K., Yoshida G., Hori M., Umezawa Y., Moki H., Kuwae T. (2020). Macroalgal metabolism and lateral carbon flows can create significant carbon sinks. Biogeosciences 17, 2425–2440. doi: 10.5194/bg-17-2425-2020
Wu Z., Zhang X., Lozano-Montes H. M., Loneragan N. R. (2016). Trophic flows, kelp culture and fisheries in the marine ecosystem of an artificial reef zone in the yellow Sea. Estuar. Coast. Shelf Sci. 182, 86–97. doi: 10.1016/j.ecss.2016.08.021
Yu B. Y., Zhao G. P., An R. Y., Chen J. M., Tan J. X., Li X. Y. (2021). Research on china’s CO2 emission pathway under carbon neutral target. J. B. Inst. Techno. 23, 17–24.
Yue J., Dong Y., Zhang B. H., Han F., Zhao X. T., Liu D. Y., et al. (2012). Several oyster barrier reefs in the northwest coast of bohai Sea. Acta Geol. Sin. 86, 1175–1187.
Zhang B. (2018). Feeding ecology of fishes in the bohai Sea. Prog. Fish. Sci. 39, 11–22. doi: 10.19663/j.issn2095-9869.20171103001
Zhang J. H., Fang J. G., Tang Q. S. (2005). The contribution of shellfish and seaweed mariculture in China to the carbon cycle of coastal ecosystem. Adv. Earth Sci. 20, 359–365. doi: 10.11867/j.issn.1001–8166.2005.03.0359
Zhao P., Hu X. D. (2019). International blue carbon cooperation and china’s choice. Mar. Sci. Bull. 38, 613–619.
Zhao L., Zuykov M., Tanaka K., Shirai K., Anderson J., McKindsey C. W., et al. (2019). New insight into light-enhanced calcification in mytilid mussels, mytilus sp., infected with photosynthetic algae coccomyxa sp.: δ13C value and metabolic carbon record in shells. J. Exp. Mar. Biol. Ecol. 520, 151–211. doi: 10.1016/j.jembe.2019.151211
Keywords: bivalve shellfish, marine ranching, ecopath with ecosim, ecological carrying capacity, carbon budget
Citation: Li Z, Chen Y, Wang G, Mu J, Sun Y, Yu H, Xu J, Yan Y, Luo S, Han F, Feng J and Pan Z (2023) Ecological carrying capacity and carbon sequestration potential of bivalve shellfish in marine ranching: A case study in Bohai Bay, China. Front. Mar. Sci. 10:1174235. doi: 10.3389/fmars.2023.1174235
Received: 26 February 2023; Accepted: 06 March 2023;
Published: 17 March 2023.
Edited by:
Kai Zhang, Pearl River Fisheries Research Institute (CAFS), ChinaReviewed by:
Zhuonan Wang, Emory University, United StatesShuang Li, Zhejiang Ocean University, China
Jiamin Sun, Shanghai Ocean University, China
Copyright © 2023 Li, Chen, Wang, Mu, Sun, Yu, Xu, Yan, Luo, Han, Feng and Pan. This is an open-access article distributed under the terms of the Creative Commons Attribution License (CC BY). The use, distribution or reproduction in other forums is permitted, provided the original author(s) and the copyright owner(s) are credited and that the original publication in this journal is cited, in accordance with accepted academic practice. No use, distribution or reproduction is permitted which does not comply with these terms.
*Correspondence: Jie Feng, ZjgyMzcyNTQ4NkAxNjMuY29t; Zhe Pan, bGZwYW56aGVAMTYzLmNvbQ==
†These authors have contributed equally to this work