 He Ma
He Ma- 1Key Laboratory of Environment Controlled Aquaculture, Ministry of Education, Dalian Ocean University, Dalian, China
- 2College of Marine Technology and Environment, Dalian Ocean University, Dalian, China
- 3College of Biosystems Engineering and Food Science, Zhejiang University, Hangzhou, China
The circadian rhythm is a physiological phenomenon that occurs in various organisms with a cycle of about 24 hours. Light is one of the important environmental factors affecting biological rhythm. To clarify whether a shift in light spectrum can influence the circadian expression in fish brain, a total of 175 European seabasses [body weight: 32.5 ± 0.71) g; body length: (13.78 ± 0.35) cm] were exposed to white light (WL), red light (RL), yellow light (YL), green light (GL) or blue light (BL). After 50 days of exposure, circadian expressions of four core clock genes (Clock, Bmal1, Per2, Cry1) and Aanat2 gene in brain were examined. The results showed that the temporal expression patterns of positive clock gens (Clock and Bmal1) showed increases during the scotophase and decreases during the photophase, with peaks near the middle of the darkness. Clock gene expression showed a stable circadian rhythm (R2 = 0.578-0.824, P=0.000- 0.027) in all light groups while Bmal1 showed circadian rhythm in WL, GL and RL, not in BL and YL. Daily expression patterns of the negative clock genes oscillated in the opposite phase from the positive clock genes, showing increasing mRNA levels during the light, decreases during the dark, and peaks near the shift from night to day, except Per2 in RL and Cry1 in BL. Compared with WL, the acrophases of Clock and Bmal1 were delayed under all light treatments (BL: + 3.7h, +6.73h; RL: +2.4h,+1.35h; YL: + 4.94h, 2.00h; GL: +0.05, +0.16h). Cry1 showed advanced acrophase under all light treatments (BL: -10.74 h, GL: -3.81 h, RL: -3.93 h, YL: -7.56 h) but Per2 showed delayed acrophase in all light treatments (GL: +0.86 h, RL: +10.35 h, YL: +9.62 h), except in BL (-0.43 h). The acrophase of Aanat2 was advanced by all monochromatic light, the Aanat2 level was significantly increased in RL compared with other light treatment. Therefore, the results indicate that RL may regulate the expression of Aanat2 gene by affecting the expression of clock gene in fish brain. Spectrum can affect the biological clock system of fish, and unreasonable spectrum may disturb the rhythm of gene expression of biological clock of fish. Under the irradiation of light spectrum, some clock genes still maintain obvious circadian oscillation, while the rhythm of some clock genes is not obvious and may be destroyed. Our findings suggest a primary role of light spectrum information to the fish brain circadian system.
1. Introduction
Most living organisms share a characteristic of endogenous rhythmicity, for which functional mechanisms are organized around biological clocks. The circadian rhythm is a physiological phenomenon that occurs in various organisms with a cycle of about 24 hours. The body’s sleep-wake cycle, fluctuations in body temperature and hormone levels, changes in recognition and memory and so on all have circadian rhythms, which are marked by the core temperature of the body and the levels of creatin and cortisol in the plasma (Klein and Reppert, 1992). The material basis of the circadian rhythm is the molecular timer, that is, the circadian clock, all the life activities and physiological functions of the body are regulated by the biological clock (Eckel-Mahan and Sassone-Corsi, 2009; Bass and Takahashi, 2010).
In multicellular organisms, the circadian clock can be divided into the main clock (central clock) and the peripheral clock (cell clock). The main clock is located in the central part, and the peripheral clock is located in the tissue cells (Dardente and Cermakian, 2007). The biological clock system is mainly composed of three parts: input channel, core oscillator and output channel (Brown et al., 2005; Schmutz et al., 2010). Changes in light and temperature in the external environment are transmitted from the input path to the core oscillator, and through a series of reactions, the biological rhythm is driven through the output pathway. The core oscillator of non-mammalian vertebrates is located in the pineal gland and is a feedback loop composed of a “transcription-translation-inhibition” mechanism in which the circadian clock gene is highly conserved in many species (Tei et al., 1997; Vatine et al., 2011). In mammals, the genes located in the main feedback loop include Clock and its homologous genes Npas2, Arntl1, Per1, Per2, Cry1, Cry2 (Schmutz et al., 2010). Among them, the positive regulatory factors include Clock and Arntl1(a homologous gene of Bmal1), and the inhibitors include Per and Cry. To ensure the accuracy and stability of the rhythmic oscillations, there is another feedback loop that includes the retinoic acid-related orphan nuclear receptor Rora activated by the Clock: Arntl1 dimer transfer, and Rora activates Arntl1 transcription (Sato et al., 2004). Currently in fish, the biological clock genes were mainly studied in some model species, such as zebrafish (Danio rerio) (Whitmore et al., 1998), Takifugu rubripes (Delaunay et al., 2000), Oryzias latipes (Cuesta et al., 2014), etc. There are a small number of cultured species, such as the European cockroach (Dicentrarchus labrax), rainbow trout (Oncorhynchus mykiss), Atlantic salmon (Salmo salar), Atlantic cockroach (Gadus morhua), Atlantic bluefin tuna (Thunnus thynnus, L.) and other biological clock related research (Huang et al., 2010; Sánchez et al., 2010; Patiño et al., 2011; Nagasawa et al., 2012; Lazado et al., 2014; Betancor et al., 2020).
Light as a major environmental cue has a substantial impact on circadian physiological rhythms such as seasonal reproductive activity, migration and diurnal activities (Brooks and Canal, 2013; Surbhi and Kumar, 2015). In many teleost, for example, the photoperiod is the dominant environment component providing time information. Moreover, light intensity can affect the seasonal timing of fish by changing melatonin profiles (Bayarri et al., 2002). Apart from these two photo-supplementations, light spectrum also plays an important role in the animals’ circadian system. Bayarri et al. (2002) reported that blue light reduced the content of melatonin in the plasma of salmon but increased the content of melatonin in the eye; red light significantly inhibited the content of plasma melatonin at sufficient light intensity. Shin et al. (2011) reported that red light increased the expression of Aanat2 in the pineal gland of clownfish. However, there are few studies on the effect of spectrum on circadian clock genes on fish.
In the previous study, we focused on the effects of different spectral environments on the growth, feeding, physiology and muscle quality of European seabass (Dai et al., 2019; Fei et al., 2019; Ren et al., 2019). The results showed that different spectra had significant effects on the above indexes. Among them, the growth of juvenile seabass was better under red light spectrum and worse under blue light spectrum; Red light can enhance the antioxidant capacity of European seabass, while green light group improves the nutritional quality of muscle (Dai et al., 2019; Fei et al., 2019; Ren et al., 2019). In the past, the impact on the physiological rhythm of European seabass mainly focused on photoperiod, seasonal variation, temperature and feeding (Millot and Bégout, 2009; Herrero and Lepesant, 2014; McStay et al., 2014). However, little is known about the effects of different spectra on the clock gene rhythm of European seabass. In the present study, the effect of the light spectrum on the expression of fish core clock genes (Clock, Bmal1, Cry1 and Per2) and the melatonin synthase gene (arylalkylamine-n-acetyltransfer-ferase-2, Aanat2) in brain were investigated. Our findings will reveal the effects of different spectra on the expression level of fish circadian clock gene and Aanat2 and circadian rhythm. The results will suggest a primary role of light spectrum information to the fish brain circadian system.
2. Materials and methods
2.1. Animals and sampling
A total of 175 European seabass (Dicentrarchus labrax) with body weight of (29.91 ± 0.39) g and body length of (13.78 ± 0.35) cm were supplied by a local fish farm (Dalian Fugu Group, Liaoning, China). Fish were reared in an aquaculture laboratory at the Key Laboratory of Environment Controlled Aquaculture, Ministry of Education (Dalian, Liaoning, China). All fish were randomly divided into five groups after 7 days acclimation. Each group allocated in a separated room was exposed to either white light (WL, 400-780 nm, control group), red light (RL, 660 nm), green light (GL, 560 nm), yellow light (YL, 590 nm) or blue light (BL, 480 nm) using light-emitting-diode (LED) lights (CK 54, Shenzhen Fluence Technology PLC, Shenzhen, China). The spectra of LED lights are shown in Figure 1. The photoperiod was set at 12 h light:12 h dark (LD), with 250 mW/m2 illumination on the water surface during the photophase. Light onset and offset were at 8:00 h (zeitgeber time, ZT 08:00) and 20:00 h (ZT 20:00), respectively. Three replicates were set in each light group. Seabass were kept in a cylindrical tank (diameter, 80 cm; height, 60 cm) with constant seawater temperature of 22 ± 1 °C controlled by a heater (AT-300, Hong Kong International Co., Ltd., Guangdong, China). The salinity of the local seawater was 32.1-32.4. During the rearing period, the Sea bass were fed twice a day at 9:00 h and 15:00 h with commercial feed (Guangdong Yuequn Marine Biological Research and Development Co., Ltd., Guangdong, China). The weight of daily feed shall be calculated as 2% of the total mass of fish in each tank, and the feed shall be weighed each time.
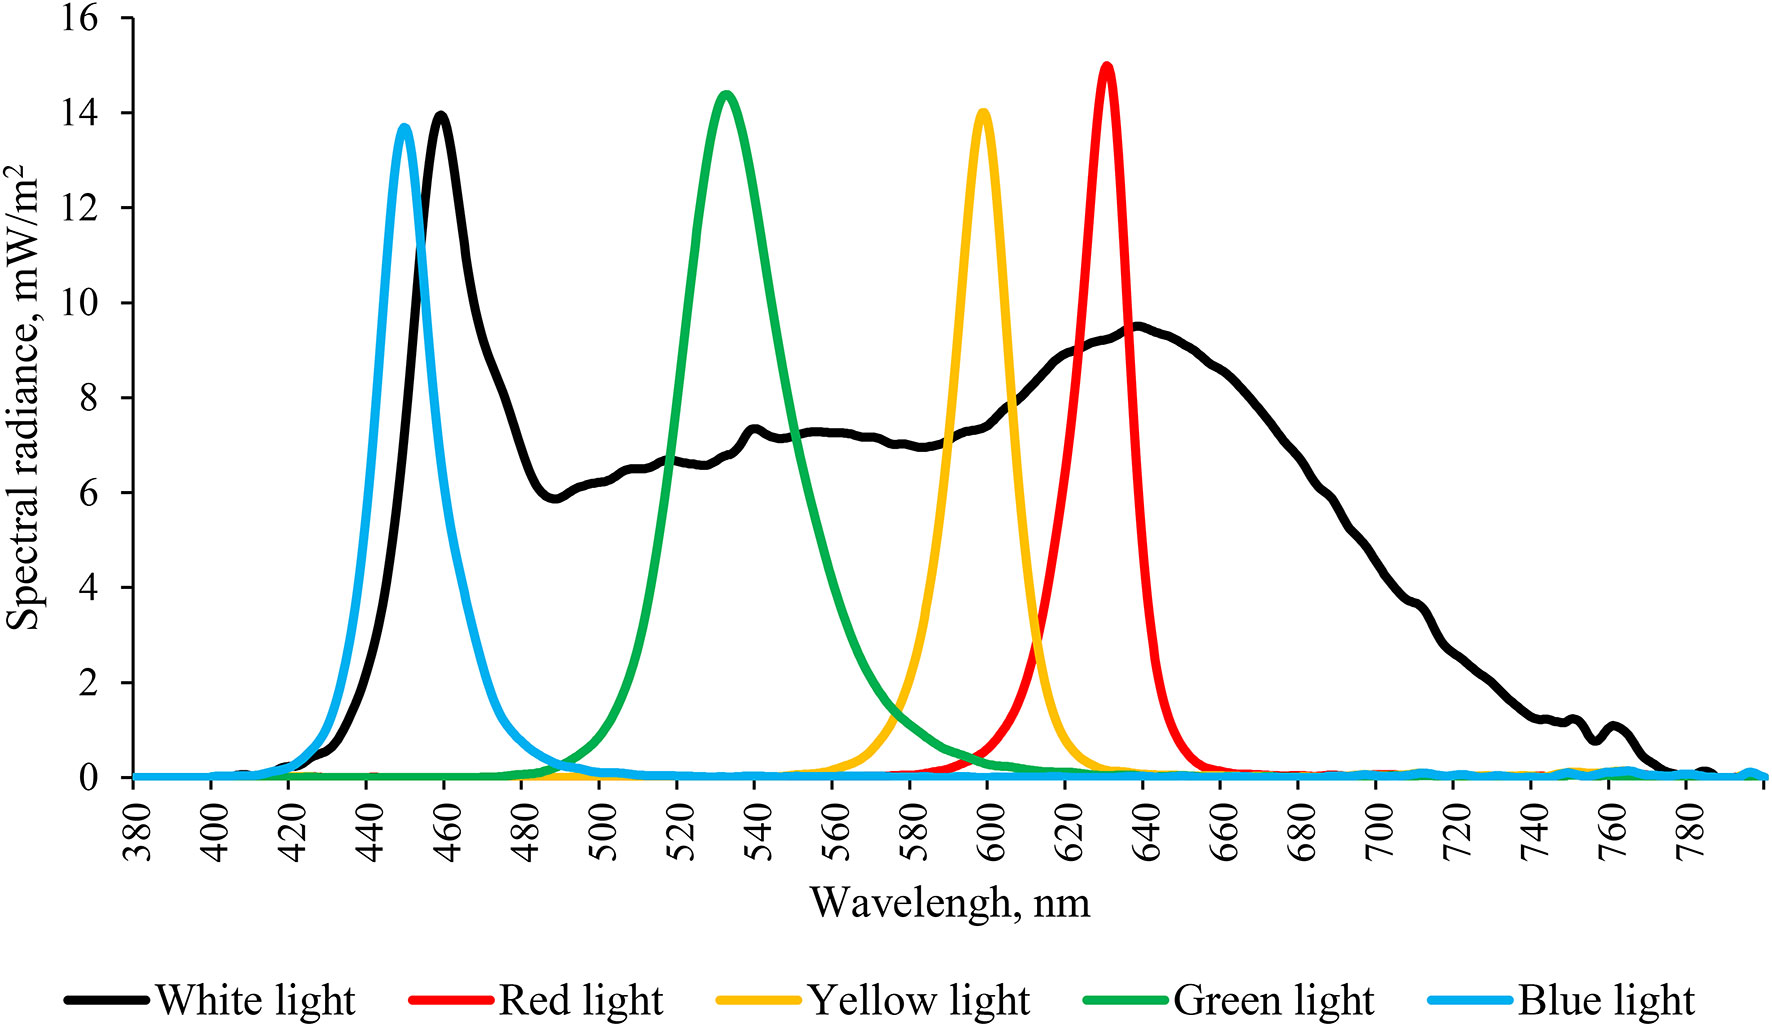
Figure 1 Spectral curves of the LED lights’ spectral compositions in the experiment.
After 50 days, 3 seabass were anesthetized (using MS-222, 200 mg/L) and sacrificed every 3 h (at Zeitgeber Time (ZT) 02:00, ZT 05:00, ZT 08:00, ZT 11:00, ZT 14:00, ZT 17:00, ZT 20:00 and ZT 23:00). The fish were sacrificed under light during the photophase and with head covered under dim red light during the darkphase. The fish were taken alternatively from different tanks at every time-point to minimize stress. Their brains were rapidly dissected out and frozen in liquid nitrogen then stored at −80°C prior to total RNA isolation.
2.2. RNA extraction, DNase treatment and cDNA synthesis
Brain samples were homogenised in 500 μL of TRIzol reagent (#SK1321, Sangon Biotech (Shanghai) Co., Ltd, China) and total RNA extracted in accordance with the manufacturer’s instructions. RNA pellets were rehydrated in 12 μL MilliQ water to achieve a final RNA concentration of approximately100–500 ng/μL. Total RNA concentration was determined using a SMA4000 Nanodrop spectrophotometer (Merinton Instrument, Inc., Michigan, USA). In order to eliminate any genomic DNA contamination, the remaining total RNA was DNase treated. cDNA synthesis was generated using the first strand cDNA synthesis kit (#EP0733, Thermo Scientific™, USA), and the cDNA samples were then stored at −20°C prior to analysis.
2.3. Relative quantitative real time PCRs
The Real-time Quantitative PCR Detecting System (qPCR) primer pairs were designed using Primer Premier 5.0 (Premier, Canada) and tested by PCR. Polymerase chain reaction (PCR) amplification was performed with SG Fast qPCR Master Mix (#B639271, Roche, Shanghai, China). Briefly, 2 μL of cDNA was mixed with 10 μL 2× Master Mix, 0.4 μL forward primer (10 μm), 0.4 μL rearward primer (10 μm), and 7.2 μL ddH2.0 in a final volume of 20 μL per reaction. The LightCycler480 Software (Roche Diagnostics, Germany) was programmed to execute cycles of 95°C for 3 min, followed by 45 cycles of 95°C for 3 s and 60°C for 30 s. The solubility curve was analyzed at the end of the experiment. For each RNA sample and gene, all PCR analyses were performed in triplicate. mRNA levels of the target genes were calibrated using the real time PCR Ct (2−ΔΔCt) relative quantitative method, using the reference gene β-actin as the quantitative standard. Specific primers were designed according to the complete cDNA sequence in GenBank. The primer sequences are shown in Table 1.

Table 1 Primer sequences and annealing temperatures used for qPCR.
2.4. Statistical analysis
All data are expressed as the mean ± standard error of the mean (SEM). To test the significance of the differences in mRNA levels among the six daily time points, the mRNA levels of clock genes were analyzed using one-way analysis of variance (one-way ANOVA) followed by Fisher’s least significant difference (LSD) post hoc test using SPSS 18.0 software (SPSS Inc., Chicago, IL, USA). Differences between light-condition groups at each time point were considered significant at P < 0.05. To describe the circadian rhythmicity of each clock gene profile, the mRNA level of clock genes was analyzed separately using OriginPro 2016 (version 8.0; Hampton, MA, USA) based on unimodal cosinor regression [y = A + (B × cos (2π (x − C)/24))] (Jiang et al., 2016). A, B and C represent the mesor, amplitude and acrophase, respectively, of the circadian rhythm. The significance of regression analysis determined at P < 0.05 was calculated using the number of samples, R2 and numbers of predictors (mesor, amplitude, and acrophase). The clock gen was considered to have circadian rhythm when R2 ≥0.5 and P < 0.05 in this study.
3. Results
3.1. Relative mRNA levels of clock genes
Be exposed to different LED spectrum conditions for 50 days, 24-h expressions of four core clock genes remained to show a robust circadian oscillation. However, the significant difference of clock genes mRNA level between different light spectrum was found. For exmaple, RL significantly enhanced the Clock mRNA expression by 2 times compared to that in WL (P<0.05), but GL and YL slightly suppressed the Clock mRNA level (P>0.05) compared to WL (Figure 2). The mRNA levels of all clock gene expressions were universally increased in RL except Cry1 (increased both in RL and GL), but no difference was observed among BL, GL, YL and WL (Figure 2).
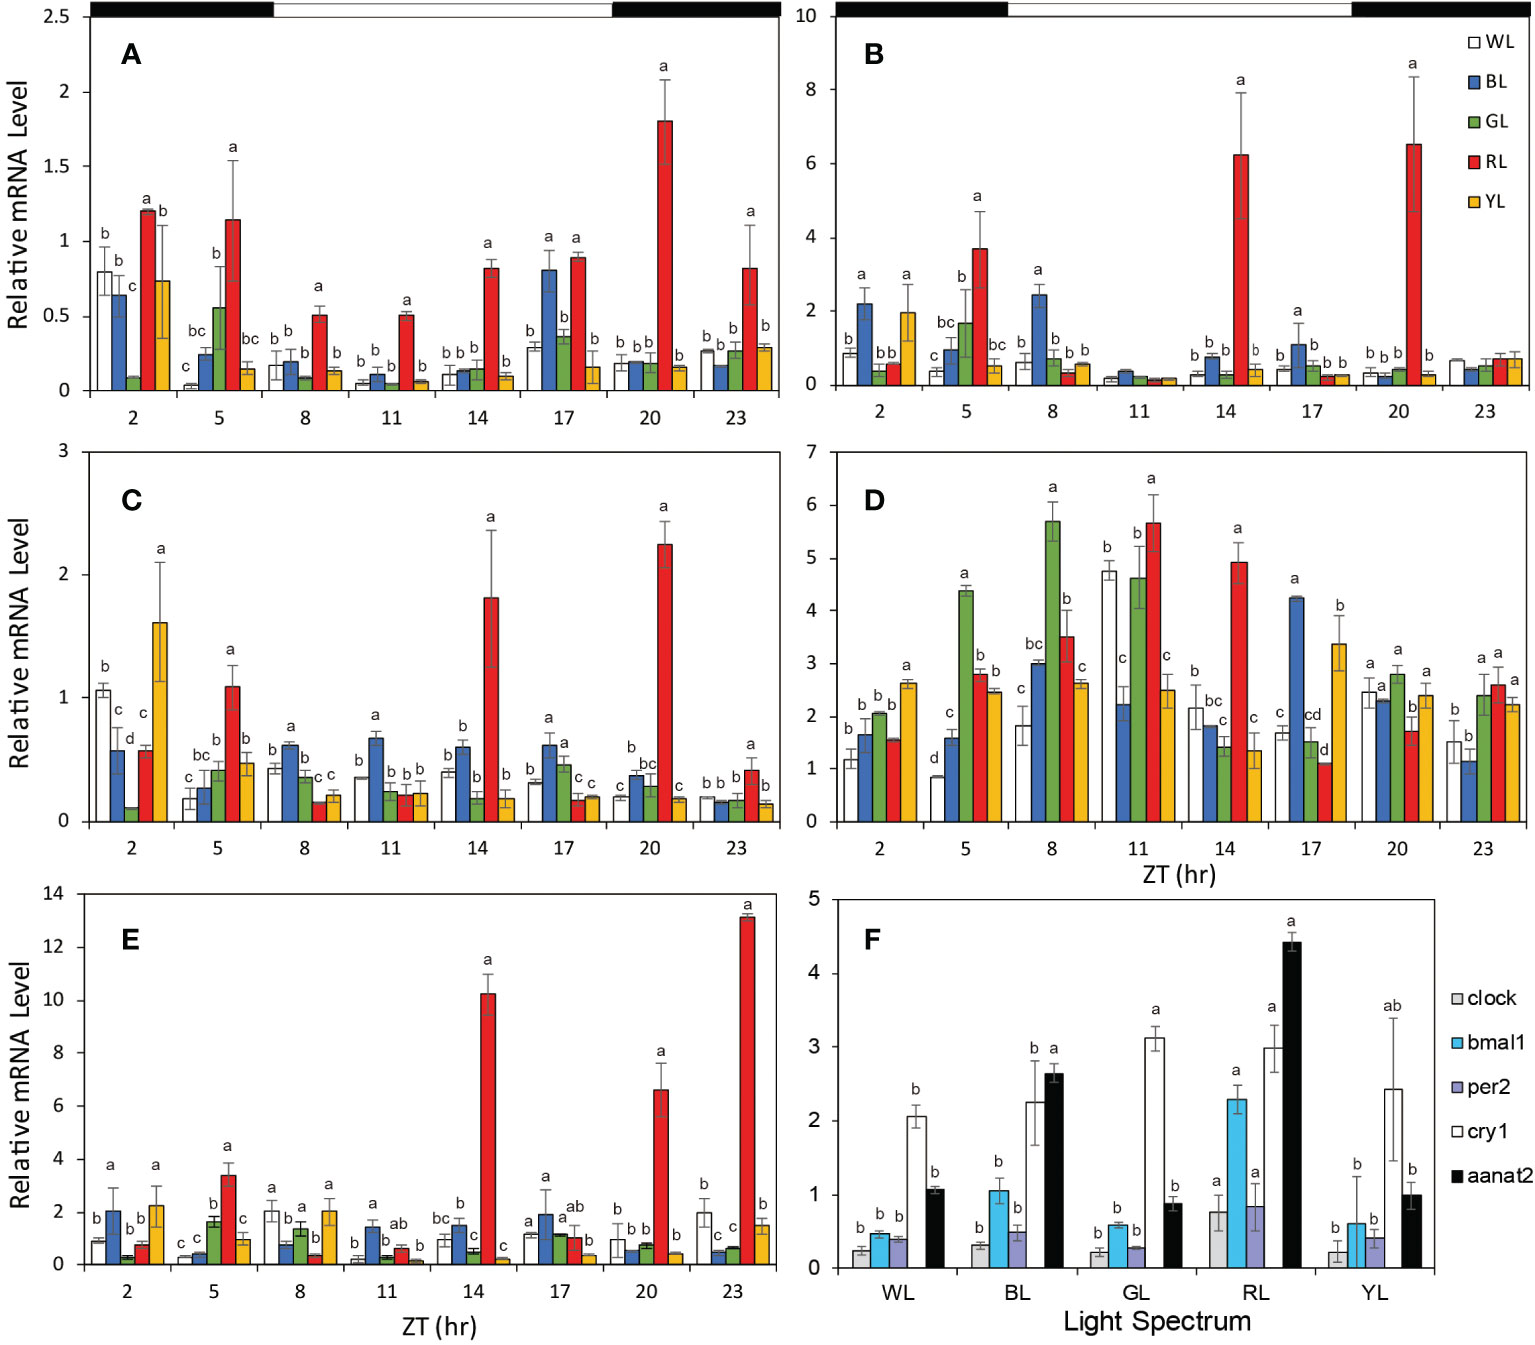
Figure 2 The relative mRNA levels of clock genes and Aanat2 in brains under different light treatments. (A) Clock, (B) Bmal1, (C) Per2, (D) Cry1, (E) Aanat2. (F) Average expressions of all clock genes and Aanat2 under different light. The horizontal white bars on the top of figures represent the light period, and the black bars represent the dark period. The data is shown as the mean ± SEM. N = 3 brains per time point. The different letters upon the bars indicate significant difference among the five light groups at each time point. (p < 0.05), post hoc LSD. ZT, zeitgeber time; WL, white light; BL, blue light; GL, green light; RL, red light; t; YL, yellow light.
3.2. Rhythms of clock genes expression
When fish were reared under various LED spectrum for 50 days, the diurnal changes in mRNA express levels of most clock genes in brain still displayed obvious diurnal oscillation. For positive clock genes (Clock and Bmal1), the temporal expression patterns showed increases during the scotophase and decreases during the photophase, with peaks near the middle of the darkness (Figure 3). According to cosinor analysis, the Clock gene expression showed a stable circadian rhythm (R2 = 0.578-0.824, P =0.000- 0.027, Table 2, Figure 3A). However, the mesors, amplitudes and acrophase varied significantly under the different monochromatic lights (Table 2). The mesors and amplitudes were the largest in RL, followed by BL, WL and YL, and smallest in GL. Compared with the WL, the acrophase of Clock was delayed under all light treatments (BL: + 3.7h, RL: +2.4, YL: + 4.94 and GL: +0.05, Table 2, Figure 4). For the other positive clock gen Bmal1, the gene expression appeared circadian rhythm under WL (R2 = 0.826, P =0.000), GL (R2 = 0.633 P =0.000) and RL (R2 = 0.537, P =0.000), while it did not show circadian rhythm under BL (R2 = 0.199, P=0.000) and YL (R2 = 0.398, P =0.000) (Table 2, Figure 3B). The mesors, amplitudes and acrophases of Bmal1 presented variable characteristics for WL, GL and RL treatments. The mesor was largest in BL, followed by YL, WL, GL and RL. The amplitudes had different pattern with the mesor in different light groups, largest in YL, similar in WL and RL, smallest in GL. Compared with WL, all acrophases of Bmal1 were delayed under the other light groups (BL: +6.73 h, GL: 0.16 h, RL: +1.35 h, YL: 2.00 h) (Table 2, Figure 4).
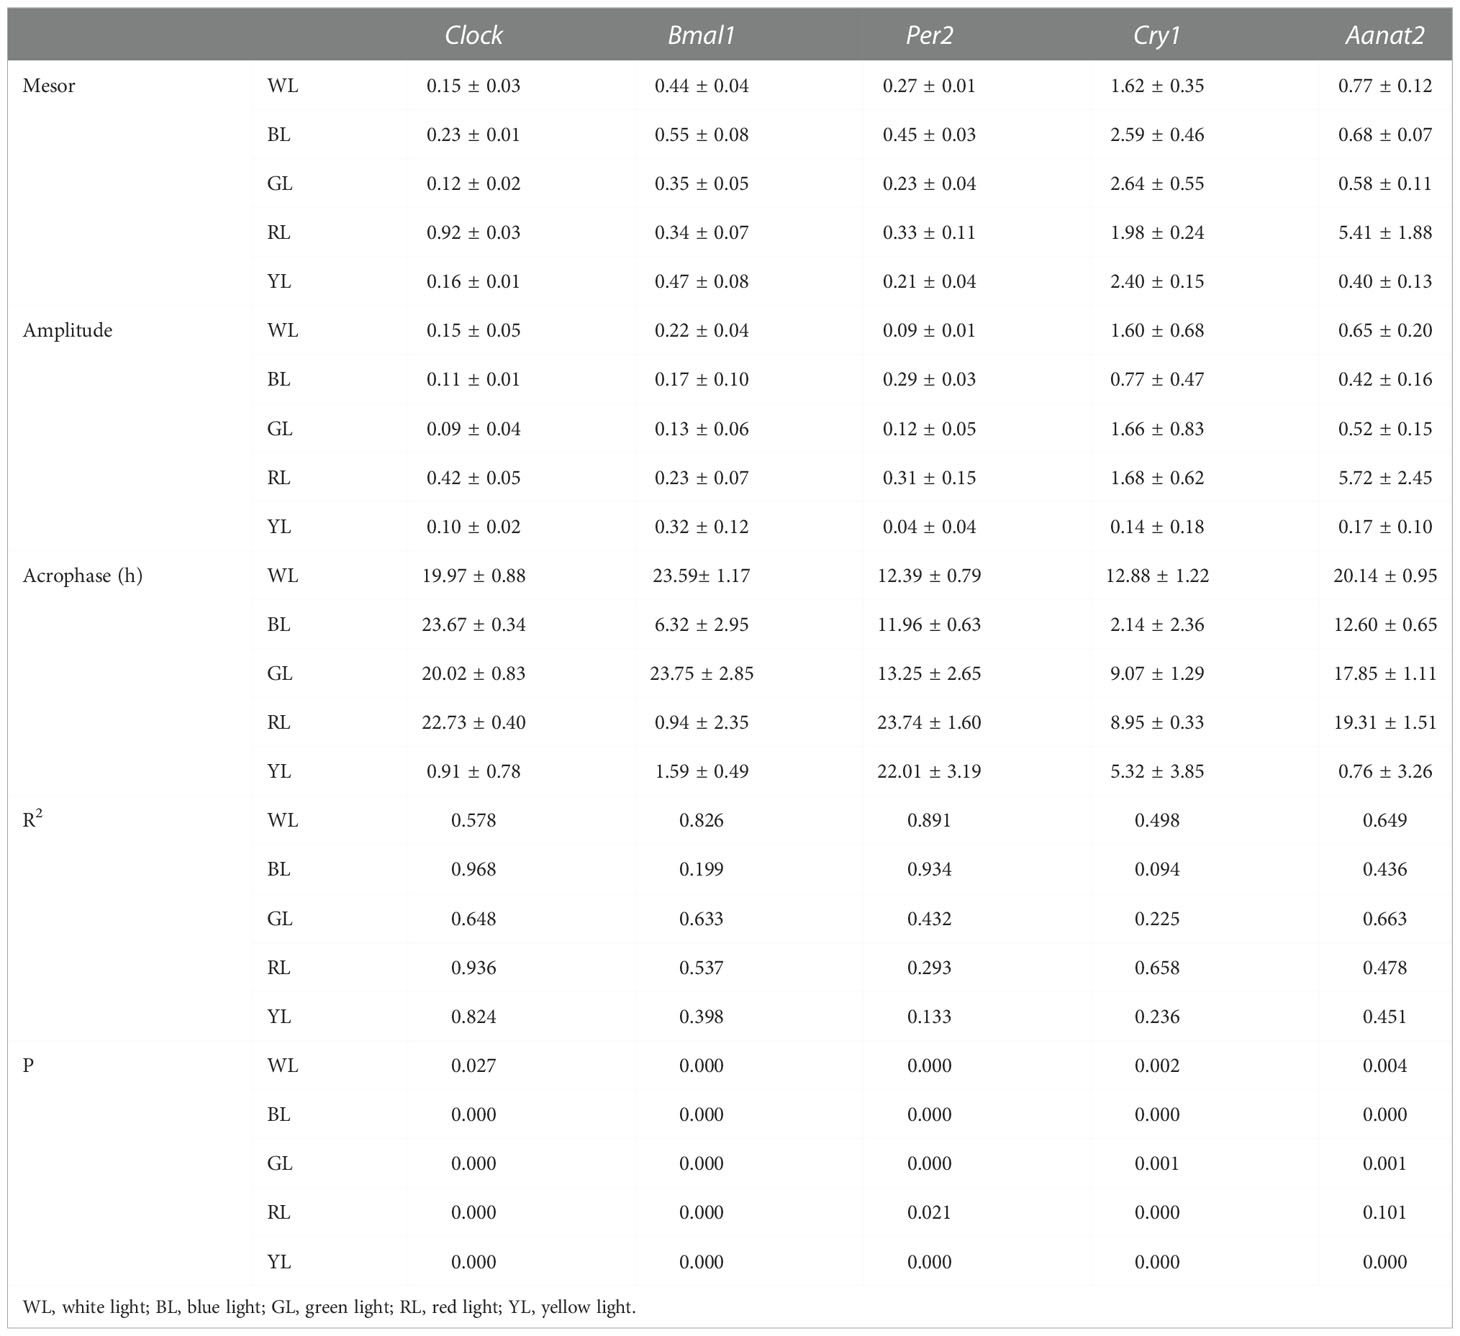
Table 2 Rhythm parameters (mean ± SEM) of clock genes and Aanat2 in brain under different light treatments.
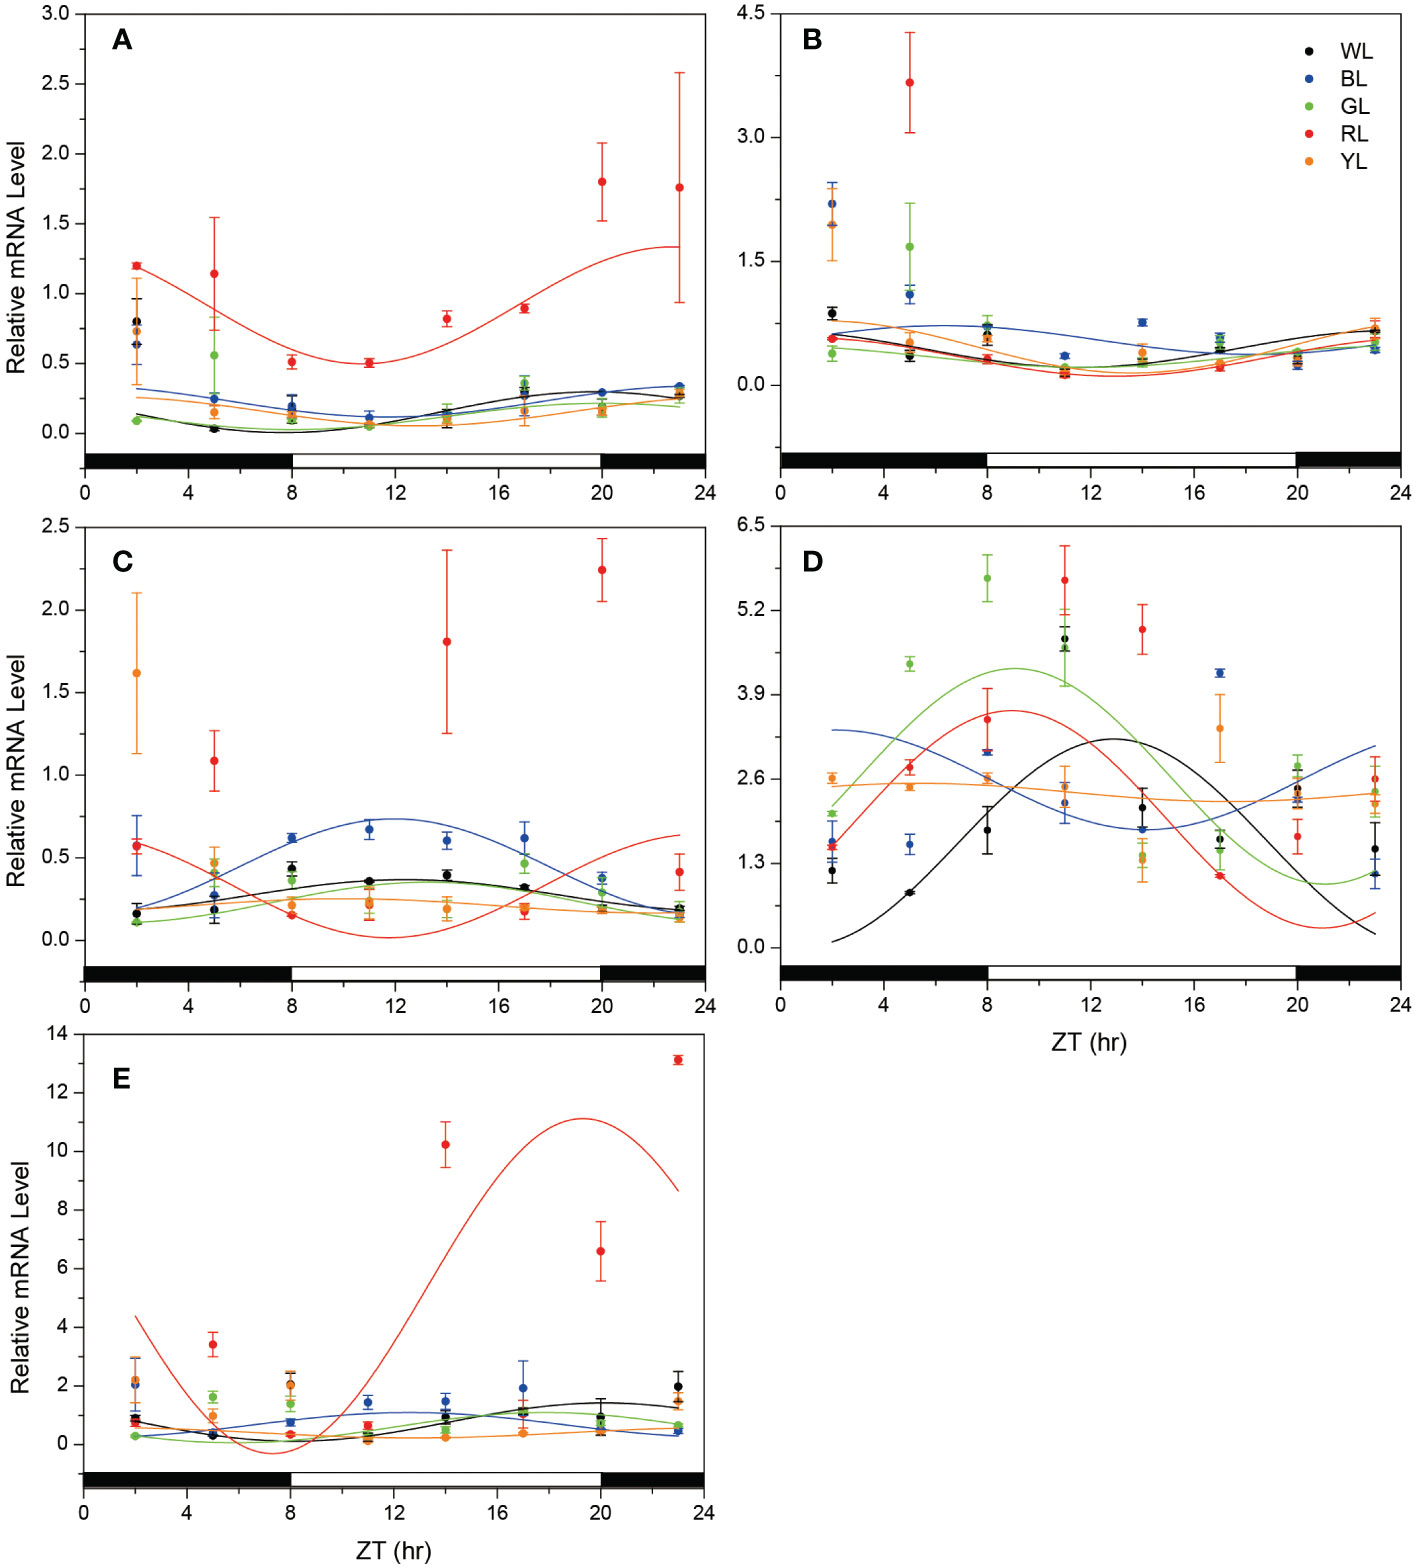
Figure 3 Temporal changes in the mRNA levels of clock genes and Aanat2 in the fish brain under different light treatments. (A) Clock, (B) Bmal1, (C) Per2, (D) Cry1, (E) Aanat2. The horizontal white bar on each figure represents the light period, and the black bar represents the dark period. The data is shown as the mean ± SEM. N = 3 brains per time point. The curve indicates the best fit to the points by cosinor analysis. ZT, zeitgeber time; WL, white light; BL, blue light; GL, green light; RL, red light; YL, yellow light.
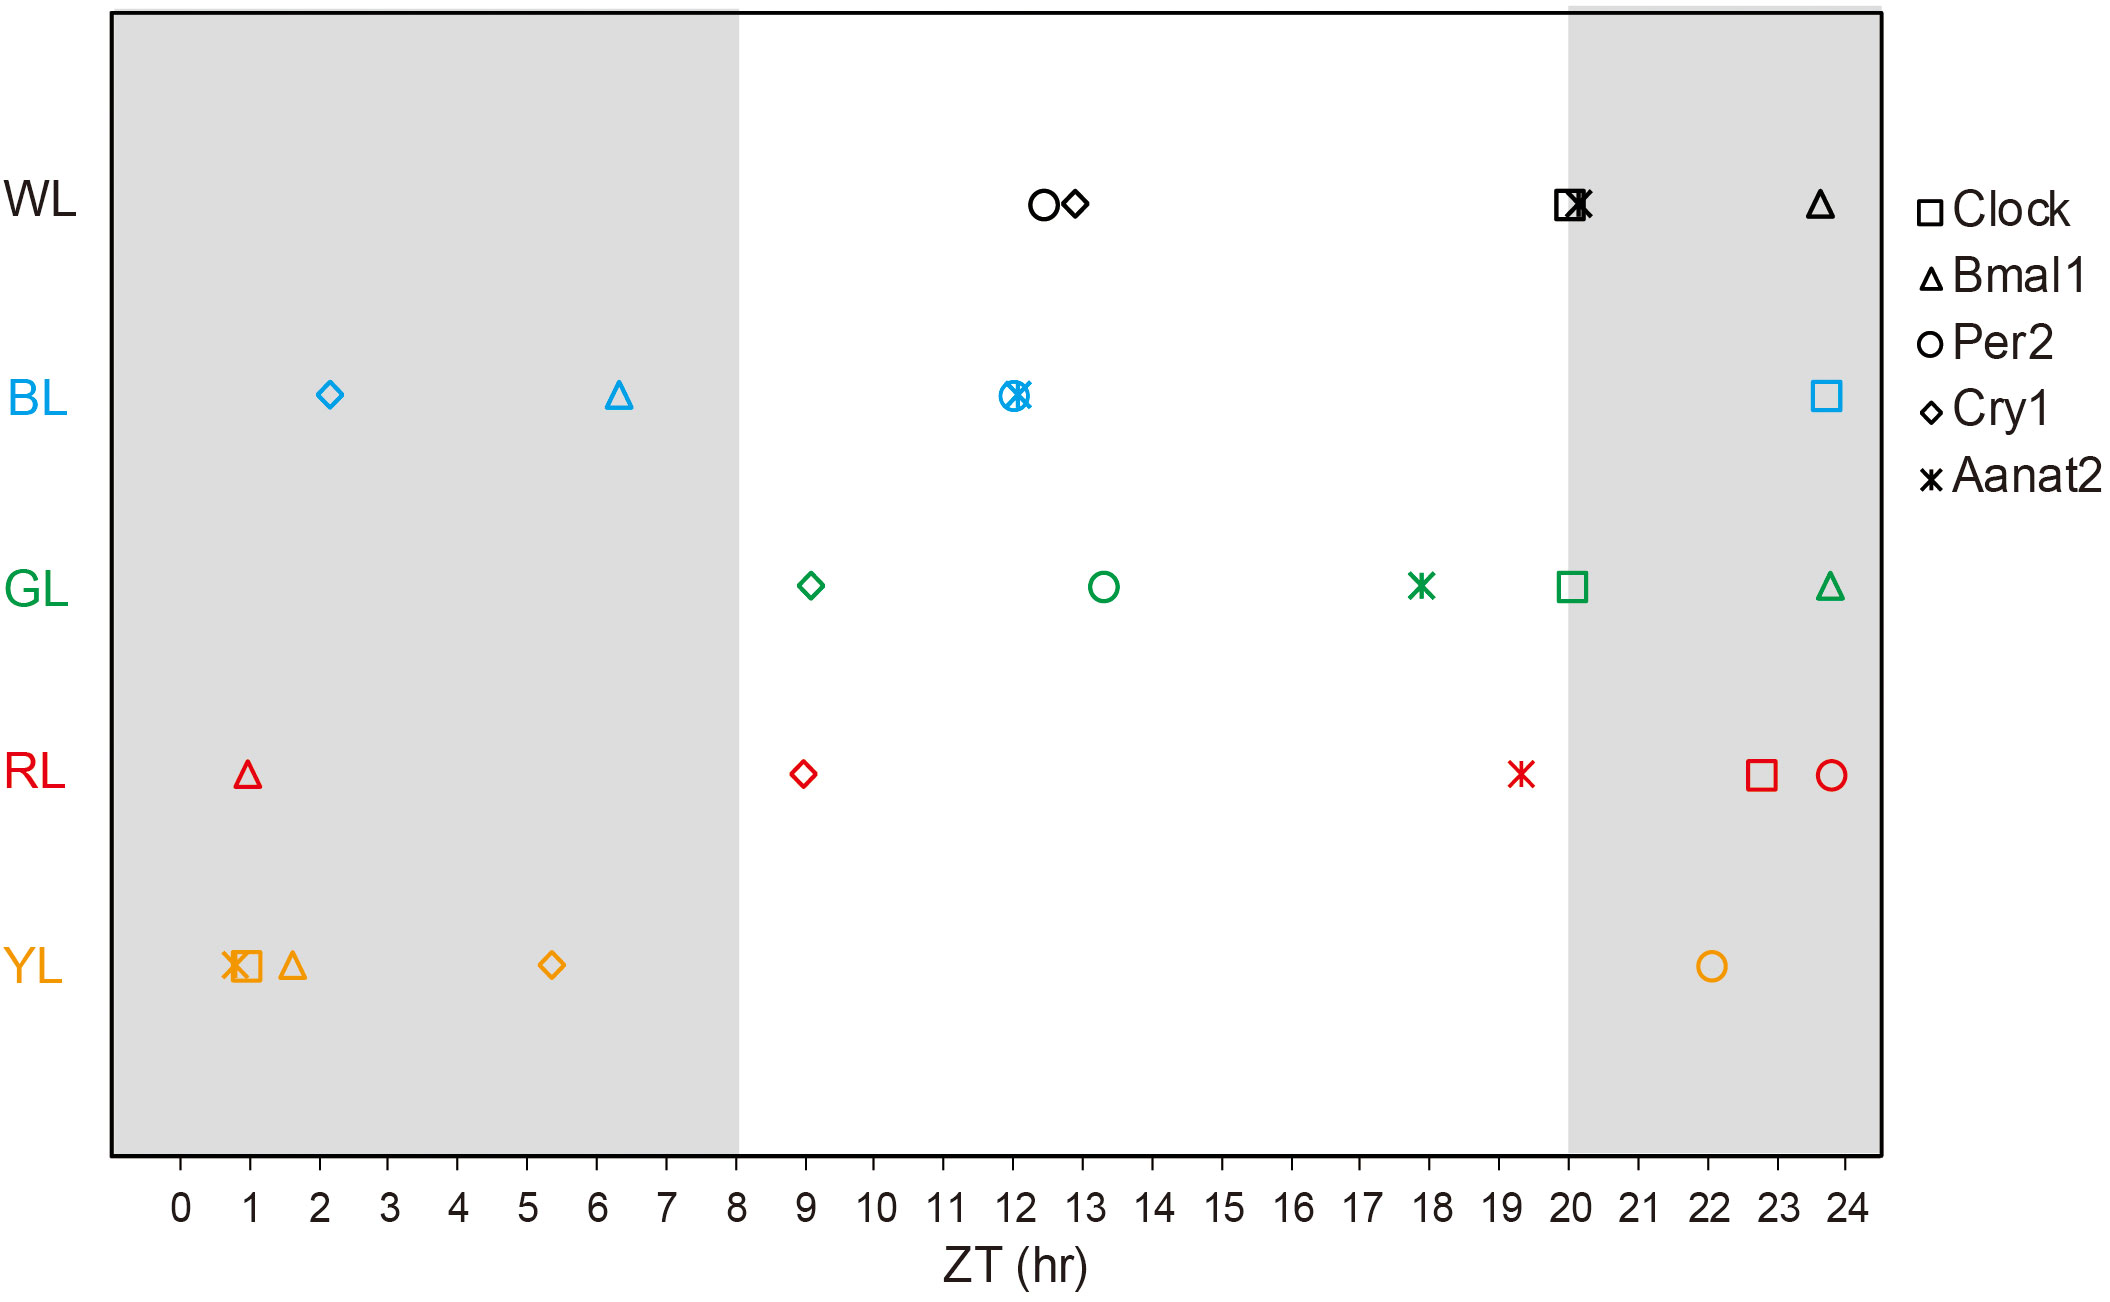
Figure 4 Acrophase of the transcription of clock genes and Aanat2 in the brains under different light treatments. The acrophase was done from the data presented in Table 2. The white background indicates the light time; the dark background indicates the dark time. ZT, zeitgeber time; WL, white light; BL, blue light; GL, green light; RL, red light; YL, yellow light.
Resemble to positive clock genes, the diurnal variation in mRNA expression of negative clock genes also retained significant circadian oscillation in the brain of fish under various light spectral conditions. Likewise, the cosinor analysis showed robust circadian rhythm in the mRNA expressions. However, the daily expression patterns of the negative clock genes oscillated in the opposite phase from the positive clock genes, showing increasing mRNA levels during the light, decreases during the dark, and peaks near the shift from night to day, except Per2 in RL and Cry1 in BL (Figure 3C) As shown in Table 2, the mesors of Per2 were smallest in YL and largest in BL among all light-treatment groups, while the mesors of cry1 were smallest in WL and largest in GL. In terms of amplitude, the variation lacked a consistent pattern, although compared with the other treatments, the amplitudes of Cry1 and Per2 were largest in RL and smallest in YL. For the phase-shift in gene expression levels (Table 2 and Figure 3),compared to WL, Cry1 showed advanced acrophase under all light treatments (BL: -10.74 h, GL:-3.81 h, RL: -3.93 h, YL: -7.56 h) but Per2 showed delayed acrophase in all light treatments (GL: +0.86 h, RL: +10.35 h, YL: +9.62 h), except in BL (-0.43 h), even though the rhythmicity of Cry1 tended to fail in BL (R2 = 0.094, P = 0.000), GL (R2 = 0.225, P = 0.001) and YL(R2 = 0.133, P= 0.000), and Per2 tended to fail in GL(R2 = 0.432, P = 0.000), RL(R2 = 0.293, P= 0.021) and YL(R2 = 0.133, P= 0.000) (Table 2, Figure 4).
3.3. Rhythms and relative mRNA levels of Ananta2
Temporal patterns of Aanat2 mRNA expression exhibited significant circadian oscillation, with low melatonin levels during the light period and high levels in the dark period when the fish were exposed to WL (R2 = 0.649, p=0.004, Figure 3E, Table 2). According to the cosinor analysis, the daily change in Aanat2 mRNA level also exhibited robust circadian rhythms in GL group (R2 = 0.663, P= 0.001, Figure 3E, Table 2). The mesor and amplitude of melatonin levels were largest in RL, followed by WL and BL, and were smallest in YL (Table 2). In addition, the acrophase was advanced in RL (−0.83 h), BL (-7.54 h) and GL (-2.29 h) compared to WL (Table 2 and Figure 4). Statistical analysis revealed that differences in the Ananta2 relative mRNA level between light treatments can be seen throughout the day (Figure 2E). Compared to other light conditions, RL enhanced the Ananta2 relative mRNA level (Figure 2E). No significant difference was observed in Ananta2 relative mRNA level among GL, YL and WL throughout the day.
4. Discussion
4.1. Effects of light spectrum on relative mRNA levels of clock genes
Light is the most important external signal to regulate the biological clock. Weger et al. (2011) analyzed and compared the zebrafish larvae, heart tissue cultured in vitro and zebrafish cell lines exposed to light for 1 h and 3 h under constant dark conditions with the control group without light, and found that there were 117 light regulating genes, including 90 genes up-regulated by light and 27 genes inhibited by light. The functions of these 117 genes focus on biological clock regulation, stress response, retinal light reception, metabolism and DNA repair. In the classification of biological clock regulation, Per2 gene was up-regulated most significantly. It was up-regulated 30 times in juvenile fish after 3 hours of light and 23 times in cell lines. Cry1Aa and Cry1Ba are two other genes that are significantly up regulated in juvenile fish and cell lines. In addition, Bmal2 gene was also up-regulated in young fish, Clock1b in vitro heart tissue and Cry2 in cell line (Weger et al., 2011). In this study, European sea basses were exposed to different light spectral conditions for 50 days, 24-h expressions of for core clock genes remained to show a robust circadian oscillation. However, the significant difference of clock genes’ mRNA levels was found between different light treatment. Especially, RL obviously enhanced the average mRNA expressions of Clock and Bmal1 throughout the day. GL decreased the expressions of these three genes (Clock, Bmal1 and Cry1). In term of light spectrum, a previous research found GL increased the expressions of Clock and Bmal1 and RL showed the opposite role in chick pineal gland after 14 days supplement (Jiang et al., 2016).
4.2. Effects of light spectrum on rhythms of clock genes expression
Circadian rhythm participates in all physiological activities of organisms, and its important role has attracted more and more attention. Circadian rhythm is involved in biological metabolism, immune regulation and other life activities. In mammals, knockout of Clock gene will cause mice to show circadian clock rhythm disorder, increased appetite, excessive obesity, and easy to form hyperlipidemia and hyperglycemia (Turek et al., 2005). In mouse liver tissue, more than 100 metabolism related genes showed circadian rhythm. The expression of these genes decreased in varying degrees in mouse liver after knock-out of Clock gene but increased in mouse liver after knock-out of Cry gene (Oishi et al., 2003), which further proved that liver metabolic activity was regulated by circadian clock genes. Velarde et al. (2009) studied the circadian rhythm of Cry1, Cry2, Cry3, Per1, Per2 and Per3 in goldfish liver under LD light. The results show that Cry1, Per1 and Per2 have no obvious circadian rhythm, the peak of Cry2 occurs during the day, the peak of Cry3 mRNA expression occurs at the alternation of day and night, and the mRNA level of Per3 is the highest in the middle of the night. Herrero and Lepesant (2014)studied the expression of select clock genes (Clock, Bmal1, Per2, Cry1) throughout the day and across the four seasons for two consecutive years in the pituitary of adult seabass (Dicentrarchus labrax) and found that the expression of Clock and Bmal1 showed highest values at the end of the day and during the night, while that of Per and Cry was mostly antiphasic, with high values during the day. Clock genes display rhythmic daily expression in the pituitary of adult sea bass, which are profoundly modified according to the season. The effect of photoperiod on clock gene expression may be mediated, at least in part, by melatonin, and that temperature may have a key role adjusting seasonal variations. In this study, the expression levels of clock genes (Clock, Bmal1, Per2, Cry1, Cry2) and Aanta2 genes of European tongue bass under different light spectral treatments were investigated. Cosinor analysis revealed that exposure to white light in LD 12:12 resulted in that all seven clock genes oscillated with strong circadian rhythmicity. However, their mRNA expression patterns displayed the daily fluctuations in abundance characteristic of clock genes. The diurnal changes in two positive clock gene transcripts (Clock and Bmal1) were characterized by a progressive mRNA increase during the dark phase and a progressive decrease during the light phase in WL, and the acrophases of Clock and Bmal1 occurred at ZT 19.09–20.85 and 22.42-0.76, respectively. The peak phase of positive clock gene clock appeared in the light dark transition, while the peak phase of Bmal1 gene appeared at night. For the negative clock genes, Cry1 and per2 transcripts were up regulated by light and peaked at ZT 12.39 (Cry1) and ZT 12.88 (Per2), similar to the daily profiles of positive clock genes. In contrast to positive clock genes, the temporal expression patterns of Per genes (Per2 and Per3), which are negative elements, exhibited an antiphase with peak values at ZT 12-14 and a trough at the midnight. These results corroborate previous studies in pituitary of the European seabass (Herrero and Lepesant, 2014).
This study examined the effects of different light spectrum on the expression of circadian clock genes in the brain of European tongue bass. Under the irradiation of light spectrum, some clock genes still maintain obvious circadian oscillation, while the rhythm of some clock genes is not obvious and may be destroyed. For example, Clock showed obvious rhythm under different spectral treatments (R2 = 0.578 ~ 0.968, P < 0.05); Bmal1 did not show obvious rhythm under BL (R2 = 0.199) and YL (R2 = 0.398); Per2 did not show obvious rhythm in RL (R2 = 0.293) and YL (R2 = 0.133); Cry1 in BL (R2 = 0.094), GL (R2 = 0.225) and YL (R2 = 0.236), which may indicate that the rhythms of different circadian clock genes are affected by different spectra. Similar studies have shown that mouse Cry gene plays an important role in circadian rhythm oscillation (Baggs et al., 2009), but some studies have also shown that Cry is relatively more sensitive to blue light irradiation in some vertebrates, such as fish (Ramos et al., 2014) and mice (Kobayashi et al., 1998). In addition to rhythm, the amplitude, phase and median of clock gene expression in European seabass also changed significantly under different light spectrum. In terms of amplitude and median, the expression of positive regulatory clock genes increased in red light and decreased in green light; Negative regulatory genes also showed no obvious law. Compared with white light, green light delayed the phases of all positive clock genes (+ 0.05 ~ 0.16 h), while blue light advanced the phases of all negative clock genes (- 0.43 ~ 10.74 h). Similar studies have shown that in human leukocytes, the peak phase of Per3 is advanced under blue light and delayed under green light (Ackermann et al., 2009). Therefore, this study also confirmed that the gene level of fish circadian clock showed obvious circadian rhythm, and different light wavelengths also had obvious effects on amplitude and median. These results are consistent with Jiang et al. (2016) reported the effects of different monochromatic light on the biological clock genes in the pineal gland of poultry. It was found that compared with white light, blue light advanced the phases of all negative clock genes and delayed the phases of all positive clock genes, red light advanced the phases of all clock genes, and green light delayed the phases of all clock genes. This also shows that the effects of light environment on circadian clock genes are also different among different species.
4.3. Effects of light spectrum on rhythms and relative mRNA levels of Ananta2
The pineal gland participates in the regulation of animal physiological rhythm through the secretion of melatonin. Studies have shown that the synthesis and release of melatonin are regulated by light. Darkness can stimulate the synthesis and release of melatonin, and light can inhibit the synthesis and release of melatonin (Falcón et al., 2010). The synthesis of melatonin requires the action of two enzymes: arylalkylamine-n-acetyltransfer-ferase-2 (Aanat2) and hydroxyindole-o-methyltransferase (Himot), The former aminoacetylates arylalkyl amines (5-HT) and the latter methylates indole cyclic hydroxyl (Falcón et al., 2007). Almost all vertebrate Aanat enzyme regulatory systems contain two regulatory elements to regulate dynamic activity, namely circadian clock and a “off” mechanism. Circadian biological clock is a circadian oscillator composed of transcription, translation and feed loop, which can regulate gene transcription by acting on the E-boxes promoter of gene (Reppert and Sagar, 1983; Racz et al., 2008). The oscillation of biological clock can be pulled by the cyclic change of ambient light. Another regulatory mechanism, the “off” mechanism, can cause the rapid inhibition of light. This is achieved by reducing the level of cycloadenoxic acid, which leads to the disintegration of the complex of Aanat, resulting in conformational change and loss of enzyme activity (Falcón et al., 2010). The model of the role of these two mechanisms was found in baby fish. For the regulation of salmon Aanat enzyme activity, there is only the stop mechanism of light without the regulation of clock (Reppert and Weaver, 2001). This study showed that different spectra had significant effects on the circadian expression of melatonin key synthase in the brain of European seabass. The expression of Aanat2 gene in fish brain under red light was significantly higher than that in other light groups. There was no significant difference among other light groups. Similar findings have been made in previous studies. Red light significantly increased the expression level of Aanat2 enzyme mRNA in pineal organ of goldfish pineal gland and the level of melatonin stimulation in blood (Shin et al., 2011). In addition, red light not only increases the expression of biological clock gene, but also increases the expression level of Aanat2 enzyme, indicating that the spectrum may regulate the expression of clock-controlled gene Aanat2 by affecting the expression of clock gene in fish brain. As for how light spectrum affects the expression of melatonin rate limiting enzyme and melatonin secretion by affecting the expression of circadian clock genes in the brain, more scientific research is needed to reveal.
5. Conclusions
In conclusion, this paper studied the effects of different light spectral environments on the circadian expression levels of circadian clock genes and Aanat2 genes in the brain of European seabass. The results showed that light spectrum could not only affect the expression level of circadian clock genes, but also affect the phase, amplitude and acrophase of different circadian clock genes. Red light can increase the expression level of all biological clock genes and the expression level of Aanat2 gene in the brain of European seabass. Therefore, Spectrum has a significant effect on the circadian clock genes of fish. The results indicate that RL may regulate the expression of Aanat2 gene by affecting the expression of clock gene in fish brain. Spectrum can affect the biological clock system of fish, and unreasonable spectrum may disturb the rhythm of gene expression of biological clock of fish. In the future research, more scientific research is needed to explain the specific process and molecular mechanism of spectrum affecting fish biological clock.
Data availability statement
The original contributions presented in the study are included in the article/supplementary material, further inquiries can be directed to the corresponding author/s.
Ethics statement
The animal study was reviewed and approved by animal care and use guideline of the Fishery Resources Enhancement Laboratory at Dalian Ocean University.
Author contributions
HM: Conceptualization; Methodology; Investigation; Writing; Editing; Funding Acquisition. SL: Methodology; Investigation; Data curation; Writing. PW: Methodology; Investigation; Writing. FF: Methodology; Investigation. JR: Formal analysis; Investigation; Methodology. MD: Conceptualization; Methodology; Editing; Funding Acquisition. ZM: Methodology, Funding Acquisition. YL: Conceptualization; Writing - review and editing; Funding Acquisition. All authors contributed to the article and approved the submitted version.
Funding
This research was supported by the Key Program of the National Natural Science Foundation of China (Grant No. 42030408 and 32202961), the Science & Technology Program of Liaoning Province (2021JH2/10200011 and 2019JH2/10200007), the earmarked fund for CARS-49, Open project of Key Laboratory of Environment Controlled Aquaculture (Dalian Ocean University) Ministry of Education (202202), the Scientific and Technical Innovation Project of Dalian, Liaoning Province, China (2021JJ13SN72) and the Innovation Support Program for High-level Talents of Dalian City (2020RQ111).
Acknowledgments
We would like to thank Song Chuangbin at Institute of semiconductors, Chinese Academy of Sciences for LED lights design.
Conflict of interest
The authors declare that the research was conducted in the absence of any commercial or financial relationships that could be construed as a potential conflict of interest.
Publisher’s note
All claims expressed in this article are solely those of the authors and do not necessarily represent those of their affiliated organizations, or those of the publisher, the editors and the reviewers. Any product that may be evaluated in this article, or claim that may be made by its manufacturer, is not guaranteed or endorsed by the publisher.
References
Ackermann K., Sletten T. L., Revell V. L., Archer S. N., Skene D. J. (2009). Blue-light phase shifts PER3 gene expression in human leukocytes. Chronobiol. Int. 26 (4), 769–779. doi: 10.1080/07420520902929045
Baggs J. E., Price T. S., Ditacchio L., Panda S., Fitzgerald G. A., Hogenesch J. B. (2009). Network features of the mammalian circadian clock. PloS Biol. 7 (3), e1000052-. doi: 10.1371/journal.pbio.1000052
Bass J., Takahashi J. S. (2010). Circadian integration of metabolism and energetics. Sci. (80-. ). 330 (6009), 1349–1354. doi: 10.1126/science.1195027
Bayarri M. J., Madrid J. A., Sánchez-Vázquez F. J. (2002). Influence of light intensity, spectrum and orientation on sea bass plasma and ocular melatonin. J. Pineal Res. 32 (1), 34–40. doi: 10.1034/j.1600-079x.2002.10806.x
Betancor M. B., Sprague M., Ortega A., de la Gándara F., Tocher D. R., Ruth R., et al. (2020). Central and peripheral clocks in Atlantic bluefin tuna (Thunnus thynnus, l.): Daily rhythmicity of hepatic lipid metabolism and digestive genes. Aquaculture. 523, 735220. doi: 10.1016/j.aquaculture.2020.735220
Brooks E., Canal M. M. (2013). Development of circadian rhythms: Role of postnatal light environment. Neurosci. Biobehav. Rev. 37 (4), 551–560. doi: 10.1016/j.neubiorev.2013.02.012
Brown S. A., Ripperger J., Kadener S., Fleury-Olela F., Vilbois F., Rosbash M., et al. (2005). Cell biology: PERIOD1-associated proteins modulate the negative limb of the mammalian circadian oscillator. Science 308 (5722), 693–696. doi: 10.1126/science.1107373. (80-. ).
Cuesta I. H., Lahiri K., Lopez-Olmeda J. F., Loosli F., Foulkes N. S., Vallone D. (2014). Differential maturation of rhythmic clock gene expression during early development in medaka (Oryzias latipes). Chronobiol. Int. 31 (4), 468–478. doi: 10.3109/07420528.2013.856316
Dai M. Y., Ren J. L., Fei F., Wei P. P., He M. A., Gao D. K., et al. (2019). Effects of LED light color on antioxidant capacity and digestibility of sea bass (Dicentrarchus labrax) juveniles. Mar. Sci. 43 (4), 16–21. doi: 10.11759/hykx20180903004
Dardente H., Cermakian N. (2007). Molecular circadian rhythms in central and peripheral clocks in mammals. Chronobiol. Int. 24 (2), 195–213. doi: 10.1080/07420520701283693
Delaunay F., Thisse C., Marchand O., Laudet V., Thisse B. (2000). An inherited functional circadian clock in zebrafish embryos. Sci. (80-. ). 289 (5477), 297–300. doi: 10.1126/science.289.5477.297
Eckel-Mahan K., Sassone-Corsi P. (2009). Metabolism control by the circadian clock and vice versa. Nat. Struct. Mol. Biol. 16 (5), 462–467. doi: 10.1038/nsmb.1595
Falcón J., Besseau L., Sauzet S., Boeuf G. (2007). Melatonin effects on the hypothalamo-pituitary axis in fish. Trends Endocrinol. Metab. 18 (2), 81–88. doi: 10.1016/j.tem.2007.01.002
Falcón J., Migaud H., Muñoz-Cueto J. A., Carrillo M. (2010). Current knowledge on the melatonin system in teleost fish. Gen. Comp. Endocrinol. 165 (3), 469–482. doi: 10.1016/j.ygcen.2009.04.026
Fei F., Ren J., Dai M., Wei P., He M. A., Gao D., et al. (2019). Effects of five kinds of light color environments on nutritional quality of Dicentrarchus labrax. Chin. J. Anim. Nutr. 31 (5), 1–11. doi: 10.3969/j.issn.1006-267x.2019.05.051
Herrero M. J., Lepesant J. M. J. (2014). Daily and seasonal expression of clock genes in the pituitary of the European sea bass (Dicentrarchus labrax). Gen. Comp. Endocrinol. 208, 30–38. doi: 10.1016/j.ygcen.2014.08.002
Huang T. S., Ruoff P., Fjelldal P. G. (2010). Effect of continuous light on daily levels of plasma melatonin and cortisol and expression of clock genes in pineal gland, brain, and liver in atlantic salmon postsmolts. Chronobiol. Int. 27 (9/10), 1715–1734. doi: 10.3109/07420528.2010.521272
Jiang N., Wang Z., Cao J., Dong Y., Chen Y. (2016). Role of monochromatic light on daily variation of clock gene expression in the pineal gland of chick. J. Photochem. Photobiol. B Biol. 164, 57–64. doi: 10.1016/j.jphotobiol.2016.09.020
Klein D. C., Reppert S. M. (1992). Neural oscillations. (Book reviews: Suprachiasmatic nucleus. the mind’s clock.). Sci. (80-. ). 257, 1146–1148. doi: 10.1126/science.257.5073.1146
Kobayashi K., Kanno S. I., Smit B., van der Horst G. T. J., Takao M., Yasui A. (1998). Characterization of photolyase/blue-light receptor homologs in mouse and human cells. Nucleic Acids Res. 26 (22), 5086–5092. doi: 10.1093/nar/26.22.5086
Lazado C. C., Kumaratunga H. P. S., Nagasawa K., Babiak I., Giannetto A., Fernandes J. M. O. (2014). Daily rhythmicity of clock gene transcripts in Atlantic cod fast skeletal muscle. PloS One 9 (6), e99172. doi: 10.1371/journal.pone.0099172
McStay E., Migaud H., Vera L. M., Sánchez-Vázquez F. J., Davie A. (2014). Comparative study of pineal clock gene and AANAT2 expression in relation to melatonin synthesis in Atlantic salmon (Salmo salar) and European seabass (Dicentrarchus labrax). Comp. Biochem. Physiol. - A Mol. Integr. Physiol. 169, 77–89. doi: 10.1016/j.cbpa.2013.12.011
Millot S., Bégout M. L. (2009). Individual fish rhythm directs group feeding: A case study with sea bass juveniles (Dicentrarchus labrax) under self-demand feeding conditions. Aquat. Living Resour. 22 (3), 363–370. doi: 10.1051/alr/2009048
Nagasawa K., Giannetto A., Fernandes J. M. O. (2012). Photoperiod influences growth and MLL (mixed-lineage leukaemia) expression in Atlantic cod. PloS One 7 (5), e36908. doi: 10.1371/journal.pone.0036908
Oishi K., Miyazaki K., Kadota K., Kikuno R., Nagase T., Atsumi G. I., et al. (2003). Genome-wide expression analysis of mouse liver reveals CLOCK-regulated circadian output genes. J. Biol. Chem. 278 (42), 41519–41527. doi: 10.1074/jbc.M304564200
Patiño M. A. L., Rodríguez-Illamola A., Conde-Sieira M., Soengas J. L., Míguez J. M. (2011). Daily rhythmic expression patterns of clock1a, bmal1, and per1 genes in retina and hypothalamus of the rainbow trout, oncorhynchus mykiss. Chronobiol. Int. 28 (5), 381–389. doi: 10.3109/07420528.2011.566398
Racz B., Horvath G., Faluhelyi N., Nagy A. D., Tamas A., Kiss P., et al. (2008). Effects of PACAP on the circadian changes of signaling pathways in chicken pinealocytes. J. Mol. Neurosci. 36 (1-3), 220–226. doi: 10.1007/s12031-008-9112-4
Ramos B. C. R., Moraes M. N. C. M., Poletini M. O., Lima L. H. R. G., Castrucci A. M. L. (2014). From blue light to clock genes in zebrafish ZEM-2S cells. PloS One 9 (9), e106252. doi: 10.1371/journal.pone.0106252
Ren J., Wei P., Fei F., Dai M., He M. A., Gao D., et al. (2019). Effects of LED spectrum on feeding, growth and energy distribution of juvenile Dicentrarchus labrax. J. Fish. China. 27 (9), 1062–1074. doi: 10.3724/SP.J.1118.2020.20383
Reppert S. M., Sagar S. M. (1983). Characterization of the day-night variation of retinal melatonin content in the chick. Investig. Ophthalmol. Vis. Sci. 24 (3), 294–300. doi: 10.1007/BF00141134
Reppert S. M., Weaver D. R. (2001). Molecular analysis of mammalian circadian rhythms. Annu. Rev. Physiol. 63, 647–676. doi: 10.1146/annurev.physiol.63.1.647
Sánchez J. A., Madrid J. A., Sánchez-Vázquez F. J. (2010). Molecular cloning, tissue distribution, and daily rhythms of expression of per1 gene in European sea bass (Dicentrarchus labrax). Chronobiol. Int. 27 (1), 19–33. doi: 10.3109/07420520903398633
Sato T. K., Panda S., Miraglia L. J., Reyes T. M., Rudic R. D., McNamara P., et al. (2004). A functional genomics strategy reveals rora as a component of the mammalian circadian clock. Neuron. 43 (4), 527–537. doi: 10.1016/j.neuron.2004.07.018
Schmutz I., Ripperger J. A., Baeriswyl-Aebischer S., Albrecht U. (2010). The mammalian clock component PERIOD2 coordinates circadian output by interaction with nuclear receptors. Genes Dev. 24, 345–357. doi: 10.1101/gad.564110
Shin H. S., Lee J., Choi C. Y. (2011). Effects of LED light spectra on oxidative stress and the protective role of melatonin in relation to the daily rhythm of the yellowtail clownfish, amphiprion clarkii. Comp. Biochem. Physiol. Part A Mol. Integr. Physiol. 160, 221–228. doi: 10.1016/j.cbpa.2011.06.002
Surbhi, Kumar V. (2015). Avian photoreceptors and their role in the regulation of daily and seasonal physiology. Gen. Comp. Endocrinol. 220, 13–22. doi: 10.1016/j.ygcen.2014.06.001
Tei H., Okamura H., Shigeyoshi Y., Fukuhara C., Ozawa R., Hirose M., et al. (1997). Circadian oscillation of a mammalian homologue of the drosophila period gene. Nature 389, 51–516. doi: 10.1038/39086
Turek F. W., Joshu C., Kohsaka A., Lin E., Ivanova G., McDearmon E., et al. (2005). Obesity and metabolic syndrome in circadian clock mutant nice. Science 308 (5724), 1043–1045. doi: 10.1126/science.1108750
Vatine G., Vallone D., Gothilf Y., Foulkes N. S. (2011). It’s time to swim! zebrafish and the circadian clock. FEBS Lett. 585 (10), 1485–1494. doi: 10.1016/j.febslet.2011.04.007
Velarde E., Haque R., Iuvone P. M., Azpeleta C., Alonso-Gomez A. L., Delgado M. J. (2009). Circadian clock genes of goldfish, carassius auratus: CDNA cloning and rhythmic expression of period and cryptochrome transcripts in retina, liver, and gut. J. Biol. Rhythms. 24 (2), 104. doi: 10.1177/0748730408329901
Weger B. D., Sahinbas M., Otto G. W., Mracek P., Armant O., Dolle D., et al. (2011). The light responsive transcriptome of the zebrafish: Function and regulation. PloS One 6 (2), e17080. doi: 10.1371/journal.pone.0017080
Keywords: LED spectrum, clock genes, Aanat2, circadian rhythmic, Dicentrarchus labrax
Citation: Ma H, Liu S, Wei P, Fei F, Ren J, Dai M, Ma Z and Liu Y (2023) Effects of LED spectrum on circadian rhythmic expression of clock genes and Aanat2 in the brain of juvenile European seabass (Dicentrarchus labrax). Front. Mar. Sci. 9:1005352. doi: 10.3389/fmars.2022.1005352
Received: 28 July 2022; Accepted: 06 December 2022;
Published: 05 January 2023.
Edited by:
Nicholas Simon Foulkes, Karlsruhe Institute of Technology (KIT), GermanyReviewed by:
Qin Tong, Chinese Agricultural University, ChinaHuan Gao, Jiangsu Ocean University, China
Jilin Xu, Ningbo University, China
Copyright © 2023 Ma, Liu, Wei, Fei, Ren, Dai, Ma and Liu. This is an open-access article distributed under the terms of the Creative Commons Attribution License (CC BY). The use, distribution or reproduction in other forums is permitted, provided the original author(s) and the copyright owner(s) are credited and that the original publication in this journal is cited, in accordance with accepted academic practice. No use, distribution or reproduction is permitted which does not comply with these terms.
*Correspondence: Ying Liu, liuyingzju@zju.edu.cn