 Songtao Liu1,2
 Ying Liu
 Xin Li
 Zhen Ma
 He Ma
He Ma
94% of researchers rate our articles as excellent or good
Learn more about the work of our research integrity team to safeguard the quality of each article we publish.
Find out more
ORIGINAL RESEARCH article
Front. Mar. Sci. , 24 October 2022
Sec. Marine Fisheries, Aquaculture and Living Resources
Volume 9 - 2022 | https://doi.org/10.3389/fmars.2022.1008068
This article is part of the Research Topic Aquaculture Environment Regulation and System Engineering View all 18 articles
Light has long been known to have a profound influence on the growth and development of fish. The previous studies showed that different spectra had different effects on the growth of juvenile Takifugu rubripes. Among them, green light can promote the growth of Takifugu rubripes, but the influence mechanism is unknown. In this study, how different LED spectrums affect fish growth from the perspective of GH/IGF-I axis-related genes and apoptosis genes were deeply explored. In the experiment, juvenile Takifugu rubripes with an initial body length of (9.01 ± 0.70) cm and an initial body weight of (18.05 ± 3.17) g were selected as the research objects. 525 Takifugu rubripes juveniles were selected, cultured and monitored in five different LED spectrum treatment groups: white light (WL, λ 400-780nm), red light (RL, λ 625-630nm), yellow light (YL, λ 590-595nm), green light (GL, λ 525-530nm) and blue light (BL, λ 450-455nm). The photoperiod was 12L:12D, and the light intensity was set to 250 mW/m2. The effects of light spectrum on growth, melatonin synthesis, GH/IGF-I axis and relative expressions of apoptosis-related genes in juvenile Takifugu rubripes were studied, including arylalkylamine N-acetyltransferase (AANAT2), growth hormone (GH), growth hormone receptor type 1 (GHR1), growth hormone releasing hormone (GHRH), insulin-like growth factor type I (IGF-I), insulin-like growth factor type II (IGF-II), insulin-like growth factor binding protein (IGFBP), Bcl-2 protein family (Bcl-2), tumor suppressor (p53) and cysteine protease family (caspase 3, caspase 8, caspase 10) genes. The results showed that the final weight was the highest in the GL group (29.36 ± 3.78 g) and the lowest in the YL group (21.28 ± 2.56 g). The GL indeed promote the growth of Takifugu rubripes. The GHR1, IGF-I, IGF-II and IGFBP of juvenile Takifugu rubripes cultured under GL were significantly higher than those of WL (control group), BL and YL groups. The relative expression levels of GH and GHRH genes had no difference from those in the WL control group, and the relative expression levels of apoptosis genes in the GL group were significantly lower than those in the BL and YL groups. Under RL, the relative expression levels of all growth genes on the GH/IGF-I growth axis were relatively high. But at the same time, the relative expression of caspase 10 gene in juvenile Takifugu rubripes was high, and the growth state was inhibited. It is speculated that RL might disturb the endocrine system of the juvenile Takifugu rubripes, thus impeded its growth and development. Therefore, different LED spectra can affect the growth of juvenile Takifugu rubripes by affecting the expressions of GH/IGF-I growth axis and apoptosis-related genes: GL significantly promotes the growth of Takifugu rubripes, which may be due to that GL promoted the expressions of growth factors genes such as GHR1, IGF-I, and IGF-II, and decreased the expression of apoptosis-related genes, while the situation in the YL, BL and WL groups was on the contrary. RL significantly inhibited the growth of juvenile Takifugu Rubripes, which may be due to the fact that juvenile Takifugu Rubripes under RL were in a stressful state and the high expression of growth axis-related genes was not sufficient to offset the negative effects of the stress response, resulting in the inhibition of growth performance.
As an important and complex ecological environment factor, light generally includes three elements, namely illuminance, spectral composition and photoperiod. It can directly or indirectly influence fish’s feeding, growth and development and physiological activities. When light travels underwater, the spectral components of the incident light will change to varying degrees, and the wavelengths will rapidly decay as the depth increases. The short wavelengths of the visible spectrum or blue wavelengths dominate in deep water, while RL can only penetrate shallow water. Therefore, fishes living in different water layers also have great differences in their sensitivity to light. It has been shown that different spectral environments can affect the stress response, physiological state, and behavior of fish, thus affecting growth performance, and have significant species specificity (Karakatsouli et al., 2010). For example, BL is not benefit to the growth of juvenile rainbow trout (Oncorhynchus mykiss) and RL is conducive to the growth of juvenile sea bream (Sparus aurata) (Wang et al., 2013). When reared under WL, the total length of juvenile European sea bass (Dicentrarchus labrax) increased significantly (Villamizar et al., 2009). However, the spectrum has no effect on the growth of juvenile Atlantic salmon (Salmo salar) and haddock (Melanogrammus aeglefinus) (Stefansson and Hansen, 1989; Downing, 2002).
The pineal gland of most fish has direct photosensitivity, and the effect of light on fish will also affect a series of physiological activities by affecting the secretion of melatonin (Mohamed et al., 2007; Migaud et al., 2012). Melatonin (N-acetyl-5-methoxytryptamine) is synthesized by tryptophan taken up by pineal cells. Aralkylamine N-acetyltransferase (AANAT) is one of the major synthases of melatonin, and its secretion level is consistent with the level of melatonin. The light-induced reduction of AANAT2 activity and melatonin secretion was a dose-dependent process. Because this is the process of inhibiting neurotransmitter release and depends on the spectral composition (Migaud et al., 2006). The light environment and melatonin will control the neuroendocrine axis, and the melatonin in the pineal gland will target the pituitary gland and surrounding tissues. It regulates the release of growth hormone (GH) and the possibility of affecting other pituitary hormones has not been ruled out (Sánchez-Vázquez et al., 2019). One study found that the expression level of GH mRNA was significantly higher after melatonin injection than in the control group and that melatonin played a role in regulating the growth of Amphiprion clarkii (Shin et al., 2012). It was also found that melatonin directly promoted the secretion of pituitary growth hormone (GH) in Oncorhynchus mykiss (Falcón et al., 2003). Prolonged darkness induces melatonin secretion in Paralichthys olivaceus, which increases GH mRNA expression and thus promotes weight gain in this species (Kim et al., 2019). Therefore, an increase in melatonin within a certain range can promote fish growth.
Animal growth is mainly regulated by the animal neuroendocrine system, and the growth axis (GH/IGF-I axis) is at the core of this system (Ayson and Takemura, 2006). Current studies have shown that the endocrine regulation pattern of teleost growth is similar to that of higher vertebrates and is mainly regulated by the growth hormone/insulin-like growth factor axis (GH/IGF-I axis) regulation. Studies have shown that the relative expression levels of GH and IGF-I in Megalobrama amblycephala increase with the increase of lighting time (Tian et al., 2019). And the relative expression of GH in the larvae and juveniles of Takifugu rubripes under GL is the highest, which is conducive to their growth and development (Wei et al., 2019). Another study found that the expression level of GH mRNA in yellowtail clownfish (Amphiprion clarkii) was higher in GL and BL conditions than in RL conditions, inducing faster growth (Shin et al., 2012). It was also found that the growth of juvenile turbot (Scophthalmus maximus) after metamorphosis was promoted by BL and the juvenile turbot exposed to BL had higher body weight and IGF-I mRNA levels (Wu et al., 2020). And the expression level of GH gene in the brain tissue of Takifugu rubripes under different photoperiods was also significantly different (Wei et al., 2020). However, scientific research on the effect of spectrum on the expressions of GH/IGF-I axis-related genes in juvenile Takifugu rubripes is not comprehensive enough, and the mechanism is unclear.
Apoptosis is a normal physiological process used to remove excess, damaged, necrotic or potentially dangerous cells (Xian et al., 2013). Apoptosis is regulated by a series of signal cascades and is affected by environmental factors (Guo et al., 2017). Studies have shown that different environmental temperatures can cause different expression changes of Bcl-2 in the liver of zebrafish (Danio rerio) (Ji et al., 2013). And the expression of apoptosis-related genes in Penaeus vannamei may be up-regulated under WL and RL, but they are not affected under BL and GL (Fei et al., 2020a). It was also found that GL effectively reduced oxidative stress and apoptosis in olive flounder (Paralichthys olivaceus) induced by temperature, while RL increased oxidative stress and apoptosis (Kim et al., 2016a). And BL environment alleviated cold shock-induced oxidative stress and apoptosis in zebrafish (Danio rerio), significantly inhibited caspase 3, caspase 8 and caspase 9 activity levels (Peng et al., 2022). Thus, the spectrum would have a regulatory effect on the expression of apoptotic genes. So far, there have been few reports on the effects of spectrum composition on cell apoptosis of juvenile Takifugu rubripes, and the mechanism of spectrum on cell apoptosis is still unclear. Therefore, it is necessary to study the changes in the expression levels of apoptosis-related genes in juvenile Takifugu rubripes, such as the Bcl-2 protein family (Bcl-2), tumor suppressor (p53) and cysteine protease family (caspase 3, caspase 8, caspase 10) genes.
Takifugu rubripes belongs to Tetraodontiformers, Tetraodontoidei, Tetraodontidae, and Takifugu. They live near the seabed and are warm-temperate, wide-salt, carnivorous benthic migratory fish, inhabiting reef areas, sandy mud bottoms, estuaries, and offshore coasts. They are mainly distributed along the coasts of China, the Korean Peninsula and the east and west coasts of Japan (Ma et al., 2021). Takifugu rubripes has delicious meat and high nutritional value, and it is one of the important economic fish species in northern China, especially in the northern sea area. There has been a saying in China since ancient times that people would die to eat puffer fish. This fish is very popular among Chinese, even Japanese and Korean people. The total production of puffer fish mariculture in 2019 is 17,473t (Zhu et al., 2022). At present, the scale of indoor closed breeding of puffer fish in China is increasing, which requires the use of artificial light source for production, but the corresponding light regulation technology is relatively blank, and relevant research is also urgently needed. (Ma et al., 2014). Studies on the effect of LED light on Takifugu rubripes have also been partially carried out. Studies have shown that different light environments affect many physiological characteristics of Takifugu rubripes due to the light distribution in the water column and the characteristics of the fish habitat. For example, the effect of spectrum (white, blue and yellow light) and photoperiod on the growth of Takifugu rubripes was studied. The results showed that at 80 DPH, the growth performance of WL and YL treatment was better than that of BL with the photoperiod of 12L:12D (Wu et al., 2022). And the digestive enzyme activities of juvenile Takifugu rubripes under GL were all higher than other spectral treatment groups (Liu et al., 2021). It was also found that light intensity environment of 250-500 mW/m2 could protect cell structure and function of juvenile Takifugu rubripes from oxidative stress (Li et al., 2022). And photoperiodic environments of 8L:16D and 24L:0D at 30 DPH may cause stress to Takifugu rubripes, resulting in elevated alkaline phosphatase (Ma et al., 2021). Other studies have shown that light conditions may affect the expression of GHRH and lead to upregulation of GH gene in juvenile Takifugu rubripes (Liu et al., 2019).
Preliminary studies have proved that different LED spectra could affect the growth of somatic cells in the juvenile Takifugu rubripes (Kim et al., 2016b; Liu et al., 2021). The results showed that GL can promote the growth and development of juvenile Takifugu rubripes. Compared with RL, the juvenile Takifugu rubripes raised under GL has a higher survival rate, better feeding performance and growth status. Current studies on the effects of light environment on Takifugu rubripes mainly involve morphological traits, growth and feeding, digestion and metabolism, antioxidant and immunity, as well as the expression of GH and IGF-I genes. However, the GH/IGF-I growth axis contains multiple genes, and it is uncertain whether GL promotes fish growth through the GH/IGF-I growth axis and apoptosis. Therefore, the effects of different LED spectra (GL, BL, YL, RL and WL) on GH/IGF-I axis related genes and apoptosis related genes of juvenile Takifugu rubripes were investigated, in order to reveal the reasons for the effects of different LED spectra on the growth and development of juvenile Takifugu rubripes.
The juvenile Takifugu rubripes used in the experiment originated from Dalian Tianzheng Industrial Co., Ltd. After the juveniles are transported to the laboratory, they are cultured in aquarium barrels (diameter: 80 cm, inner height: 60 cm, effective water volume: 250 L), and domesticated for a week. During the domestication period, commercial buoyant feeds were used for feeding, and they were fed twice a day at 08:30 in the morning and 15:30 in the afternoon. One week later, 525 well-balanced and healthy juvenile Takifugu rubripes were selected for the experiment.
The light sources used in this experiment are LED lamps (model: GK5A; designed by the Institute of Semiconductors, Chinese Academy of Sciences, produced by Shenzhen Overclocking Technology Co., Ltd.). There were 5 LED lights in different colors, including GL (λ525~530 nm), BL (λ450~455 nm), YL (λ590~595 nm), RL (λ625~630 nm) and WL (λ400~780 nm). The light source is installed 1 m directly above the water surface.
The experiments were carried out in a shaded compartment with shading cloth to cover the different treatment groups to avoid cross-contamination of the light source among the treatment groups. Five spectral treatment groups were set up in this experiment, which were green light (GL), blue light (BL), yellow light (YL), red light (RL) and white light (WL) treatment groups. There were 3 repetitions in each treatment group. The breeding barrels are cylindrical barrels made of off-white PE material with a diameter of 80 cm and an inner height of 60 cm. At the beginning of the experiment, 35 domesticated Takifugu rubripes juveniles were placed in each breeding bucket, with body length of (9.01 ± 0.70) cm and body weight of (18.05 ± 3.17) g. The experiment period was 30 days. During the experiment, each breeding bucket was continuously aerated with an aeration pump. The experimental light intensity was set at (250 ± 20) mW/m2. The light intensity of four points was averaged and calibrated at 1 cm above the water surface of each barrel using an SRI 2000 UV spectral illuminance meter (Shangze Co., Ltd.) at 8:30 am daily. The photoperiod was set to 12L:12D controlled by an electronic timer. The fish were feed twice a day at 08:30 am and 15:30 pm. The daily feed weight was calculated based on 2% of the total mass of the fish in each breeding barrel. The remaining bait collected 30 min after feeding, dry it and weigh it. Replace 50% of the volume of water every 2 days.
Before the start of the experiment, 3 juvenile fish were randomly taken from each breeding bucket for the initial juvenile fish length and weight measurements. During the experiment, fish body length and fish weight measurement work was performed once every 10 d. At the end of the experiment, 3 fish were randomly selected from each culture bucket, and a total of 9 fish (whole fish) were selected from each treatment for the determination of fish length and fish weight at the end of the experiment.
The fish were stopped feeding 24 hours at the end of the experiment. Then 3 juveniles were randomly selected from each repeated treatment group and anesthetized with anesthetic (MS-222). The fish were placed on an ice tray, dissected, and their liver, intestine, and brain tissues were taken out. After the tissue was rapidly rinsed with precooled normal saline, the water was sucked dry with absorbent paper and put into the refrigeration tube. Later the tissues were first frozen in liquid nitrogen and then stored in - 80 °C refrigerator for later determination of related gene expressions.
The body length specific growth rate (SGRL) and body weight specific growth rate (SGRW) were calculated according to the formula listed below.
In the formula, L1 and W1 are the fish body length (cm) and fish weight (g) at the beginning of the experiment; L2 and W2 are fish body length (cm) and fish weight (g) at the end of the experiment; T1 is the start time of the experiment (d); T2 is the end time of the experiment (d).
Animal tissue total RNA extraction kit (SteadyPure Universal RNA Extraction Kit), reverse transcription kit (Evo M-MLV RT Kit), qPCR kit (SYBR Green Premix Pro Taq HS qPCR Kit), GL DNA Marker 2000 were purchased from Hunan Accurate Biological Engineering Co., Ltd; 6×DNA Loading Buffer was purchased from G-CLONE (Beijing) Biotechnology Co., Ltd.; GoldView I type nucleic acid stain was purchased from Beijing Solarbio Technology Co., Ltd.; fluorescent quantitative PCR primers were synthesized by Sangon Biotech (Shanghai) Co., Ltd.
According to the instructions of the Total RNA Extraction Kit from Animal Tissues of Hunan Accurate Bioengineering Co., Ltd., the total RNA was extracted from the tissues of juvenile Takifugu rubripes under different LED spectrum treatments. The integrity of RNA was detected by taking 3 µL for 1.0% (W/V) agarose gel electrophoresis; 1 µL was taken for micro spectrophotometer (Shanghai Spectrometer Co., Ltd. 754) to determine the concentration. OD260/OD280 ratio RNA within the range of 1.9~2.1 can done reverse transcription reaction. According to the instructions of the Evo M-MLV RT Kit (Hunan Accurate Bioengineering Co., Ltd.), the first strand of cDNA was synthesized by reverse transcription reaction of 1 μg total RNA with a 20 μL system, and the conditions were 37°C, 15 mins, and 85°C, 5 s. After the reaction, the cDNA was aliquoted and stored at −20°C.
Real-time quantitative PCR experiments were performed using LightCycler® 96 (BBI, Roche, Germany) instrument and SYBR Green Premix Pro Taq HS qPCR Kit (Hunan Eco Bioengineering Co., Ltd.). According to GenBank’s existing redfin puffer GH, GHR1, GHRH, IGF-I, IGF-II, IGFBP, Bcl-2, p53, caspase 3, caspase 8, caspase 10 and β-actin gene sequence, the primer sequences were designed by Primer 5 software, and the primers are shown in Table 1. After multiple determinations, the expression of β-actin was relatively stable, so it was selected as an internal reference gene. The PCR reaction conditions were set as follows: 95°C pre-denaturation for 3 mins, 95°C denaturation for 3s, 60 °C annealing/extension for 30 s, a total of 45 cycles. At the end of the experiment, the melting curves were analyzed. In all PCR processes, there were 3 biological samples in parallel, and each RNA sample had 3 replicates. By using β-actin as the internal reference, the Ct values of each sample were normalized, and the gene expression level of the WL group was used as the benchmark, and the relative gene expressions were calculated by RT-PCR (2-ΔΔCt) relative fluorescence quantification method.
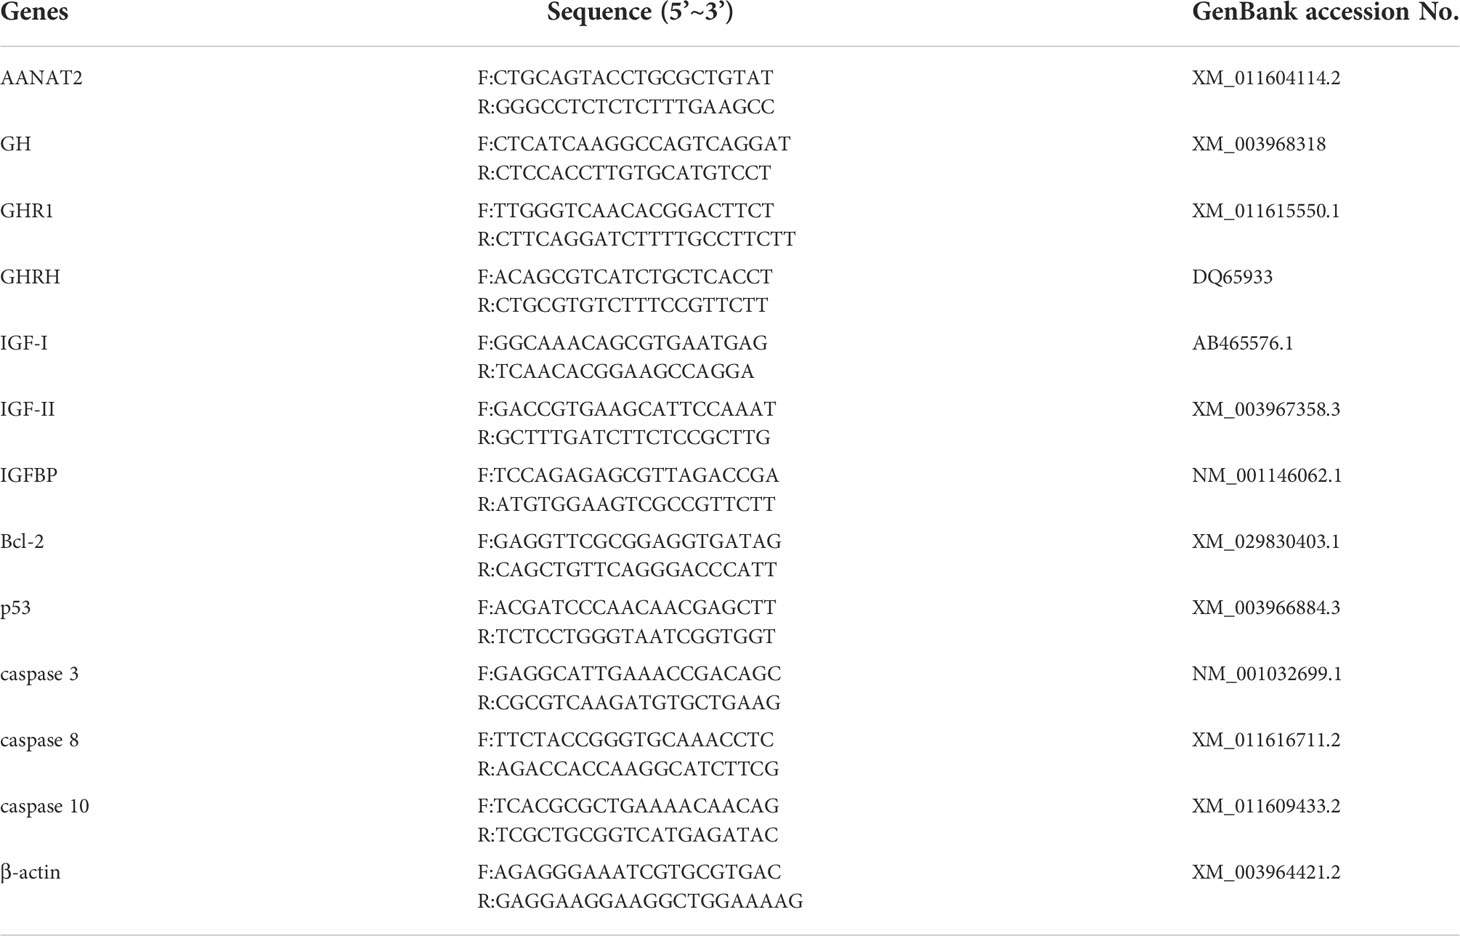
Table 1 The sequences of primers for real-time PCR.
All statistical analyses were performed in SPSS 22.0 (SPSS Inc., Chicago, IL, USA). In summary, data were expressed as means ± standard deviations (SD) of the mean, with differences among treatments tested using one-way analysis of variance (ANOVA). Data with difference level at P< 0.05 were considered statistically significant. Origin 2017 (Hampton, MA, USA) was used to generate charts.
The growth-related indexes of juvenile Takifugu rubripes under five LED spectrum conditions are shown in Table 2. The juvenile Takifugu rubripes in the GL group was the longest, which was (10.63 ± 0.46) cm. The body length of the juvenile puffer fish in the RL group was the shortest, which was (9.32 ± 0.17) cm. The specific growth rates of body length in the YL group and RL group were significantly lower than those in GL group and WL group (P< 0.05). The body weight of juvenile Takifugu rubripes in the GL group was the largest, which was (29.36 ± 3.78) g, while that in the YL group was the smallest, which was (21.28 ± 2.56) g. The specific growth rate of body weight in YL group was significantly lower than those in other groups except RL group (P< 0.05), while that in the GL group was significantly higher than those in other groups (P< 0.05).
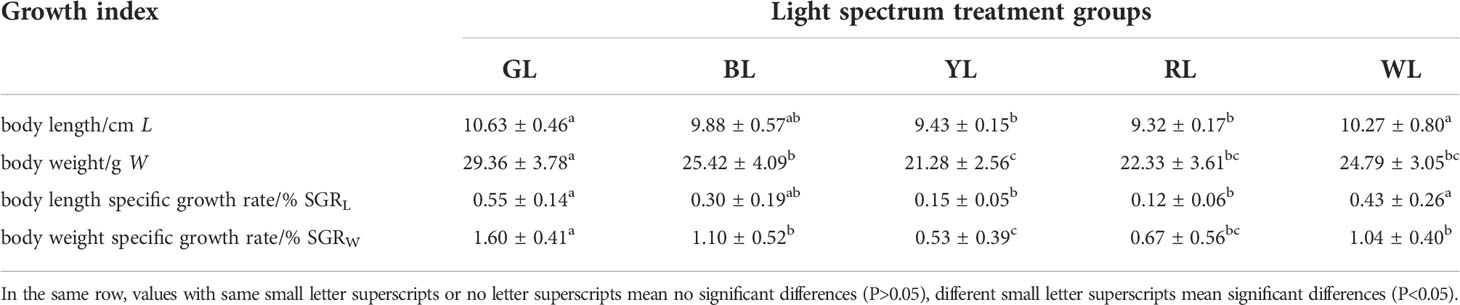
Table 2 Growth indexes of juvenile Takifugu rubripes under different spectral conditions (Liu et al., 2021) n=9; ±SD.
The expression levels of GH/IGF-I axis-related genes in the brain tissue of Takifugu rubripes juvenile under five LED spectrum conditions are shown in Figures 1, 2. From Figure 1A, it can be seen that different spectra have a significant impact on the relative expression of GH gene. Under RL, the relative expression of GH gene was significantly higher than those of the other groups (P<0.05). There was no significant difference among the expressions of the GL, BL, YL and WL groups (Figure 1A). For the GHRH gene, the relative expression of GHRH gene in RL group was the highest and significantly higher than those in other groups (P<0.05), but there was no significant difference in the expression level among the GL and WL group, BL and RL groups. The relative expressions of GHRH genes in the GL and the WL groups were significantly higher than those in BL and RL groups (P<0.05) (Figure 1B).
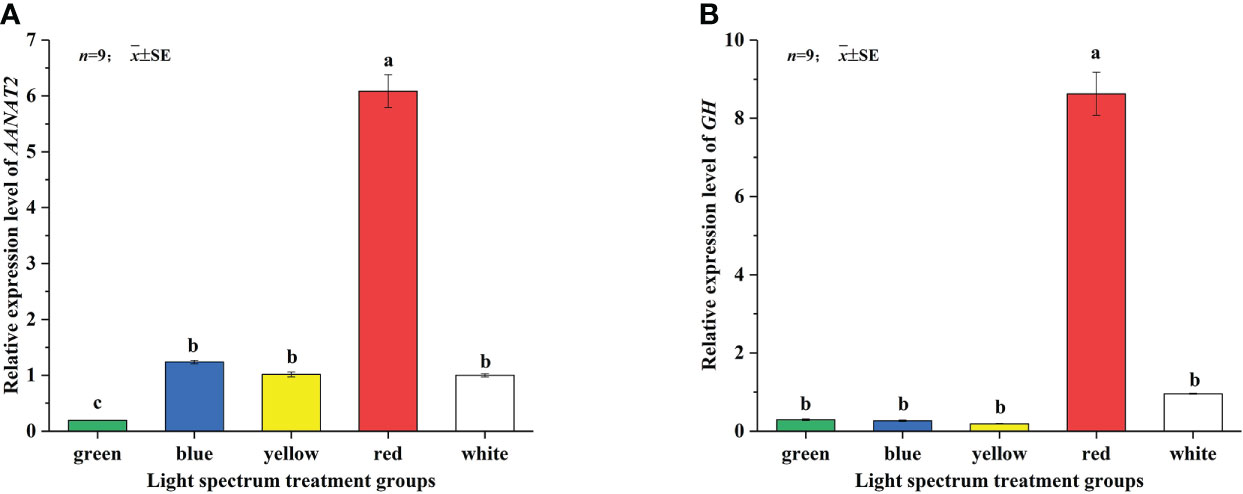
Figure 1 Effects of different LED spectra on relative expression of GH (A) and GHRH (B) genes in juvenile Takifugu rubripes. In the same column diagram, values with same small letter superscripts mean no significant differences (P>0.05), different small letter superscripts mean significant sdifferences (P<0.05).
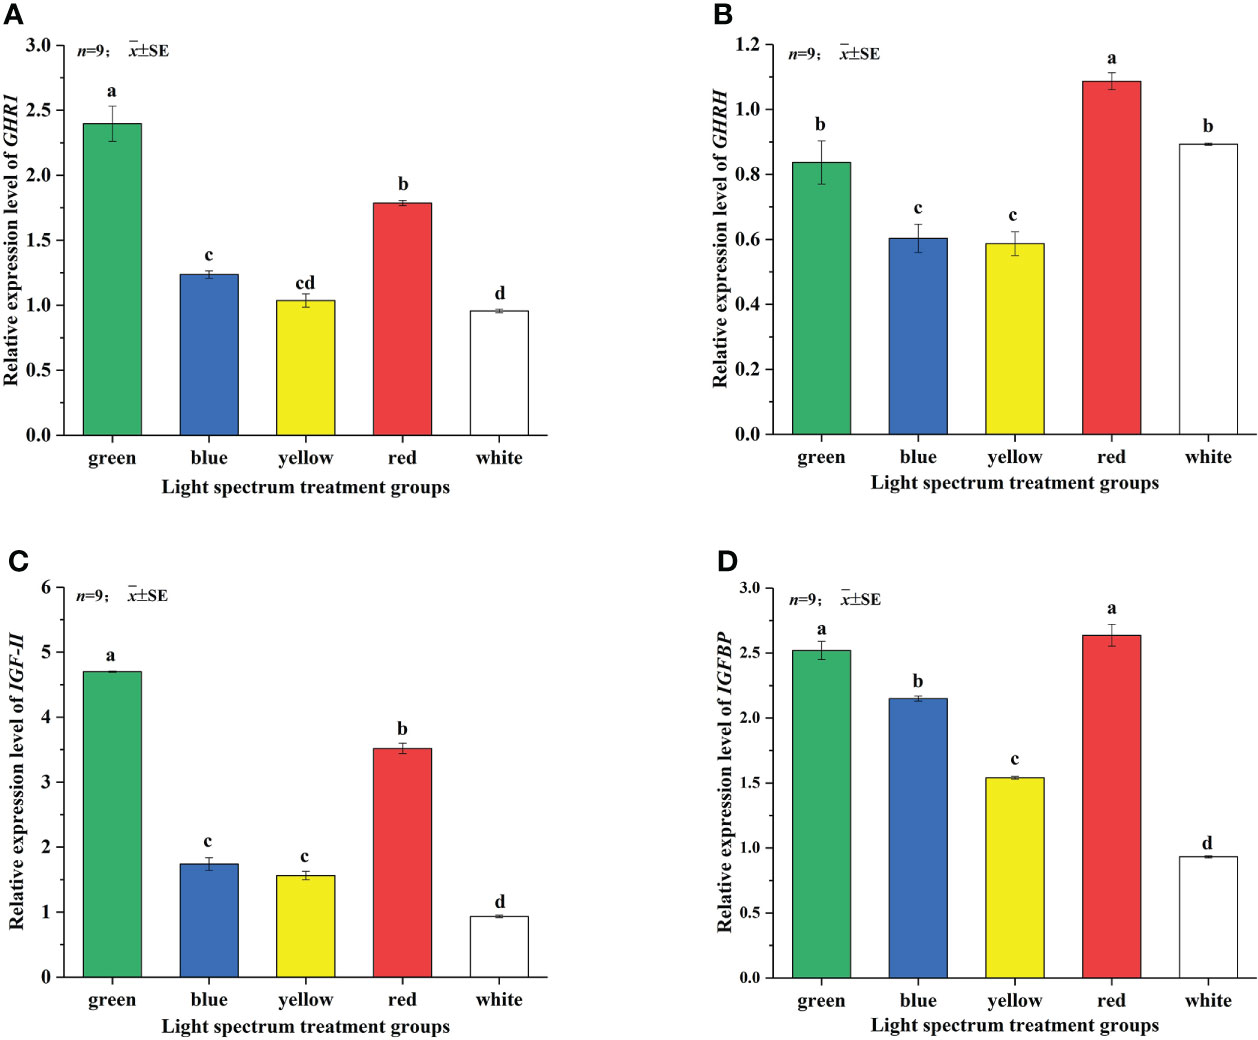
Figure 2 Effects of different LED spectra on relative expression of GHR1 (A), IGF-I (B), IGF-II (C) and IGFBP (D) genes in juvenile Takifugu rubripes. In the same column diagram, values with same small letter superscripts mean no significant differences (P>0.05), different small letter superscripts mean significant differences (P<0.05).
Figure 2A showed that the different spectra have a greater impact on the relative expression of the GHR1 gene. The relative expression of GHR1 gene in the GL group was the highest, which was significantly higher than those of the other treatment groups (P<0.05). The relative expression of GHR1 gene in the WL group was the lowest, which was not significantly different from that in the YL group. But it was significantly lower than those in the GL, BL and RL groups (P<0.05). As shown in Figure 2B, the relative expression of IGF-I gene of juvenile Takifugu rubripes was not significantly different under the GL and RL groups but was significantly higher than under the other treatment groups (P<0.05). The relative expression of IGF-I gene in the YL group was the lowest and significantly lower than that in the other treatment groups (P<0.05). As shown in Figure 2C, the relative expression of IGF-II gene in the RL group was significantly lower than that in the GL group (P<0.05), and was significantly higher than those in the BL, YL and WL groups (P<0.05). There was no significant difference in the relative expression of IGF-II gene between the BL and YL groups. It can be seen from Figure 2D that the relative expression of IGFBP gene under different light treatments is in the order of RL >GL >BL >YL >WL. There was no significant difference in the expression levels of the GL and RL groups. The expression levels of IGFBP gene in BL and YL groups were significantly higher than that in WL group (P<0.05).
The expression levels of melatonin-related AANAT2 gene in the brain of juvenile Takifugu rubripes under five LED spectrum conditions are shown in Figure 3. The result showed that different spectra have significant effects on the relative expression of AANAT2 gene. Under RL, the relative expression of AANAT2 gene was the highest and significantly higher than those under other groups (P<0.05). There was no significant difference in the expressions of the BL, YL and WL groups. The relative gene expression of AANAT2 in GL group was the lowest and significantly lower than that in the other groups (P<0.05).
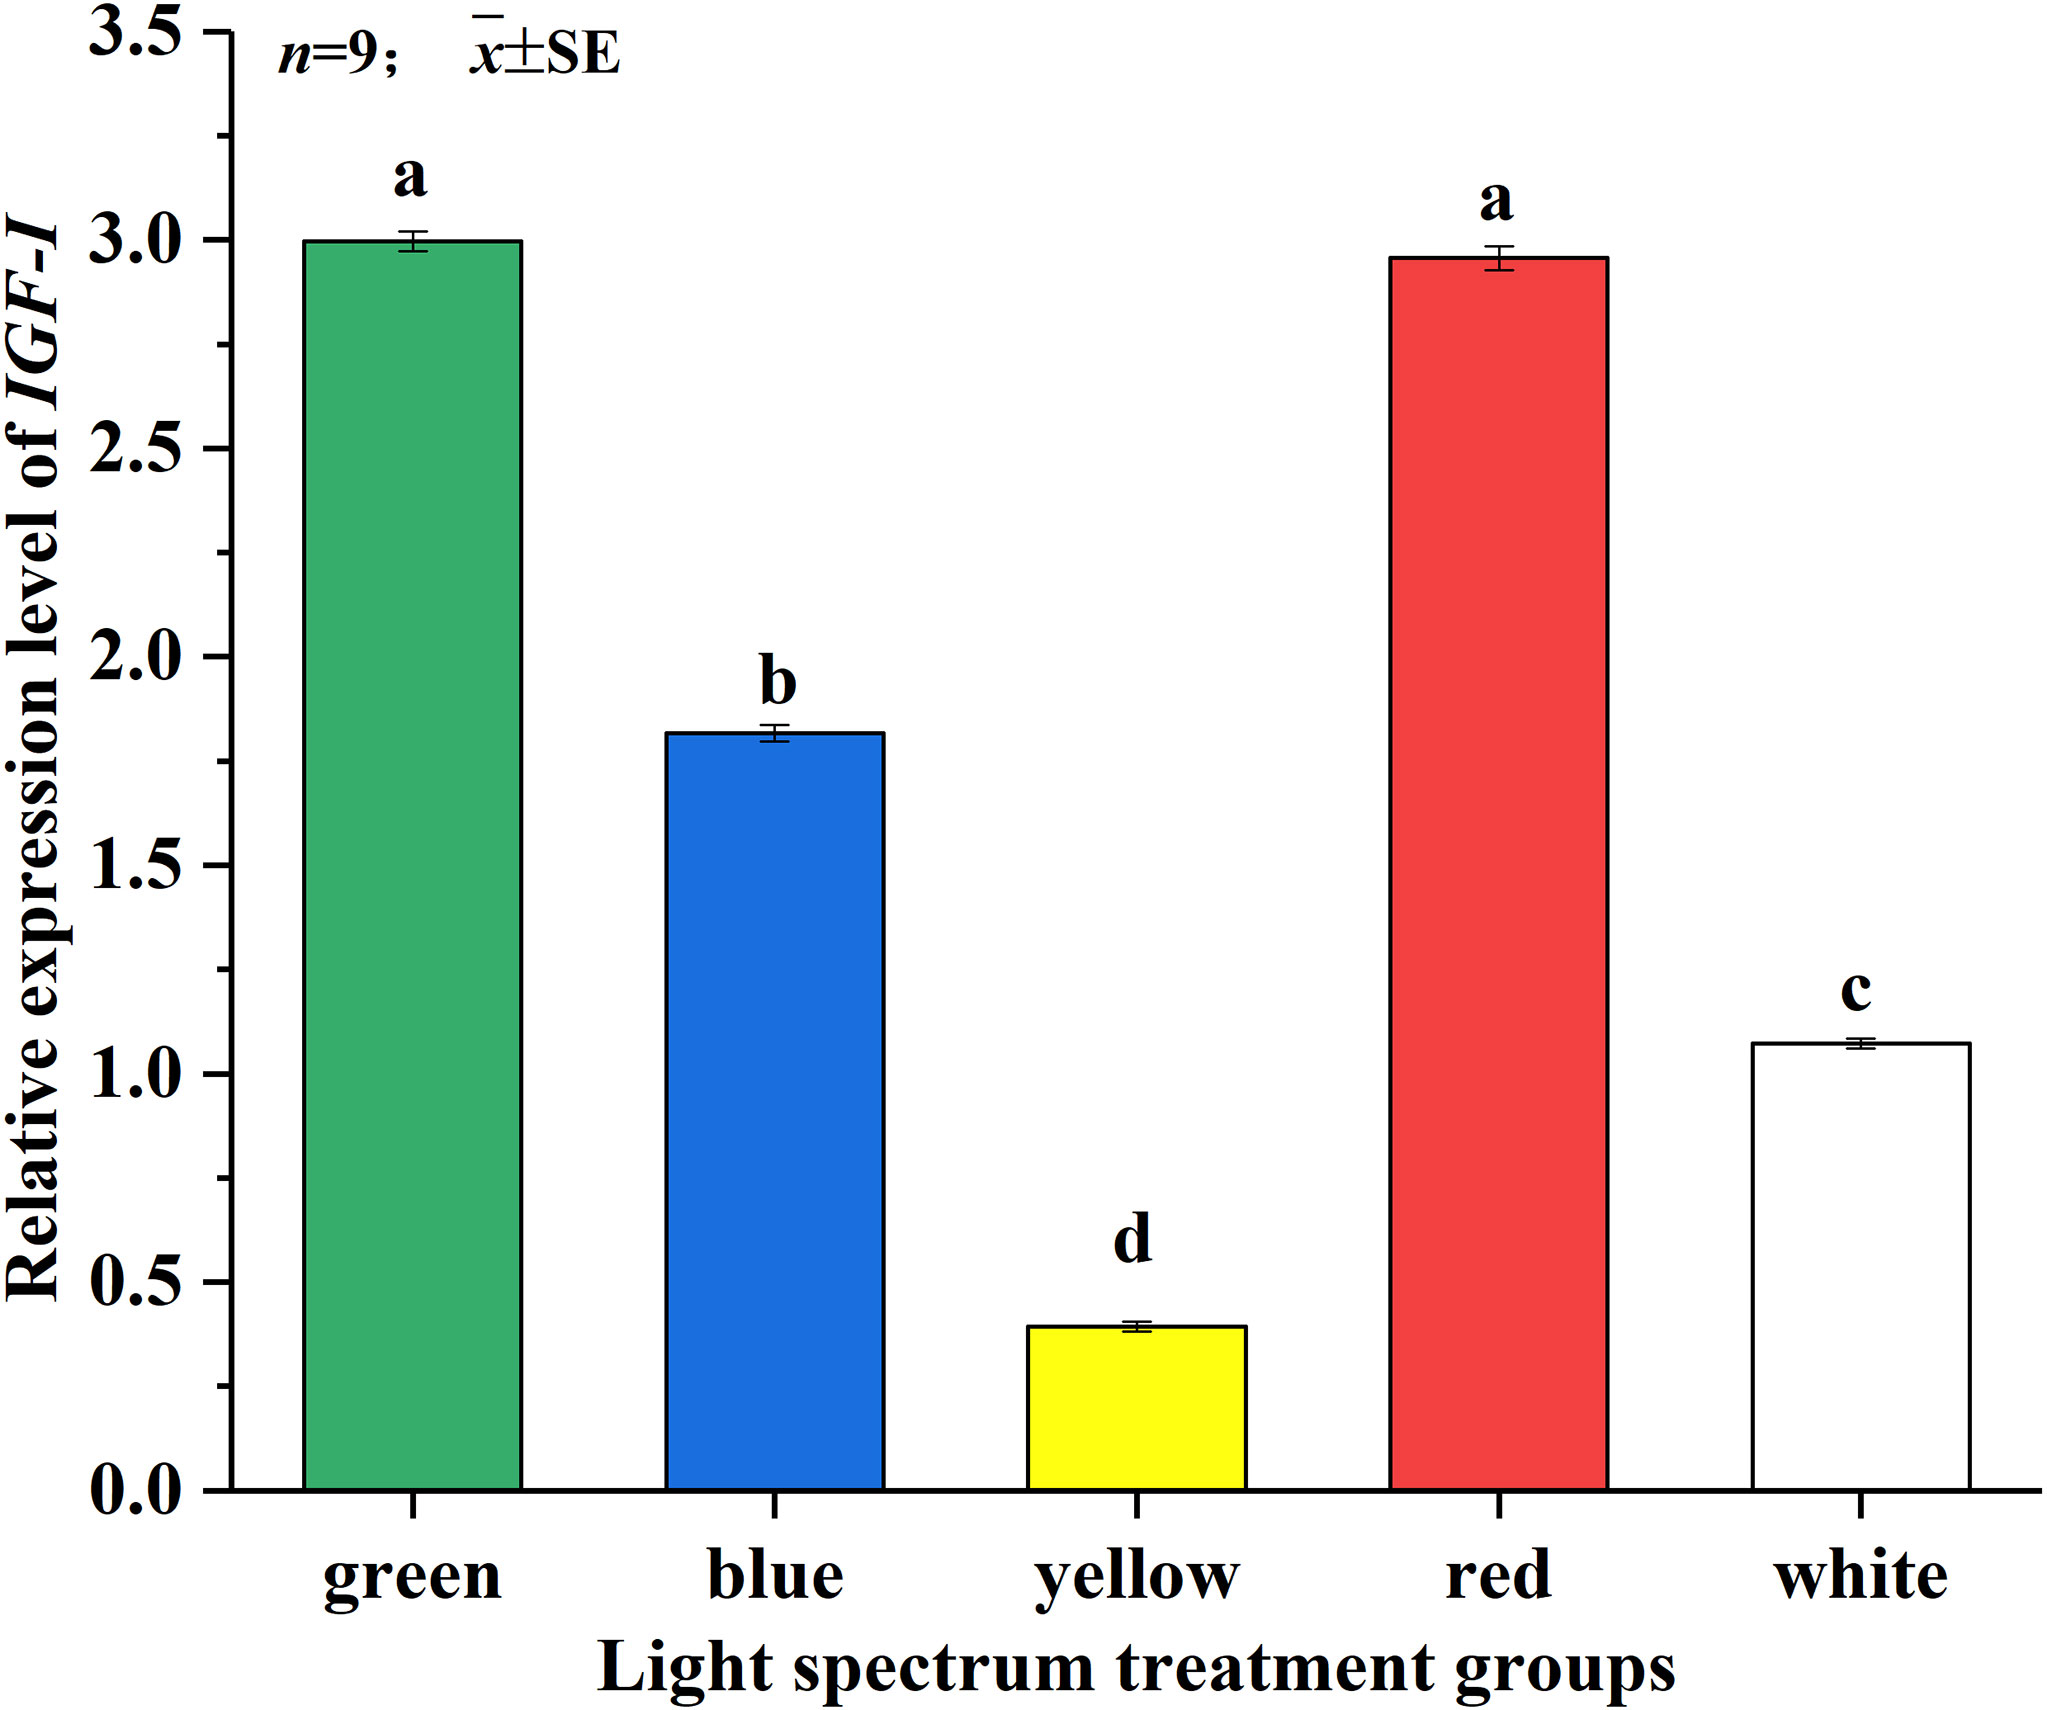
Figure 3 Effects of different LED spectra on relative expression of AANAT2 genes in juvenile Takifugu rubripes. In the same column diagram, values with same small letter superscripts mean no significant differences (P>0.05), different small letter superscripts mean significant differences (P<0.05).
The relative expression levels of apoptosis-related genes in the liver tissue of juvenile Takifugu rubripes under the five LED spectrum conditions are shown in Figures 4A–E. There are significant differences in the relative expression of Bcl-2 gene in the liver of juvenile Takifugu rubripes under different spectral conditions (as shown in Figure 4A). Under the RL group, the relative expression of Bcl-2 gene was the lowest, which was not significantly different from that under the GL group and significantly lower than those under the BL and WL groups (P<0.05). The relative expression of Bcl-2 gene in the YL group was the highest and was significantly higher than those in the other treatment groups (P<0.05). As shown in Figure 4B, the relative expression of p53 gene between the RL and YL groups have a little difference but no significant difference. The relative expression level of p53 gene in juvenile Takifugu rubripes in the BL group was the highest. And it was significantly higher than the other treatment groups (P<0.05). The relative expression of p53 gene in juvenile Takifugu rubripes in the WL group was the lowest and significantly lower than the other treatment groups (P<0.05). The relative expression of caspase 3 gene in the liver tissue of juvenile Takifugu rubripes also has significant differences under different spectral conditions (Figure 4C). Among them, under the BL irradiation, the relative expression of caspase 3 gene was the highest and significantly higher than those under other light groups (P<0.05). There was no significant difference in the relative expressions of caspase 3 gene among the GL, RL and WL groups. The relative expression of caspase 3 gene in the WL group was the lowest and significantly lower than those in other treatment groups (P<0.05). Figure 4D showed that the relative expression of caspase 8 gene of Takifugu rubripes in the BL group was significantly higher than those in the other treatment groups. Moreover, the relative expression of caspase 8 gene among the three treatment groups of the GL, YL and WL were relatively small, and there was no significant difference. The relative expression of caspase 8 gene in the RL group was not significantly different from the WL group and significantly higher than those in the GL and YL groups (P<0.05). The influence of different LED spectra on the relative expression of caspase 10 gene is shown in Figure 4E, in the order of YL >RL >BL >GL >WL. There were significant differences between each light groups (P<0.05). The relative expression of caspase 10 gene of Takifugu rubripes in the YL group was the highest and significantly higher than those in the other treatment groups (P<0.05). The relative expression of caspase 10 gene in the WL group was the lowest and significantly lower than those in the other treatment groups (P<0.05).
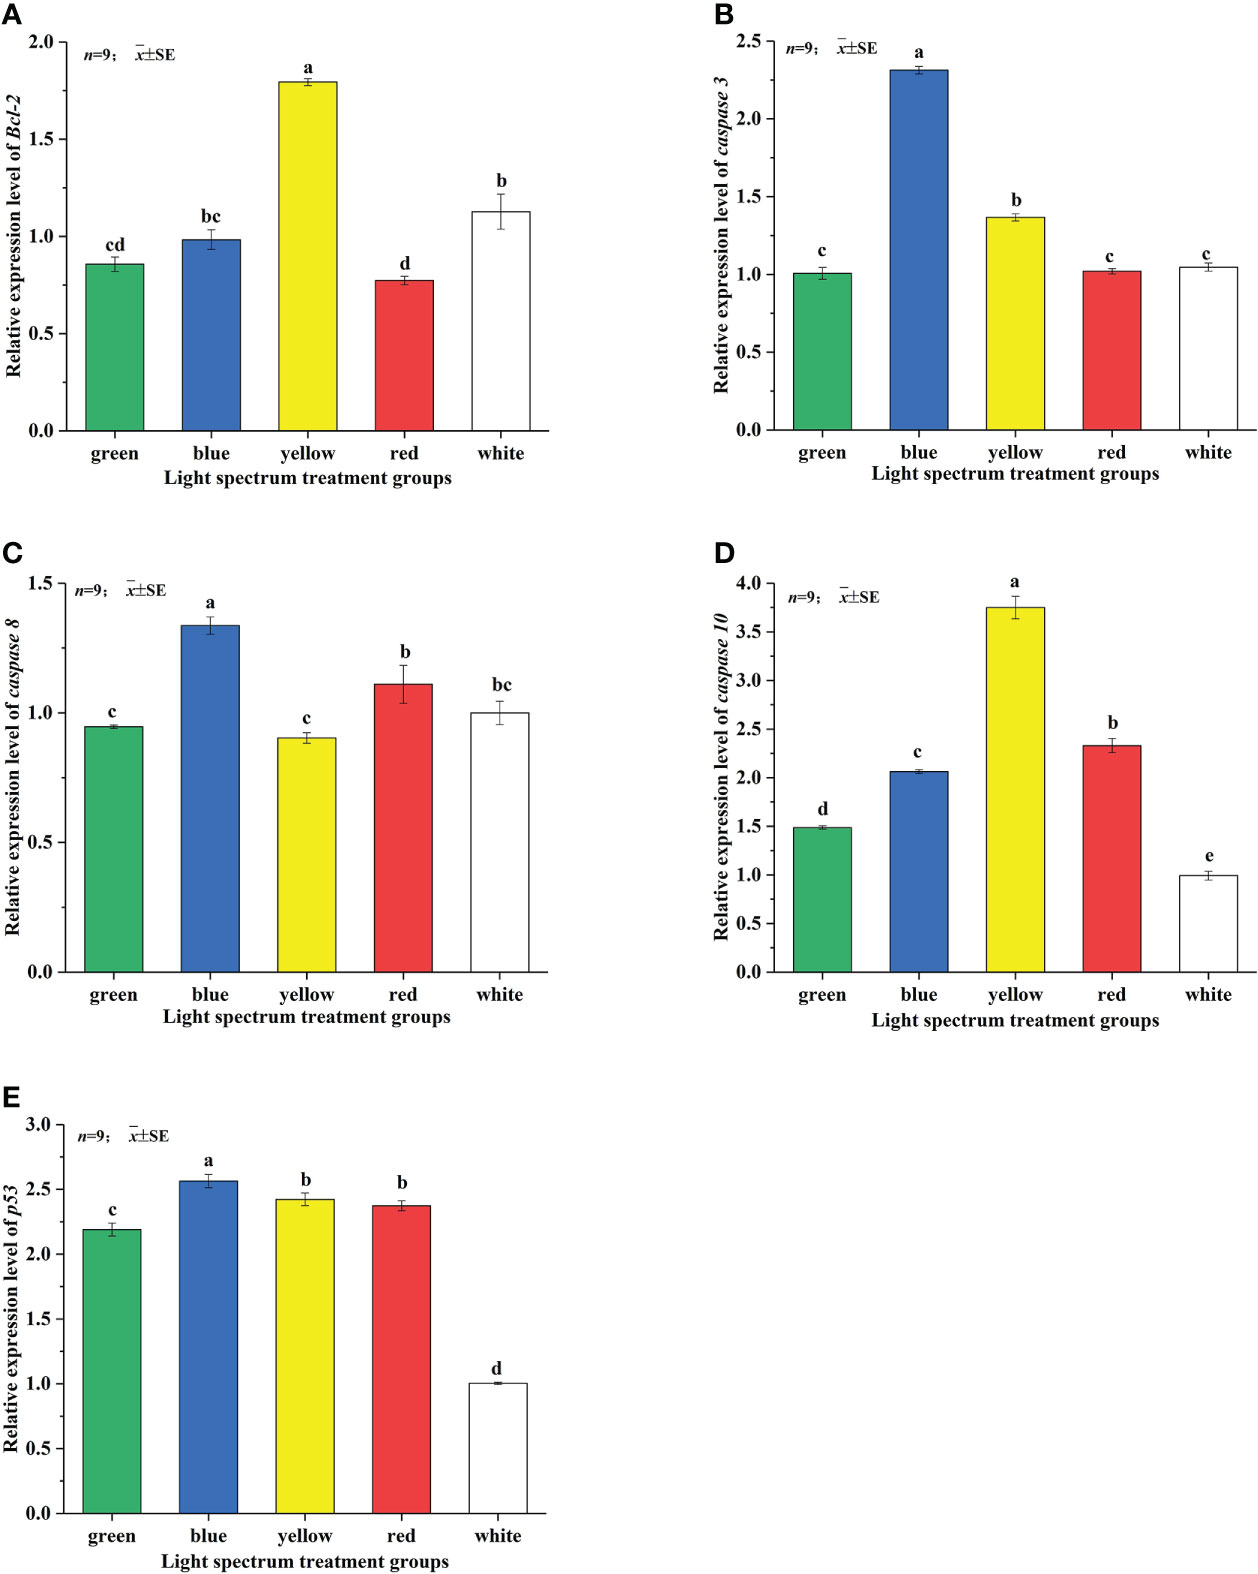
Figure 4 Effects of different LED spectra on the relative expression of Bcl-2 (A), p53 (B), caspase 3 (C), caspase 8 (D) and caspase 10 (E) genes in juvenile Takifugu rubripes. In the same column diagram, values with same small letter superscripts mean no significant differences (P>0.05), different small letter superscripts mean significant differences (P<0.05).
The effect of spectra on the growth and development of fish varies depending on the spectral composition and fish species. For example, GL was found to have a stimulatory effect on somatic cell growth in striped starry flounder (Verasper moseri), while RL had an inhibitory effect (Ji et al., 2013); Senegalese sole (Solea senegalensis) juveniles have better growth status under BL conditions (Fei et al., 2020a); The juveniles of Dicentrarchus labrax grew best in the RL group and worst in the BL group (Liu et al., 2021). The results of our previous study showed that different LED spectra had different degrees of influence on the growth and development of juvenile Takifugu rubripes. The body weight and SGRw of the fish under GL were the highest and significantly higher than all other treatment groups, followed by BL, YL and WL, while the mean values of various growth indicators of juvenile Takifugu rubripes under RL were the lowest. This result is in general agreement with the finding of Kim et al. (2016b) that the Takifugu rubripes grew well under GL and slowly under RL. It has been shown that the reactive oxygen species induced by the red spectrum can oxidatively damage the cellular components of fish target organs such as muscles. For example, RL can induce oxidative stress in the tissues of Amphiprion clarkii, which in turn causes oxidative damage to the tissues and leads to the inhibition of growth performance (Shin et al., 2011). Therefore, the juvenile Takifugu rubripes did not grow well under the RL environment, which may also be caused by the stress response of the fish under the RL.
The effect of light on fish also affects a range of physiological activities by influencing the secretion of melatonin. Melatonin has many physiological functions, including scavenging free radicals, improving immunity, and inhibiting the oxidation of biomolecules (Wu and Swaab, 2005). Melatonin can be converted into many antioxidant compounds during the oxidation process (Reiter et al., 1997). Therefore, melatonin is considered a broad-spectrum antioxidant and is more effective than other antioxidants in protecting cell membranes. Moreover, arylalkylamine N-acetyltransferase 2 (AANAT2), a precursor of melatonin, is the rate-limiting enzyme for melatonin synthesis, and its secretion level is consistent with the level of melatonin (Shin et al., 2011). In this study, the increase of AANAT2 gene expression indicates the increase of melatonin secretion was believed. The relative gene expression of AANAT2 in the GL group was significantly lower than that in the other treatment groups (P<0.05); there was no significant difference in the relative gene expression of AANAT2 between the BL, YL and WL groups, and all of them were significantly lower than that in the RL group (P<0.05); the relative gene expression of AANAT2 in the RL group was significantly higher than those in the other treatment groups (P<0.05) (Figure 3 and Table 3). This is similar to the findings of Shin et al. (2011) that red LED spectroscopy produced a stress response in Amphiprion clarkii, with more melatonin production and significantly higher AANAT2 mRNA expression than other spectra treatment groups. Therefore, the higher expression of AANAT2 in the RL group in this experiment may be due to the RL environment induced stress response in juvenile Takifugu rubripes, which led to the elevated expression of AANAT2 gene and then promoted the synthesis of melatonin in response to oxidative stress. Further studies are needed to confirm the exact cause.
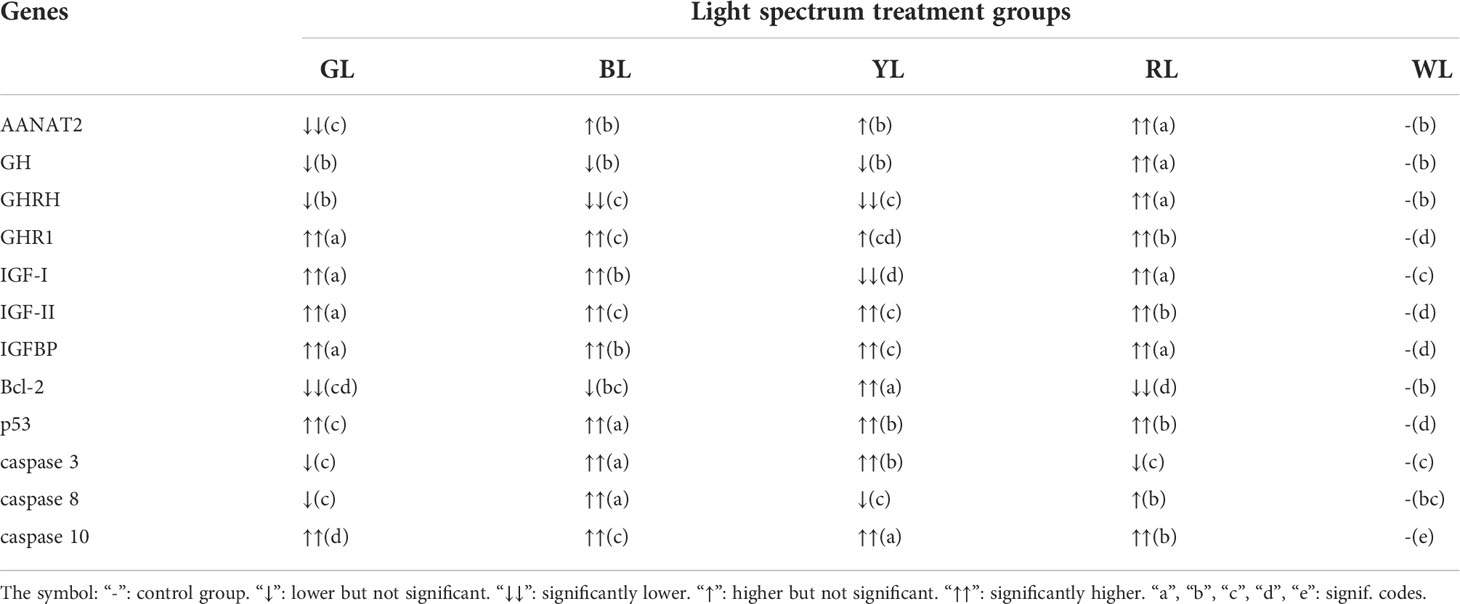
Table 3 mRNA level of genes associated with GH/IGF-I axis and apoptosis in juvenile Takifugu rubripes exposed to different light spectra in comparison with WL.
The growth of fish is mainly regulated by the GH/IGF-I growth axis (Li and Lin, 2010). The main factors in this axis include: GH, GHRH, GHR1, IGF-I, IGF-II, IGFBP. It has been shown that the light environment and melatonin affect the neuroendocrine axis and that melatonin in the pineal gland will act on the hypothalamus, pituitary and surrounding tissues to regulate the synthesis and release of growth hormone-releasing hormone (GHRH) and growth hormone (GH), either directly or indirectly (Max and Menaker, 1992). The hypothalamus produces the neuroendocrine factor GHRH that stimulates the synthesis and release of GH from the pituitary gland (Sánchez-Vázquez et al., 2019). Thus, melatonin has an important regulatory role for GHRH and GH. In the present study, as shown in Table 3, the relative expression of GHRH genes was significantly higher in the RL group than in the other treatment groups (P<0.05), followed by the BL, YL, and WL groups, and significantly lower in the GL group than in the other treatment groups (P<0.05). Also, the relative expression of pituitary GH gene was significantly higher in the RL group than in the other light groups (P<0.05), and there was no significant difference in the expression of GH among the remaining four groups. This is similar to the findings of Zhang et al. (2016) that melatonin plays a key role in the GL environment to enhance GH secretion in chicks by increasing GHRH expression in the hypothalamus. It has also been shown that the pituitary gland of in vitro cultured rainbow trout releases increasing amounts of GH when stimulated by certain physiological concentrations of melatonin (Falcón et al., 2003). And carp (Cyprinus carpio) GHRH stimulates the pituitary to synthesize and release GH in a dose-dependent manner (McRory et al., 1995). It was also found that the growth hormone releasing hormone (fGHRH-28) of Paralichthys olivaceus can induce the expression of GH mRNA in the embryonic cell line HINAE (Nam et al., 2011). Therefore, each treatment group may promote the expression of GHRH and GH in the hypothalamus and pituitary by promoting the release of melatonin.
After GH combines with GHR1 on the liver surface, it stimulates liver cells to synthesize and secrete IGFs. Therefore, GH has an important regulatory effect on IGFs, and its expression level can reflect the growth status of animals to some extent (Reinecke, 2010). IGF binds to IGFBP in the liver and reaches the target cells via the endocrine pathway, and the adducts act on the IGFR (insulin-like growth factor receptor) on the surface of the target cells to promote the proliferation and growth of the target cells, thereby promoting the growth of the organism (Li et al., 2017). Studies have shown that IGFBPs not only have an IGF-dependent effect but can also act as a carrier of IGF or a regulator of the effectiveness and activity of IGF. During the embryonic and gonadal development of carp (Cyprinus carpio), IGFBP may play an important role in their growth and development by regulating the role of IGF in reproduction and embryonic growth (Chen et al., 2009). In the present study, it can be seen from Table 3 that the relative expression of GHR1 and IGF-II genes was significantly higher in the GL group than in the other treatment groups (P<0.05), and the relative expression of IGF-I and IGFBP genes was significantly higher in the GL and RL groups than in the other treatment groups (P<0.05). Meanwhile, the relative expression of GHR1, IGF-I and IGF-II genes in the RL group was significantly higher than those in the BL, YL and WL groups (P<0.05). This is similar to the findings of Chen et al. (2022) that the relative expression of GHR, IGF-I and IGFBP genes was significantly higher in Oncorhynchus mykiss than in each of the remaining treatment groups under light conditions that mimic the light color changes in the natural underwater environment. It has been shown that GH promotes growth through the synergistic action of hepatic GHR, IGF-I and IGFBP, which play a central link in the GH/IGF-I axis (Zou et al., 2022). Therefore, we speculate that the GL group may promote the synthesis and secretion of IGF in the liver by promoting the binding of GH and GHR1 in the liver, and promote cell mitosis and differentiation by promoting the binding of IGF and IGFBP in the liver, thus promoting the growth of juvenile Takifug rubripes.
Interestingly, the growth status of fish under normal environmental conditions is usually positively correlated with the expression levels of GH/IGF-I axis-related genes in vivo, and GH/IGF-I axis-related genes can directly affect growth of fish by stimulating cell differentiation. It has been shown that the expressions of GHR1 mRNA, GHR2 mRNA and IGF mRNA in the liver of juvenile ocellaris clownfish (Amphiprion ocellaris) treated with different light photoperiods are similar to their average body length and weight gains (Li et al., 2017). However, the growth status of fish under certain stress conditions may also be negatively correlated with plasma GH levels or GH gene expression levels. For example, the body weight and specific growth rate of Mozambique tilapia (Oreochromis mossambicus) after 4 weeks of fasting were significantly reduced, but the plasma GH level and pituitary GH mRNA were significantly increased (Fox et al., 2006); Monocrotophos pesticide exposure to Nile tilapia (Oreochromis niloticus) for 3 weeks significantly inhibited their growth. However, its GH level was significantly increased, this is probably due to the negative feedback regulation mechanism of liver IGF-I (Cheng et al., 2002). In the present study, the relative expressions of GHRH and GH genes were at low levels in the GL group, whereas the relative expressions of IGF-I and IGF-II genes were at high levels. Meanwhile, previous studies have shown that overexpression of IGF-I gene can suppress GH gene expression in tilapia (Cheng et al., 2002). It has also been shown that GH gene can promote the expression of IGF-I and IGF-II genes, and that there is a negative feedback regulation mechanism among GH, GHRH and IGF-I (Chen et al., 2016). Therefore, we hypothesized that the low expression of GHRH and GH genes in the GL group was due to the activation of the negative feedback regulatory mechanism of the GH/IGF-I axis by the overexpression of IGF-I genes in the liver. In contrast, the relative expression of each growth gene in the RL group was at a high level, but this was not consistent with the trend of growth performance of juvenile Takifugu rubripes in the RL group. We speculate that this may be due to the fact that juvenile Takifugu rubripes under RL are in a stressful state and the high expression of growth axis-related genes is not sufficient to counteract the negative effects of the stress response, which in turn affects their normal growth. The above is just a speculation, and the true reason needs to be confirmed by more research.
Vertebrate cell apoptosis is the programmed cell death controlled by a variety of genes. It is necessary to maintain the body’s homeostasis, immune defense, and growth and development. The Bcl-2 protein family is an important regulator of cell apoptosis. The Bcl-2 gene is a gene that inhibits cell apoptosis and is located in the endoplasmic reticulum. Its expression directly or indirectly affects the release of Ca2+ from the endoplasmic reticulum and inhibits apoptosis, thereby protecting cells from apoptosis (Borghetti et al., 2015). In this study, the relative expression of the Bcl-2 gene in the BL, YL and WL groups was significantly higher than those in the GL and RL groups, and the relative gene expression of Bcl-2 in the RL group was the lowest (Figure 4 and Table 3). Studies have shown that different environmental temperatures can cause different transcriptional changes of Bcl-2 in the liver of zebrafish (Danio rerio) (Ji et al., 2013); the expression level of Bcl-2 in the hepatopancreas of Litopenaeus vannamei in the full spectrum + UVB (310 nm) group was significantly lower than those in other spectral treatment groups, and the level of apoptosis inhibition was weaker, resulting in poorer growth performance of shrimp in this spectral treatment group (Fei et al., 2020b). Therefore, the level of apoptosis inhibition was weakest in the RL group, resulting in the highest level of apoptosis in juvenile fish in this group, which in turn led to the inhibition of their growth and development.
p53 is a tumor suppressor, and its product has a regulatory effect on a variety of downstream genes (Yuan et al., 2017). It acts as a transcription factor in regulating the complex DNA damage system. DNA damage will cause an increase in the expression of p53, and its product will activate the downstream inhibition of cyclin-dependent kinase activity, thereby inhibiting the progress of the cell cycle (Huang et al., 2020). In this study, it can be seen from Table 3 that when the juvenile Takifugu rubripes is exposed to BL, YL and RL, the transcription of the p53 gene in the liver is upregulated. The expression level of p53 in the GL group was significantly lower than the BL group, YL group and RL group (P<0.05). The study showed that the transcript levels of p53 in the hepatopancreas of Litopenaeus vannamei in the dark group were higher than those in the other treatment groups, and the growth performance of shrimp in this group was poorer (Fei et al., 2020b); When Penaeus vannamei were exposed to WL and RL, the p53 gene transcription was upregulated in the hepatopancreas, while the expression level of p53 was lower in the GL group than in the other groups. Shrimp in the GL group grew well (Fei et al., 2020b). Therefore, the expression of p53 is influenced by spectral composition and may trigger apoptosis of hepatocytes in juvenile Takifugu rubripes, resulting in impaired liver tissue function and reduced ability to cope with stress responses in juvenile fish, which in turn inhibits their growth and development.
Caspase is a cysteine protease involved in cell apoptosis. Its family members directly or indirectly cause the appearance of the structural features of cell apoptosis and are at the core of the apoptosis pathway. It plays a key role in the entire process of cell apoptosis by initiating the exogenous apoptosis pathway and indirectly initiating the endogenous apoptosis pathway (Sakata et al., 2007). The exogenous apoptosis pathway is regulated by extracellular signals, and extracellular signals can recruit caspase 8 and caspase 10 related proteins. Among them, caspase 3 is an apoptotic protease that is frequently activated and catalyzes the specific cleavage of many key cellular proteins. The activation of caspase 8 and caspase 10 may directly or indirectly activate caspase 3. It was shown that under low temperature stress, the liver of Epinephelus coioides activated its apoptotic pathway and induced changes in the expression of the caspase family, Bcl-2, bax and other apoptotic genes, which in turn inhibited the growth and development of Epinephelus coioides (Sun et al., 2019); expression of caspase 3 and caspase 8 in the hepatopancreas of Penaeus vannamei was higher in the full-spectrum and RL groups and lower in the BL and GL groups, and growth performance of Penaeus vannamei was inhibited in the full-spectrum and RL groups (Fei et al., 2020a). Therefore, the BL, YL and RL groups may put juvenile Takifugu rubripes in an unfavorable environment, inducing upregulation of caspase family-related gene expression, exacerbating apoptosis, and thus inhibiting their growth. In contrast, juvenile Takifugu rubripes in the GL group were in a favorable environment with down-regulated expression of caspase family-related genes, which alleviated apoptosis and thus promoted the growth and development of juvenile fish.
Therefore, unfavorable light environmental conditions may increase the expression of apoptotic genes, intensify apoptosis and cause liver tissue damage, thus inhibiting the growth of juvenile Takifugu rubripes. The relative expressions of the five apoptotic genes were lower in the GL environment, indicating that a favorable light environment can reduce the expression of apoptotic genes and slow down the apoptotic process, which is beneficial to the growth of juvenile Takifugu rubripes.
In summary, under an environment with a photoperiod of 12L:12D and an illuminance of (250 ± 20) mW/m2, five different LED spectra have a certain degree of influence on growth and the expressions of GH/IGF-I growth axis and apoptosis-related genes in the juvenile stage of Takifugu rubripes. The better growth performance of juvenile Takifugu rubripes cultured under GL was related to the GH/IGF-I growth axis and apoptosis genes. GL significantly promotes the growth of Takifugu rubripes, which may be due to that GL promoted the expressions of growth factors such as GHR1, IGF-I, and IGF-II, and decreased the expressions of apoptosis-related genes, while the situation in the YL, BL and WL groups was on the contrary. The RL group significantly inhibited the growth of juvenile Takifugu rubripes, which may be due to the fact that juvenile Takifugu rubripes under RL environment were in a stressful state and the high expression of growth axis-related genes was not sufficient to offset the negative effects of stress response, resulting in the inhibition of growth performance. Further studies are needed to confirm.
The original contributions presented in the study are included in the article/Supplementary Material. Further inquiries can be directed to the corresponding author/s.
This study was reviewed and approved by Animal Care and Use Committee of the Chinese Academy of Fishery Sciences.
SL conducted the sample collection, data curation and draft writing. YF performed the histological analysis. YL conducted the writing-review and editing. XL performed the molecular work. FS conducted the statistical analysis. YW performed the data visualization. ZM and HM contributed to the concept and design of the study. All authors contributed to the article and approved the submitted version.
This research was supported by Key Program of the National Natural Science Foundation of China (Grant No. 42030408), the Science & Technology Program of Liaoning Province (2021JH2/10200011 and 2019JH2/10200007), Open project of Key Laboratory of Environment Controlled Aquaculture (Dalian Ocean University) Ministry of Education (202202), Science and Technology Innovation Foundation of Dalian (2021JJ13SN72)and Scientific research project of Liaoning Provincial Department of oceans and Fisheries (201728).
We would like to thank Changbin Song engineer for his assistance with light source design in our experiments.
The authors declare that the research was conducted in the absence of any commercial or financial relationships that could be construed as a potential conflict of interest.
All claims expressed in this article are solely those of the authors and do not necessarily represent those of their affiliated organizations, or those of the publisher, the editors and the reviewers. Any product that may be evaluated in this article, or claim that may be made by its manufacturer, is not guaranteed or endorsed by the publisher.
Ayson F. G., Takemura A. (2006). Daily expression patterns for mRNAs of GH, PRL, SL, IGF-i and IGF-II in juvenile rabbitfish, Siganus guttatus, during 24-h light and dark cycles. Gen. Comp. Endocrinol. 149, 261–268. doi: 10.1016/j.ygcen.2006.06.006
Borghetti G., Yamaguchi A. A., Aikawa J., Yamazaki R. K., de Brito G. A. P., Fernandes L. C. (2015). Fish oil administration mediates apoptosis of walker 256 tumor cells by modulation of p53, bcl-2, caspase-7 and caspase-3 protein expression. Lipids Health Dis. 14, 1–5. doi: 10.1186/s12944-015-0098-y
Cheng R., Chang K. M., Wu J. L. (2002). Different temporal expressions of tilapia (Oreochromis mossambicus) insulin-like growth factor-I and IGF binding protein-3 after growth hormone induction. Mar. Biotechnol., 4, 218–225. doi: 10.1007/s10126-002-0014-0
Chen W., Li W., Lin H. (2009). Common carp (Cyprinus carpio) insulin-like growth factor binding protein-2 (IGFBP-2): Molecular cloning, expression profiles, and hormonal regulation in hepatocytes. Gen. Comp. Endocrinol. 161, 390–399. doi: 10.1016/j.ygcen.2009.02.004
Chen D., Wang W., Ru S. (2016). Effects of dietary genistein on GH/IGF-I axis of Nile tilapia Oreochromis niloticus. Chin. J. Oceanology Limnology 34, 1004–1012. doi: 10.1007/s00343-016-4386-9
Chen X., Zhou Y., Huang J., An D., Li L., Dong Y., et al. (2022). The effects of blue and red light color combinations on the growth and immune performance of juvenile steelhead trout, Oncorhynchus mykiss. Aquac Rep. 24, 1–8. doi: 10.1016/j.aqrep.2022.101156
Downing G. (2002). Impact of spectral composition on larval haddock, Melanogrammus aeglefinus l., growth and survival. Aquac Res. 33, 251–259. doi: 10.1046/j.1355-557x.2002.00668.x
Falcón J., Besseau L., Fazzari D., Attia J., Gaildrat P., Beauchaud M., et al. (2003). Melatonin modulates secretion of growth hormone and prolactin by trout pituitary glands and cells in culture. Endocrinology. 144, 4648–4658 doi: 10.1210/en.2003-0707
Fei F., Gao X., Wang X., Liu Y., Bin H., Liu B. (2020a). Effect of spectral composition on growth, oxidative stress responses, and apoptosis-related gene expression of the shrimp, Penaeus vannamei. Aquac Rep. 16, 100267. doi: 10.1016/j.aqrep.2019.100267
Fei F., Liu B., Gao X., Wang X., Liu Y., Bin H. (2020b). Effects of supplemental ultraviolet light on growth, oxidative stress responses, and apoptosis-related gene expression of the shrimp Litopenaeus vannamei. Aquaculture 520, 735013. doi: 10.1016/j.aquaculture.2020.735013
Fox B. K., Riley L. G., Hirano T., Grau E. G. (2006). Effects of fasting on growth hormone, growth hormone receptor, and insulin-like growth factor-I axis in seawater-acclimated tilapia, Oreochromis mossambicus. Gen. Comp. Endocrinol. 148, 340–347. doi: 10.1016/j.ygcen.2006.04.007
Guo H., Li K., Wang W., Wang C., Shen Y. (2017). Effects of copper on hemocyte apoptosis, ROS production, and gene expression in white shrimp Litopenaeus vannamei. Biol. Trace Elem Res. 179, 318–326. doi: 10.1007/s12011-017-0974-6
Huang Z., Liu X., Ma A., Wang X., Guo X., Zhao T., et al. (2020). Molecular cloning, characterization and expression analysis of p53 from turbot Scophthalmus maximus and its response to thermal stress. J. Therm Biol. 90, 102560. doi: 10.1016/j.jtherbio.2020.102560
Ji W., Liang H., Zhou W., Zhang X. (2013). Apoptotic responses of zebrafish (Danio rerio) after exposure with microcystin-LR under different ambient temperatures. J. Appl. Toxicol. 33, 799–806. doi: 10.1002/jat.2735
Karakatsouli N., Papoutsoglou E. S., Sotiropoulos N., Mourtikas D., Stigen-Martinsen T., Papoutsoglou S. E. (2010). Effects of light spectrum, rearing density and light intensity on growth performance of scaled and mirror common carp Cyprinus carpio reared under recirculating system conditions. Aquac Eng. 42, 121–127. doi: 10.1016/j.aquaeng.2010.01.001
Kim B.-H., Hur S.-P., Hur S.-W., Lee C.-H., Lee Y.-D. (2016b). Relevance of light spectra to growth of the rearing tiger puffer Takifugu rubripes. Dev. Reprod. 20, 23 doi: 10.12717/dr.2016.20.1.023
Kim B. S., Jung S. J., Choi Y. J., Kim N. N., Choi C. Y., Kim J. W. (2016a). Effects of different light wavelengths from LEDs on oxidative stress and apoptosis in olive flounder (Paralichthys olivaceus) at high water temperatures. Fish Shellfish Immunol. 55, 460–468. doi: 10.1016/j.fsi.2016.06.021
Kim B.-H., Lee C.-H., Choi S.-H., Lee Y.-D. (2019). Changes in body growth and growth-related genes under different photoperiods in olive flounder, Paralichthys olivaceus. Dev. Reprod. 23, 149–160. doi: 10.12717/DR.2019.23.2.149
Li Z., Li Y., Cai S., Ju C. (2017). The effects of environmental factors on growth and growth-related genes’ expressions of Amphiprion ocellaris. Journal of Shanghai Ocean University. 26, 321–329. doi: 10.12024/jsou.20160301699
Li W. S., Lin H. R. (2010). The endocrine regulation network of growth hormone synthesis and secretion in fish: Emphasis on the signal integration in somatotropes. Sci. China Life Sci. 53, 462–470. doi: 10.1007/s11427-010-0084-6
Li X., Liu S., Fan K., Zhang J., Wei P., Liu Y., et al. (2022). Effects of illumination intensities on growth, digestive and metabolic enzyme activities and antioxidant capacities of juvenile Takifugu rubripes. Aquaculture 548, 737594. doi: 10.1016/J.AQUACULTURE.2021.737594
Liu S., Li Y., Li X., Wei P., Ma H., Liu Y., et al. (2021). Effects of LED spectra on growth, feeding, and digestive enzyme activities of juvenile Takifugu rubripes. J. Fishery Sci. China 28, 1011–1019. doi: 10.12264/JFSC2020-0581
Liu Q., Yan H., Hu P., Liu W., Shen X., Cui X., et al. (2019). Growth and survival of Takifugu rubripes larvae cultured under different light conditions. Fish Physiol. Biochem. 45, 1533–1549. doi: 10.1007/s10695-019-00639-0
Ma A., Li W., Wang X., Yue L., Zhuang Z., Meng X., et al. (2014). Reasearch progress and outlook of Takifugu rubripes culture techniques. Mar. Sci. 38, 116–121. doi: 10.11759/hykx20121130001
Ma H., Wei P., Li X., Liu S., Tian Y., Zhang Q., et al. (2021). Effects of photoperiod on growth, digestive, metabolic and non-special immunity enzymes of Takifugu rubripes larvae. Aquaculture 542, 736840. doi: 10.1016/j.aquaculture.2021.736840
Max M., Menaker M. (1992). Regulation of melatonin production by light, darkness, and temperature in the trout pineal. J. Comp. Physiol. A 170, 479–489. doi: 10.1007/BF00191463
McRory J. E., Parker D. B., Ngamvongchon S., Sherwood N. M. (1995). Sequence and expression of cDNA for pituitary adenylate cyclase activating polypeptide (PACAP) and growth hormone-releasing hormone (GHRH)-like peptide in catfish. Mol. Cell Endocrinol. 108, 169–177. doi: 10.1016/0303-7207(94)03467-8
Migaud H., Ismail R., Cowan M., Davie A. (2012). Kisspeptin and seasonal control of reproduction in male European sea bass (Dicentrarchus labrax). Gen. Comp. Endocrinol. 179, 384–399. doi: 10.1016/j.ygcen.2012.07.033
Migaud H., Taylor J. F., Taranger G. L., Davie A., Cerdá-Reverter J. M., Carrillo M., et al. (2006). A comparative ex vivo and in vivo study of day and night perception in teleosts species using the melatonin rhythm. J. Pineal Res. 41, 42–52. doi: 10.1111/j.1600-079X.2006.00330.x
Mohamed J. S., Benninghoff A. D., Holt G. J., Khan I. A. (2007). Developmental expression of the G protein-couple receptor 54 and three GnRH mRNAs in the teleost fish cobia. J. Mol. Endocrinol. 38, 235–244. doi: 10.1677/jme.1.02182
Nam B. H., Moon J. Y., Kim Y. O., Kong H. J., Kim W. J., Kim K. K., et al. (2011). Molecular and functional analyses of growth hormone-releasing hormone (GHRH) from olive flounder (Paralichthys olivaceus). Comp. Biochem. Physiol. - B Biochem. Mol. Biol. 159, 84–91. doi: 10.1016/j.cbpb.2011.02.006
Peng L.b., Wang D., Han T., Wen Z., Cheng X., Zhu Q. L., et al. (2022). Histological, antioxidant, apoptotic and transcriptomic responses under cold stress and the mitigation of blue wavelength light of zebrafish eyes. Aquac Rep. 26, 101291. doi: 10.1016/J.AQREP.2022.101291
Reinecke M. (2010). Influences of the environment on the endocrine and paracrine fish growth hormone-insulin-like growth factor-I system. J. Fish Biol. 76, 1233–1254. doi: 10.1111/j.1095-8649.2010.02605.x
Reiter R. J., Carneiro R. C., Oh C. S. (1997). Melatonin in relation to cellular antioxidative defense mechanisms. Hormone Metab. Res. Hormone Metab. Res. 29, 363–372 doi: 10.1055/s-2007-979057
Sakata S.i., Yan Y. L., Satou Y., Momoi A., Ngo-Hazelett P., Nozaki M., et al. (2007). Conserved function of caspase-8 in apoptosis during bony fish evolution. Gene 396, 134–148. doi: 10.1016/j.gene.2007.03.010
Sánchez-Vázquez F. J., López-Olmeda J. F., Vera L. M., Migaud H., López-Patiño M. A., Míguez J. M. (2019). Environmental cycles, melatonin, and circadian control of stress response in fish. Front. Endocrinol. (Lausanne) 10. doi: 10.3389/fendo.2019.00279
Shin H. S., Lee J., Choi C. Y. (2011). Effects of LED light spectra on oxidative stress and the protective role of melatonin inrelation to the daily rhythm of the yellowtail clownfish, Amphiprion clarkii. Comp. Biochem. Physiol. - A Mol. Integr. Physiol. 160, 221–228. doi: 10.1016/j.cbpa.2011.06.002
Shin H. S., Lee J., Choi C. Y. (2012). Effects of LED light spectra on the growth of the yellowtail clownfish Amphiprion clarkii. Fisheries Science. 78, 549–556. doi: 10.1007/s12562-012-0482-8
Stefansson S. O., Hansen T. J. (1989). The effect of spectral composition on growth and smolting in Atlantic salmon (Salmo salar) and subsequent growth in sea cages. Aquaculture 82, 155–162. doi: 10.1016/0044-8486(89)90404-3
Sun Z., Tan X., Liu Q., Ye H., Zou C., Xu M., et al. (2019). Physiological, immune responses and liver lipid metabolism of orange-spotted grouper (Epinephelus coioides) under cold stress. Aquaculture 498, 545–555. doi: 10.1016/j.aquaculture.2018.08.051
Tian H., Zhang D., Li X., Jiang G., Liu W. (2019). Photoperiod affects blunt snout bream (Megalobrama amblycephala) growth, diel rhythm of cortisol, activities of antioxidant enzymes and mRNA expression of GH/IGF-I. Comp. Biochem. Physiol. B Biochem. Mol. Biol. 233, 4–10. doi: 10.1016/j.cbpb.2019.03.007
Villamizar N., García-Alcazar A., Sánchez-Vázquez F. J. (2009). Effect of light spectrum and photoperiod on the growth, development and survival of European sea bass (Dicentrarchus labrax) larvae. Aquaculture 292, 80–86. doi: 10.1016/j.aquaculture.2009.03.045
Wang T., Cheng Y., Liu Z., Yan S., Long X. (2013). Effects of light intensity on growth, immune response, plasma cortisol and fatty acid composition of juvenile Epinephelus coioides reared in artificial seawater. Aquaculture 414–415, 135–139. doi: 10.1016/j.aquaculture.2013.08.004
Wei P., Li X., Fei F., Ma H., Gao D., Song C., et al. (2019). Effects of light spectrum on growth and related gene expression of larval and juvenile tiger puffer Takifugu rubripes. J. Dalian Ocean Univ. 34, 668–673. doi: 10.16535/j.cnki.dlhyxb.2018-230
Wei P., Li X., Liu Y., Li X., Song C., Chen T., et al. (2020). Effects of photoperiod on expression level and daily expression pattern of GH and SS genes in brain of tiger puffer Takifugu rubripes. J. Dalian Ocean Univ. 35, 108–113. doi: 10.16535/j.cnki.dlhyxb.2019-160
Wu Y. H., Swaab D. F. (2005). The human pineal gland and melatonin in aging and alzheimer’s disease. J. Pineal Res. 38, 145–152. doi: 10.1111/j.1600-079X.2004.00196.x
Wu L., Wang Y., Han M., Song Z., Song C., Xu S., et al. (2020). Growth, stress and non-specific immune responses of turbot (Scophthalmus maximus) larvae exposed to different light spectra. Aquaculture. 520, 734950. doi: 10.1016/j.aquaculture.2020.734950
Wu Y., Yan H., Shen X., Jiang J., Yuan Z., Liu Q., et al. (2022). Effects of different light conditions on growth, muscle nutrients content, and clock gene circadian expression of Takifugu rubripes. Aquac Rep. 26, 101294. doi: 10.1016/J.AQREP.2022.101294
Xian J. A., Miao Y. T., Li B., Guo H., Wang A. L. (2013). Apoptosis of tiger shrimp (Penaeus monodon) haemocytes induced by escherichia coli lipopolysaccharide. Comp. Biochem. Physiol. - A Mol. Integr. Physiol. 164, 301–306. doi: 10.1016/j.cbpa.2012.10.008
Yuan L., Lv B., Zha J., Wang Z. (2017). Benzo[a]pyrene induced p53-mediated cell cycle arrest, DNA repair, and apoptosis pathways in Chinese rare minnow (Gobiocypris rarus). Environ. Toxicol. 32, 979–988. doi: 10.1002/tox.22298
Zhang L., Cao J., Wang Z., Dong Y., Chen Y. (2016). Melatonin modulates monochromatic light-induced GHRH expression in the hypothalamus and GH secretion in chicks. Acta Histochem. 118, 286–292 doi: 10.1016/j.acthis.2016.02.005
Zhu Y., Chen X., Pan N., Liu S., Su Y., Xiao M., et al. (2022). The effects of five different drying methods on the quality of semi-dried Takifugu obscurus fillets. LWT 161, 113340. doi: 10.1016/j.lwt.2022.113340
Keywords: Takifugu rubripes, LED spectrum, growth, GH/IGF-I axis genes, apoptosis genes
Citation: Liu S, Fang Y, Liu Y, Li X, Sun F, Wu Y, Ma Z and Ma H (2022) Effects of different LED spectra on growth and expression of GH/IGF-I axis and apoptosis related genes in juvenile Takifugu rubripes. Front. Mar. Sci. 9:1008068. doi: 10.3389/fmars.2022.1008068
Received: 31 July 2022; Accepted: 11 October 2022;
Published: 24 October 2022.
Edited by:
Ce Shi, Ningbo University, ChinaReviewed by:
Guancang Dong, Shandong Freshwater Fisheries Research Institute, ChinaCopyright © 2022 Liu, Fang, Liu, Li, Sun, Wu, Ma and Ma. This is an open-access article distributed under the terms of the Creative Commons Attribution License (CC BY). The use, distribution or reproduction in other forums is permitted, provided the original author(s) and the copyright owner(s) are credited and that the original publication in this journal is cited, in accordance with accepted academic practice. No use, distribution or reproduction is permitted which does not comply with these terms.
*Correspondence: He Ma, bWFoZUBkbG91LmVkdS5jbg==
Disclaimer: All claims expressed in this article are solely those of the authors and do not necessarily represent those of their affiliated organizations, or those of the publisher, the editors and the reviewers. Any product that may be evaluated in this article or claim that may be made by its manufacturer is not guaranteed or endorsed by the publisher.
Research integrity at Frontiers
Learn more about the work of our research integrity team to safeguard the quality of each article we publish.