 Anna-Leena Downie
94% of researchers rate our articles as excellent or good
Learn more about the work of our research integrity team to safeguard the quality of each article we publish.
Find out more
ORIGINAL RESEARCH article
Front. Mar. Sci. , 22 June 2021
Sec. Marine Conservation and Sustainability
Volume 8 - 2021 | https://doi.org/10.3389/fmars.2021.662285
This article is part of the Research Topic Working Towards a Blue Future: Promoting Sustainability, Environmental Protection and Marine Management: Examples from the UK Government Blue Belt Programme and Current International Initiatives View all 23 articles
The South Sandwich Islands (SSI) are a chain of volcanic islands located to the east of the Scotia Sea, approximately 700 km south-east of South Georgia. To date, knowledge of the SSI benthic environment remains limited. In this context, the Blue Belt Programme conducted a scientific survey in the SSI Marine Protected Area (MPA) during February/March 2019 to examine the biodiversity and distribution of benthic communities and their potential vulnerability to licensed longline research fisheries. Here we report results from analysis of multibeam echosounder (MBES) data and drop camera imagery data collected in selected locations around the SSI. A total of eight vulnerable marine ecosystem (VME) indicator morphotaxa were mapped along the slopes of the SSI, showing a substantial variation in taxon composition and frequency of occurrence, both along bathymetric and latitudinal gradients. Our results suggest that VME indicator taxa are mostly restricted to waters shallower than 700 m. As such, based on our present understanding of the region’s benthic environment the MPA, as currently established, offers effective protection for the majority of the VME indicator taxa.
The UK’s Overseas Territories (UKOTs) are home to over 90% of the United Kingdom’s biodiversity and are of fundamental importance to regional and international marine conservation (FCO, 2012). Located in the South Atlantic sector of the Southern Ocean, the overseas territory of South Georgia and the South Sandwich Islands (SGSSI) is recognised as a globally important wildlife haven. The islands are an internationally significant site for higher predators, hosting some of the largest populations of seabirds and marine mammals on Earth (Ratcliffe and Trathan, 2011; Trathan et al., 2014; Rogers et al., 2015). Furthermore, regional studies centred around South Georgia demonstrate a diverse and distinct benthic fauna with a high proportion of species recorded as endemic to the region (Barnes et al., 2011; Hogg et al., 2011; De Broyer et al., 2014).
In 2012, the Government of South Georgia & the South Sandwich Islands (GSGSSI) declared a sustainable use Marine Protected Area (MPA) across its maritime zone, covering an area of 1.24 million km2 (GSGSSI, 2018). The MPA saw additional enhancements in 2013 and 2018 (Trathan et.al., 2014; Clubbe, 2018; GSGSSI, 2018). It is one of the largest MPAs in the world and the South Sandwich Islands (SSI) forms a significant proportion of the area protected. The SGSSI MPA encompasses strict biodiversity protection measures. Bottom trawl fishing is prohibited inside the MPA and all forms of fishing activities on the seafloor are prohibited across 94% of the MPA. A toothfish research fishery, using the Spanish or Autoline systems, is currently restricted to depths between 700 and 2250 m. The fishery began in 1988 on the South Georgia shelf, expanding to the SSI in 1993, following a rapid expansion in the wider Southern Ocean (Collins et al., 2010). The SSI commercial fishery was abandoned due to low catches and the fishing activity was subsequently abandoned in the region until 2005 when CCAMLR agreed a mark-recapture research fishery in Subarea 48.4 (CCAMLR, 2016). In 2008, CCAMLR divided the Subarea 48.4 into a northern area (Subarea 48.4N) and a southern area (Subarea 48.4S) with targetted longline fisheries of Patagonian toothfish (Dissostichus eleginoides) in Subarea 48.4N and Antarctic toothfish (Dissostichus mawsoni) in Subarea 48.4S. Since 2013, the management regime was altered to remove the northern and southern areas and species-specific catch limits are set for the whole area (CCAMLR, 2016).
Vulnerable Marine Ecosystems (VME) refer to marine ecosystems with populations of sensitive taxa or habitats that are likely to experience substantial alteration from short-term or chronic disturbance and that are unlikely to recover during the timeframe in which the disturbance occurs (FAO, 2009). The VME concept was introduced in the United Nations General Assembly (UNGA) Resolution 61/105 (UNGA, 2006) and has been applied to the management of deep-sea fisheries worldwide. VMEs are defined as being vulnerable to impacts due to their physical or functional fragility, which makes them both easily disturbed and very slow or unable to recover (FAO, 2009). Whilst vulnerability must be assessed relative to specific threats and may vary, fragile, slow-growing and long-lived taxa with limited dispersal, such as corals and some sponges, can be considered universally vulnerable. Coral and sponge dominated communities, form complex habitats that harbour a wide range of epibenthic fauna (e.g., Bett and Rice, 1992; Copley et al., 1996; Pierrejean et al., 2020) and are important for overall ecosystem functioning. The Commission for the Conservation of Antarctic Marine Living Resources (CCAMLR) was among the first entities to come up with definitions of VME, through evaluating benthic taxa occurring in the convention area, which includes the SSI, in terms of their susceptibility to long term damage from fishing (CCAMLR, 2009b). CCAMLR has also adopted a number of conservation and environmental protection measures to address the protection of VMEs, including procedures to monitor and report encounters (CCAMLR, 2009a, 2013, 2019; see also Bell et al., 2019). Information on the distribution and abundance of VME indicator taxa is one of the most important and yet most often missing factors needed for effective identification and management of VMEs (Auster et al., 2011; Ardron et al., 2014). The lack of data coverage has led to the use of predictive modelling to extrapolate distribution over larger areas (e.g., Howell et al., 2016; Rowden et al., 2017; Kazanidis et al., 2019; Brewin et al., 2020). Other additional criteria are also required to designate VME, particularly abundance of the VME indicator taxa and the presence of threats (Morato et al., 2018).
Currently however, there is substantially more information available for South Georgia compared to the SSI. Little is known about the marine biodiversity of the SSI, particularly in deeper waters, which makes it challenging to assess the status of VME across the whole SGSSI MPA. The SSI are an archipelago formed by a chain of 11 volcanic islands located south-east of South Georgia on a roughly north–south axis between 56°S and 60°S (Figure 1). Due to their geographical isolation, inhospitable climate and lack of natural harbours, the logistical difficulty in carrying out in situ work at the islands has resulted in large gaps in our knowledge, especially of the islands benthic environment. Limited scientific sampling (e.g., Ramos, 1999; Howe et al., 2004; Malyutina, 2004; Griffiths et al., 2008; Kaiser et al., 2008; Lockhart and Jones, 2008; Linse et al., 2019), together with fisheries bycatch data (Collins et al., 2010; Roberts, 2012), has contributed to the current understanding of the region’s benthic ecosystems.
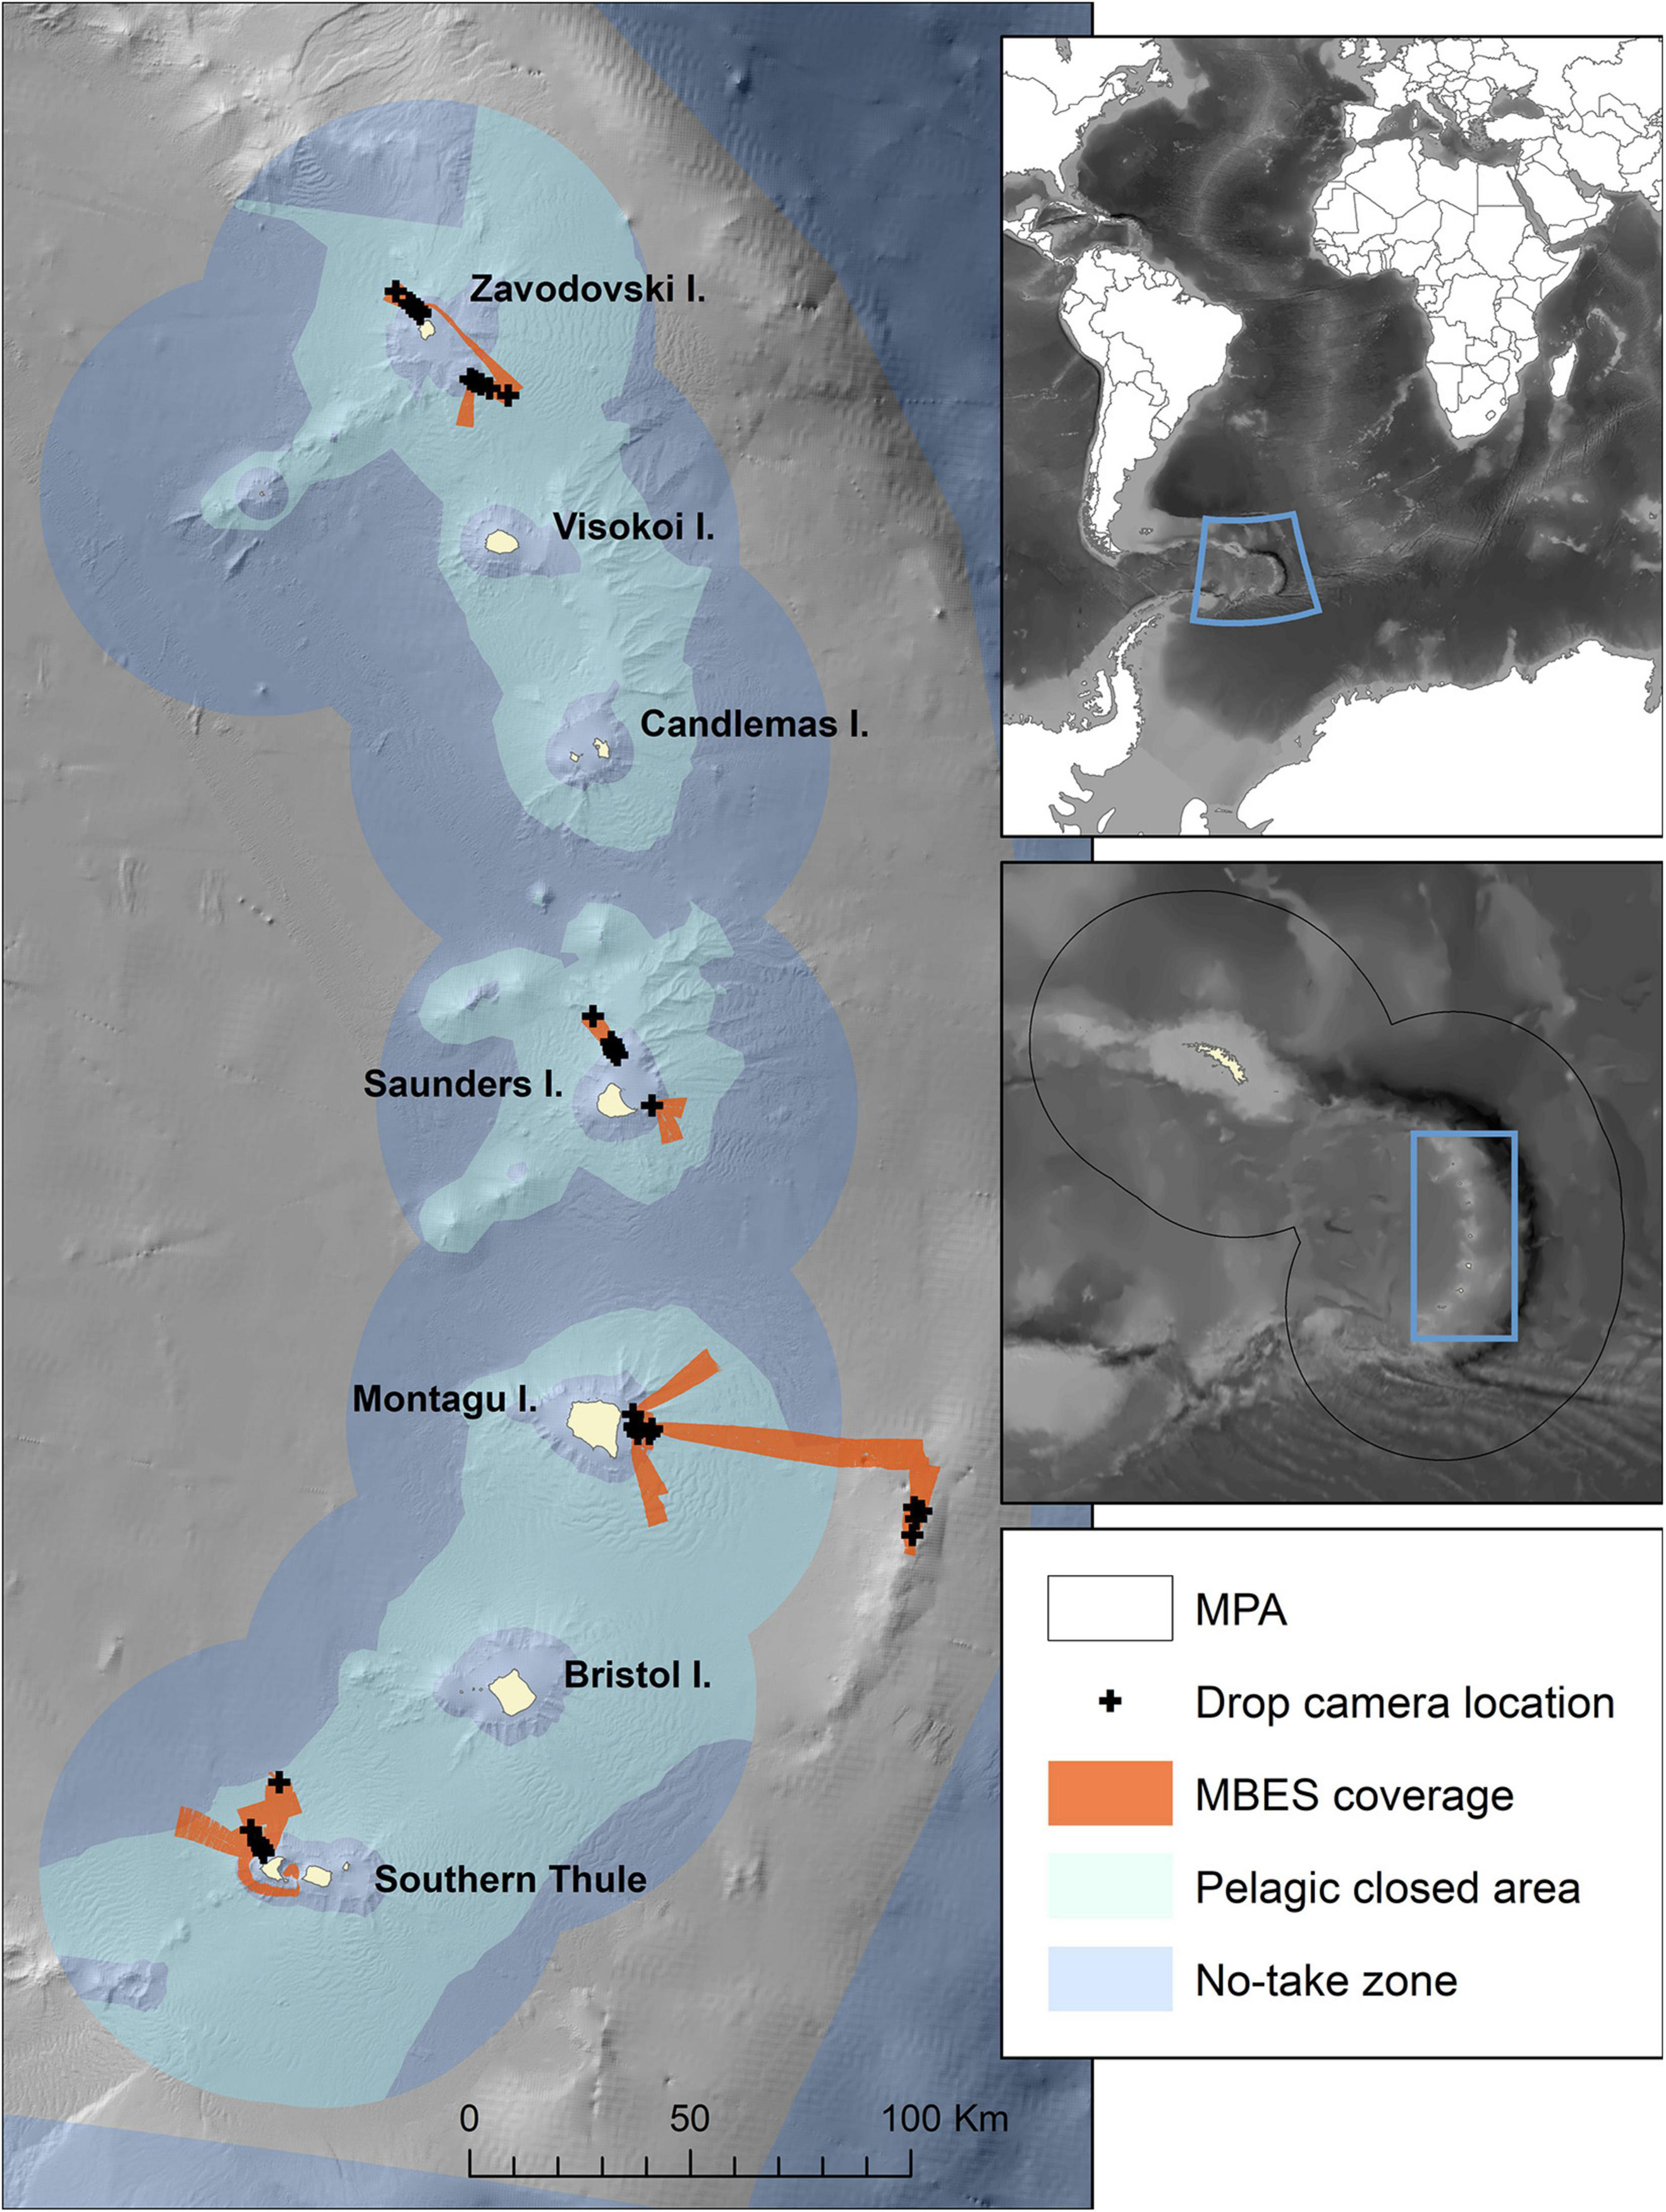
Figure 1. Map of the study area showing the locations visited, with multibeam echosounder (MBES) coverage acquired in this study and the locations of drop-camera transects. The extent of no-take zones and pelagic closed areas are also indicated. The inset covering South Georgia and South Sandwich Islands shows the boundary of the South Georgia and South Sandwich Islands Marine Protected Area (SGSSI-MPA). Bathymetry from Leat et al. (2014) and GEBCO 2020 Grid (GEBCO Compilation Group, 2020).
With the objective of increasing the understanding of the benthic environment of the SSI, the Blue Belt Programme set out to collect data to examine the biodiversity and distribution of benthic invertebrate taxa and their potential vulnerability to impacts of the licensed longline research fisheries. The objectives of the Blue Belt UK Government funded RRS Discovery Expedition 99 (DY99) were supported by the GSGSSI MPA review (Clubbe, 2018), which highlighted significant gaps in the region’s knowledge despite the increasing amount of scientific research that has been undertaken within the MPA since 2013.
This study aimed to provide information on the distribution of VME indicator taxa at the SSI, spanning a geographical gradient from the north to the south of the archipelago and a depth gradient covering the MPA inner no-take zone and the zone open to long-line fisheries. Deep-water camera imagery collected during the Blue Belt RRS Discovery expedition (DY99), is used to investigate the epibenthic communities and high-resolution multibeam echosounder (MBES) acoustic data is used to extrapolates the fine-scale distribution of VME indicator taxa, at seven study locations through the archipelago.
The SSI, ∼700 km south-east of South Georgia, form an archipelago extending from 56°S to 60°S (Figure 1). The current study targetted seven survey areas located over 4 of the 11 islands. The north-western and south-eastern flanks of Zavodovski and Saunders Islands, eastern flank of Montagu Island, Montagu Bank and north-west flank of Southern Thule (Figure 1), were surveyed during February and March 2019.
At each survey location a representative area incorporating a bathymetric range of ∼150–2,000 m was covered by one or more acoustic survey lines collecting MBES bathymetry and backscatter. A preliminary analysis of the bathymetry onboard the vessel was used to inform the placement of target stations for drop camera deployment, of approximately 30 min seabed time, with the aim of targetting ∼200, 500, 750, 1,000, and 1,500 m depths (Figure 2).
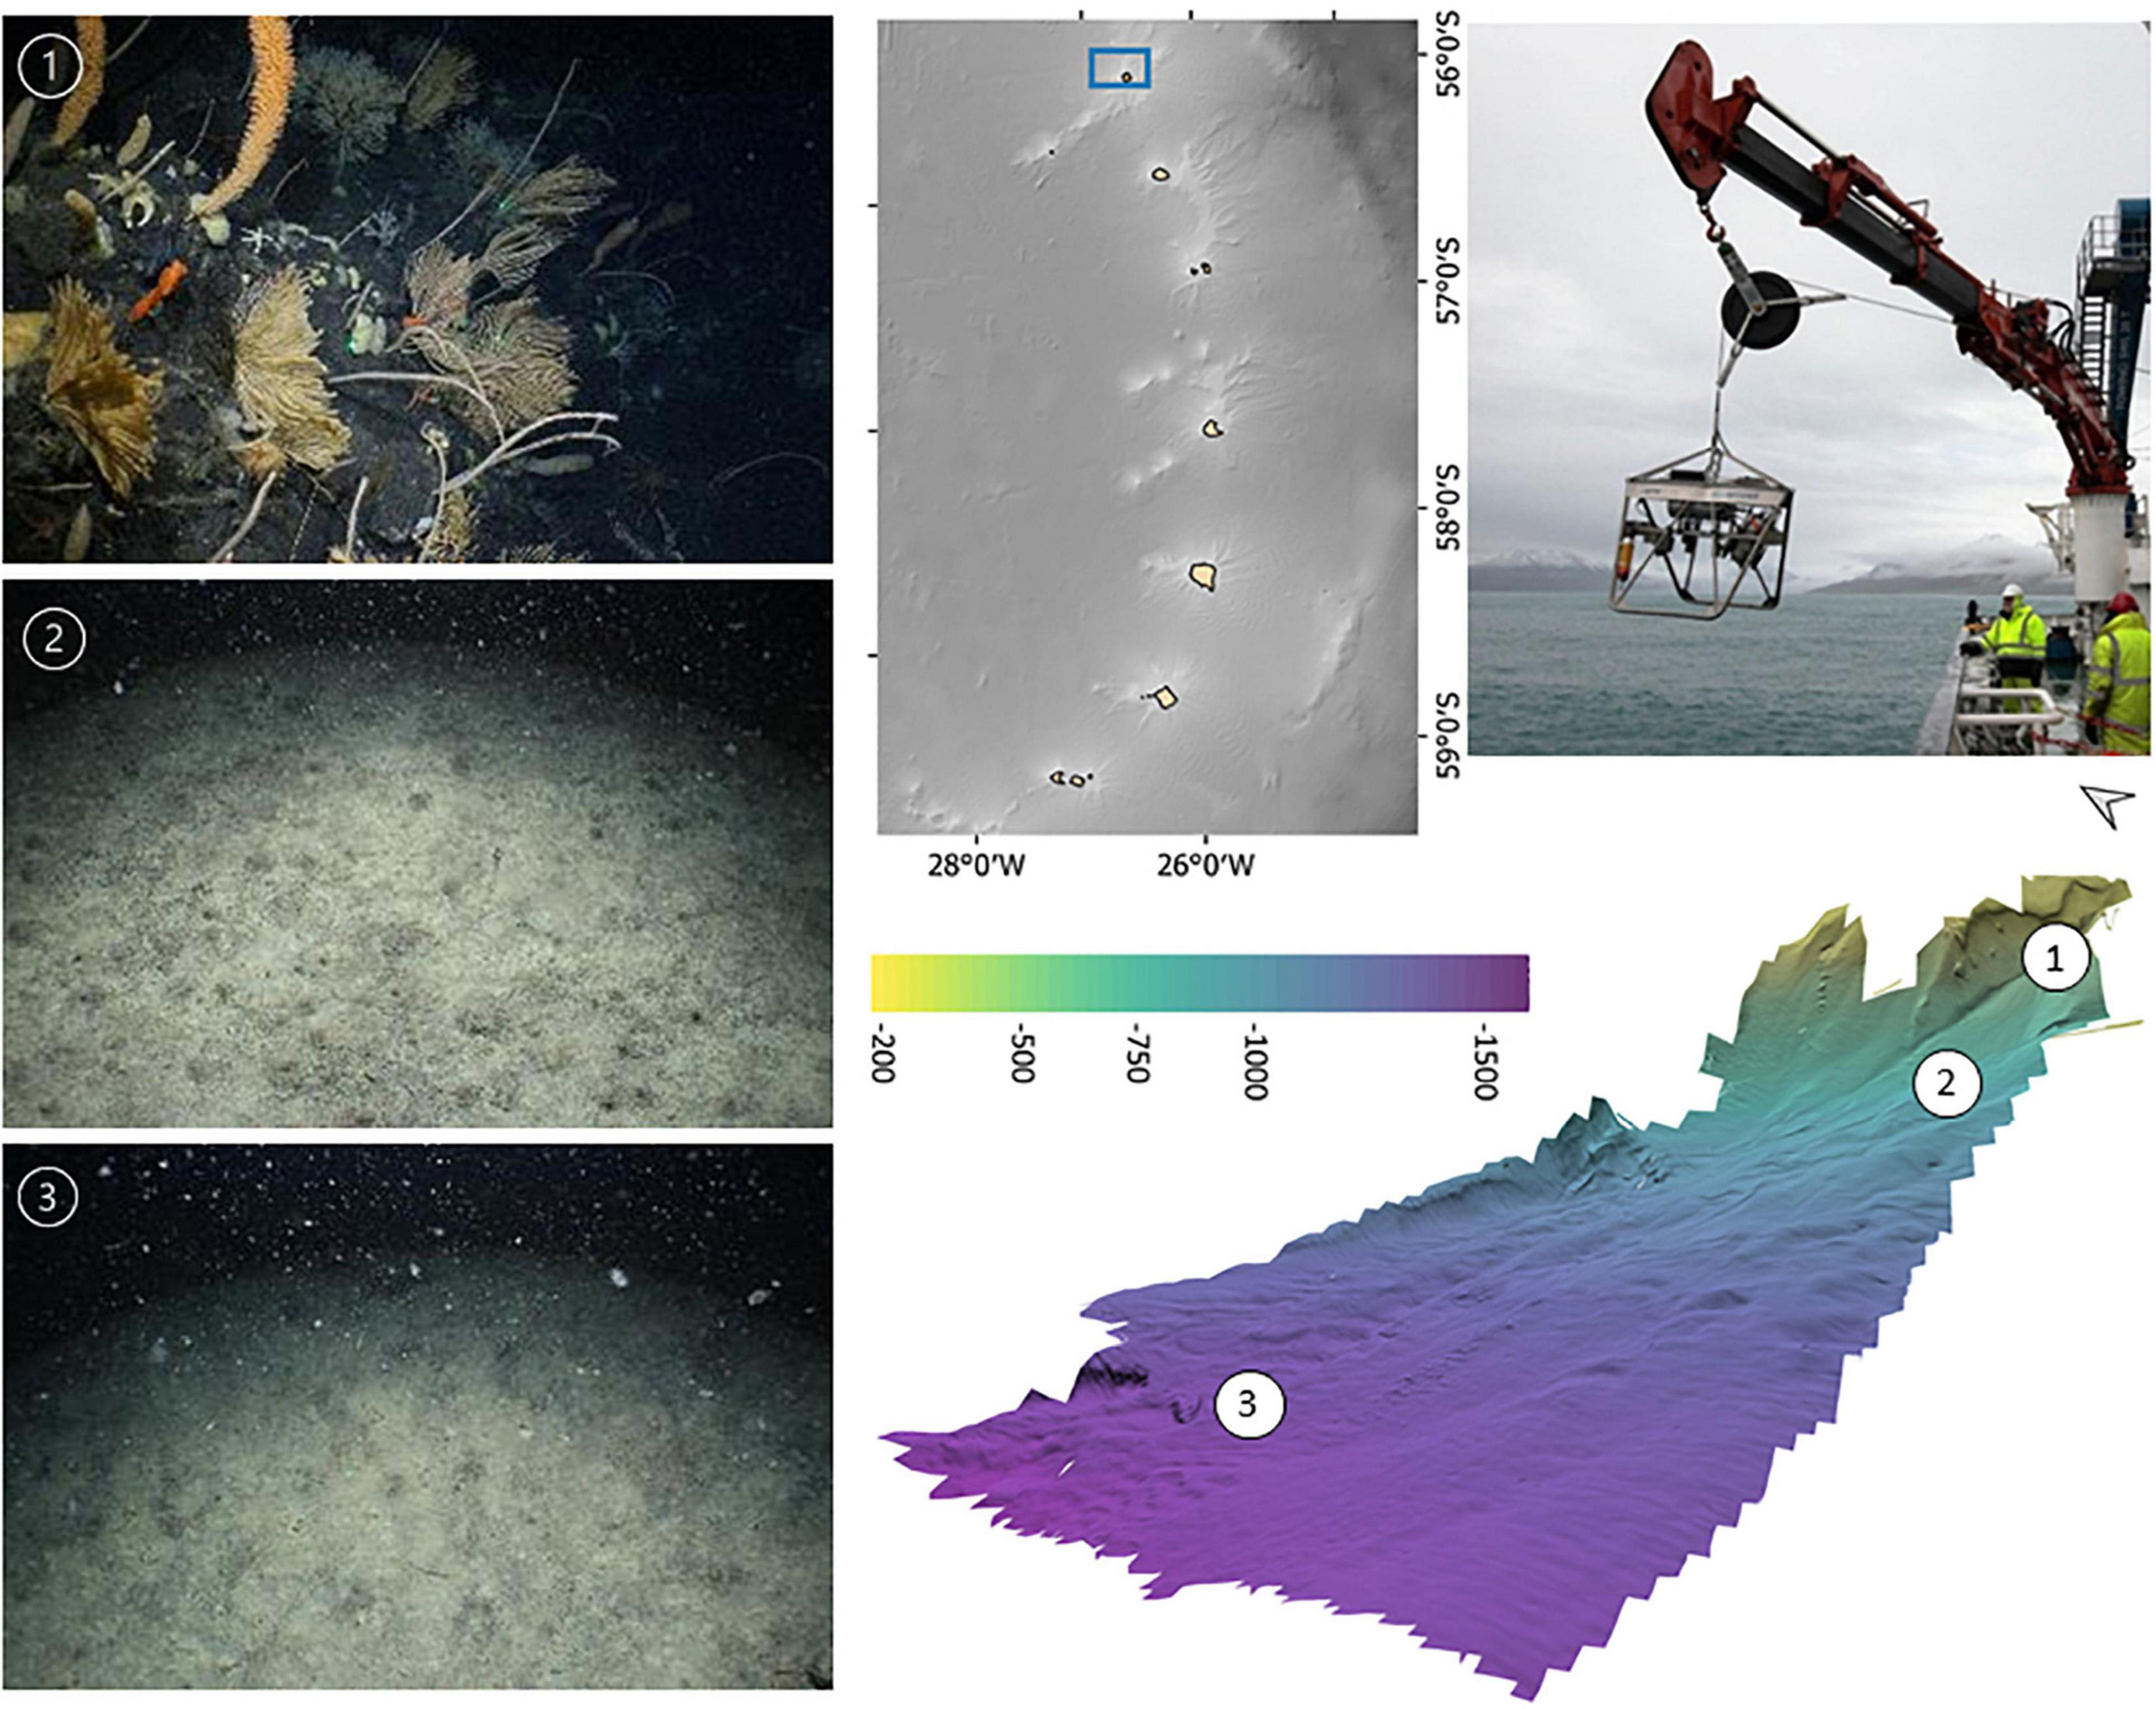
Figure 2. Example of the preliminary bathymetry products used for planning drop-camera transect locations across a representative bathymetric gradient, the camera system used and corresponding habitats observed.
Multibeam echosounder bathymetry and backscatter were acquired at 1–6 knots using a Kongsberg EM122 operated through the SIS (Seafloor Information Systems) acquisition software. Bathymetry data were processed using CARIS HIPS and MBES backscatter data with the QPS FMGT software package. Bathymetry and backscatter grids were resampled to 10 m resolution for analysis.
The bathymetry was used to generate several derivative topographic layers using SAGA GIS tools for QGIS (v. 3.2, https://www.qgis.org; Conrad et al., 2015). The topographic layers, their units of measure and the tools used to produce them are summarised in Table 1. Slope gradient and LS-factor were included as proxies for the likelihood of exposed hard substrata. Steeper slopes are more likely to host attached fauna, which require hard substrata and food-rich currents. LS-factor, is a combination of slope gradient and length, which predicts erosion potential (Desmet and Govers, 1996). Relative slope position (Boehner and Selige, 2006) can be interpreted as a proxy for different current conditions dependent on proximity to the top or bottom of the slope. Positive and negative topographic openness (Yokoyama et al., 2002) and the wind effect index (Boehner and Antonic, 2009) in turn indicate how prominent or sheltered an area is in relation to surrounding topography. Examples of the topographic layers are shown in the Supplementary Figure 8.
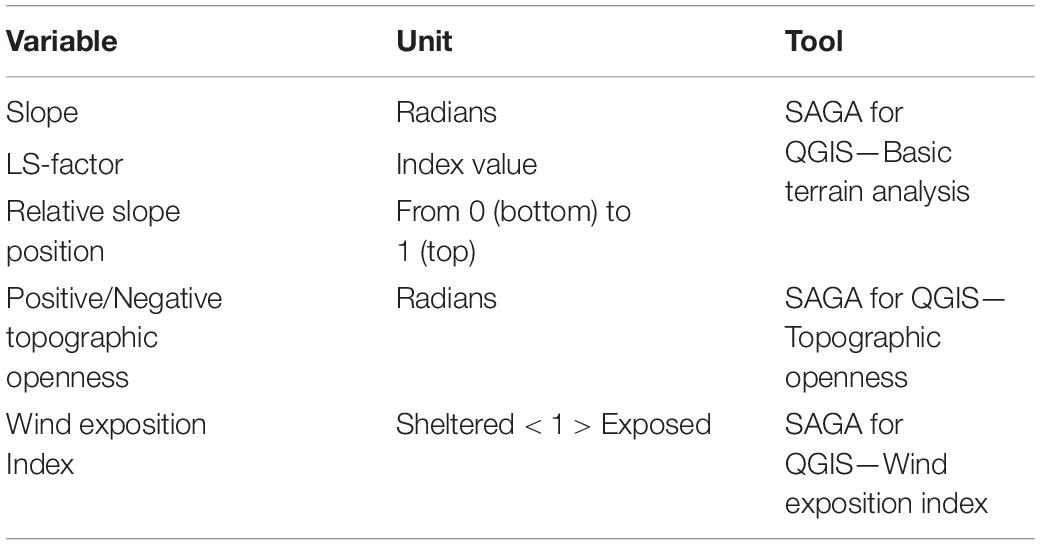
Table 1. Description of topographic derivative layers calculated from multibeam echosounder (MBES) bathymetry, using the SAGA for QGIS Tools (Conrad et al., 2015).
Video observations were made with a deep-water capable drop-frame camera system (STR Telemetry, Figure 2), that separately collects high definition (HD, 1080p/25/30fps) video footage and 18-megapixel digital still images. Illumination was provided by four high-powered light emitting diodes (LED) and a separate high-powered synchronised flash. Both cameras were oriented to provide a forward oblique view of the seabed. The frame also carried a 250 kHz precision altimeter, combined compass and depth sensor and four scaling lasers placed in a 215 mm side length square.
Video and stills data were collected along 30–45 min transects with the vessel moving at a velocity of 0.3–0.5 knots, resulting in a mean distance travelled of 441 m (SD = 118 m). The 34 camera transects, covered a total of 14.99 km of seafloor. The position of the ship and of the drop-frame was recorded at 1 s intervals throughout each transect. The ship’s position was recorded using the central reference position (CRP), sourced from the ships GNSS. Drop-frame position was derived from an ultra-short baseline (USBL) acoustic positioning system beacon placed on the frame.
Recording commenced when the altimeter showed the camera was 30 m from the seabed and continued until the end of the tow and arrival back at 30 m altitude. Once on the seafloor the camera was flown as close to the seabed as possible whilst accounting for swell. Still images were acquired at approximately 30 s intervals through the transect when the camera was within 2 m of the seafloor. Positions were attributed to each still image through matching timestamps. The coordinates attributed to stills was primarily the USBL derived positions. Ship position was used where USBL positions were not available. Spatial accuracy of positioning ranged from ∼10 to 50 m, when using the USBL positioning and ship position, respectively.
The video footage and still images were used to describe conspicuous epifauna present across the depth gradient at each island visited. For each drop camera tow, a list of the most common taxa was recorded, as well as notes on where rarely encountered, large or taxa sensitive to physical disturbance were observed. Most taxa were recorded at the level of operational taxonomic units or morphotaxa (Howell et al., 2019). However, where possible, identification was made to family or genus level. Identifications were based on Rauschert and Arntz (2010); Benedet (2017); Hogg and Collins (unpublished); Taylor (2011), SCAR Biogeographic Atlas (De Broyer et al., 2014), MBARI online deep-sea species guide (Jacobsen Stout et al., 2020) and by direct consultation with taxonomic experts.
A second more detailed analysis of still images was done for VME indicator taxa, where the presence/absence of each VME indicator taxon was recorded for each still image. Target taxa were selected based on the CCAMLR VME Taxa Classification Guide (CCAMLR, 2009c) and consideration of morphologies that are potentially vulnerable to being caught as bycatch or damaged by bottom longline fishing. CCAMLR VME indicators are defined according to their ecological traits, including uniqueness, functional significance, life-history, and susceptibility to degradation by human-induced activities (Parker and Bowden, 2010). In this study we concentrated specifically on those taxa that were considered vulnerable to the longline fishing practices that are the only current source of potential impact in the study area. Poriferans were all recorded at the phylum level. Alcyonacean corals were divided into bottlebrush, whip and branching morphotypes. The different morphotypes of sea pens corresponded to recognisable genus and family level taxonomy (Umbelulla spp., Pennatula spp., Virgulariidae) and were recorded as such. Stalked crinoids were recorded at the morphotype level.
A three-step approach using Object Based Image Analysis (OBIA; Blaschke, 2010) was used to investigate the range of environmental conditions in which VME indicator taxa occur at the SSI and produce maps of the distribution of potentially suitable habitats covering the acoustic survey areas. OBIA works on stacks of raster bands, in this case the acoustic and topographic derivative spatial layers, to segment the layers into spatial units called “objects.” It does this by identifying and placing boundaries around sections with homogeneous characteristics across the layers. These objects can then be used to extract summary values, such as mean, standard deviation and skewness of the pixels that make up each object, for statistical analysis. The object-based approach identifies uniform areas with similar attributes, whilst filtering out noise from single pixels in the data layers. Because of this and its ability to differentiate meaningful seabed zones with well-defined boundaries (Lucieer and Lamarche, 2011), it is often used in conjunction with MBES backscatter data (e.g., Lucieer et al., 2013; Montereale Gavazzi et al., 2016; Lacharité et al., 2018; Misiuk et al., 2021) and for delineating distinct topographic features of interest (Diesing and Thorsnes, 2018). Whilst pixel-based and object-based approaches to habitat mapping both have their pros and cons (Diesing et al., 2014; Ierodiaconou et al., 2018), the object-based approach was chosen for this study, as the combination of larger uniform areas of seabed with multiple images along a drop-camera transect to describe the prevailing habitat facilitates analysis at a broader spatial scale than would be achieved matching images with individual pixel values.
In step 1, OBIA segmentation was run on each survey area. In step 2, environmental conditions in objects containing observations of VME indicator taxa were extracted and the ranges of values were investigated statistically to establish suitable conditions for each taxon at each surveyed location. In step 3, this information was used as an environmental envelope to classify objects as suitable or unsuitable for each VME type, producing maps of the locations where seabed habitats are similar to those where VME indicator taxa were observed.
For the segmentation (step 1), bathymetry, backscatter and topographic layers were imported into eCognition (vs. 9.3) for each island separately and segmentation carried out using the multi-resolution segmentation tool. Multi-resolution segmentation builds objects by consecutively merging neighbouring pixels until an a priori threshold for variability allowed in the objects is reached. This threshold is determined by the scale parameter. For a fixed value of the scale parameter, a homogeneous area of seabed will have larger objects than a heterogeneous area. Likewise, for a fixed seabed heterogeneity, larger values of the scale parameter produce larger objects (Diesing et al., 2014). Segmentation was done in two stages, first to delineate objects following the edges of topographic highs and lows, which bear relevance to the occurrence of suspension feeding sessile fauna such as corals and sponges, and second to further split the objects into soft and hard ground. The layers included in the first segmentation stage, LS-factor, Positive Openness and Relative Slope Position, were selected to represent different aspects of topography, in this case substratum stability, topographic prominence and placement on the hill-trough continuum. Consequently, the first segmentation produced objects that represent uniform patches of seabed with similar elevation in relation to the surrounding topography and slope characteristics. A scale parameter of 5 was used with equal weight for each layer. The other parameters were kept at default values. The scale parameter was chosen to minimise within-object variation, whilst keeping the size of objects from getting too small and achieving a good visual match to the edges of topographic features. In the second segmentation stage, the objects delineating topographic features were further subdivided into smaller objects based on backscatter strength, which is a proxy for seafloor hardness. The scale parameter was again set at 5. Supplementary Figure 10 shows an example area of the segmentation of the benthic environment into multiple objects overlaid on top of the environmental layers used in the algorithm. These objects were exported as a polygon shapefile, with object mean values of all input layers as attributes.
To investigate the environmental conditions where VME indicator taxa were observed (step 2), in QGIS, the object polygons intersected by a drop-camera transect were extracted and the number of the images within each object that included a presence of each distinct VME indicator taxon was added as a data field to each object. In the classification analysis Montagu Island and Montagu Bank are dealt with together and are represented by 147 objects with associated images. Zavodovski Island, Saunders Island and Southern Thule have 140, 122, and 76 objects, respectively. The number of camera images per object ranged from 1 to 48, with an average of six. The presence of indicator taxa in multiple images inside an object indicates a more continuous patch of suitable habitat than single images. The objects were placed into three prevalence classes based on the proportion of images containing each VME taxon. These were 0% (no images with observed presence), <50% (presence observed in less than half of the associated images) and ≥50% (presence observed in 50% or more of the associated images).
The environmental ranges for each taxon, were investigated by prevalence class and island using density plots and summary statistics of values for bathymetry, backscatter, and the topographic derivatives. The SSI demonstrates strong latitudinal gradients in environmental conditions not accounted for in this study, such as temperature and productivity, with significant environmental differentiation between each of the islands (Hogg et al., this issue; Supplementary Figure 9). Consequently, for example, the depth trends seen in the distribution of taxa can be complicated by the confounding influence of island-specific temperature and current profiles across the depth gradient. This means transferability of decision rules between islands is potentially problematic. As such, each study location was investigated separately, deriving island-specific environmental envelopes.
In step 3, maps were produced based on the object values. Methods used for classification of objects in benthic mapping studies range from decision rulesets based on user-defined cutoffs to various machine learning and statistical algorithms (e.g., Diesing et al., 2014; Montereale Gavazzi et al., 2016). In this study, an environmental envelope approach using user-defined cutoffs based on observed values was used for the classification part of OBIA. Whilst more sophisticated modelling methodologies, including numerous classification and regression based statistical approaches, are available, they require more input data to provide robust validated outputs. As such, here the habitat was classified suitable for a VME indicator taxon based on the environmental envelope. Environmental (or Climatic) Envelopes are based on the premise of extracting the position of the relevant taxon within a multidimensional space defined by the range of values of a set of environmental variables in available observations, often within a fixed percentile range to reduce sensitivity to outliers (Kadmon et al., 2003). The envelopes were derived from the summary statistics for objects where the taxon was observed present (<50%) or common (≥50%). Maps were limited to those VME indicator taxon and island combinations with a minimum of 10 objects containing presence records, to ensure reliable statistics of environmental variables from the objects. This limited mapping to all corals and sponges at Zavodovski and Saunders Islands and branching corals only at Montagu Island and Bank. The approach used gives a general indication of the location of potentially suitable habitat. Without fitting a formal model it is not possible to assign probability of presence and the small dataset size excludes reliable validation of habitat suitability. Therefore, the results must be interpreted with these limitations in mind.
The decision rules defining the environmental envelopes are shown in Table 2. The variables used to classify objects were backscatter strength, depth, LS-factor, Relative Slope Position, Slope and Wind Exposition Index, each showing a difference between the density distributions of the prevalence classes in the density plots. The more commonly occurring taxa (bottlebrush and whip corals and sponges) were mapped based on the conditions where they were observed as “continuous habitat” (with a ≥50% presence frequency). The sparsely occurring branching corals, which were not observed as continuous habitat in 10 or more objects, were instead mapped based on any occurrence (<50% presence frequency). For each taxon and island combination the minimum and maximum values (within 1.5 times the interquartile range to exclude outliers) of the objects in the respective frequency class (<50% or ≥50%) were extracted for each environmental variable. The upper and lower limits were applied for depth and LS-factor. For backscatter strength, Relative Slope Position, Slope and Wind Exposition Index just a lower limit was included.
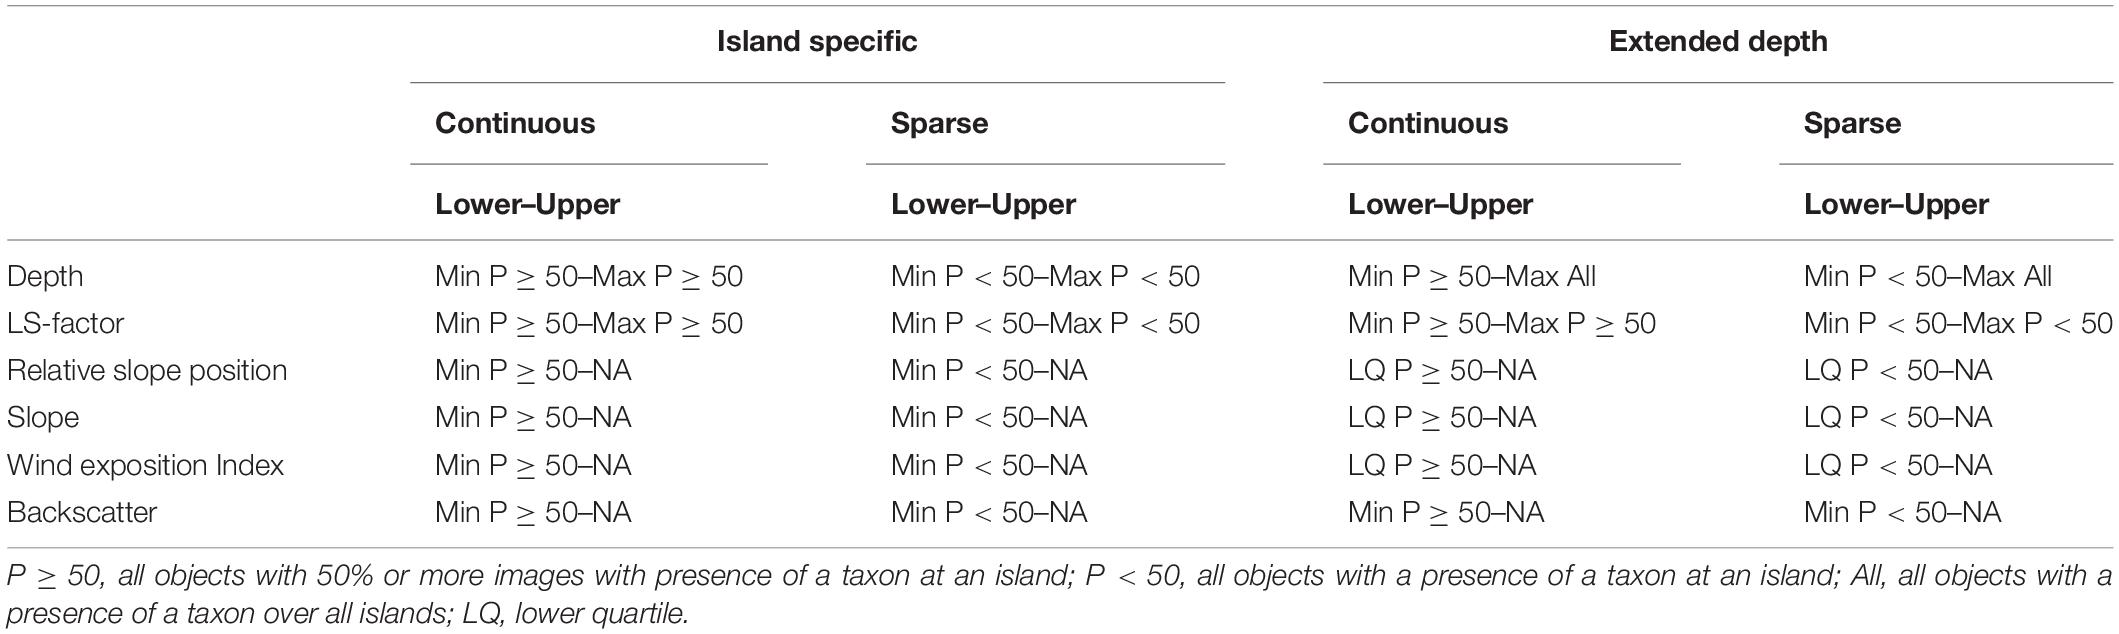
Table 2. Summary of the environmental envelope decision rules with lower and upper boundaries used to create the maps depicting island-specific suitable habitat and potentially suitable habitat in deeper water for VME indicator taxa observed occurring as continuous habitat (bottlebrush and whip corals and sponges, >50% of images per object) and the sparse branching corals observed only occasionally (<50% of images per object).
At several of the islands, deeper transects all fell on level soft ground, which makes determining the true depth limit of the hard substrate-dependent taxa difficult. To address this issue, a second map class was used which extended the maximum depth for each taxon to that observed across all the islands. For the extended maps the lower limits for Slope, Relative Slope Position, and Wind Exposition Index values were assigned using the lower quartile, to limit them to the most likely locations only. Finally, the maps of suitabe habitat of the individual VME indicator taxa at each island were combined producing maps showing the number of co-occurring VME indicator taxa to indicate the locations where habitat suitable for VME indicator taxa is most likely.
The qualitative analysis of video and still imagery showed that the submerged slopes of the SSI were predominantly soft bottom environments with exposed rock present only where local slopes were steep and exposed enough not to allow sedimentation. The benthic epifauna observed on drop-camera transects included hard and soft corals, bryozoans, and sponges attached to exposed rock and dropstones, whilst ophiuroids, sea stars and holothurians dominated the soft sediments. Observations indicate a marked change in abundance and faunal composition correlated with depth and substrate, with higher diversity occurring in the shallower hard substrate habitats.
At Zavodovski Island, occasional dropstones and very steep vertical walls covered by primnoid and isidid corals, various sponges and bryozoans were observed at the shallower stations. Comatulid crinoids were also particularly abundant at between 250 and 300 m depth. The occurrence of corals and sponges reduced dramatically below 350 m depth. At greater depths, diversity and abundance of benthic epifauna was low but included occasional anemones and holothurians. Small swarms of shrimps and some crabs (Paramolis spp.) were commonly observed along with lebensspuren (biologically formed sedimentary structures) in the form of infauna burrows.
At Saunders Island, a complex assemblage of benthic fauna was observed between 220 and 390 m depth. Alcyonaceans including whip and bottlebrush corals, comatulid crinoids, sponges, sea anemones, holothurians and large sea stars were notably abundant at this site. Bedrock outcrops, covered with small-sized fauna, were common on steeper slopes, while flatter areas were covered by fine-grained sediments. One deployment was carried out on the eastern slope, between 300 and 580 m depth, where abundance of benthic epifauna was low, but included rare and little-known hydroids (e.g., Candelabrum sp.), alcyonacean corals, soft corals, sponges and anemones populating moderately large dropstones.
Faunal diversity and abundance were very low along the flanks of Montagu Island, where soft sediment dominated the landscape. Extensive aggregations of tubed polychaetes were encountered at the two shallowest stations, at ∼180 m depth. Some anemones of considerable size were also recorded along these transects. Lebensspuren in the form of infauna burrows and feeding mounds were evident at greater depths, as were numerous large ophiuroids and burrowing holothurians. Sea pens, an important VME indicator, although not particularly prevalent, were recorded along the deepest transect between 810 and 830 m depth.
The benthic habitat observed at Montagu Bank was predominantly formed of small rocks and gravel. Faunal diversity and overall abundance were very low. However, high abundances of holothurians (Psolus sp.), brachiopods and comatulid crinoids were noticeable in two of the four camera deployments.
At Southern Thule, between 235 and 2,050 m depth, soft sediment was the dominant substrate. Diversity and abundance of benthic epifauna observed was low in comparison to the two northernmost islands. The benthic communities were dominated by ophiuroids, while large anemones were commonly observed attached to occasional dropstones. Sea pigs (probably Laetmogone violacea) were common at Southern Thule.
Supplementary Figures 2 to 7 show examples of the habitats encountered at different depths at each study location.
Vulnerable marine ecosystem indicator taxa, as defined by the CCAMLR VME Taxa Classification Guide (CCAMLR, 2009c), observed at the SSI include various alcyonacean corals, sea pens, stalked crinoids, sponges, anemones, soft corals, zoanthids, and solitary cup corals. Of these, alcyonacean corals, sea pens, stalked crinoids, and sponges were investigated in more detail. Figure 3 shows examples of the alcyonacean and pennatulacean morphotypes and taxa observed in this study. The bottlebrush, whip and branching alcyonaceans all included taxa in the family Primnoidea (e.g., Thouarella cf. and Primnoella cf.). The bottlebrush and branching morphotypes also included taxa in the family Isididae. Sea pens included Pennatula spp. and Umbellula spp. and the family Virgulariidae. Porifera included mainly globular and massive morphotypes of demosponges (Figure 4). Figure 4 also shows examples of the stalked crinoids observed at Saunders Island and Montagu Bank.
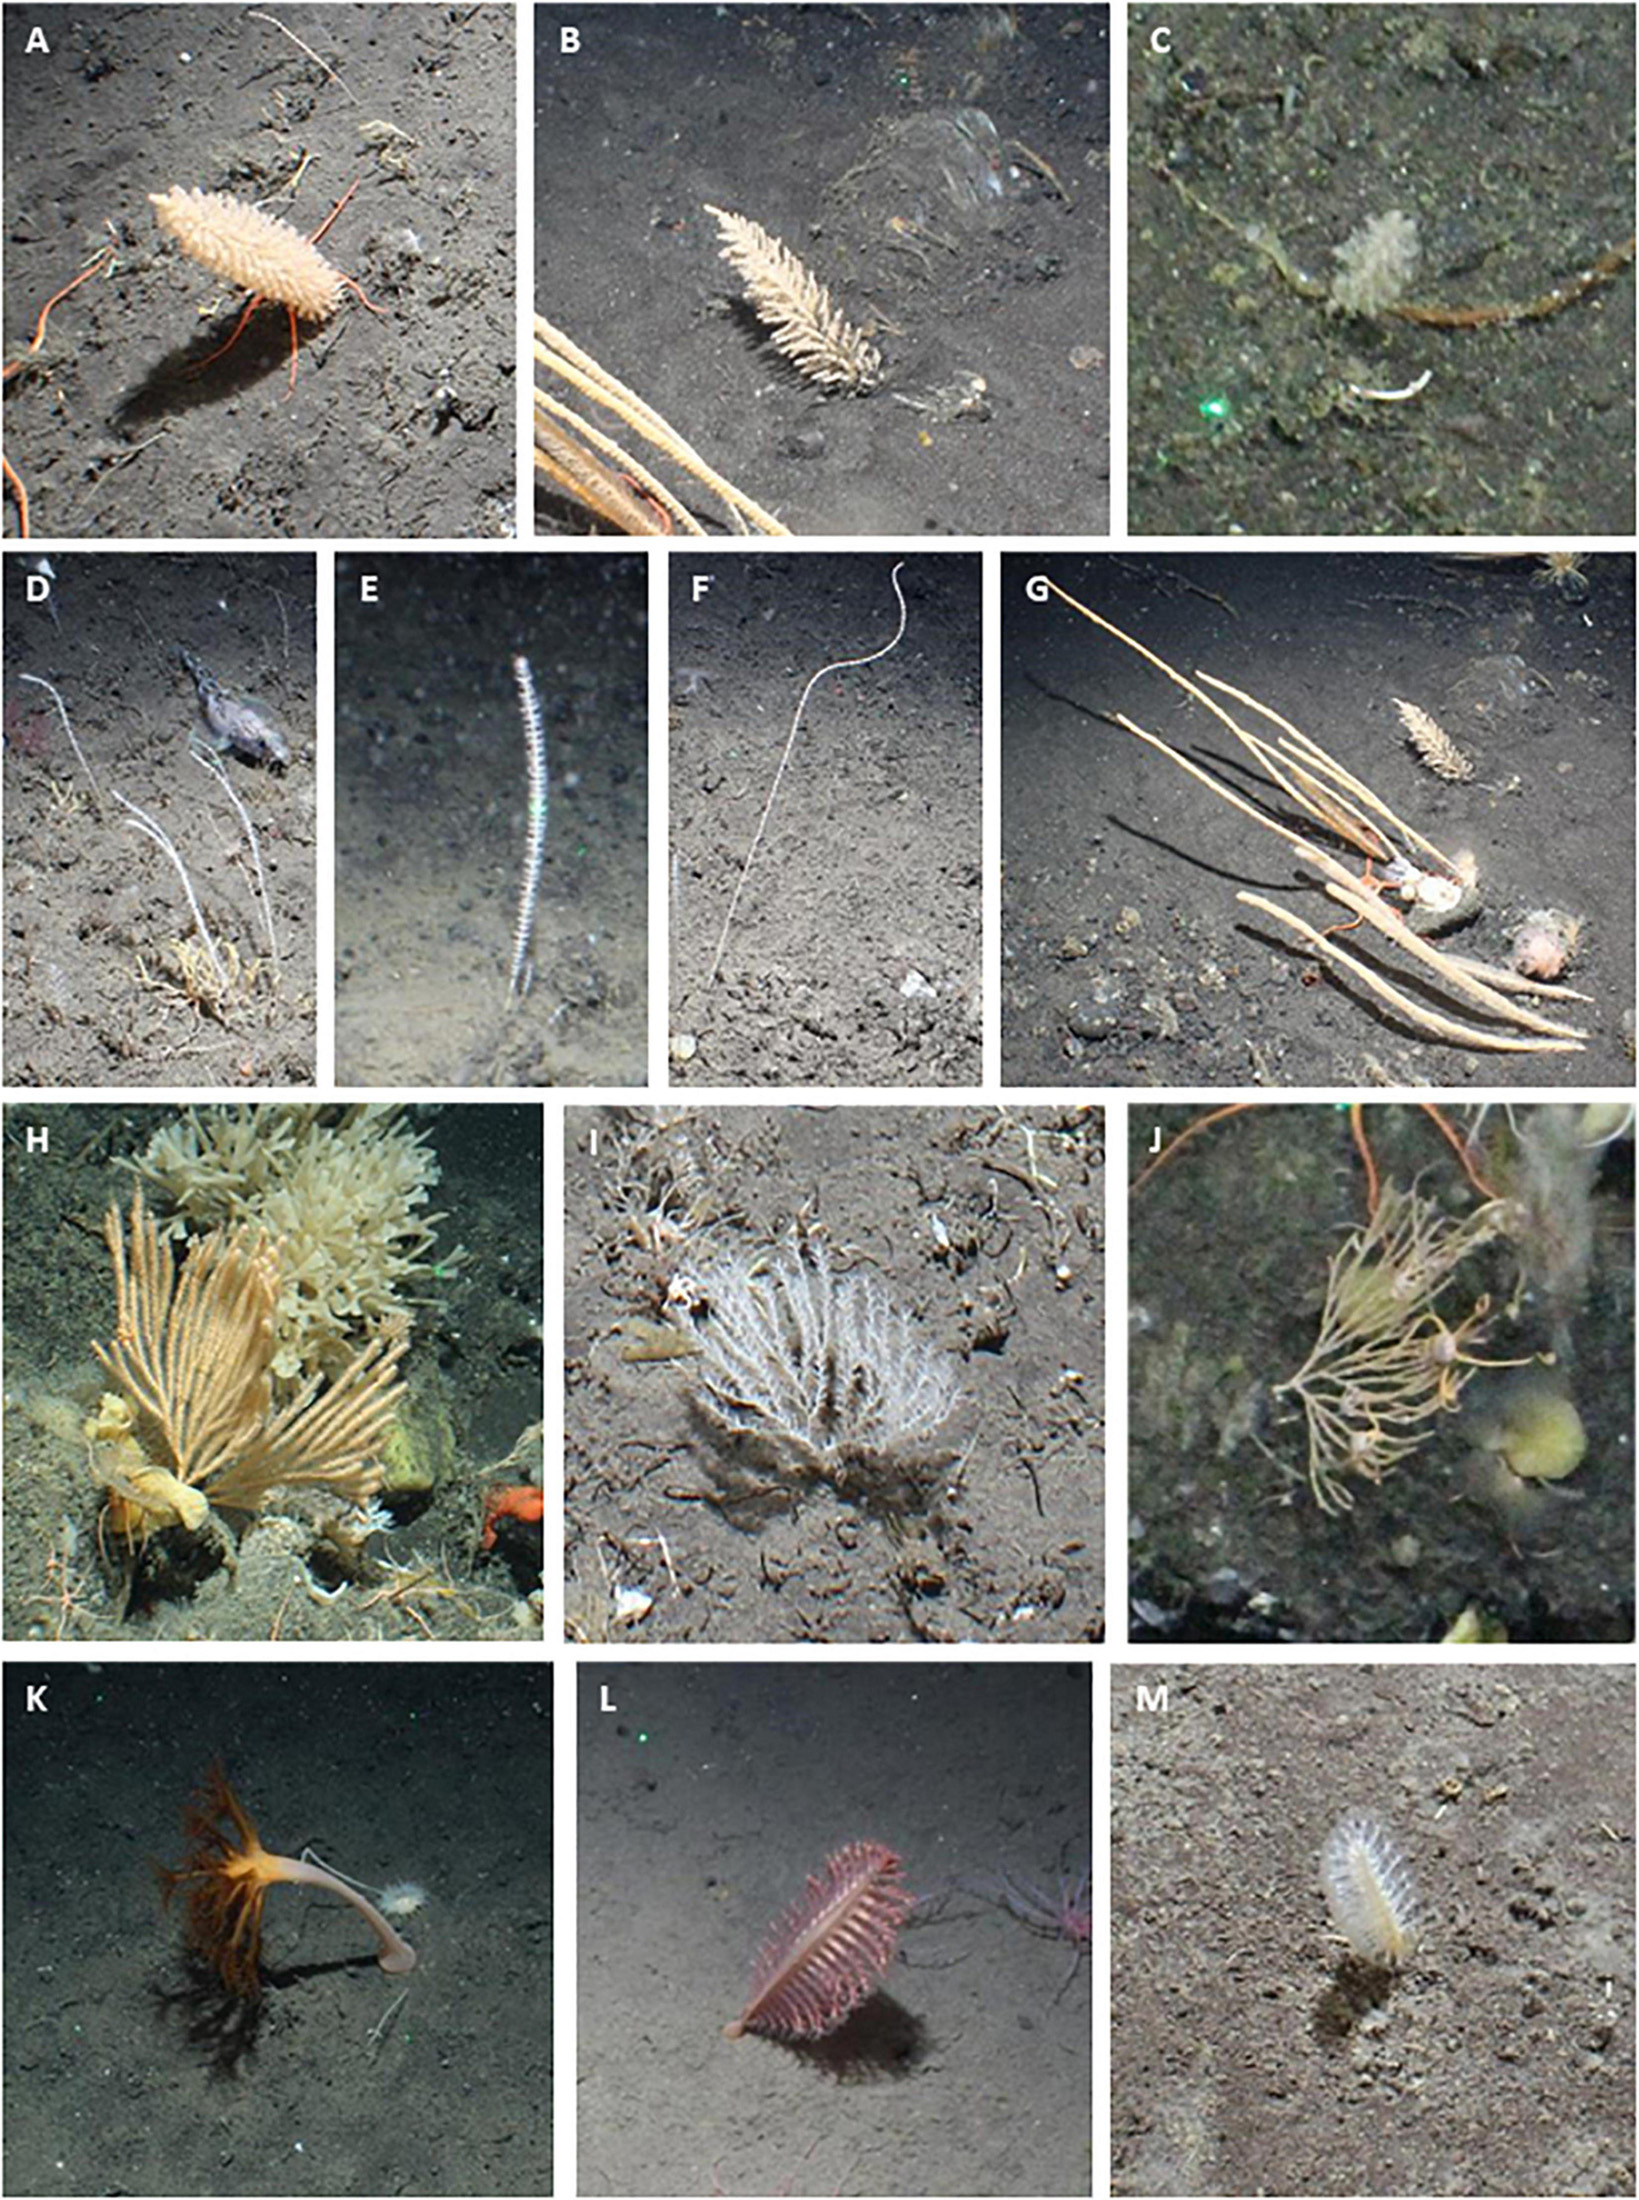
Figure 3. Photographs showing examples of selected VME indicator taxa observed at the South Sandwich Islands. (A–C) bottlebrush corals; (D–G) whip corals; (H–J) branching corals; (K) sea pen, Umbellula sp.; (L) sea pen, Pennatula sp.; (M) sea pen, Virgulariidae.
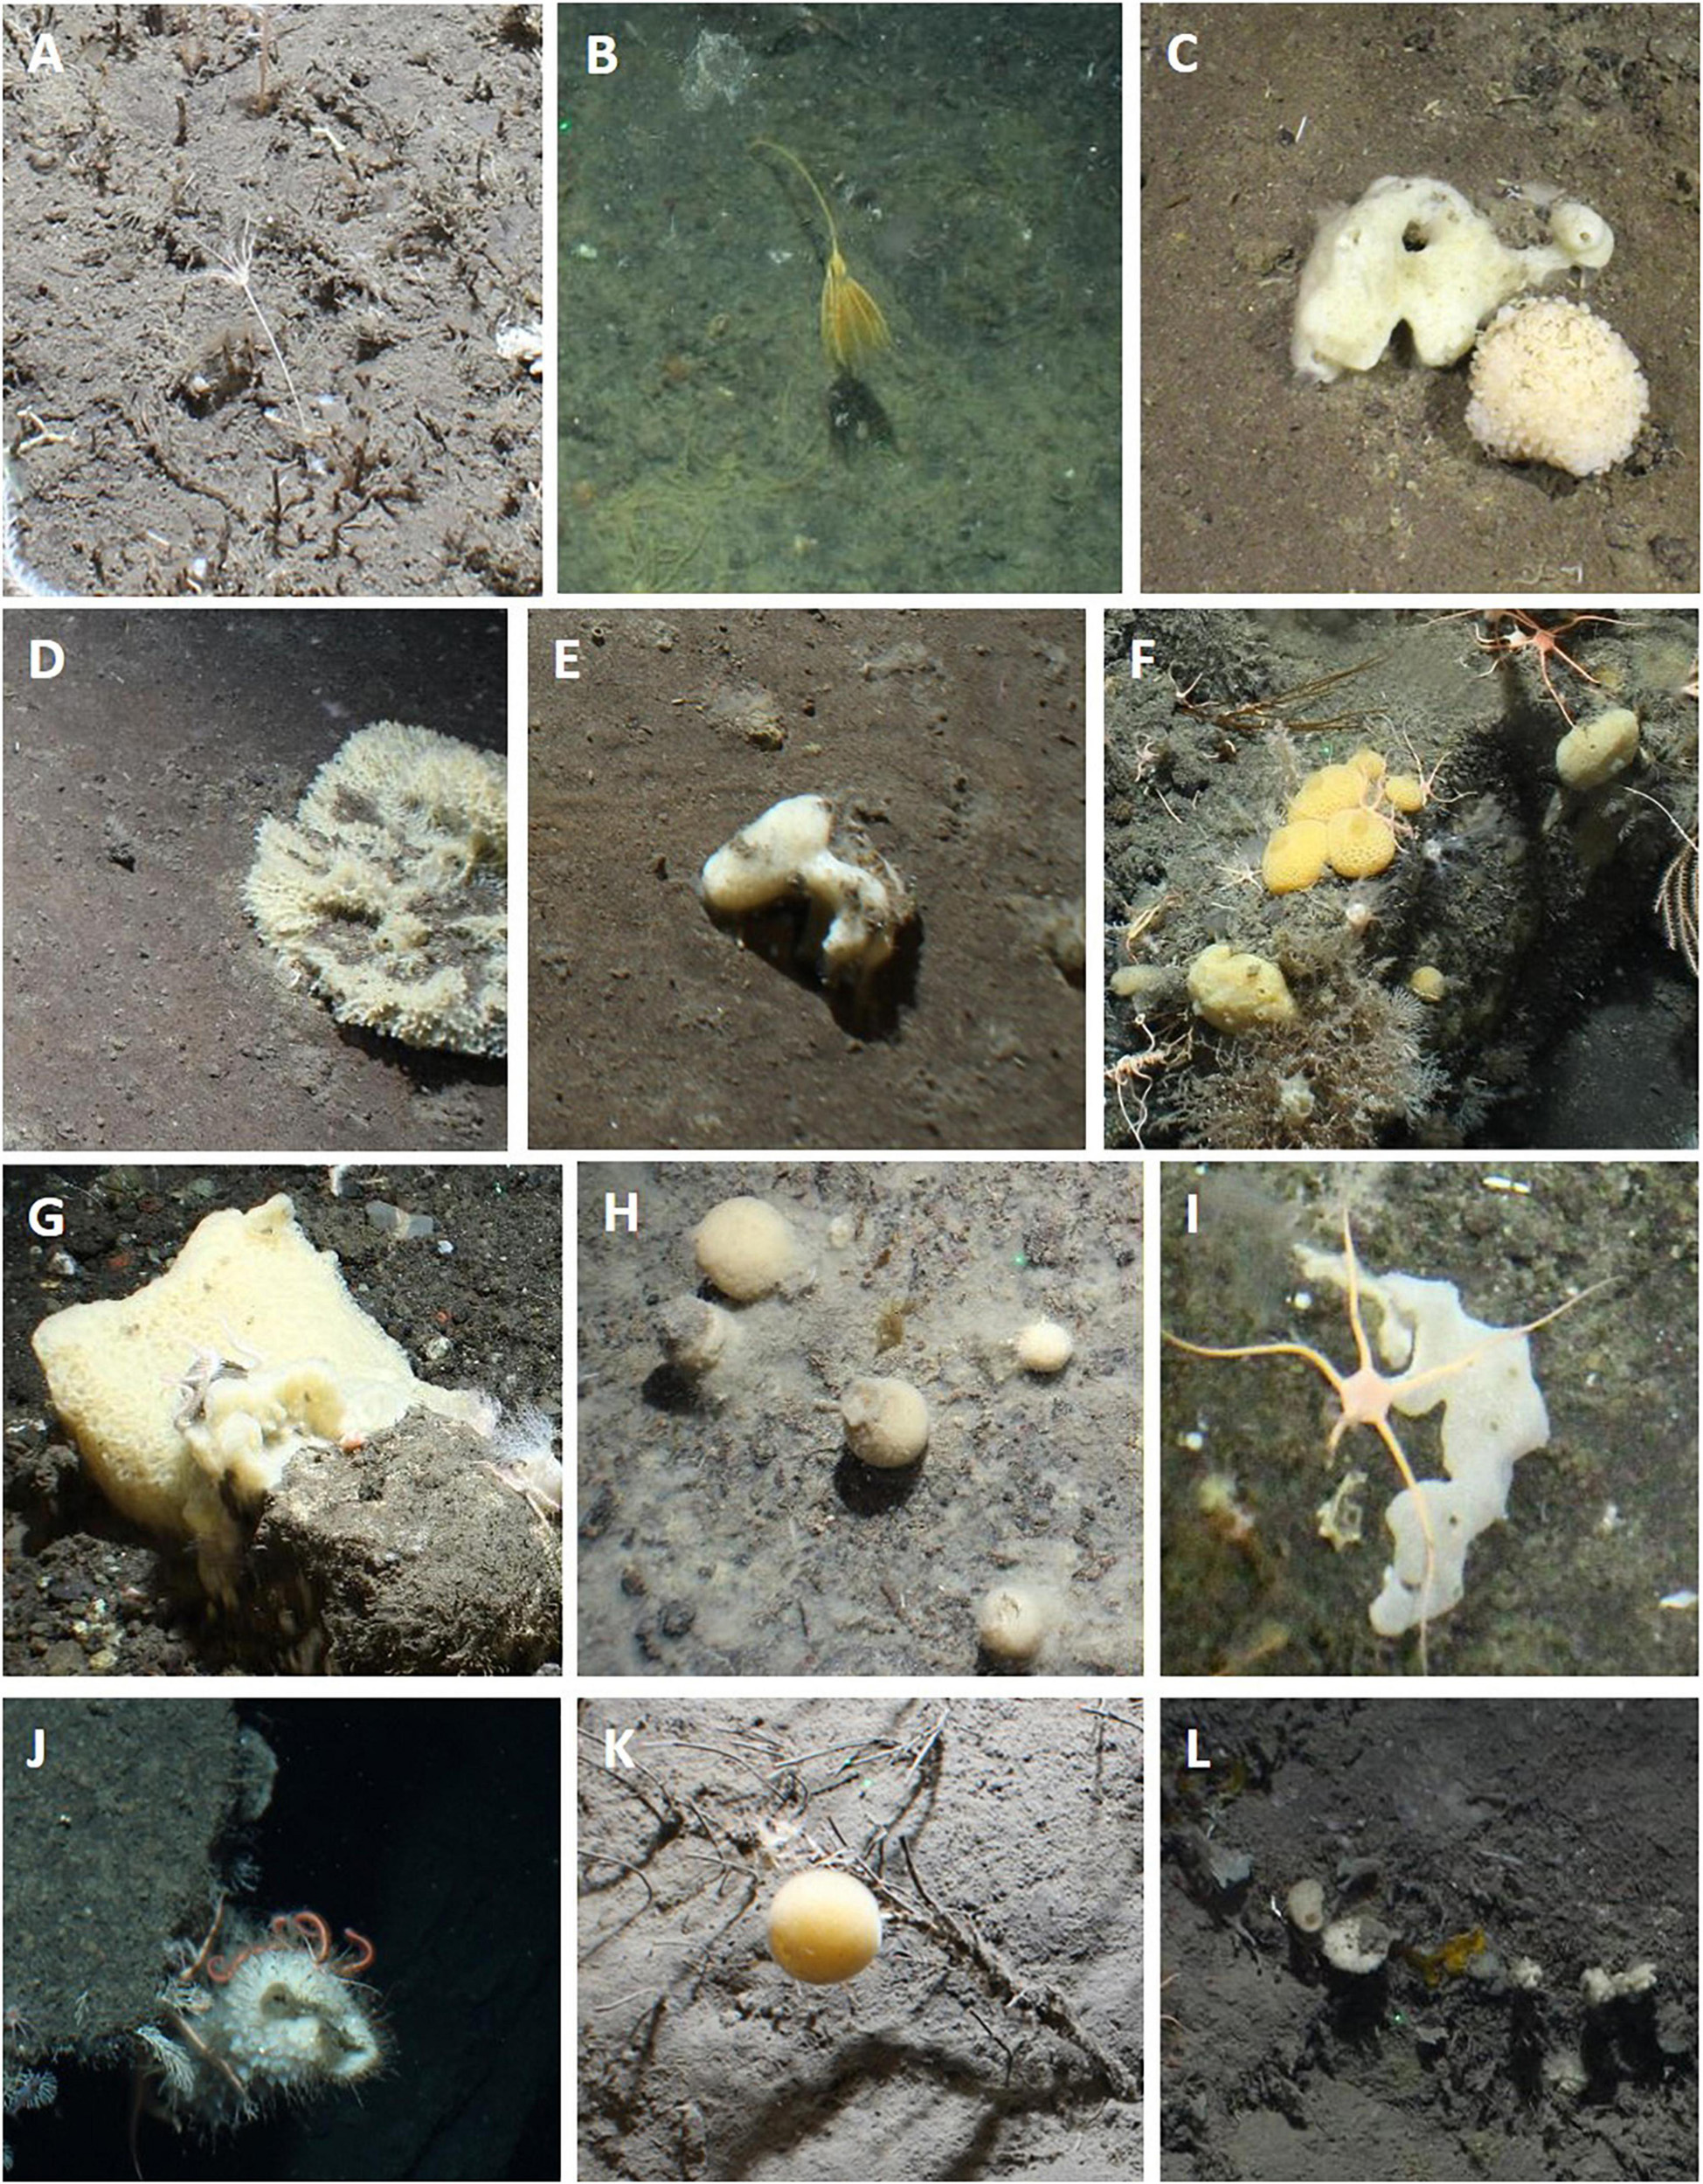
Figure 4. Photographs showing examples of selected VME indicator taxa observed at the South Sandwich Islands. (A,B) stalked crinoids; (C–L) sponges.
The most commonly observed were bottlebrush and whip morphologies of alcyonaceans and sponges. The vast majority of images including these taxa were collected at Zavodovski and Saunders Islands (Table 3). Porifera were also frequently observed together with the alcyonacean corals at the two northernmost islands but exhibited very low percent coverage. Porifera were less often observed in the middle and southern art of the archipelago, being present in 11 and 10% of all images at Zacodovski and Saunders Islands, respectively, but only in 1% of all images at both Montagu Island and Southern Thule. None were observed at Montagu Bank. Branching alcyonaceans, were less frequently encountered than the bottlebrush and whip morphotypes. The ratios of different coral morphotypes changed from the north to the south of the archipelago. At Zavodovski and Saunders Islands the majority of images containing corals included the bottlebrush (75 and 78% at Zavodovski and Saunders, respectively) and the whip (61 and 69%) morphotypes, whilst the branching morphotype was less common (20 and 7% of images). At Montagu Island and Bank occurrences of all corals were lower but with greater uniformity across the different morphotypes. The bottlebrush morphotype was present in 31 and 38%, the whip morphotype in 27 and 13% and branching morphotype in 42 and 50% of all images with corals present at Montagu Island and Bank, respectively. The branching morphotype was the dominant alcyonacean morphotype at Southern Thule, present in 89% of all images with corals present, whilst bottlebrush and whip morphologies were limited to 7 and 11%, respectively (Table 3). Sea pens were observed occasionally. The species of sea pen observed differed between the islands (Table 3). Stalked crinoids were only observed on two transects across the whole survey area. A white morphotype (Figure 4A) was observed in 3 images Saunders Island (at ∼290 m) and a yellow morphotype (Figure 4B) in one image at Montagu Bank (∼1,360 m; Table 3).
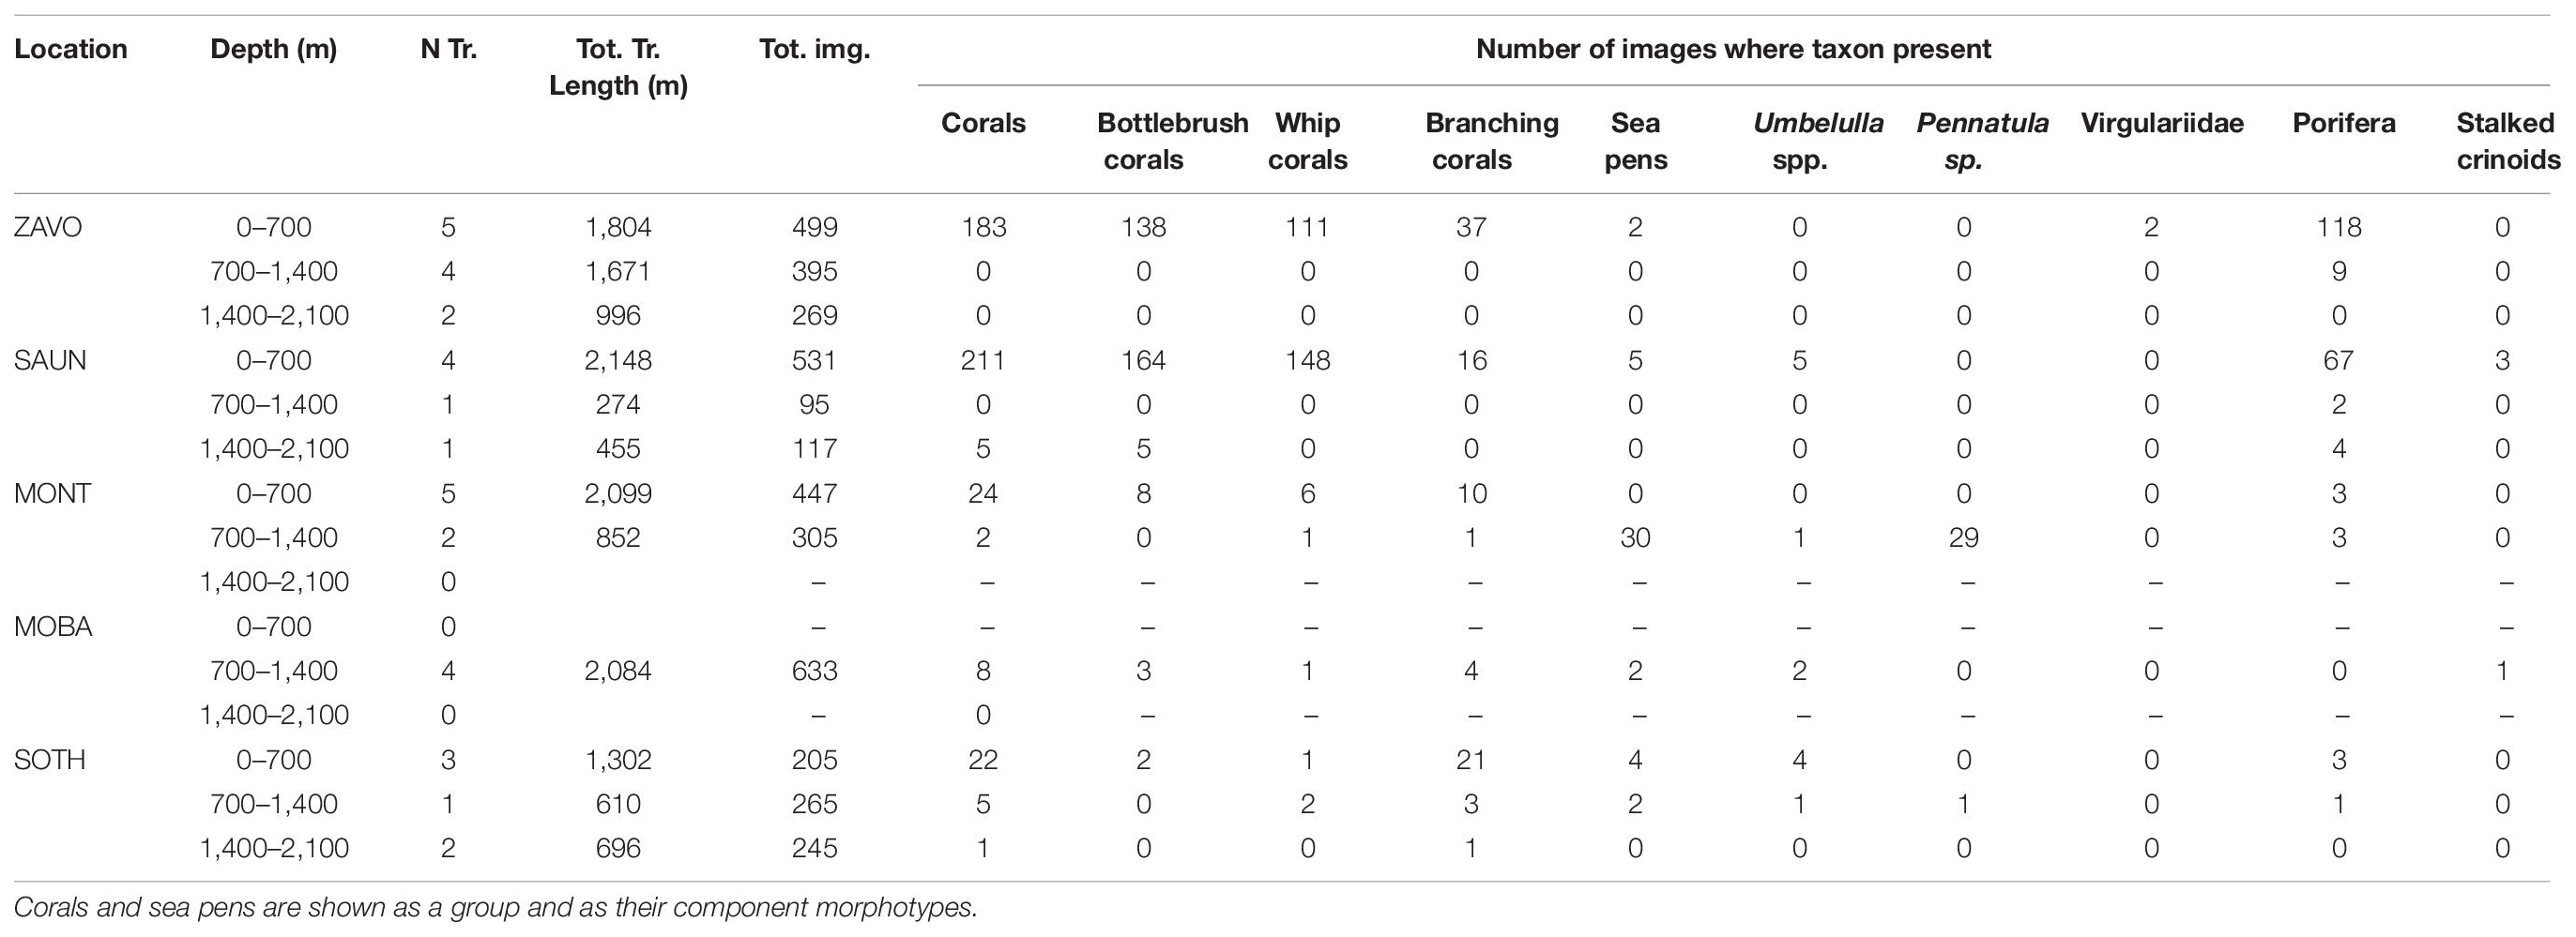
Table 3. Number and total length of transects, total number of images and number of images for which key VME indicator species were recorded at each study site by depth zone.
Although individual alcyonaceans and Porifera were observed down to ∼1,570 m, there was a tendency of alcyonaceans and Porifera to be more prevalent in shallower depths (<700 m, Table 3 and Figure 5A). These taxa were also more common on steeper slopes (Figure 5B), and from the middle to the top of the slopes of bathymetric elevations, particularly for the higher (≥50% images per object) prevalence class (Figure 6A). Similarly, the alcyonaceans and Porifera all occurred primarily in exposed conditions (exposure index > 1, Figure 6B). In all cases this was more prominent at Zavodovski Island, Saunders Island and Southern Thule than at Montagu Island.
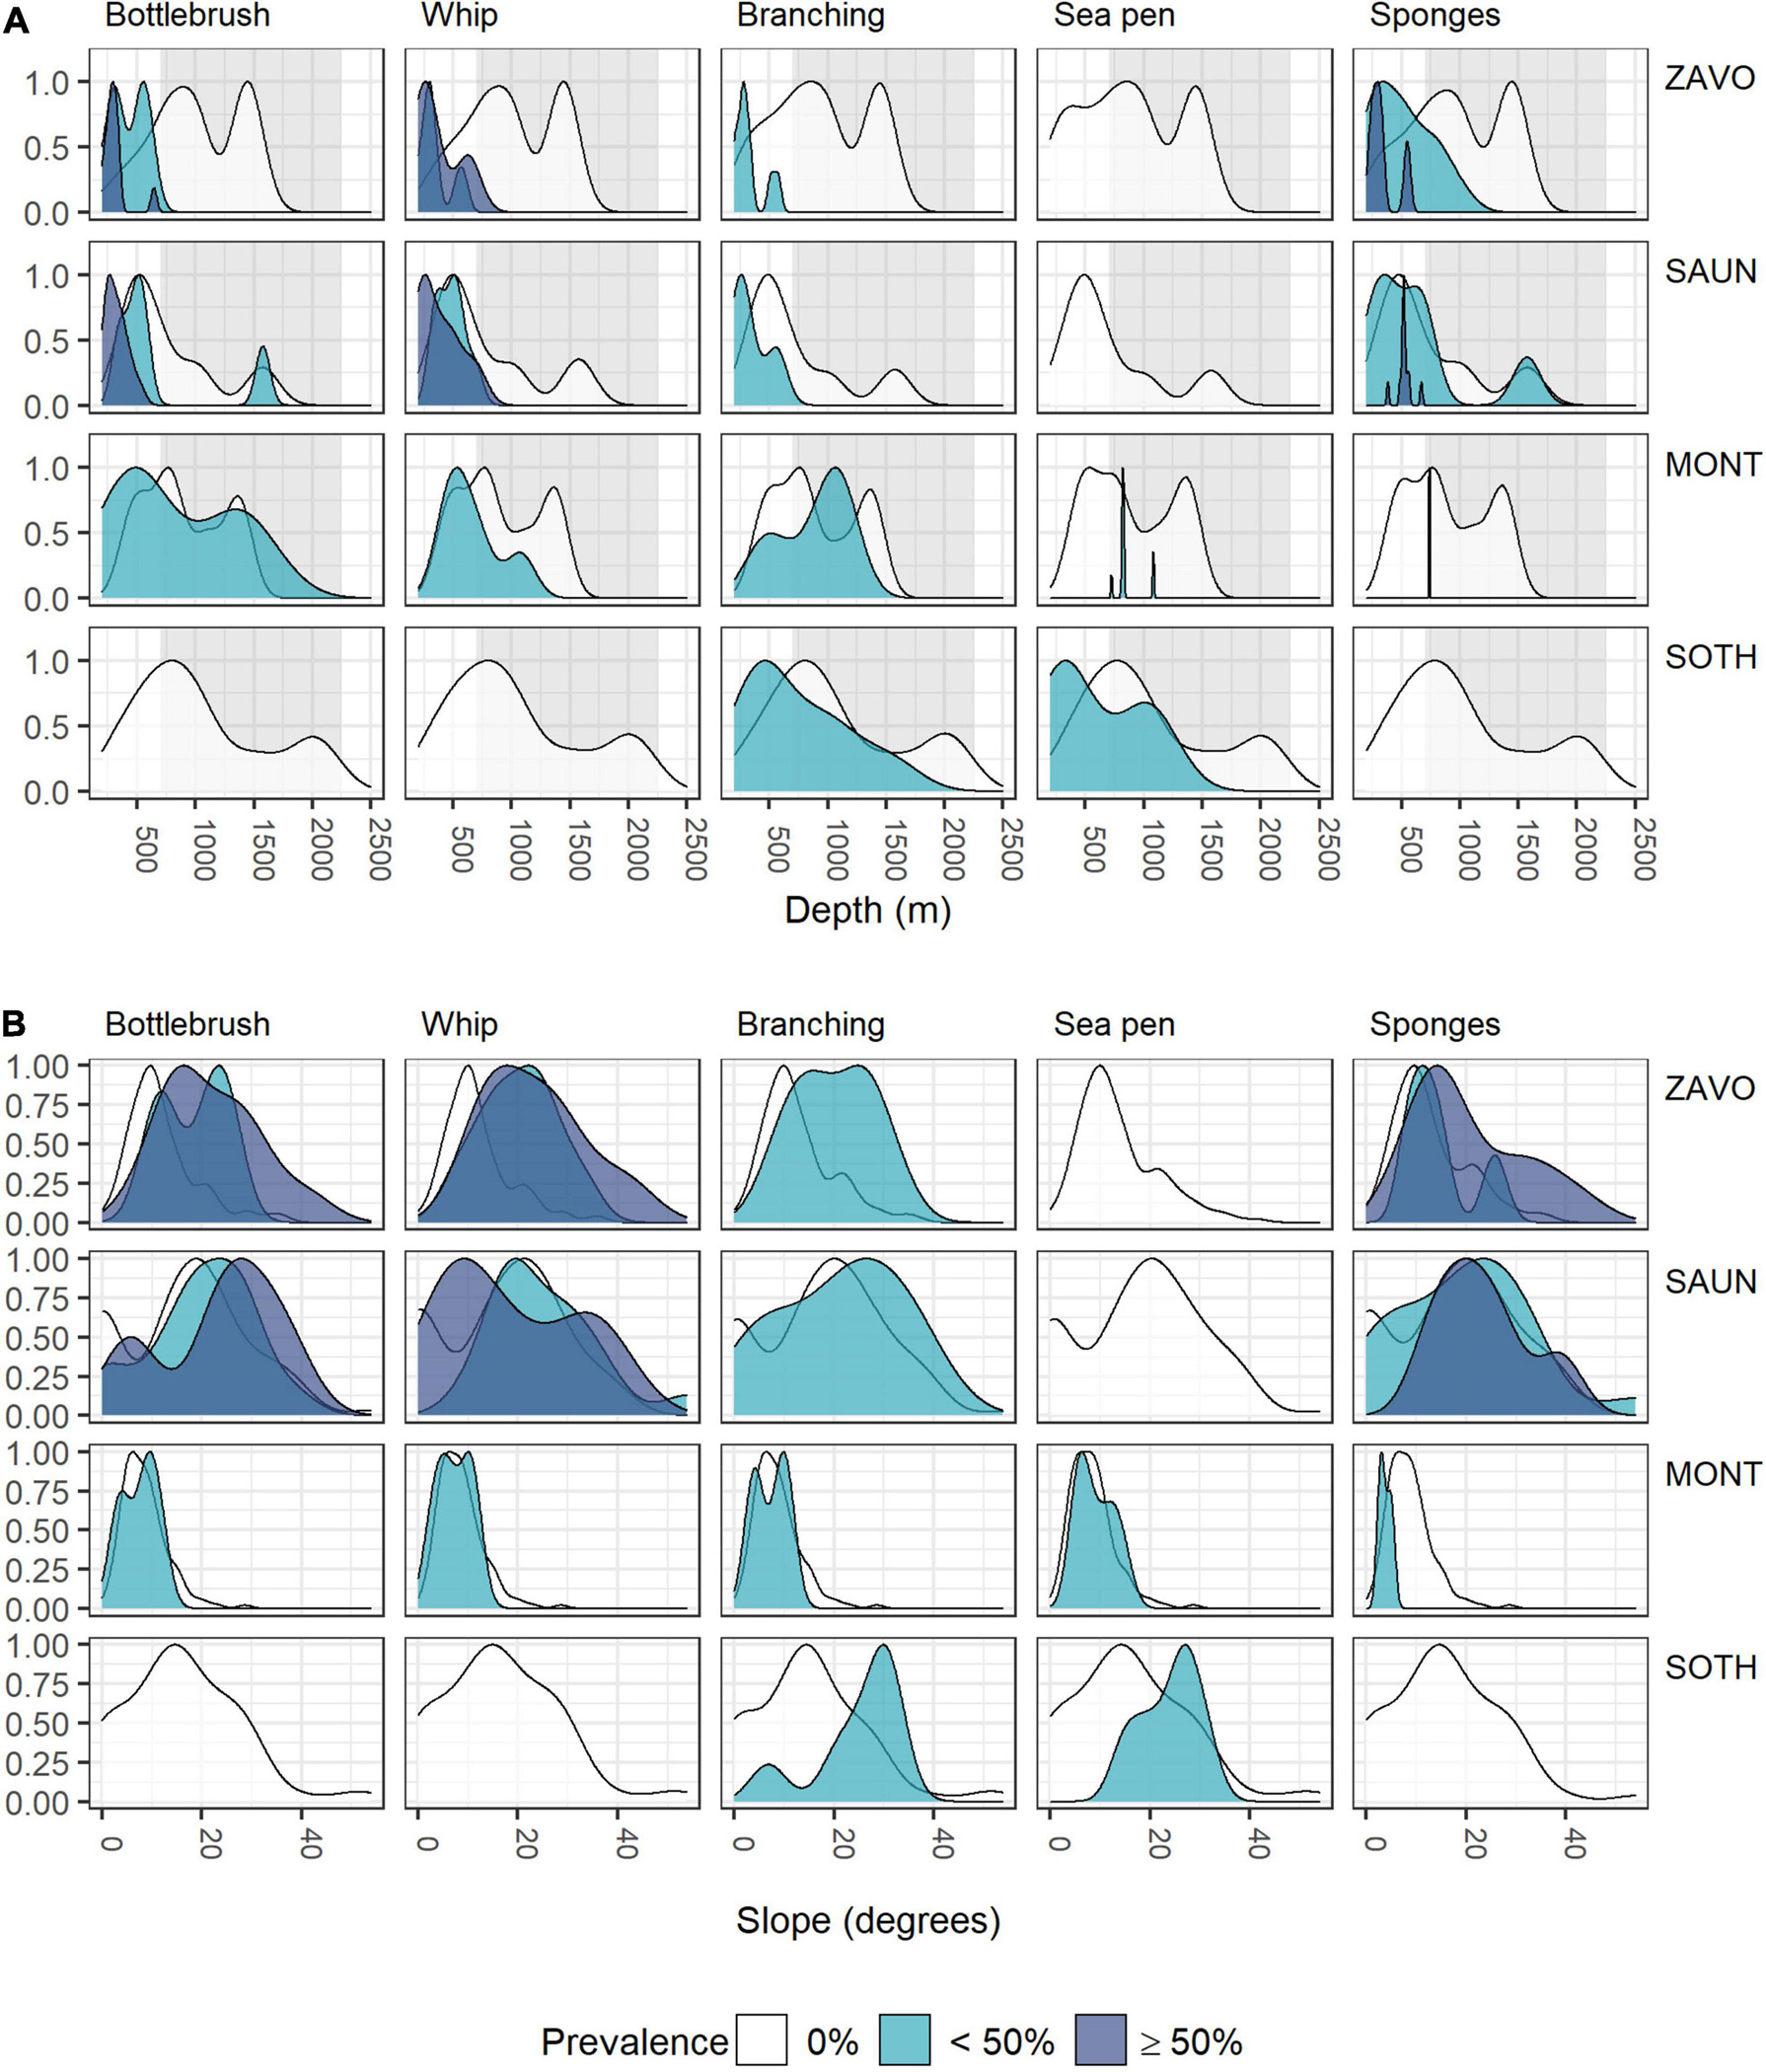
Figure 5. Scaled density curves showing the frequency of OBIA objects with 0, <50, or ≥50% prevalence of VME indicator taxa in intersecting images across the range of (A) depth, (B) slope.
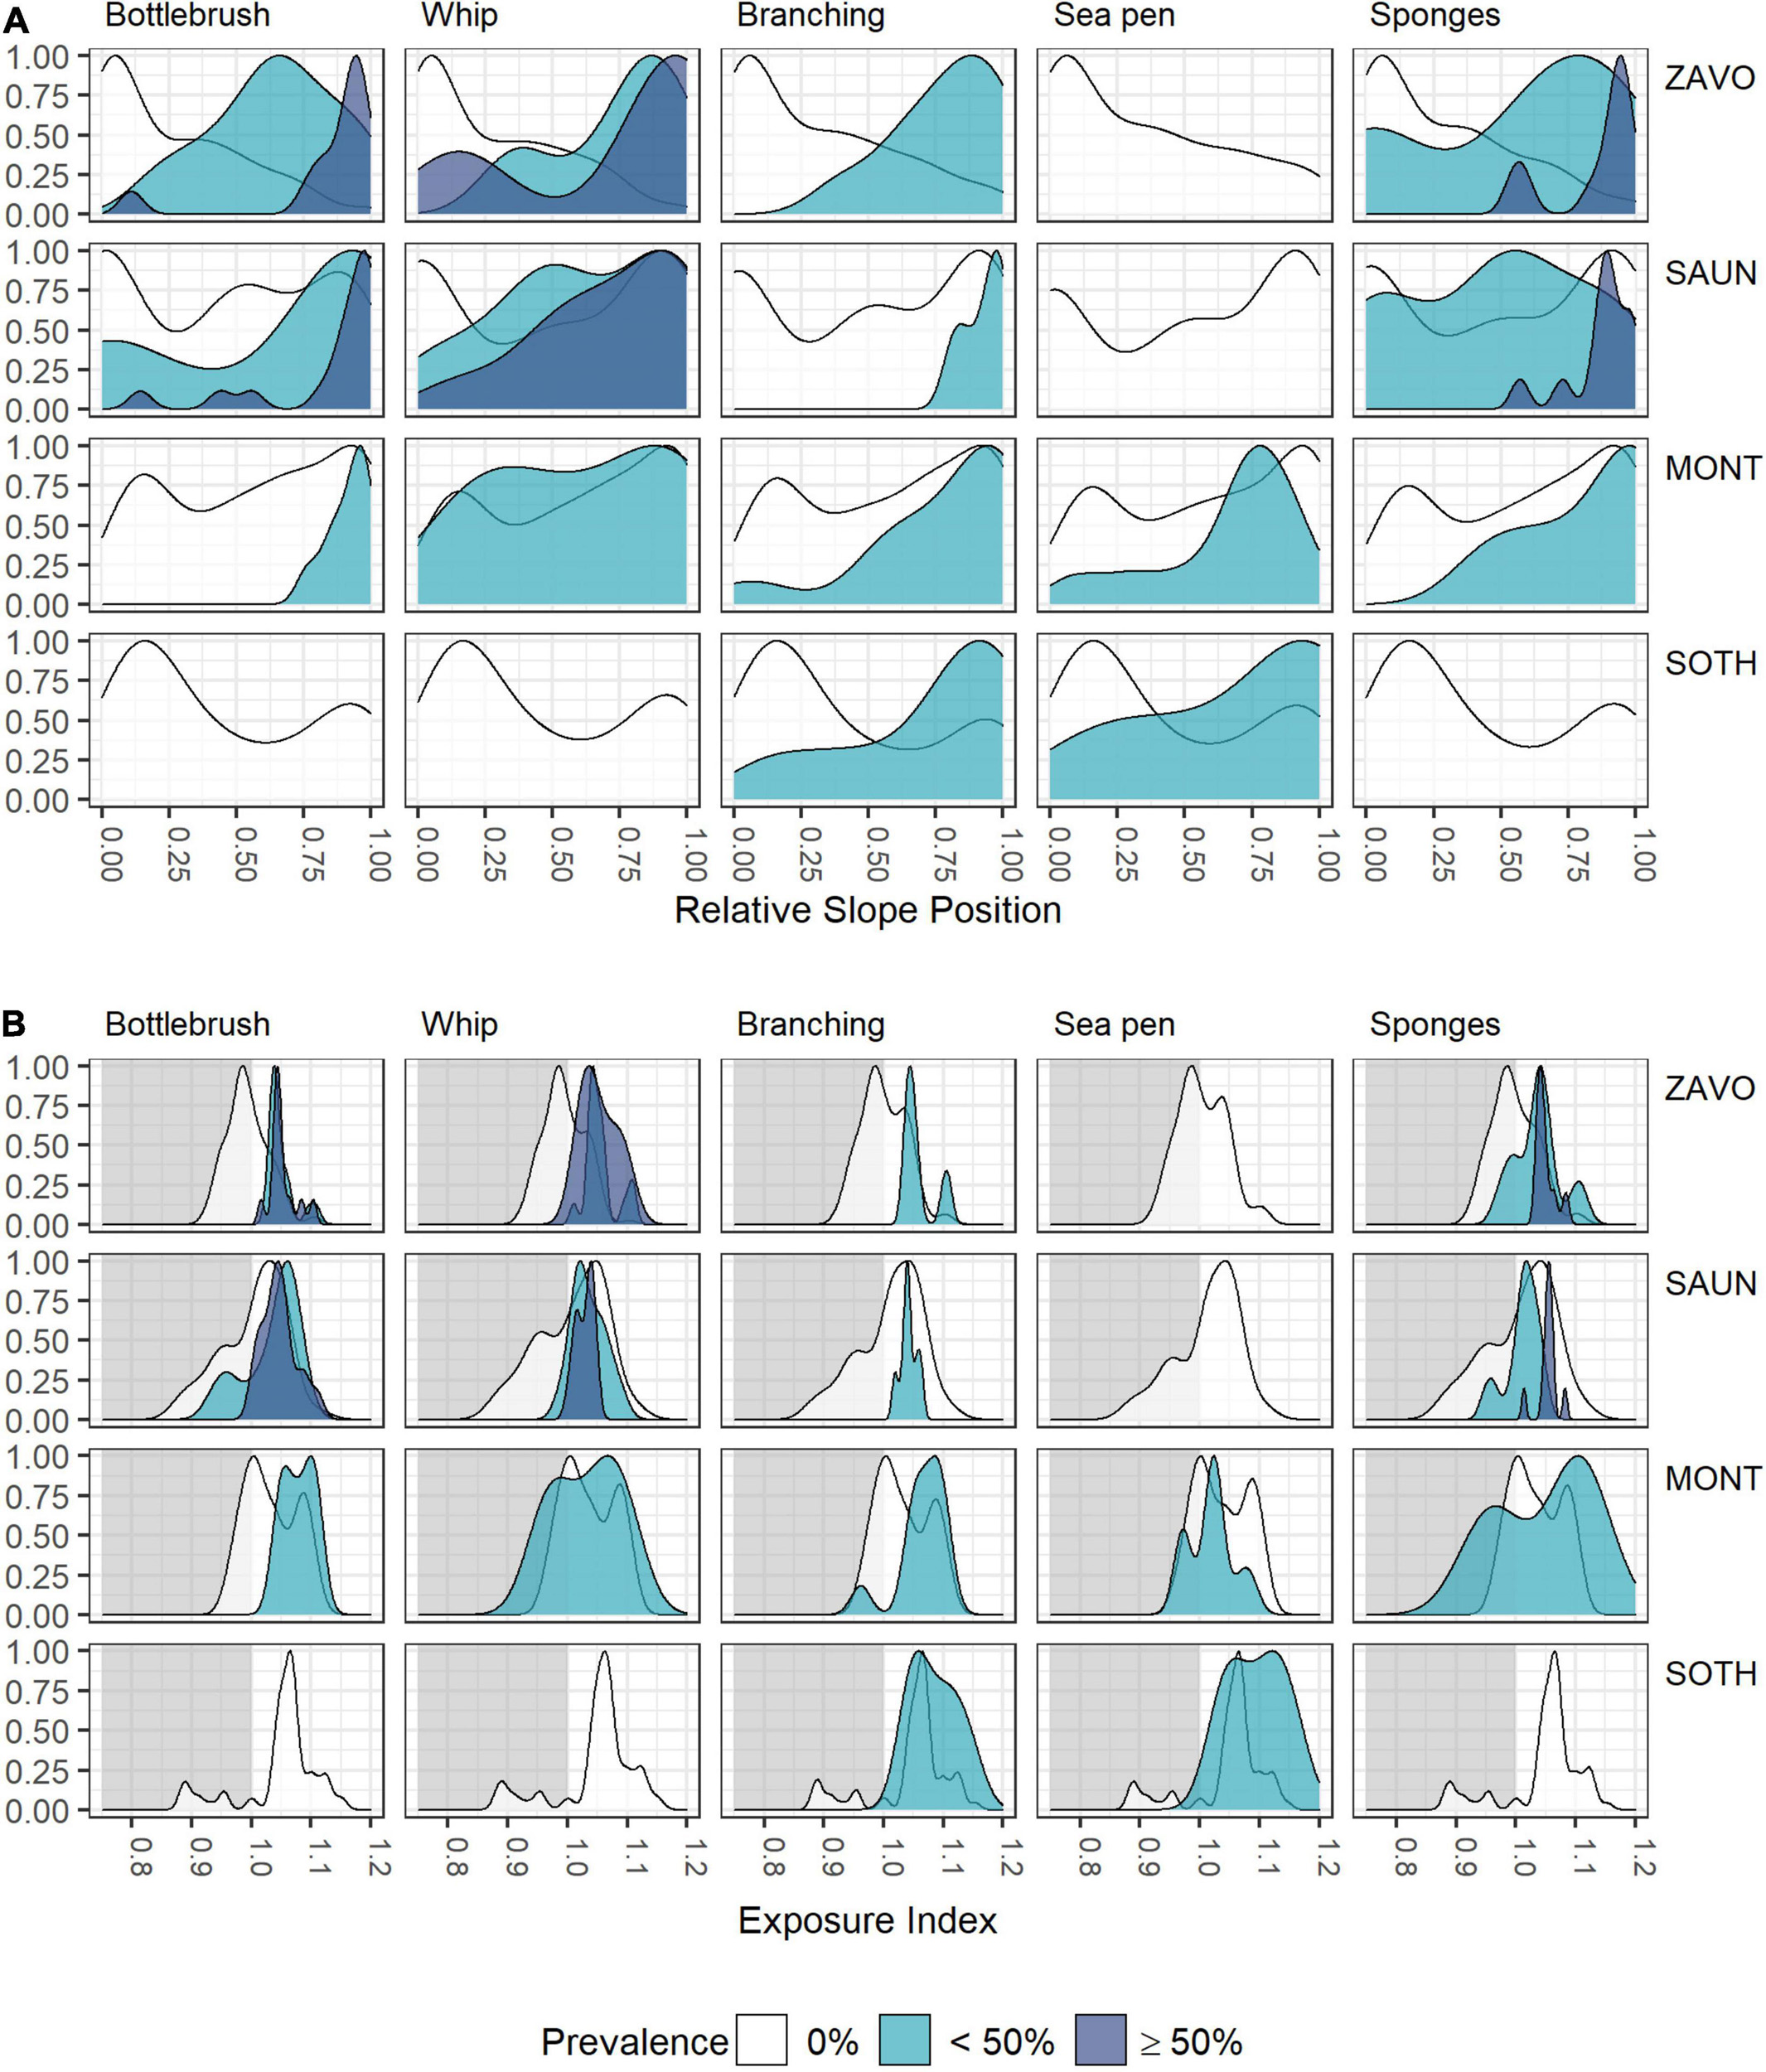
Figure 6. Scaled density curves showing the frequency of OBIA objects with 0, <50, or ≥50% prevalence of VME indicator taxa in intersecting images across the range of (A) Relative Slope Position and (B) Exposure Index.
Sea pens occurred in very few OBIA objects. The only exception was Montagu Island where a field of Pennatula spp. was encountered on one drop camera tow at ∼820 m depth. The deepest observation of Pennatula spp. was at Southern Thule at ∼1,050 m. Virgulariidae were observed at Zavodovski Island at ∼530 m depth, whilst Umbellula spp. were present at Saunders Island (∼240–380 m depth), Montagu Island and Montagu Bank (∼720 and ∼1,080 m, respectively) and Southern Thule (∼320 and ∼1,020 m). At Saunders and Montagu Islands, sea pens occurred in moderately sheltered to moderately exposed conditions, whereas observations at Southern Thule were from more exposed environments (Figure 6B).
Zavodovski and Saunders Islands had exposed hard substrate on their steeper flanks. In contrast, at Montagu Island and Bank, the drop camera transects generally crossed much more gently sloping terrain and consequently the bottom substrates largely consist of soft sediment. As a result, Alcyonaceans and sponges were scarce at the Montagu Island and Bank transects with bottlebrush and whip morphotypes, along with sponges, present in <10 of the area’s 147 objects. This sample size was too small to extrapolate distributions of bottlebrush and whip corals to the acoustic coverage at Montagu Bank. At Southern Thule there were very few observations of any of the VME indicator taxa altogether. Although branching Alcyonaceans were observed in 22 images, they were all located in just 6 out of 76 objects, whilst all other VME taxa were present in less. Consequently, no maps were extrapolated for Southern Thule. Maps representing the extent of habitats potentially suitable for Porifera and the bottlebrush and whip morphologies of Alcyonacea were produced only for Zavodovski and Saunders Islands. Branching Alcyonacea were mapped for Zavodovski, Saunders and Montagu Islands. Sea pens were frequent enough in OBIA objects to extrapolate to maps only for Montagu Island and Bank.
The map outputs illustrating the habitat suitable for different numbers of co-occurring VME indicator taxa across the acoustic survey coverage for Zavodovski Island, Saunders Island and Montagu Island and Bank are shown in Figures 7–9, respectively. Zavodovski Island has the steepest slopes and the largest area with overlapping suitable habitat for four VME indicator taxa. The habitat is largely contained above 700 m, and only a small proportion is identified as potentially suitable in the 700–2,250 m range where a fishery is permitted (Figure 7). At Saunders Island the habitat suitable for all four mapped VME indicator taxa is only present in small patches, but large areas are suitable for two VME indicator taxa (bottlebrush and whip Alcyonacean morphologies) and the potential habitat extension beyond observed depths is larger than at the other sites. Montagu Island and Bank see the least overlapping suitable habitat for VME indicator taxa, with small patches where corals and sponges overlap, whilst most of the area is mapped as suitable for branching corals or sea pens only. Although, sea pens were not present in enough objects to map potential suitable habitat at islands other than Montagu, observations of sea pens at all islands are presented as point locations in Figure 10, to illustrate the differing distribution of the sea pen species across the archipelago. Supplementary Figures 11–19 show the observed and predicted distributions of each VME indicator taxon in more detail.
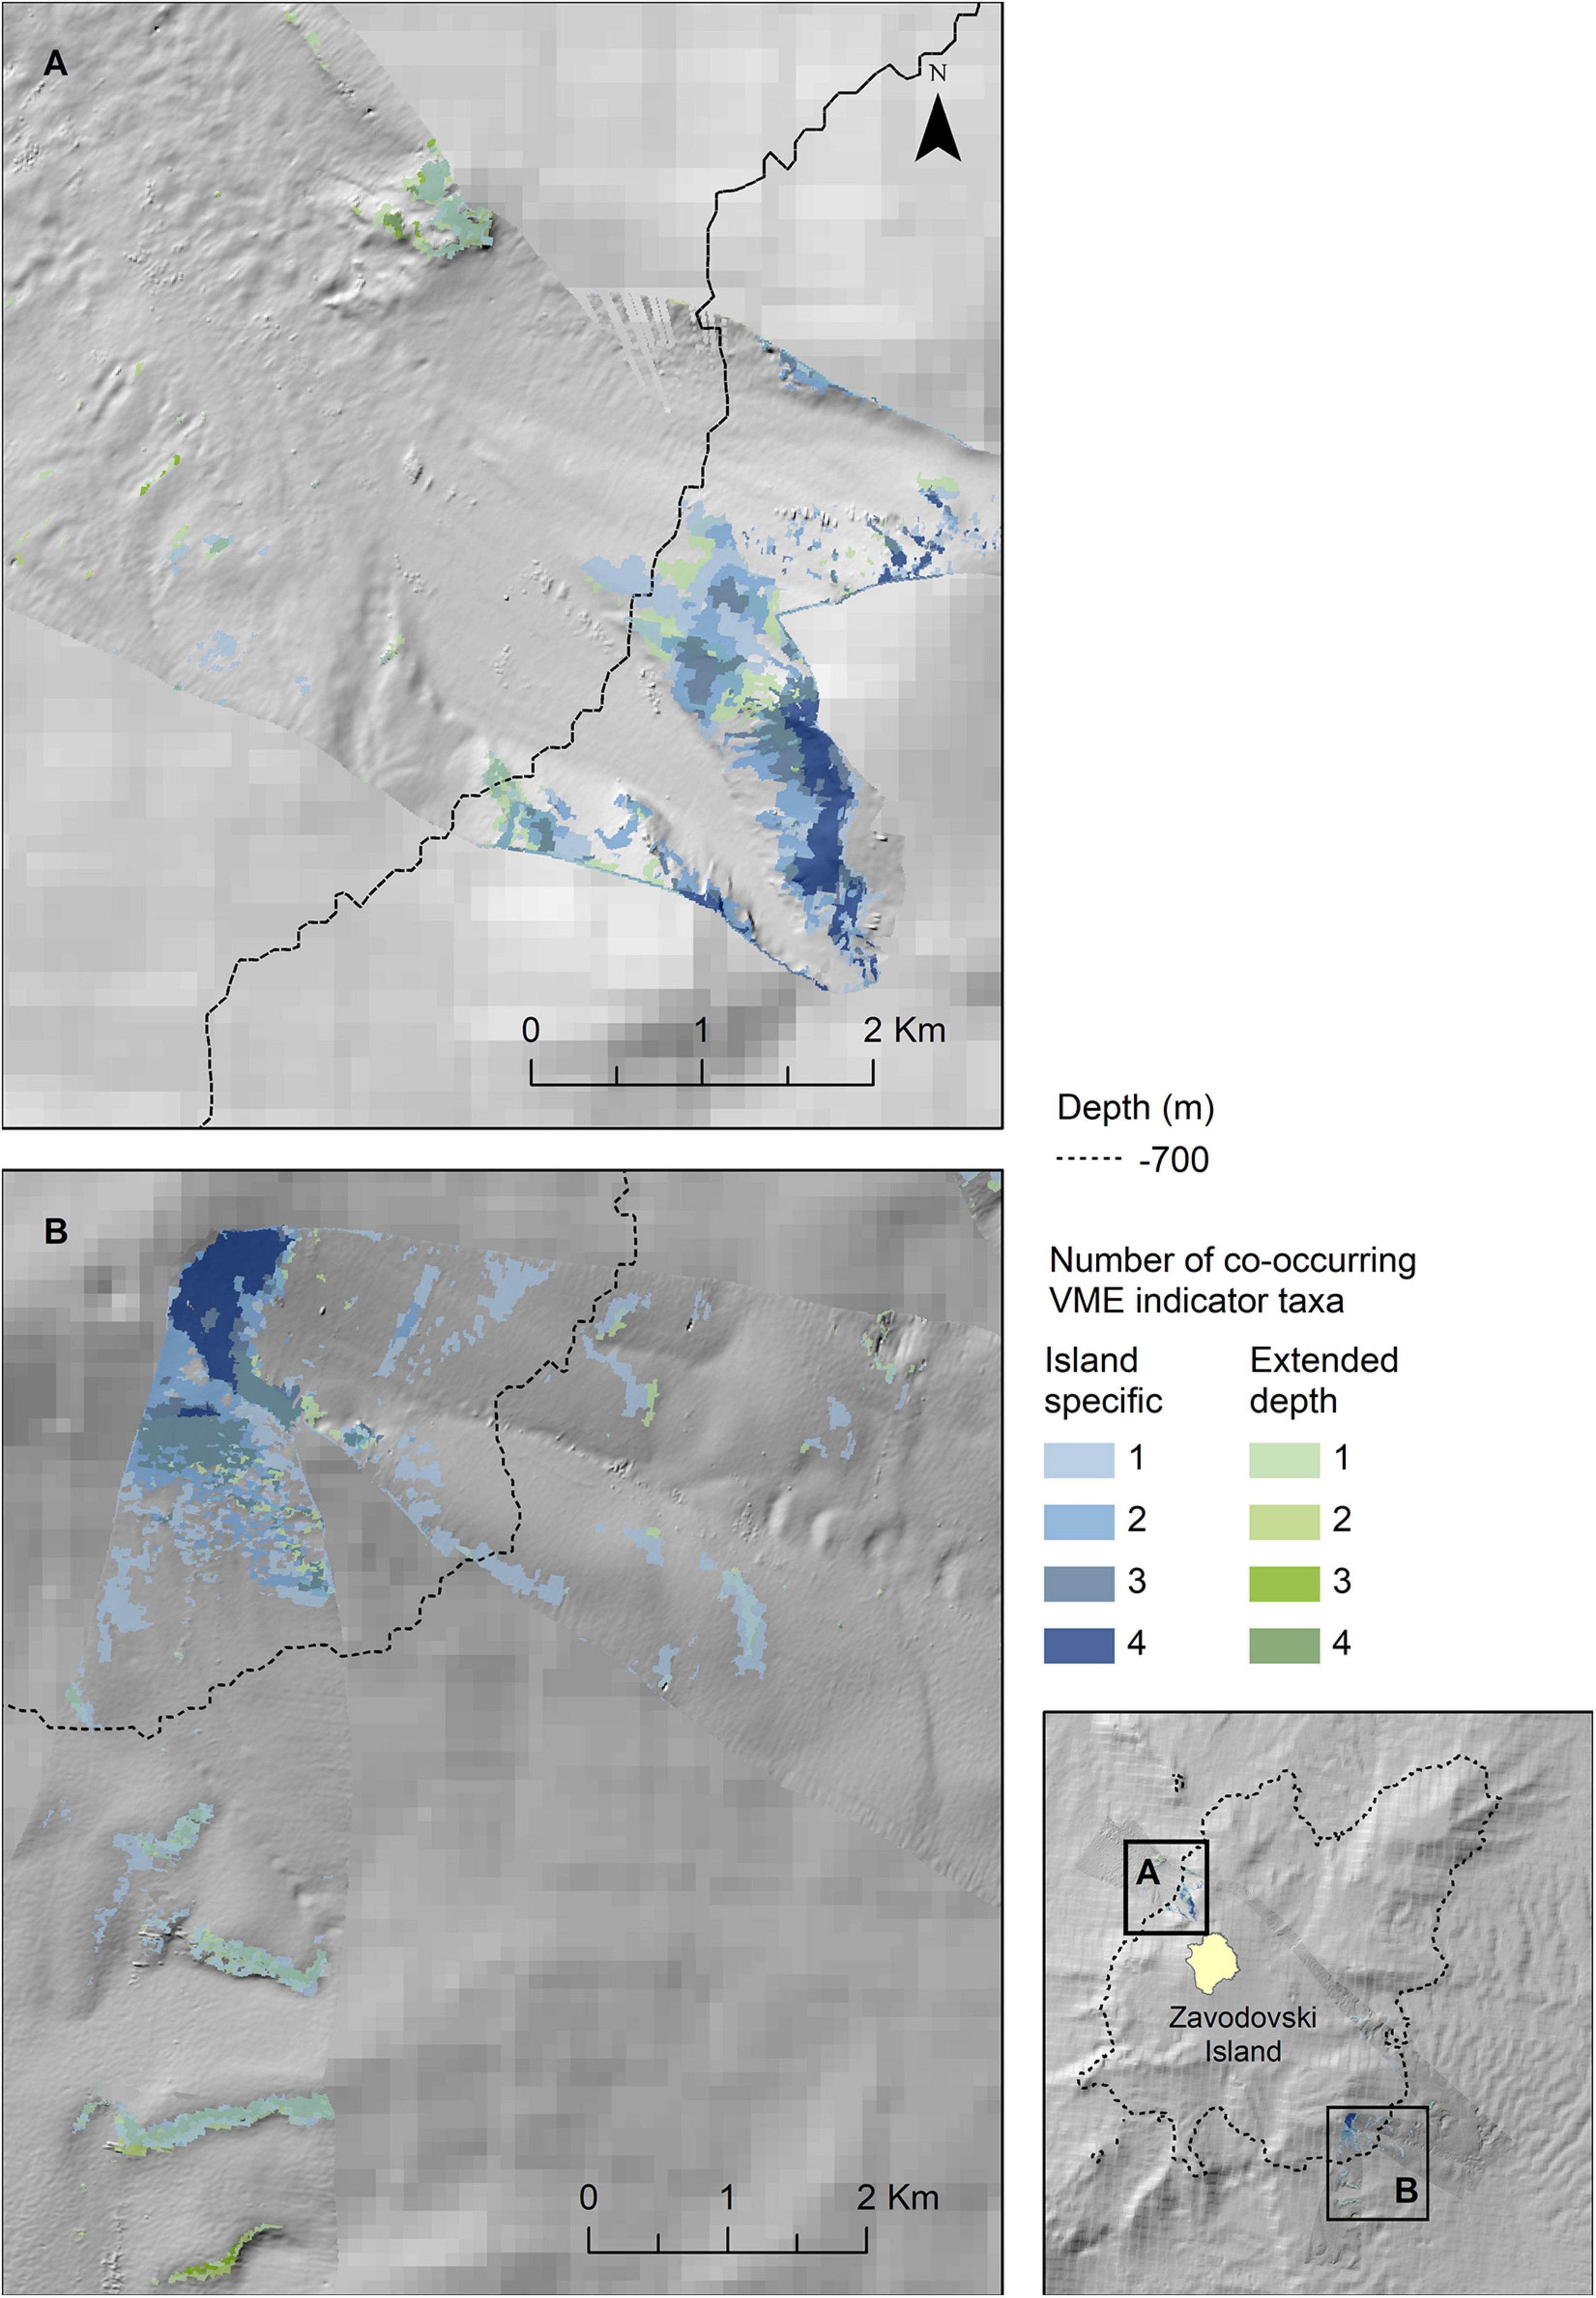
Figure 7. Extrapolated extent of potentially suitable habitat for VME indicator taxa in the two survey locations to the northwest (A) and southeast (B) of Zavodovski Island. Shown values refer to the number of VME indicator taxa (bottlebrush corals, branching corals, whip corals and sponges) for which suitable habitat is likely to co-occur. Blue colours indicate the extent within observed depth limit for this location, green colours indicate topographically suitable habitat present beyond the observed depth. High resolution bathymetry from DY99 is shown overlain on the South Sandwich Islands bathymetry compilation by Leat et al. (2014).
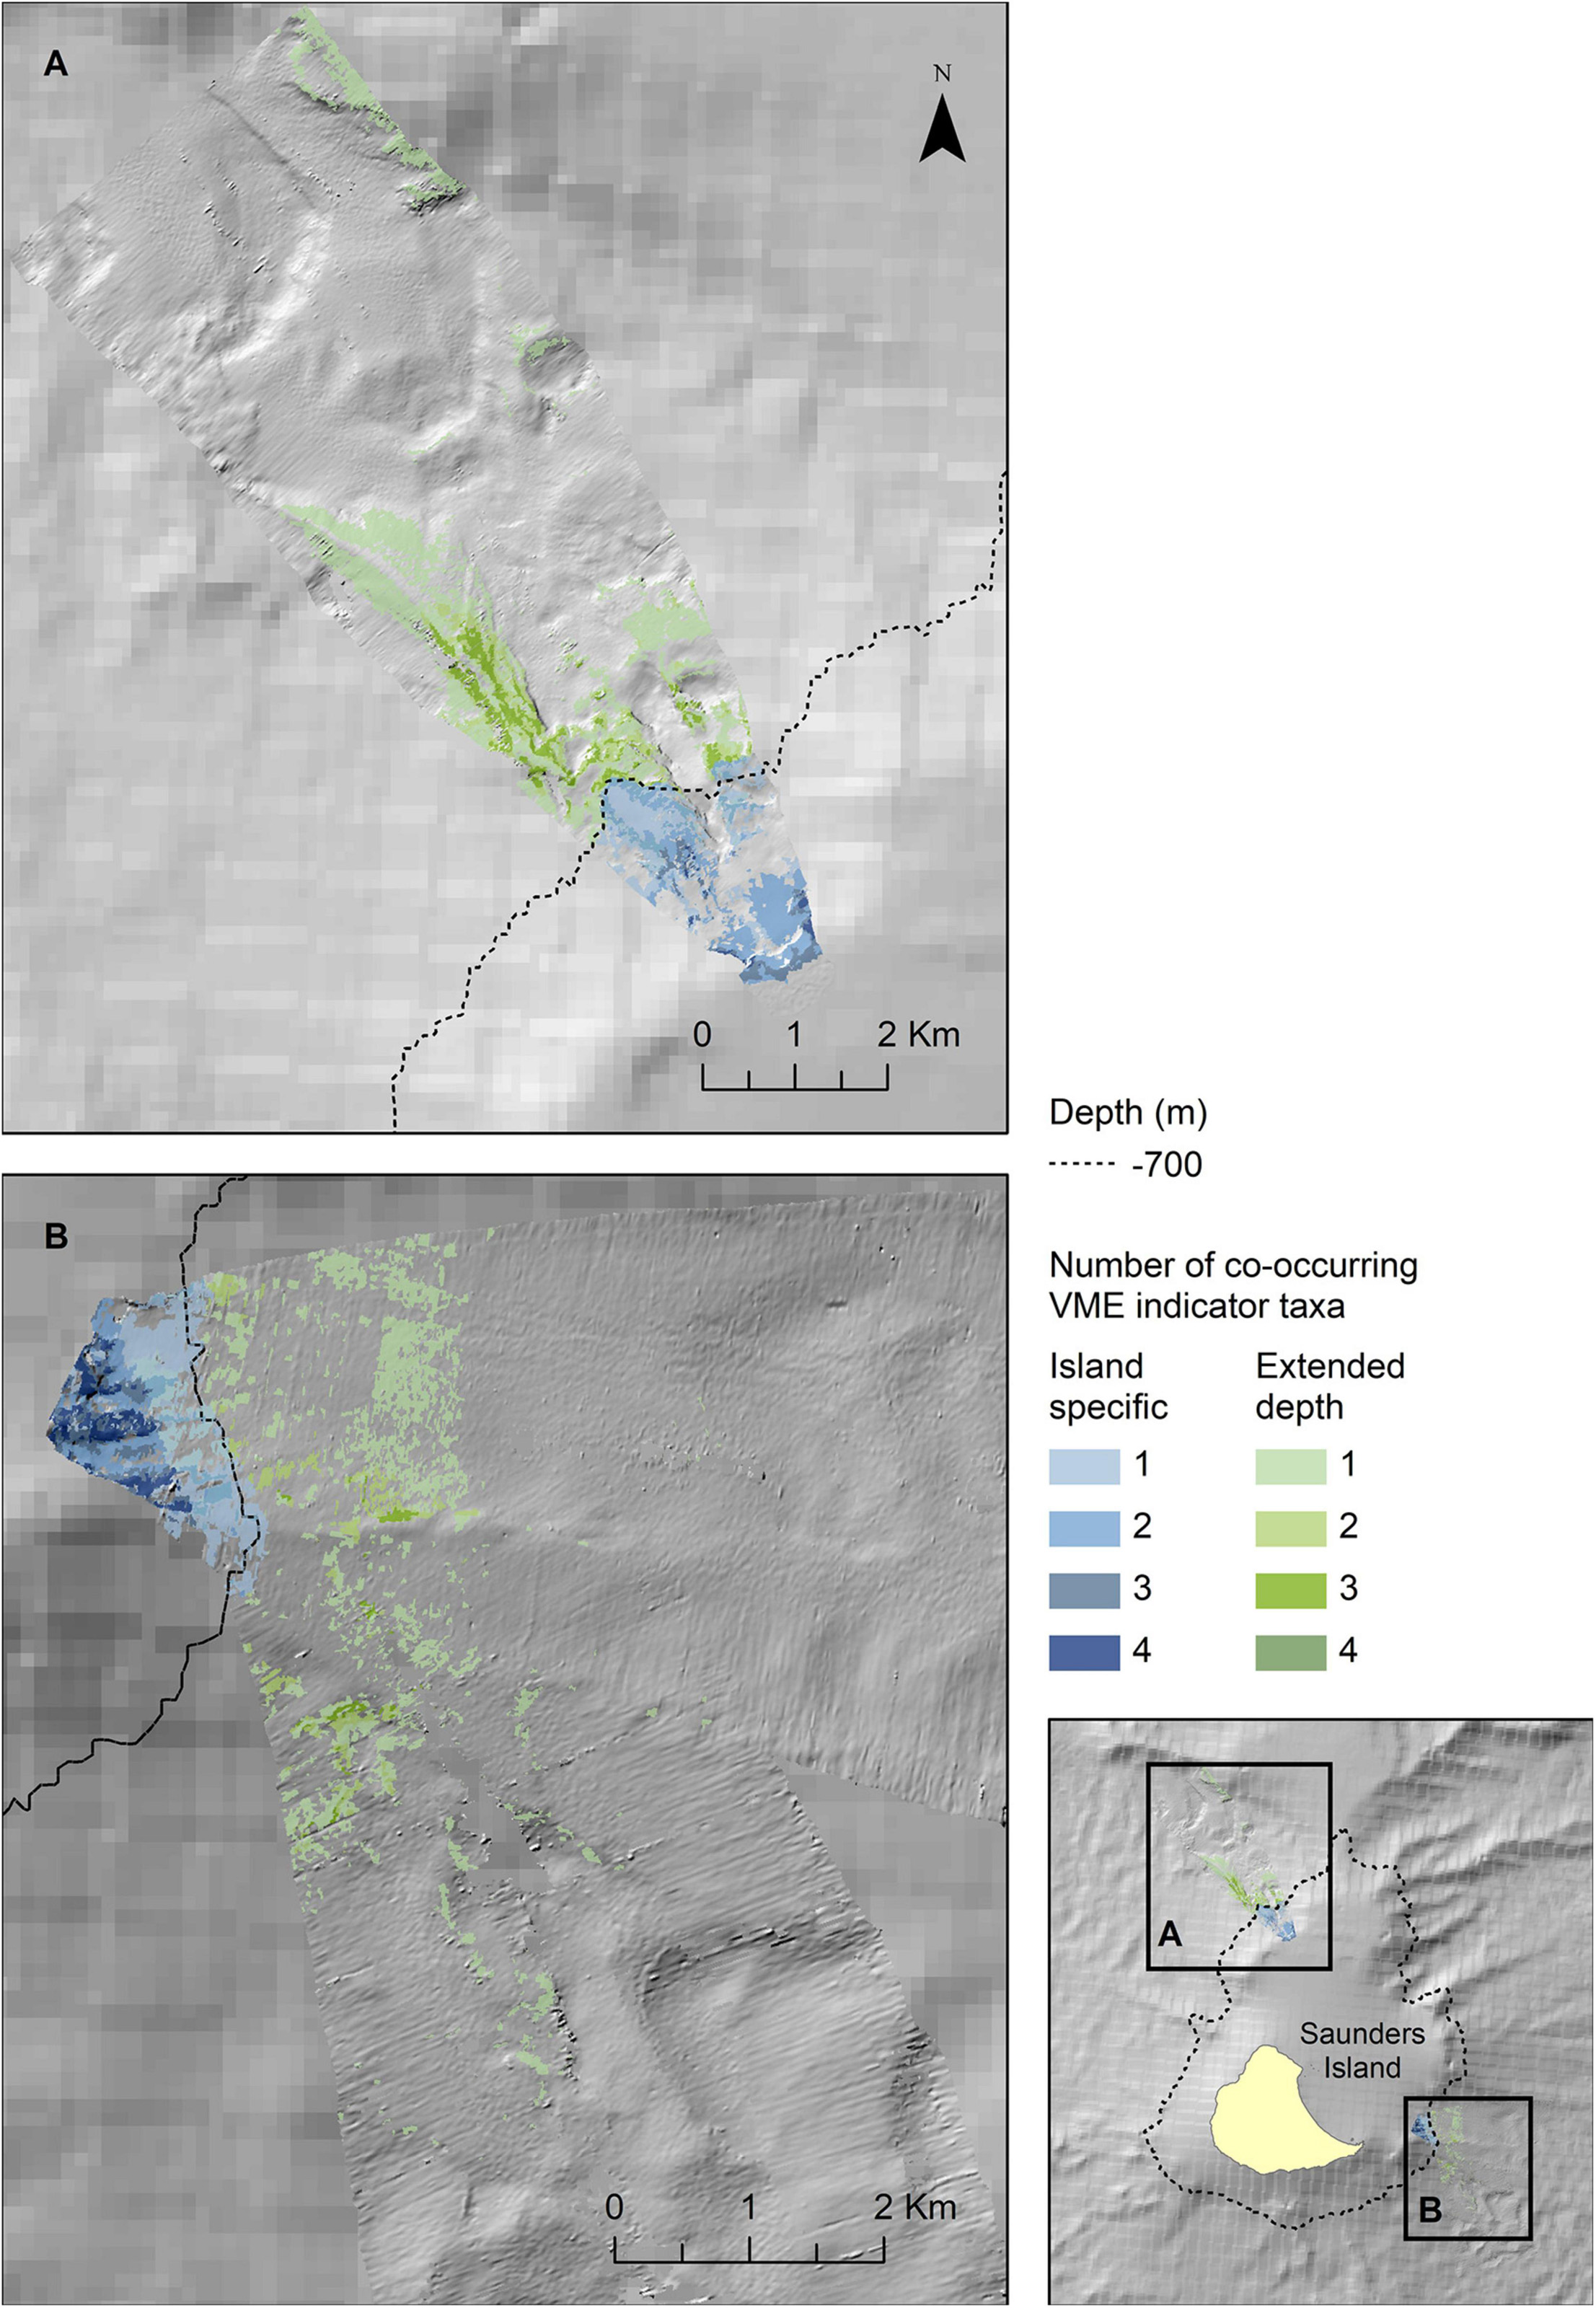
Figure 8. Extrapolated extent of potential ly suitable habitat for VME indicator taxa in the two survey locations to the northwest (A) and southeast (B) of Saunders Island. Shown values refer to the number of VME indicator taxa (bottlebrush corals, branching corals, whip corals and sponges) for which suitable habitat is likely to co-occur. Blue colours indicate the extent within observed depth limit for this location, green colours indicate topographically suitable habitat present beyond the observed depth. High resolution bathymetry from DY99 is shown overlain on the South Sandwich Islands bathymetry compilation by Leat et al. (2014).
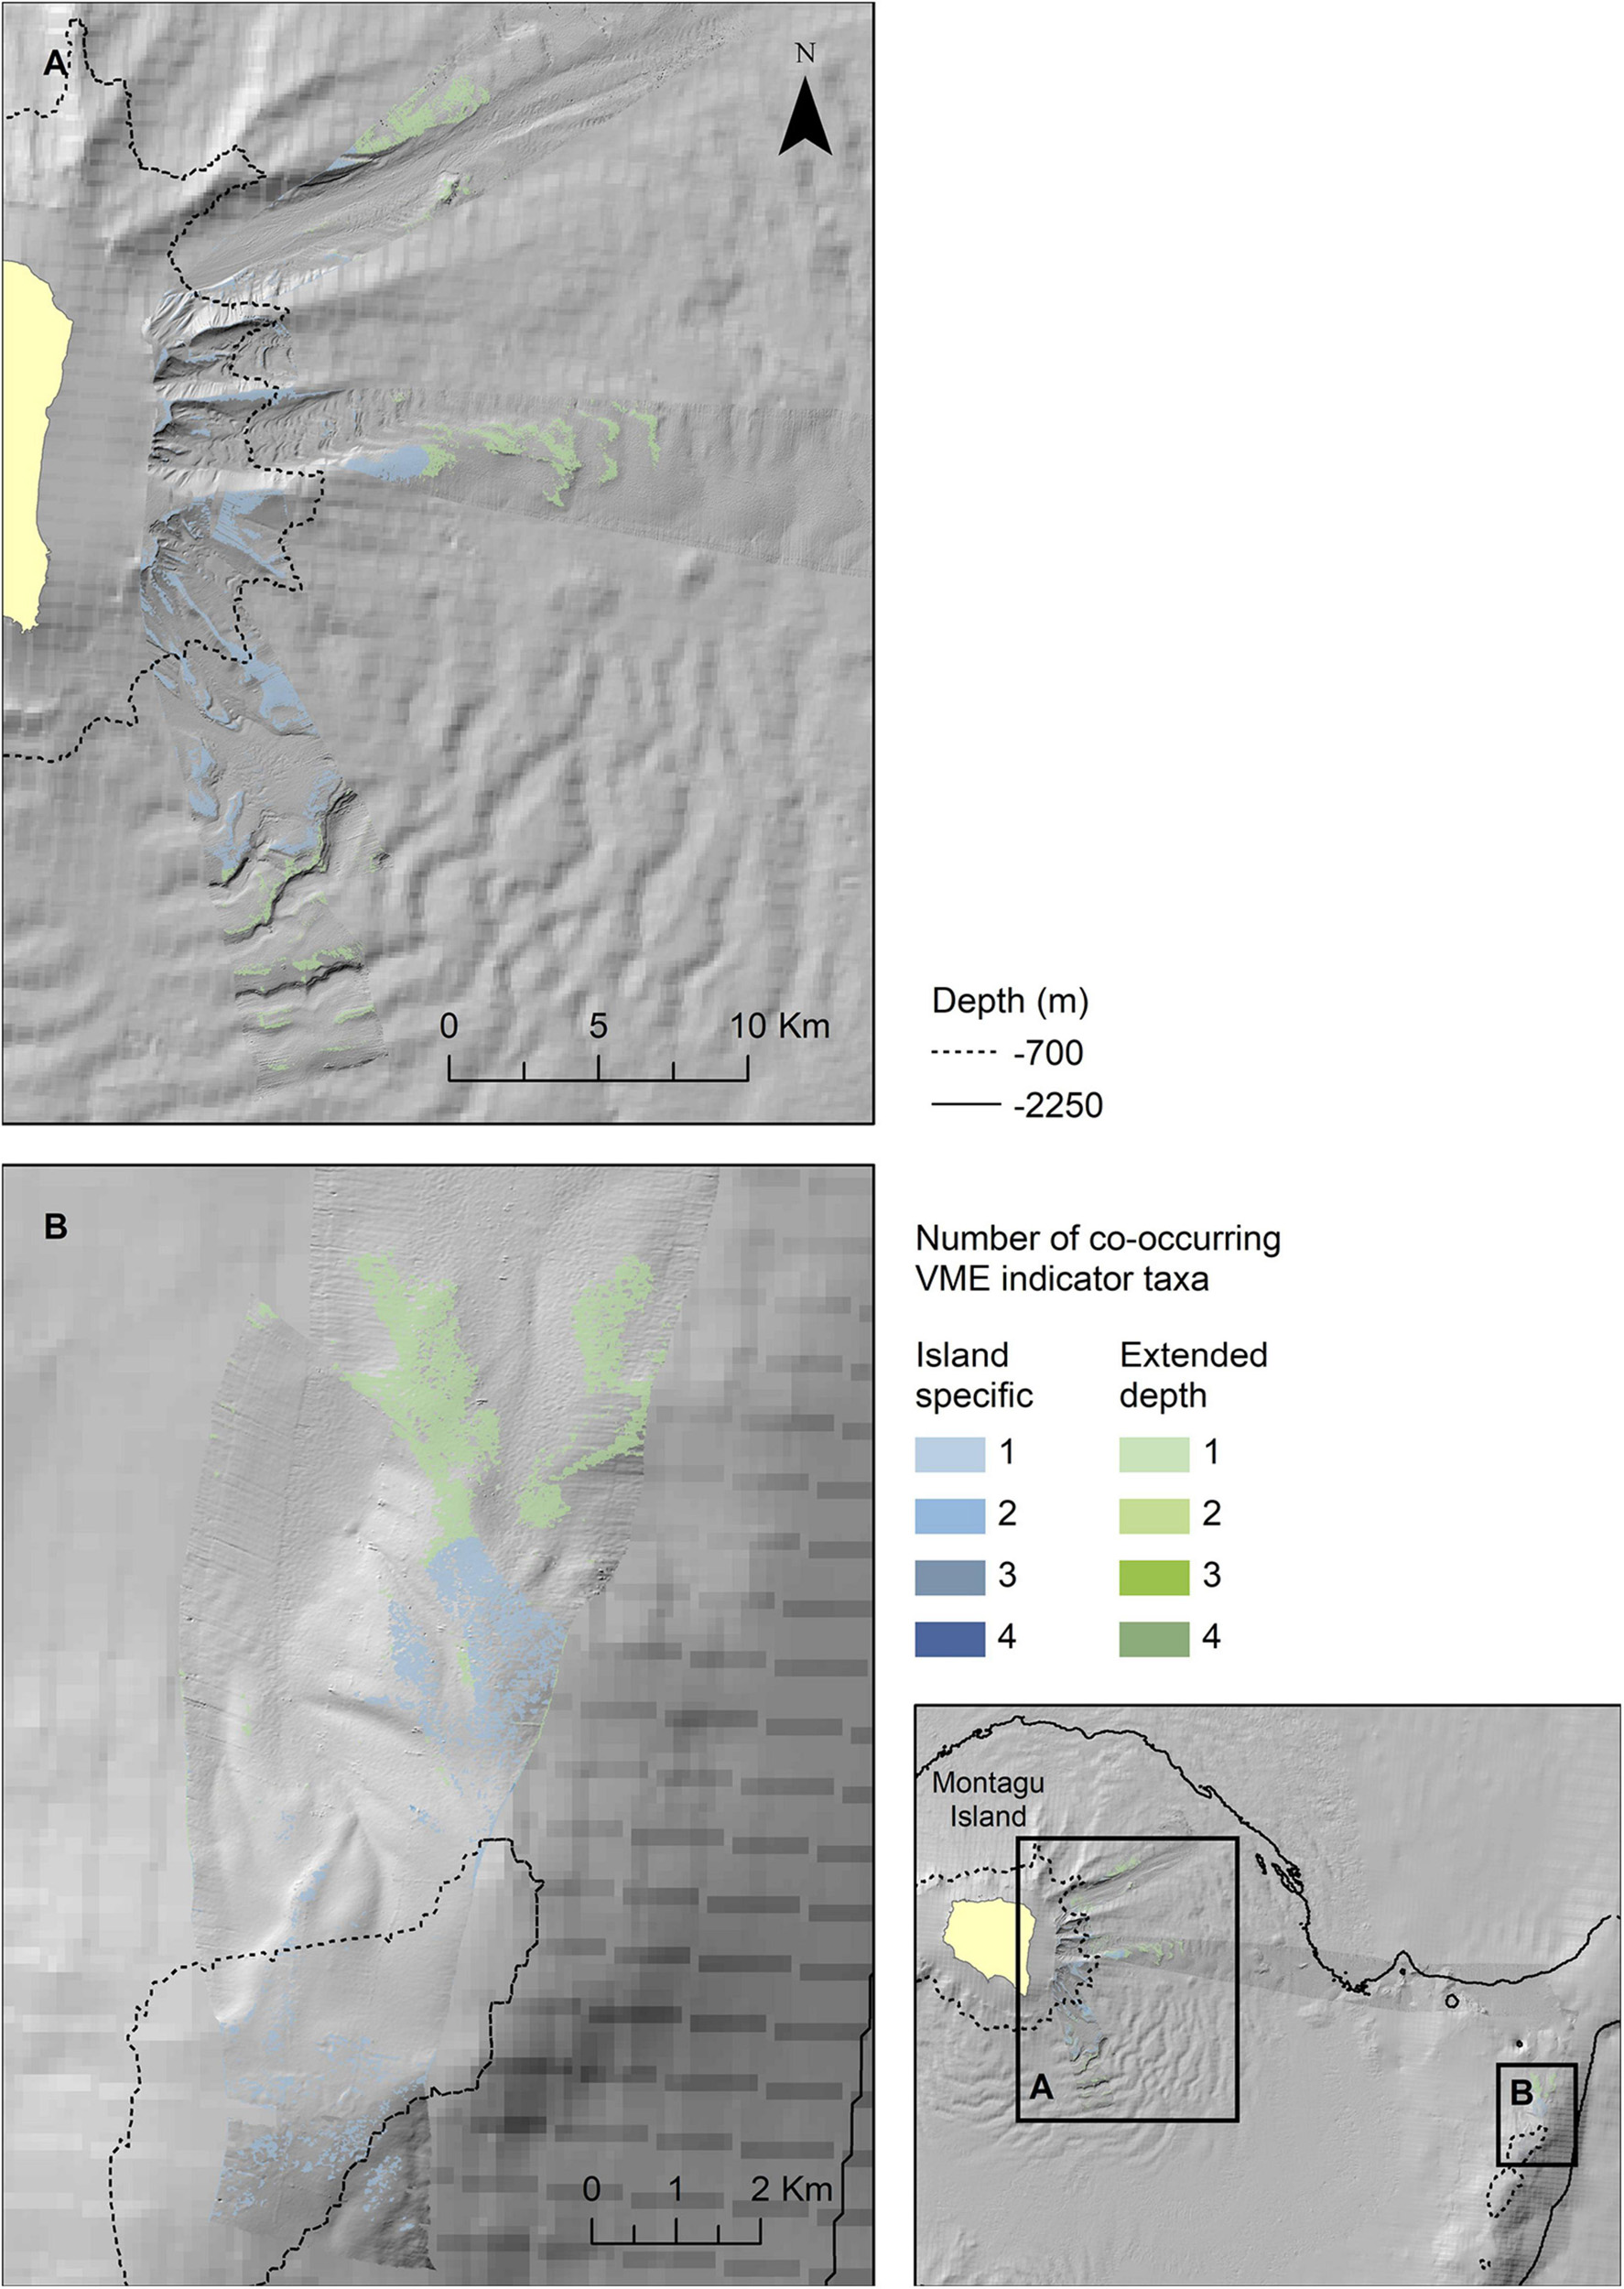
Figure 9. Extrapolated extent of potentially suitable habitat for VME indicator taxa in the two survey locations at Montagu Island (A) and Bank (B). Shown values refer to the number of VME indicator taxa for which suitable habitat is likely to co-occur. Blue colours indicate the extent within observed depth limit for this location, green colours indicate topographically suitable habitat present beyond the observed depth. High resolution bathymetry from DY99 is shown overlain on the South Sandwich Islands bathymetry compilation by Leat et al. (2014).
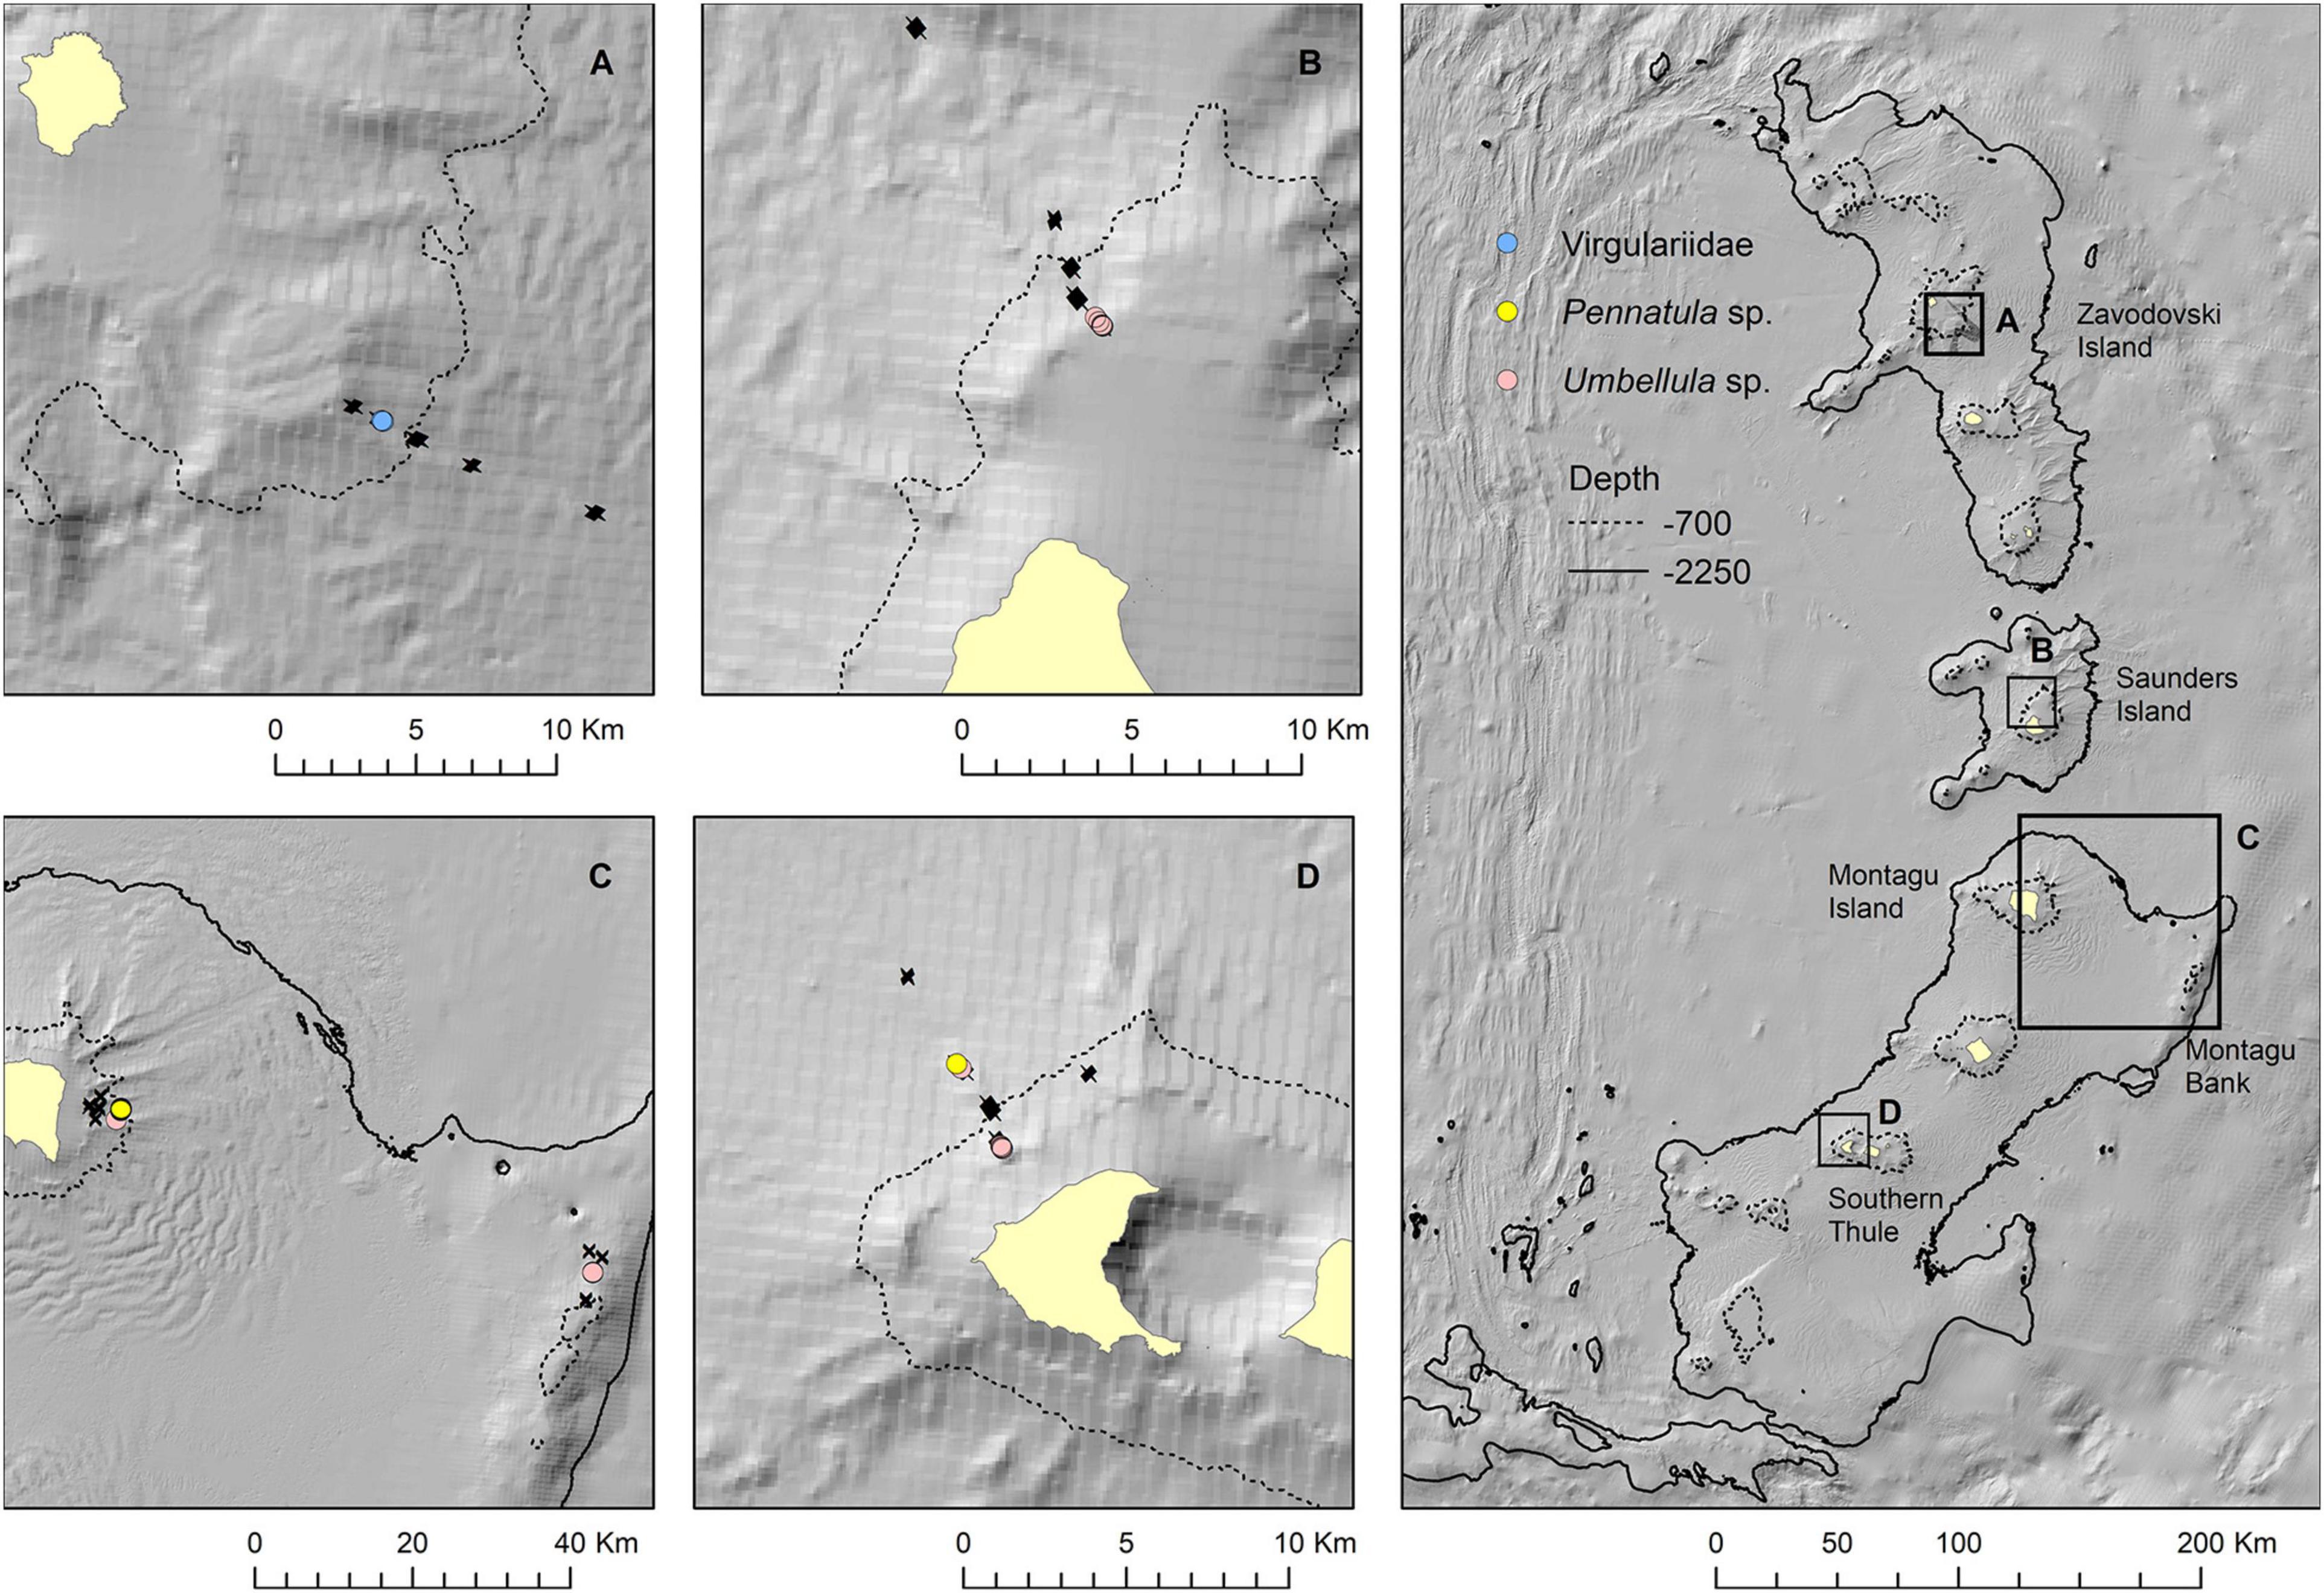
Figure 10. Observations of sea pens in still images presented as point locations along drop camera transects at Zavodovski Island (A), Saunders Island (B), Montagu Island and Bank (C), and Southern Thule (D). Bathymetry from the South Sandwich Islands bathymetry compilation by Leat et al. (2014).
This study, a part of the The UK Government’s Blue Belt Programme, aimed to assess the distribution of potential VME across the chain of volcanic islands forming the SSI, visiting four of the islands over the north-south gradient of the archipelago. Our dedicated acoustic and camera surveys targetted a set range of depths and were successful in gaining new knowledge about the distributions and extent of VME indicator taxa present at the islands. We were able to distiguish both bathymetric and geographical north to south differences in the proportional occurrences of VME indicator taxa, which will feed directly into management of the region.
The SSI are a data poor region for which relatively little was known about the benthic biodiversity of the archipelago’s waters (Hogg et al., this special issue). This represented a significant gap in understanding of the region and its potential vulnerability to human impacts. Existing data on the presence of VME indicator taxa at the islands consists of trawl samples collected by passing expeditions over a hundred year time frame. Larger expeditions include the Discovery expeditions (1925–1938), Russian Antarctic expedition (1971), Islas Orcadas 575 (1975), and USNS Eltanin (1968–1982). More recently, limited scientific demersal trawl sampling has been carried out as part of wider Scotia Arc/Antarctic research cruises which included relatively few sampling stations at the SSI (e.g., Ramos, 1999; Lockhart and Jones, 2008), or were geographically restricted to individual islands, notably Southern Thule (e.g., Kaiser et al., 2008; Griffiths et al., 2009). Other research cruises have had a focus on specific benthic communities, for example the chemosynthetic fauna of deep-sea hydrothermal vents (Marsh et al., 2012; Linse et al., 2019). Lockhart and Jones (2008) collected a total of eight benthic trawl samples from depths between 85 and 400 m from Zavodovski, Candlemas, Montagu and Bristol Islands representing the most comprehensive and systematic sampling of the islands in recent years. Opportunistic records gained from toothfish fisheries bycatch data (Roberts, 2012) have contributed additional knowledge. Some, but not all of this data, are accessible through grey literature and open access databases such as the Global Biodiversity Information Facility (GBIF).
Although the previous studies have covered a number of depth zones and islands, there has not been a targetted sampling campaign that would yield information on the distribution of biodiversity and potential VME across the archipelago and depth gradient in a systematic way. The survey strategy in this study was aimed addressing that gap and optimising coverage of both the north-south gradient over the island chain and a range of depths and bottom types. The limited time available on location led to the selection of a subset of four islands, placing survey areas covering a bathymetic gradient at each of the islands. The strategy was successful in collecting high resolution MBES bathymetry and backscatter over the typical seabed topographic features encountered at each island (Supplementary Figure 1), assessed in comparison to the coarser 100 m resolution SSI bathymetry compilation dataset (Leat et al., 2014, 2016). Video tows were targetted across a wide depth gradient (200–1,500 m), with a view to include the varying topography observed in acoustic data at each of the islands investigated. The use of a video camera to collect in situ observations provided a good overview of the benthic environment, especially the presence of VME indicator taxa. A drop camera system also allows sampling on the steep volcanic slopes, rather than relying on data collected through trawling which is often restricted to flatter topography.
Our findings on the general patterns of epibenthic biodiversity conform to the expectations of the Antarctic benthos being dominated by suspension feeders in shallower waters and deposit feeders in deeper waters (Griffiths, 2010). The main suspension feeding taxa were Primnoid and Isidid alcyonaceans (previously known as gorgonians), which are the most common corals encountered in Antarctic and sub-Antarctic waters (Watling et al., 2011). Many of the bottlebrush morthotype of corals closely resemble Thouarella spp., the most common primnoid genus in the region (Gutt and Starmans, 1998; Zapata-Guardiola and López-González, 2010; Ambroso et al., 2017), although identification from image data is tentative. Sponges were present throughout the studied area but abundance was always low, which is in contrast to the South Orkney Islands (Jones and Lockhart, 2011; Brasier et al., 2018) and the region in general (Downey et al., 2012) where the VME biomass is driven by sponges. The apparent disparity may be due to the differences between physical sampling and visual observation. Lockhart and Jones (2008) reported Porifera contributing 20–25% of biomass in two trawls at Zavodovski (330 m) and one trawl at Montagu (no depth reported). Kaiser et al. (2008) also recorded some sponges in their 500 and 1,000 m depth trawls at Southern Thule, but the biomass collected was low. Fauna on soft bottoms appeared similar to that reported in South Georgia by Lockhart and Jones (2008) and the South Orkneys by Brasier et al. (2018) with more mobile taxa and echinoderms featured prominently in the epifauna.
Mapping distributions of taxa from data poor regions is challenging as most statistical methods that are used to model and predict species distributions (e.g., see Elith and Leathwick, 2009; Norberg et al., 2019) are sensitive to biases and limitations in data inputs (Vierod et al., 2014; Sofaer et al., 2019; Melo-Merino et al., 2020; Winship et al., 2020). Biased and limited data can yield inflated accuracy estimates whilst limiting true model performance (Bean et al., 2012) and exaggerating the effects of locational errors (Mitchell et al., 2017). Although there is no established rule to decide a minimum sample size for distribution modelling, several studies have suggested different minimum sample sizes, ranging from 30 to 200 samples (Wisz et al., 2008; Hanberry et al., 2012; Bucas et al., 2013). Reliable modelling of species or habitat distributions requires much larger datasets, more widely spatially distributed, than the data that can be collected during the limited time available on location during a single expedition targetting a remote location such as the SSI. Consequently data used in models of VME distribution most commonly comes from regional databases or from multiple combined surveys (Vierod et al., 2014; Melo-Merino et al., 2020; Bowden et al., 2021). The advantage of a simple environmental envelope approach for a data-poor region such as SSI, is the methodology has no associated assumptions about the spatial structure of sampling or data distributions. The limitations of envelope approaches are, however, that they only specify the tolerance limits of taxa in relation to each of the individual environmental variables. Their rectilinear concept of the multivariate space around the environmental variables does not allow for regions of absence, account for non-linear and skewed ecological responses or deal with interactions between variables (Barry and Elith, 2006). Consequently, map outputs from envelope models can overestimate suitable area. With this in mind, the output maps should be interpreted as locations within the combination of ranges of environmental variables where the VME taxa have been observed, and which are consequently likely to be capable of supporting populations of these taxa, without any statistical assumptions or predictions of the likelihood of their presence or absence. Further observations targetting areas inside and outside the areas mapped as suitable habitat by the environemental envelopes would enable more detailed approximations of the potential distribution of VME.
The bathymetry and backscatter data collected in this study were, at 10 m cell size, of high resolution for deep water acoustic survey. There is, however, finer-scale variability in substate type that is not captured in the MBES data that will affect the presence of the studied taxa, which cannot be captured at the resolution of the maps. Consequently, the maps should be interpreted with the understanding that they show areas where the habitat is likely to be suitable given appropriate substrate conditions. The fundamental mismatch between the spatial resolution and accuracy of positioning of a still image and the footprint of acoustic data presents an additional source of error. The object-based approach used in this study goes a way towards addressing the issue by combining the information from multiple images to describe continuous patches of seafloor. It must be noted, however, that images in areas with many smaller objects or near the edges of the larger objects can fall inside the “wrong” object, introducing a source of error. Where such edge effects would be noticeable are bottoms of slopes, where objects of steep topography border objects of flat topography, and the edges of hard substrata. As a result outliers were excluded when determining the environmental envelopes. It further cannot be ruled out that VME indicator taxa may occur outside the depth limits observed in this survey. The acoustically surveyed area includes some locations with topographically suitable conditions that were not sampled during the survey, and consequently cannot be discounted as potential habitat without additional sampling.
A total of eight VME indicator taxa were mapped along the slopes of the SSI and a clear distinction, both in taxon composition and abundance, can be made between different bathymetric zones and bottom types. Local-scale variations in distribution of benthic fauna are apparent, and the high-resolution MBES data and its derivative topographic surrogates suggest a high dependency of distribution on topographic features (depth, slope, exposure and position along the slope of local topographic elevations). The differences in taxa and their frequency of occurrence observed between islands correspond to a combination of differences in local topography at the locations surveyed and changes in environmental conditions along a north-south gradient. Equally, the differences in distribution between VME indicator taxa suggest that they respond differently to environmental conditions.
Alcyonacean corals and most of the observed Porifera, were almost always observed on steeper slopes, located in exposed conditions mid-slope or higher. These environments are more likely to have exposed hard substrata, which provide the attachment surfaces required by these taxa. They were also largely restricted to depths above 700 m. Although individual alcyonaceans and Porifera were observed down to ∼1,570 m, only one significant aggregation of these taxa was recorded below 700 m. The depth limit is equally likely associated with the availability of suitable substrata. The vast majority of the islands’ flanks were covered in soft substrata. No camera tows coincided with the kind of steep topography likely to be associated with hard substrata at the deeper stations visited. Topography of the survey sites varied between islands with Montagu Island notably exhibiting a much flatter topography, with less suitable habitat for the hard substratum associated corals.
Of the sites with topography suitable for hard substratum associated taxa, the two northern islands, Zavodovski and Saunders, showed a larger variety of suspension feeding fauna in the rocky habitats surveyed than the southernmost Southern Thule. At Zavodovski and Saunders Islands the most common coral morphotypes were the bottlebrush and whip forms, whilst at Southern Thule most corals were of the branching morphotype. The branching corals at the two northern islands were also different taxonomically from Southern Thule, being represented largely by primnoid sea fans at Zavodovski and Saunders Island and by branching Isididae at Southern Thule. Ambroso et al. (2017) saw a similar change in the structure of gorgonian populations from north to south in the Weddell Sea, although the change was from Thouarella spp. as most abundant at southern stations to Isididae and Dasystenella acanthina in the northern stations. Trends in seabed temperature and productivity show a similar pattern between islands as the alcyonacean corals. Seabed temperature, although depth driven and with little annual variability, shows a maximum range of ∼0.7°C between the north and south of the archipelago, with broadly similar temperature profiles at Zavodovski and Saunders Islands in the north and Montagu Island, Montagu Bank and Southern Thule in the south (Hogg et al., this special issue). There is also a marked discontinuity in primary productivity just north of Southern Thule, which sets the island apart from the rest of the archipelago with relatively low levels of surface productivity (mean < 100 Mg C/m2/day with a peak of ∼160 Mg C/m2/day, Hogg et al., this special issue). Supplementary Figure 9 shows the ranges of depth, slope, annual mean net primary productivity (NPP), number of sea ice days, summer bottom temperature and current velocity at drop camera sampling stations.
Sea pens were observed over the whole island range and a much wider depth range, from ∼237 to ∼1,080 m. They also occurred across a wider exposure gradient with those at Saunders and Montagu Islands observed in moderately sheltered to moderately exposed conditions, whereas observations at Southern Thule were from more exposed environments. The main sea pen genus present at Montagu Island, the only location where sea pens were recorded in larger numbers, Pennatula spp. are associated with substrata ranging from soft muds to muddy sands and conditions sheltered from strong currents (Langton et al., 1990; Baker et al., 2012) and were observed on a level soft sediment plane at the foot of the island’s steeper slope. Umbellula spp., present at Saunders Island, Montagu Island and Bank and Southern Thule, on the other hand, have been observed across multiple types of substrata, both dominantly soft and dominantly hard bottom environments, indicating that they are also able to live in small patches of sediment among rocky ground (Clark and Bowden, 2015; Neves de Moura et al., 2018). The difference in the exposure ranges between the islands, is not unexpected given that the Umbellula spp. sea pens encountered at Southern Thule occurred on coarser sediments in exposed areas, whilst the Montagu Island and Bank transects represent the more elevated habitats where Umbellula spp. were observed and the more sheltered mud plain where Pennatula spp. were observed. The map of sea pen distribution for Montagu island and Bank is limited by the maximum depth of transects at the site, which limits the extrapolated distribution to a very narrow depth range and as such, the extent of their distribution could warrant further investigation with sampling targetted based on suitable ground (soft sediment, low reflectivity) to confirm their depth range and extent of distribution.
Our results indicate that in the area covered by this study the current zoning based MPA management measures, which exclude all types of fishing in waters shallower than 700 m, are successfully protecting the majority of the observed potential VME. We encountered only one area, to the east of Montagu Island, where an aggregation of a VME indicator species, Pennatula spp. sea pens, was recorded in the depth zone where longline fishing is permitted.
The main VME indicator taxa observed at the SSI were bottlebrush, whip and branched morphotypes of primnoid and isidid corals. Sponges and sea pens were present throughout the area, but abundances were low. The qualitative assessment of camera surveys indicates a change in fauna from the north to the south of the archipelago as well as with depth. Observations of VME indicator taxa at the southernmost island of Southern Thule were fewer and the most prevalent coral changes from the bottlebrush and whip morphotypes of primnoids to the branching morphotype of isidids. Further detailed analysis of faunal communities in the video and still imagery would assist to fully describe biogeographic differences and the role of the environment in driving them. The distribution of aggregations of VME indicator taxa was mainly limited to above 700 m. As such, the current zoning of longline fishing to within 700–2,250 m offers effective protection for the majority of the VME indicator taxa.
The source material and datasets collected on DY99 presented in this article are in the process of being made publicly available. Queries regarding access can be directed to the corresponding author.
A-LD participated in data collection, conducted the statistical analysis, prepared the figures, and compiled the manuscript. RV participated in data collection, conducted the image analysis, and contributed manuscript text. OH provided wider context and contributed to the manuscript text. CD conceived and led the DY99 research expedition and its objectives and contributed to manuscript text. All authors contributed to the writing and reviewing of the manuscript.
This work was funded by the UK Government through the Blue Belt Programme (https://www.gov.uk/government/publications/the-blue-belt-programme). RV was supported by a Darwin Plus Award (DPLUS089).
The authors declare that the research was conducted in the absence of any commercial or financial relationships that could be construed as a potential conflict of interest.
We are grateful to the captain, crew and scientists of RRS Discovery Expedition DY99. This manuscript is based on content which first appeared in the UK Government report: Benthic biodiversity in the South Sandwich Islands: Results from the Blue Belt Programme RRS Discovery Expedition DY99 (Darby et al., 2021).
The Supplementary Material for this article can be found online at: https://www.frontiersin.org/articles/10.3389/fmars.2021.662285/full#supplementary-material
Ambroso, S., Salazar, J., Zapata-Guardiola, R., Federwisch, L., Richter, C., Gili, J. M., et al. (2017). Pristine populations of habitat-forming gorgonian species on the Antarctic continental shelf. Sci. Rep. 7:12251. doi: 10.1038/s41598-017-12427-y
Ardron, J. A., Clark, M. R., Penney, A. J., Hourigan, T. F., Rowden, A. A., Dunstan, P. K., et al. (2014). A systematic approach towards the identification and protection of vulnerable marine ecosystems. Mar. Policy 49, 146–154. doi: 10.1016/J.MARPOL.2013.11.017
Auster, P. J., Gjerde, K., Heupel, E., Watling, L., Grehan, A., and Rogers, A. D. (2011). Definition and detection of vulnerable marine ecosystems on the high seas: problems with the “move-on” rule. ICES J. Mar. Sci. 68, 254–264.
Baker, K., Wareham, V., Snelgrove, P., Haedrich, R., Fifield, D., Edinger, E., et al. (2012). Distributional patterns of deep-sea coral assemblages in three submarine canyons off Newfoundland, Canada. Mar. Ecol. Prog. Ser. 445, 235–249. doi: 10.3354/meps09448
Barnes, D. K. A., Collins, M. A., Brickle, P., Fretwell, P., Griffiths, H. J., Herbert, D., et al. (2011). The need to implement the Convention on Biological Diversity at the high latitude site, South Georgia. Antarct. Sci. 23, 323–331. doi: 10.1017/S0954102011000253
Barry, S., and Elith, J. (2006). Error and uncertainty in habitat models. J. Appl. Ecol. 43, 413–423. doi: 10.1111/j.1365-2664.2006.01136.x
Bean, W. T., Stafford, R., and Brashares, J. S. (2012). The effects of small sample size and sample bias on threshold selection and accuracy assessment of species distribution models. Ecography 35, 250–258. doi: 10.1111/j.1600-0587.2011.06545.x
Bell, J. B., Guijarro-Garcia, E., and Kenny, A. (2019). Demersal Fishing in Areas Beyond National Jurisdiction: a Comparative Analysis of Regional Fisheries Management Organisations. Front. Mar. Sci. 6:596. doi: 10.3389/fmars.2019.00596
Benedet, R. A. (2017). The Bottom Longline Fishery and Its use as a Source of Benthic Biodiversity Information Around South Georgia. Ph.D. thesis. U. K.: Open University.
Bett, B. J., and Rice, A. L. (1992). The influence of hexactinellid sponge (Pheronema carpenteri) spicules on the patchy distribution of macrobenthos in the Porcupine Seabight (bathyal NE Atlantic). Ophelia 36, 217–226.
Blaschke, T. (2010). Object based image analysis for remote sensing. ISPRS J. Photogramm. Remote Sens. 65, 2–16. doi: 10.1016/J.ISPRSJPRS.2009.06.004
Boehner, J., and Antonic, O. (2009). “Land-surface parameters specific to topo-climatology,” in Geomorphometry - Concepts, Software, Applications, eds T. Hengl and H. Reuter (Amsterdam: Elsevier), 195–226.
Boehner, J., and Selige, T. (2006). “Spatial prediction of soil attributes using terrain analysis and climate regionalisation,” in SAGA - Analysis and Modelling Applications, Goettinger Geographische Abhandlungen, eds J. Boehner, K. R. McCloy, and J. Strobl (Goettingen: Goltze), 13–28.
Bowden, D. A., Anderson, O. F., Rowden, A. A., Stephenson, F., and Clark, M. R. (2021). Assessing Habitat Suitability Models for the Deep Sea: is Our Ability to Predict the Distributions of Seafloor Fauna Improving? Front. Mar. Sci. 8:239. doi: 10.3389/fmars.2021.632389
Brasier, M. J., Grant, S. M., Trathan, P. N., Allcock, L., Ashford, O., Blagbrough, H., et al. (2018). Benthic biodiversity in the South Orkney Islands Southern Shelf Marine Protected Area. Biodiversity 19, 5–19. doi: 10.1080/14888386.2018.1468821
Brewin, P. E., Farrugia, T. J., Jenkins, C., and Brickle, P. (2020). Straddling the line: high potential impact on vulnerable marine ecosystems by bottom-set longline fishing in unregulated areas beyond national jurisdiction. ICES J. Mar. Sci. 2020:fsaa106. doi: 10.1093/icesjms/fsaa106
Bucas, M., Bergstrom, U., Downie, A.-L., Sundblad, G., Gullstrom, M., von Numers, M., et al. (2013). Empirical modelling of benthic species distribution, abundance, and diversity in the Baltic Sea: evaluating the scope for predictive mapping using different modelling approaches. ICES J. Mar. Sci. 70, 1233–1243. doi: 10.1093/icesjms/fst036
CCAMLR. (2009a). Conservation Measure 22-07. Interim Measure for Bottom Fishing Activities Subject to Conservation Measure 22-06 Encountering Potential Vulnerable Marine Ecosystems in the Convention Areas. Schedule of Conservation Measure in Force 2017/18. Hobart: CCAMLR.
CCAMLR. (2009b). SC-CAMLR-XXVIII Report Of The Twenty-Eighth Meeting Of The Scientific Committee. Hobart: CCAMLR.
CCAMLR. (2013). Conservation Measure 22-07. Interim Measure for Bottom Fishing Activities Subject to Conservation Measure 22-06 Encountering Potential Vulnerable Marine Ecosystems in the Convention Area. Hobart: CCAMLR.
CCAMLR (2016). Fishery Report 2016: Dissostichus spp. South Sandwich Islands (Subarea 48.4). Hobart, TAS: CCAMLR.
Clark, M. R., and Bowden, D. A. (2015). Seamount biodiversity: high variability both within and between seamounts in the Ross Sea region of Antarctica. Hydrobiologia 761, 161–180. doi: 10.1007/s10750-015-2327-9
Clubbe, C. (2018). South Georgia & the South Sandwich Islands Marine Protected Area 5-year Review Report to the Government of South Georgia and the South Sandwich Islands. Available online at: http://www.gov.gs/docsarchive/Environment/Marine%20Protected%20Area/SGSSI_5year_MPA_Review_Summary_Report_to_GSGSSI_(Nov%202018).pdf
Collins, M. A., Brickle, P., Brown, J., and Belchier, M. (2010). “The Patagonian toothfish: biology, ecology and fishery,” in Advances in Marine Biology, Vol. 58, ed. M. Lesser (Cambridge: Academic Press), 227–300.
Conrad, O., Bechtel, B., Bock, M., Dietrich, H., Fischer, E., Gerlitz, L., et al. (2015). System for Automated Geoscientific Analyses (SAGA) v. 2.1.4. Geosci. Model Dev. 8, 1991–2007.
Copley, J. T. P., Tyler, P. A., Sheader, M., Murton, B. J., and German, C. R. (1996). Megafauna from sublittoral to abyssal depths along the Mid-Atlantic Ridge south of Iceland. Oceanologica Acta 19, 549–559.
Darby, C. D., O, T., Hogg, A. Downie, Vieira, R., and Soeffker, M. (2021). Benthic Biodiversity of the South Sandwich Islands, Results from the RRS Discovery Expedition DY99, Report number CR0124. U.K.: Blue Belt Programme.
De Broyer, C., Koubbi, P., Griffiths, H. J., Raymond, B., and Udekem, d’Acoz, C., et al. (eds) (2014). Biogeographic Atlas of the Southern Ocean. Cambridge: SCAR.
Desmet, P. J. J., and Govers, G. (1996). A GIS procedure for automatically calculating the USLE LS factor on topographically complex landscape units. J. Soil Water Conserv. 51, 427–433.
Diesing, M., Green, S. L., Stephens, D., Lark, R. M., Stewart, H. A., and Dove, D. (2014). Mapping seabed sediments: comparison of manual, geostatistical, object-based image analysis and machine learning approaches. Cont. Shelf Res. 84, 107–119. doi: 10.1016/j.csr.2014.05.004
Diesing, M., and Thorsnes, T. (2018). Mapping of Cold-Water Coral Carbonate Mounds Based on Geomorphometric Features: an Object-Based Approach. Geosciences 8:34. doi: 10.3390/geosciences8020034
Downey, R. V., Griffiths, H. J., Linse, K., and Janussen, D. (2012). Diversity and distribution patterns in high southern latitude sponges. PLoS One 7:e41672. doi: 10.1371/journal.pone.0041672
Elith, J., and Leathwick, J. R. (2009). Species Distribution Models: ecological Explanation and Prediction Across Space and Time. Annu. Rev. Ecol. Evol. Syst. 40, 677–697. doi: 10.1146/annurev.ecolsys.110308.120159
FAO (2009). International Guidelines for the Management of Deep-Sea Fisheries in the High Seas. Rome: FAO.
FCO (2012). The Overseas Territories, Security, Success and Sustainability. London: Foreign and Commonwealth Office.
Griffiths, H. J. (2010). Antarctic marine biodiversity–what do we know about the distribution of life in the Southern Ocean? PLoS One 5:e11683. doi: 10.1371/journal.pone.0011683
Griffiths, H. J., Barnes, D. K., and Linse, K. (2009). Towards a generalized biogeography of the Southern Ocean benthos. J. Biogeogr. 36, 162–177.
Griffiths, H. J., Linse, K., and Barnes, D. K. A. (2008). Distribution of macrobenthic taxa across the Scotia Arc. Southern Ocean. Antarct. Sci. 20, 213–226. doi: 10.1017/S0954102008001168
GSGSSI (2018). South Georgia & the South Sandwich Islands Marine Protected Area Enhancements. Available online at: https://www.gov.gs/32110-2/
Gutt, J., and Starmans, A. (1998). Structure and biodiversity of megabenthos in the Weddell and Lazarev Seas (Antarctica): ecological role of physical parameters and biological interactions. Polar Biol. 20, 229–247. doi: 10.1007/s003000050300
Hanberry, B. B., He, H. S., and Dey, D. C. (2012). Sample sizes and model comparison metrics for species distribution models. Ecol. Modell. 227, 29–33. doi: 10.1016/j.ecolmodel.2011.12.001
Hogg, O. T., Barnes, D. K. A., and Griffiths, H. J. (2011). Highly diverse, poorly studied and uniquely threatened by climate change: an assessment of marine biodiversity on South Georgia’s continental shelf. PLoS One 6:e19795. doi: 10.1371/journal.pone.0019795
Howe, J. A., Shimmield, T. M., and Diaz, R. (2004). Deep-water sedimentary environments of the northwestern Weddell Sea and South Sandwich Islands, Antarctica. Deep Sea Res. 2 Top. Stud. Oceanogr. 51, 1489–1514. doi: 10.1016/J.DSR2.2004.07.011
Howell, K. L., Davies, J. S., Allcock, A. L., Braga-Henriques, A., Buhl-Mortensen, P., Carreiro-Silva, M., et al. (2019). A framework for the development of a global standardised marine taxon reference image database (SMarTaR-ID) to support image-based analyses. PLoS One 14:e0218904. doi: 10.1371/journal.pone.0218904
Howell, K. L., Piechaud, N., Downie, A. L., and Kenny, A. (2016). The distribution of deep-sea sponge aggregations in the North Atlantic and implications for their effective spatial management. Deep-Sea Res. Part I Oceanogr. Res. Pap. 115, 203–220. doi: 10.1016/j.dsr.2016.07.005
Ierodiaconou, D., Schimel, A. C. G., Kennedy, D., Monk, J., Gaylard, G., Young, M., et al. (2018). Combining pixel and object based image analysis of ultra-high resolution multibeam bathymetry and backscatter for habitat mapping in shallow marine waters. Mar. Geophys. Res. 39, 271–288. doi: 10.1007/s11001-017-9338-z
Jacobsen Stout, N., Kuhnz, L., Lundsten, L., Schlining, B., Schlining, K., and von Thun, S. (eds) (2020). The Deep-Sea Guide (DSG). US: Monterey Bay Aquarium Research Institute (MBARI).
Jones, C. D., and Lockhart, S. J. (2011). Detecting Vulnerable Marine Ecosystems in the Southern Ocean using research trawls and underwater imagery. Mar. Policy 35, 732–736.
Kadmon, R., Farber, O., and Danin, A. (2003). A systematic analysis of factors affecting the performance of climatic envelope models. Ecol. Appl. 13, 853–867.
Kaiser, S., Barnes, D. K. A., Linse, K., and Brandt, A. (2008). Epibenthic macrofauna associated with the shelf and slope of a young and isolated Southern Ocean island. Antarct. Sci. 20, 281–290. doi: 10.1017/S0954102008001107
Kazanidis, G., Vad, J., Henry, L. A., Neat, F., Berx, B., Georgoulas, K., et al. (2019). Distribution of deep-sea sponge aggregations in an area of multisectoral activities and changing oceanic conditions. Front. Mar. Sci. 6:163. doi: 10.3389/fmars.2019.00163
Lacharité, M., Brown, C. J., and Gazzola, V. (2018). Multisource multibeam backscatter data: developing a strategy for the production of benthic habitat maps using semi-automated seafloor classification methods. Mar. Geophys. Res. 39, 307–322. doi: 10.1007/s11001-017-9331-6
Langton, R. W., Langton, E. W., Theroux, R. B., and Uzmann, J. R. (1990). Distribution, behavior and abundance of sea pens, Pennatula aculeata, in the Gulf of Maine. Mar. Biol. 107, 463–469. doi: 10.1007/BF01313430
Leat, P. T., Fretwell, P. T., Tate, A. J., Larter, R. D., Martin, T. J., Smellie, J. L., et al. (2014). Bathymetry and geological setting of the South Sandwich Islands Volcanic Arc (various scales), BAS GEOMAP 2 series, Sheet 6. U.K.: British Antarctic Survey.
Leat, P. T., Fretwell, P. T., Tate, A. J., Larter, R. D., Martin, T. J., Smellie, J. L., et al. (2016). Bathymetry and geological setting of the South Sandwich Islands volcanic arc. Antarct. Sci. 28, 293–303. doi: 10.1017/S0954102016000043
Linse, K., Copley, J. T., Connelly, D. P., Larter, R. D., Pearce, D. A., Polunin, N. V. C., et al. (2019). Fauna of the Kemp Caldera and its upper bathyal hydrothermal vents (South Sandwich Arc, Antarctica). R. Soc. Open Sci. 6:191501. doi: 10.1098/rsos.191501
Lockhart, S. J., and Jones, C. D. (2008). Biogeographic patterns of benthic invertebrate megafauna on shelf areas within the Southern Ocean Atlantic sector. CCAMLR Sci. 15, 167–192.
Lucieer, V., Hill, N. A., Barrett, N. S., and Nichol, S. (2013). Do marine substrates “look” and “sound” the same? Supervised classification of multibeam acoustic data using autonomous underwater vehicle images. Estuar. Coast. Shelf Sci. 117, 94–106. doi: 10.1016/j.ecss.2012.11.001
Lucieer, V., and Lamarche, G. (2011). Unsupervised fuzzy classification and object-based image analysis of multibeam data to map deep water substrates, Cook Strait, New Zealand. Cont. Shelf Res. 31, 1236–1247. doi: 10.1016/j.csr.2011.04.016
Malyutina, M. (2004). Russian deep-sea investigations of Antarctic fauna. Deep Sea Res. 2 Top. Stud. Oceanogr. 51, 1551–1570. doi: 10.1016/J.DSR2.2004.07.012
Marsh, L., Copley, J., Huvenne, V., Linse, K., Reid, W. D. K., Rogers, A., et al. (2012). Microdistribution of faunal assemblages at deep-sea hydrothermal vents in the Southern Ocean. PLoS One 7:e48348.
Melo-Merino, S. M., Reyes-Bonilla, H., and Lira-Noriega, A. (2020). Ecological niche models and species distribution models in marine environments: a literature review and spatial analysis of evidence. Ecol. Modell. 415:108837.
Misiuk, B., Lacharité, M., and Brown, C. J. (2021). Assessing the use of harmonized multisource backscatter data for thematic benthic habitat mapping. Sci. Remote Sens. 3:100015. doi: 10.1016/j.srs.2021.100015
Mitchell, P. J., Monk, J., and Laurenson, L. (2017). Sensitivity of fine-scale species distribution models to locational uncertainty in occurrence data across multiple sample sizes. Methods Ecol. Evol. 8, 12–21. doi: 10.1111/2041-210X.12645
Montereale Gavazzi, G., Madricardo, F., Janowski, L., Kruss, A., Blondel, P., Sigovini, M., et al. (2016). Evaluation of seabed mapping methods for fine-scale classification of extremely shallow benthic habitats – Application to the Venice Lagoon, Italy. Estuar. Coast. Shelf Sci. 170, 45–60. doi: 10.1016/j.ecss.2015.12.014
Morato, T., Pham, C. K., Pinto, C., Golding, N., Ardron, J. A., Durán Muñoz, P., et al. (2018). A Multi Criteria Assessment Method for Identifying Vulnerable Marine Ecosystems in the North-East Atlantic. Front. Mar. Sci. 5:460. doi: 10.3389/fmars.2018.00460
Neves de Moura, B., Edinger, E., Hayes, V. W., Devine, B., Wheeland, L., and Layne, G. (2018). Size metrics, longevity, and growth rates in Umbellula encrinus (Cnidaria: pennatulacea) from the eastern Canadian Arctic. Arct. Sci. 4, 722–749. doi: 10.1139/as-2018-0009
Norberg, A., Abrego, N., Blanchet, F. G., Adler, F. R., Anderson, B. J., Anttila, J., et al. (2019). A comprehensive evaluation of predictive performance of 33 species distribution models at species and community levels. Ecol. Monogr. 89, 1–24. doi: 10.1002/ecm.1370
Parker, S. J., and Bowden, D. A. (2010). Identifying taxonomic groups vulnerable to bottom longline fishing gear in the Ross Sea region. CCAMLR Sci. 17, 105–127.
Pierrejean, M., Grant, C., Neves, B., de, M., Chaillou, G., Edinger, E., et al. (2020). Influence of Deep-Water Corals and Sponge Gardens on Infaunal Community Composition and Ecosystem Functioning in the Eastern Canadian Arctic. Front. Mar. Sci. 7:495. doi: 10.3389/fmars.2020.00495
Ratcliffe, N., and Trathan, P. N. (2011). A review of the diet and at-sea distribution of penguins breeding within the CCAMLR convention area. CCAMLR Sci. 19, 75–114.
Rauschert, M., and Arntz, W. (2010). Antarktisches makrobenthos: Ein Feldführer der am Boden lebenden Wirbellosen (Antarctic macrobenthos: a field guide of the invertebrates living at the Antarctic seafloor). Wurster Nordseekueste: Arntz & Rauschert Selbstverlag.
Roberts, J. O. (2012). Ecology and management of range edge populations: the case of toothfish species at the South Sandwich Islands. Ph.D. thesis. London: Imperial College London.
Rogers, A. D., Yesson, C., and Gravestock, P. (2015). A Biophysical and Economic Profile of South Georgia and the South Sandwich Islands as Potential Large-Scale Antarctic Protected Areas. Adv. Mar. Biol. 70, 1–286. doi: 10.1016/bs.amb.2015.06.001
Rowden, A. A., Anderson, O. F., Georgian, S. E., Bowden, D. A., Clark, M. R., Pallentin, A., et al. (2017). High-resolution habitat suitability models for the conservation and management of vulnerable marine ecosystems on the Louisville Seamount Chain, South Pacific Ocean. Front. Mar. Sci. 4:335. doi: 10.3389/fmars.2017.00335
Sofaer, H. R., Jarnevich, C. S., Pearse, I. S., Smyth, R. L., Auer, S., Cook, G. L., et al. (2019). Development and Delivery of Species Distribution Models to Inform Decision-Making. Bioscience 69, 544–557. doi: 10.1093/biosci/biz045
Taylor, M. L. (2011). Distribution and diversity of octocorals from longline by-catch around South Georgia, UK. Ph.D. thesis. London: Imperial College London.
Trathan, P. N., Collins, M. A., Grant, S. M., Belchier, M., Barnes, D. K. A., Brown, J., et al. (2014). The South Georgia and South Sandwich Islands MPA: protecting a biodiverse oceanic island chain situated in the flow of the Antarctic Circumpolar Current. Adv. Mar. Biol. 69, 15–77.
UNGA. (2006). Resolution 61/105. Sustainable Fisheries, Including through the 1995 Agreement for the Implementation of the Provisions of the United Nations Convention on the Law of the Sea of 10 December 1982 Relating to the Conservation and Management of Straddling Fish Stocks and highly Migratory Fish Stocks, and Related Instruments. United Nations: UNGA.
Vierod, A. D. T., Guinotte, J. M., and Davies, A. J. (2014). Predicting the distribution of vulnerable marine ecosystems in the deep sea using presence-background models. Deep Sea Res. 2 Top. Stud. Oceanogr. 99, 6–18. doi: 10.1016/j.dsr2.2013.06.010
Watling, L., France, S. C., Pante, E., and Simpson, A. (2011). Biology of Deep-Water Octocorals. Adv. Mar. Biol. 60, 41–122. doi: 10.1016/B978-0-12-385529-9.00002-0
Winship, A. J., Thorson, J. T., Clarke, M. E., Coleman, H. M., Costa, B., Georgian, S. E., et al. (2020). Good Practices for Species Distribution Modeling of Deep-Sea Corals and Sponges for Resource Management: data Collection, Analysis, Validation, and Communication. Front. Mar. Sci. 7:303. doi: 10.3389/fmars.2020.00303
Wisz, M. S., Hijmans, R. J., Li, J., Peterson, A. T., Graham, C. H., and Guisan, A. (2008). Effects of sample size on the performance of species distribution models. Divers. Distrib. 14, 763–773. doi: 10.1111/j.1472-4642.2008.00482.x
Yokoyama, R., Shirasawa, M., and Pike, R. J. (2002). Visualizing topography by openness: a new application of image processing to digital elevation models. Photogramm. Eng. Remote Sensing 68, 251–266.
Keywords: benthic ecology, marine conservation, vulnerable marine ecosystems (VME), marine spatial planning, Southern Ocean
Citation: Downie A-L, Vieira RP, Hogg OT and Darby C (2021) Distribution of Vulnerable Marine Ecosystems at the South Sandwich Islands: Results From the Blue Belt Discovery Expedition 99 Deep-Water Camera Surveys. Front. Mar. Sci. 8:662285. doi: 10.3389/fmars.2021.662285
Received: 31 January 2021; Accepted: 10 May 2021;
Published: 22 June 2021.
Edited by:
David Andrew Feary, MRAG Ltd, United KingdomReviewed by:
David A. Bowden, National Institute of Water & Atmospheric Research, New ZealandCopyright © 2021 Downie, Vieira, Hogg and Darby. This is an open-access article distributed under the terms of the Creative Commons Attribution License (CC BY). The use, distribution or reproduction in other forums is permitted, provided the original author(s) and the copyright owner(s) are credited and that the original publication in this journal is cited, in accordance with accepted academic practice. No use, distribution or reproduction is permitted which does not comply with these terms.
*Correspondence: Anna-Leena Downie, anna.downie@cefas.co.uk
Disclaimer: All claims expressed in this article are solely those of the authors and do not necessarily represent those of their affiliated organizations, or those of the publisher, the editors and the reviewers. Any product that may be evaluated in this article or claim that may be made by its manufacturer is not guaranteed or endorsed by the publisher.
Research integrity at Frontiers
Learn more about the work of our research integrity team to safeguard the quality of each article we publish.