 Ahmed Elaraby
 Hussein Ali3*
 Bin Zhou
 Jorge M. Fonseca
- 1Department of Cybersecurity, College of Engineering and Information Technology, Buraydah Private Colleges, Buraydah, Saudi Arabia
- 2Department of Computer Science, Faculty of Computers and Information, South Valley University, Qena, Egypt
- 3Data Science Department, Epsilon AI, Cairo, Egypt
- 4Food Quality Laboratory, Beltsville Agricultural Research Center, Agricultural Research Service, United States Department of Agriculture, Beltsville, MD, United States
Introduction: Saffron is one of the most coveted and one of the most tainted products in the global food market. A major challenge for the saffron industry is the difficulty to distinguish between adulterated and authentic dried saffron along the supply chain. Current approaches to analyzing the intrinsic chemical compounds (crocin, picrocrocin, and safranal) are complex, costly, and time-consuming. Computer vision improvements enabled by deep learning have emerged as a potential alternative that can serve as a practical tool to distinguish the pureness of saffron.
Methods: In this study, a deep learning approach for classifying the authenticity of saffron is proposed. The focus was on detecting major distinctions that help sort out fake samples from real ones using a manually collected dataset that contains an image of the two classes (saffron and non-saffron). A deep convolutional neural model MobileNetV2 and Adaptive Momentum Estimation (Adam) optimizer were trained for this purpose.
Results: The observed metrics of the deep learning model were: 99% accuracy, 99% recall, 97% precision, and 98% F-score, which demonstrated a very high efficiency.
Discussion: A discussion is provided regarding key factors identified for obtaining positive results. This novel approach is an efficient alternative to distinguish authentic from adulterated saffron products, which may be of benefit to the saffron industry from producers to consumers and could serve to develop models for other spices.
1 Introduction
Saffron (Crocus sativus L.), commonly known as the “red gold”, for many decades now has been the world’s most expensive spice (Gheshm and Brown, 2021). It is grown in a variety of nations, including prominently Iran, India, Spain, Greece, Italy, and Morocco (Fernández, 2004). In non-traditional saffron production countries like the United States, the increased interest in saffron is also becoming notable. An important amount of volume has recently been grown in the northeastern USA. On the other hand, imports continue to be the main source of the product in the US local market with a 500% imports increase in the last few years (United Nations, 2022). Saffron is used as a colorant or spice in culinary dishes or for food products as well as a medicinal ingredient for multiple purposes (Moghaddasi, 2010; Pitsikas, 2015; Khorasany & Hosseinzadeh, 2016; Kiani et al., 2018). The popularity of saffron is steadily augmenting, with a global demand for saffron expected to increase to 12% annually by the end of 2025 (Grand View Research, 2020).
A commercial pure saffron product is composed of only the flower’s red stigma of the perennial herb Crocus sativus L. It is harvested manually, which reveals why its elevated cost. Due to its high-value saffron is frequently adulterated through the addition of foreign material that provides illicit economic profits. The methods to adulterate saffron can be categorized as either conducted with biological (naturally occurring) adulterants or synthetic/chemical-based adulterants (Kumari et al., 2021). Since the last century, its adulteration has enraged food businesses across the supply chain and drawn public attention (Husaini et al., 2013). Saffron adulteration not only misleads buyers but often raises major concerns due to the risks that it may pose to public health. The reduced quality and nutritional value of adulterated saffron have additional repercussions as it eventually alters the final products in which saffron is used (e.g. food, and medicine) (Heidarbeigi et al., 2015; Parihar et al., 2020). For this reason, food regulation authorities have taken steps towards more stringent approaches to control food adulteration and safeguard consumers from fraudulent operations.
Numerous studies have been carried out on the detection of adulterants of saffron using a variety of methods and techniques (Kumari et al., 2021). These include physical and chemical analyses, chromatographic techniques, microscopy, and spectroscopy methods. Physical and chemical analyses are used to detect the presence of foreign substances such as dyes, starch, or other materials in saffron. Chemical analyses of ubiquitous compounds such as crocin, picrocrocin, and safranal using sophisticated chromatography techniques have proven reliable (Lage and Cantrell, 2009; Garcia-Rodriguez et al., 2014), even when the adulterant contains some of the same crocins that saffron does like gardenia fruits (Gardenia jasminoides Elis), which has been efficiently detected with UHPLC-DAD-MS analysis (Moras et al., 2018). However, the complexity of these methodologies makes them impractical for the everyday market dynamic. Other simpler tests, such as those based on the maximum absorbance in the UV-VIS range have shown low reliability to distinguish the presence of adulterants (Sabatino et al., 2011). Sensory assessments of the aroma, shape, and color of saffron filaments also have limited reliability as it depends much on the experience of the analyst and the type of adulteration. Laser-induced breakdown spectroscopy data analysis with partial least square (PLS) was effective to distinguish pure samples from those adulterated with turmeric, safflower, and marigold (Varliklioz et al., 2017). This method improved the delivery time of results, concerning those based fully on chemometrics, however, it still requires time-consuming laboratory calibration and the acquisition of sophisticated novel spectroscopy equipment.
Artificial intelligence (AI) has emerged as a powerful tool for detecting food adulterants such as coloring agents, preservatives, and other contaminants in food products (Goyal et al., 2022). Elaraby et al. (2022a) demonstrated the feasibility of image analysis-based AI in classifying citrus diseases. In another study, Elaraby et al. (2022b) introduced an approach for plant disease detection using image analysis-based AI. Fazal et al. (2018) reported the potential application of image analysis-based AI in predicting quality in food science and engineering fields. Computer vision systems (CVS) techniques have allowed the development of efficient applications of deep learning in image recognition, making it easy to detect microorganisms of different natures (Zhang et al., 2021). AI-based systems can be used to analyze large amounts of data to identify patterns that may indicate the presence of adulterants. AI in combination with smartphone technology data can be a practical way to identify pure, homogenous food matrices, and flag suspicious ingredients, allowing for more efficient and accurate detection of food adulteration. The latest models of smartphones possess cameras with a high-quality perception of images and sounds, which has proven effective for determining the purity of food matrices through color/texture (Kalinowska et al., 2021) and sound vibration (Iymen et al., 2020).
In this study, the need for a deep learning approach capable of accurately classifying the authenticity of saffron was addressed. The study aimed at contributing with a methodology that can be used to assess the quality and authenticity of saffron products. Therefore, the objective was to propose a simple framework for detecting saffron purity using deep learning. The classification of saffron versus non-saffron was hypothesized to be achieved by training a deep convolutional neural network (CNN) that extracts high to low levels of attributes from digital images of saffron. The initial hypothesis was that the criterion could be used to decide whether the saffron digital images are genuine or not. Moreover, it was proposed that the knowledge transmission from the main task to the target job (saffron purity), could be examined by transmitting knowledge from MobileNetV2, a pre-trained model, to a novel classification task. The latter could be tested using the same number of images CNN generated from the start. The ultimate goal of the study was to demonstrate that saffron purity identification can be achieved by using a pre-trained modified MobileNetV2 with a Deep neural networks (DNN) classifier that transmits knowledge to a new target job that is sufficiently fine-tuned.
2 Materials and methods
2.1 Sourcing and preparation of saffron and non-saffron samples
Eleven saffron samples were sourced by Saffronsystems (Towson, MD, USA) from diverse sites including Vermont (North American Center for Saffron Research and Development), Iran, Greece, Spain, Afghanistan, and Canada. Verification of authenticity was based on certification provided by the manufacturers of the samples. An authentic saffron sample (ExoticBioNaturals, Afghanistan) was also subjected to different types of adulterants commonly utilized in tainting saffron. The experimental adulteration was done with whole saffron stigma filaments (8 samples) and partially powdered stigma filaments (5 samples). The adulterated samples are listed below (Table 1), including a 14th “saffron” Spanish Safrante sample that was sourced without certification from a street market that was easily determined as adulterated (unknown substance) through observation (saffronsystems) and a commonly used water dilution test (Shukla and Iqbal, 2015; Ahmed et al., 2021).
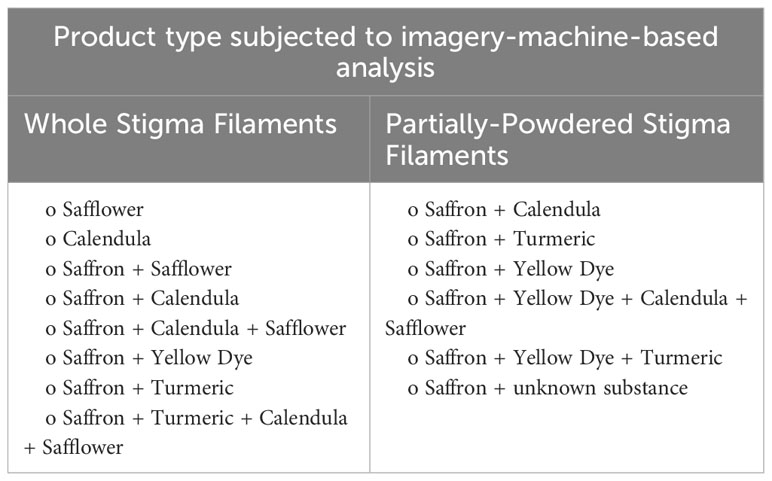
Table 1 Origin of products subjected to analysis in this study.
The techniques to apply the contaminants were as follows, which were based on previous reports (Kumari et al., 2021). For the yellow dye (Dr. Ph. Martin Daffodil Yellow; Sales International, Inc.), the foundation saffron was modified in two ways: one was partially crushed (mortar and pestle) and the other samples were left whole. The stigma filaments and crushed tissue were then placed on separate pieces of paper towels and the yellow dye was added to each sample. The same process was followed for adding turmeric (Curcuma long, local market Towson, MD, commercialized as 100% pure). With the calendula (Calendula officinalis; Monterey Bay Spice Co. via Amazon), the yellow fibrous tissue (petals of the flower) was separated from the rest of the flower. These were then added to saffron (whole stigma filaments). With the safflower (Carthamus tinctorius; Nature Tea via Amazon), the flower parts were mixed with the saffron (whole stigma filaments). For the multi-adulterant mixtures, safflower, calendula, and saffron (whole stigma filaments) were added together in a small container and lightly agitated.
2.2 Image acquisition
Digital images of the 11 authentic samples and the 14 adulterated samples were obtained with smartphones (iPhone 11 Pro). Several images were constructed out of each sample including a. authentic, b. adulterated whole filament, c. adulterated in powder. In total 205 images were shared with the Computer Science Lab of South Valley University, Egypt, for subsequent image processing and analysis. The images were acquired with at least 7 days delay after the in-house adulteration of the samples to ensure that the final product was homogenized and dried.
2.3 MobileNetV2 for image classification
The saffron classification dataset was trained using an adaptation of the MobileNetV2 Convolutional neural network. Due to image recognition, this network is built on the ImageNet dataset (1000 classes of different objects and animals).
It was hypothesized that the MobileNetV2 CNN could solve the saffron classification problem described in this research because it requires considerably fewer training instances and classes. Early-Stopping and Dropout have been proposed as methods for reducing CNN overfitting. The architecture of the MobileNetV2 utilized in this study is shown in Figure 1.
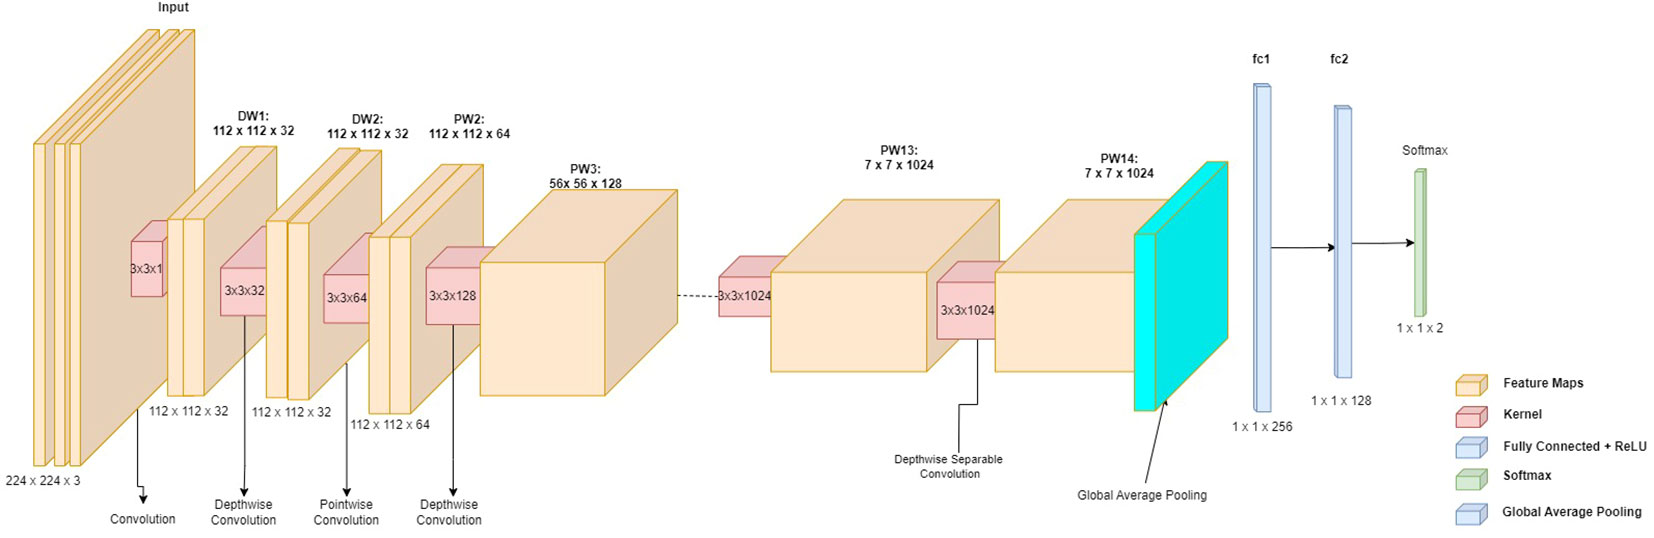
Figure 1 The architecture of the MobileNetV2 utilized in this study.
The choice for a Mobile-Net V2 was justified because it is a lightweight model and performed very well with the available data at the early stage of the study. The continuous trials provided a narrow selection of architectures that were further analyzed to determine the architecture with the best performance.
Deep separable convolution (C1) was used in MobileNetv2 with a bottleneck residual block. The bottleneck residual block had three convolution layers. We had determined the last two layers in MobileNetv2. They are a depth-wise convolution layer (DW) and a 1 x 1 point-to-point convolution layer (PW), noting that in MobileNetv1, pointwise convolution (PW) either keeps or doubles the number of channels. The final, fully connected (FC) layers are the layers that classified the extracted features from previous CNN layers.
For this study case, 1 x 1 convolution produced a reduced number of channels (i.e. the projection layer), which given the lower quantity of data that travels through it was also assumed as the bottleneck layer. Thus, the 1 x 1 expansion layer was the first layer, which expanded the amount of data that passed through it (by increasing the number of channels). Its function serves in the opposite direction to that of the projection layer. Based on the expansion factor, the data expanded.
This is a hyperparameter that was discovered through various architectural trade-offs. The expansion factor was set to 6 by default. The depth-wise convolution layer was the second layer, which was already known. A residual connection was another crucial component of the bottleneck residual block. It was the same as ResNet. The activation function ReLU6 was utilized so it became in the form “(max (x, 0), 6).” Except for the project layer, each layer contained a batch normalization layer and activation function (ReLU6).
The projection layer used batch normalization given the output from the projection layer was low-dimensional. Moreover, using ReLU6 to introduce nonlinearity affected performance negatively. In MobileNetV2, there were two types of blocks. One is a residual block with a stride of 1. Another one resulted in a block with a stride of 2 for downsizing. Compared to MobileNetV1 which had a two layers depth-wise convolution and 1×1 convolution MobileNetV2 produces three types of layers. The first layer is 1×1 convolution with ReLU6. The second layer is the depth-wise convolution. The third layer is another 1×1 convolution but without any non-linearity, as shown in Figure 2.
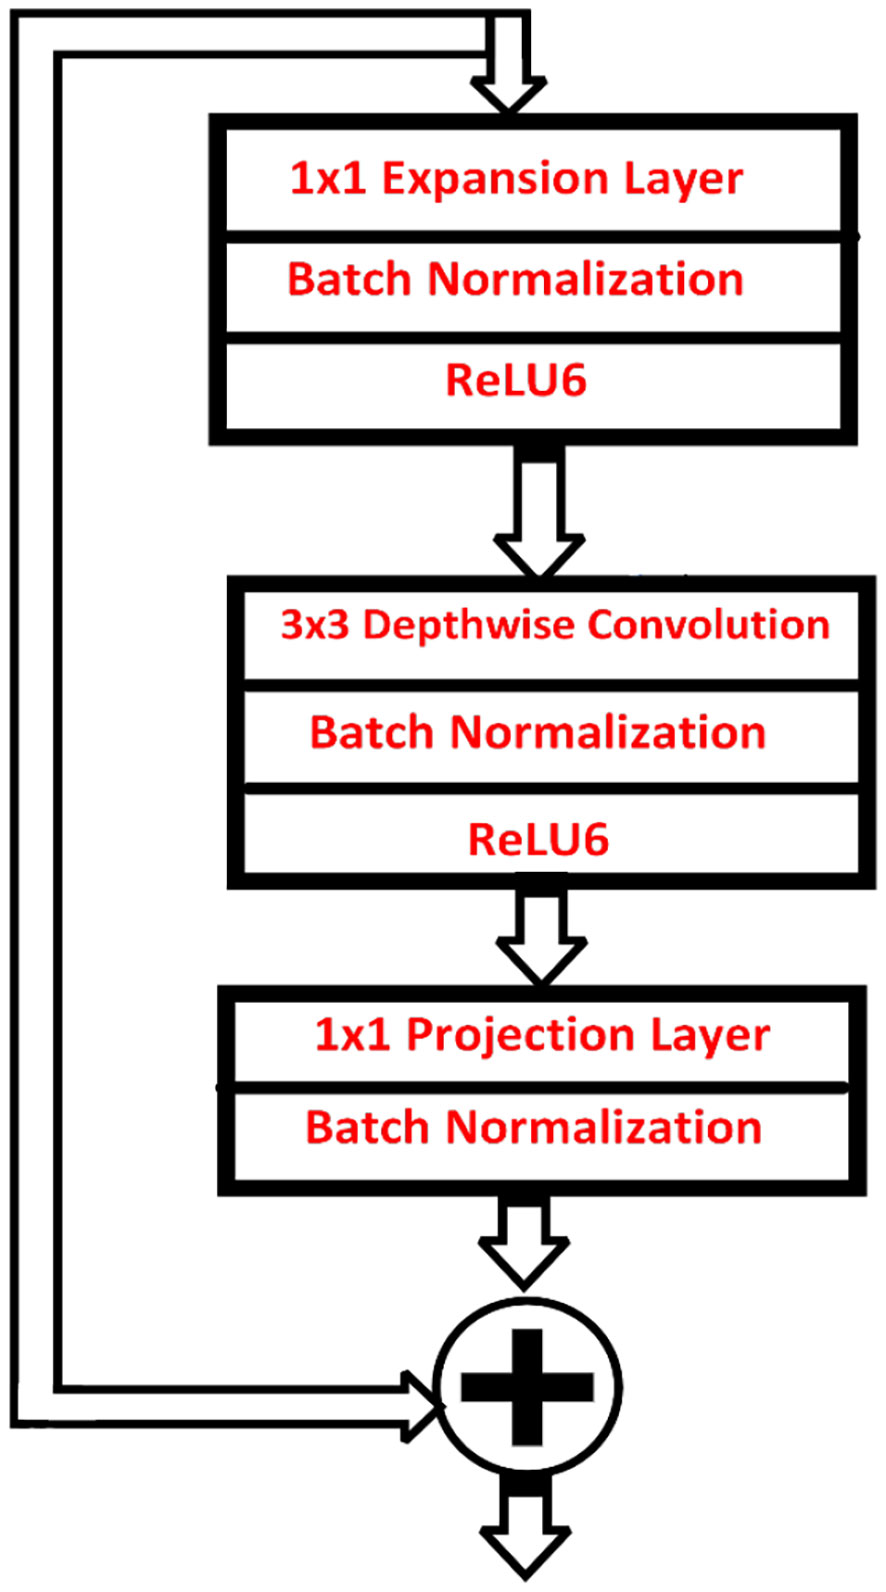
Figure 2 Bottleneck Residual Block.
The model for saffron was chosen after trying multiple different architectures. Not having an automation technique, a pre-trained CNN model was used instead. In the process, two primary sorts of blocks were handled: bottleneck blocks with stride 1 and stride 2 blocks (Figure 3). As previously stated, each of the blocks had three layers. Very importantly, the bottleneck block would not have a residual connection if stride=2 was utilized for depth-wise convolution.
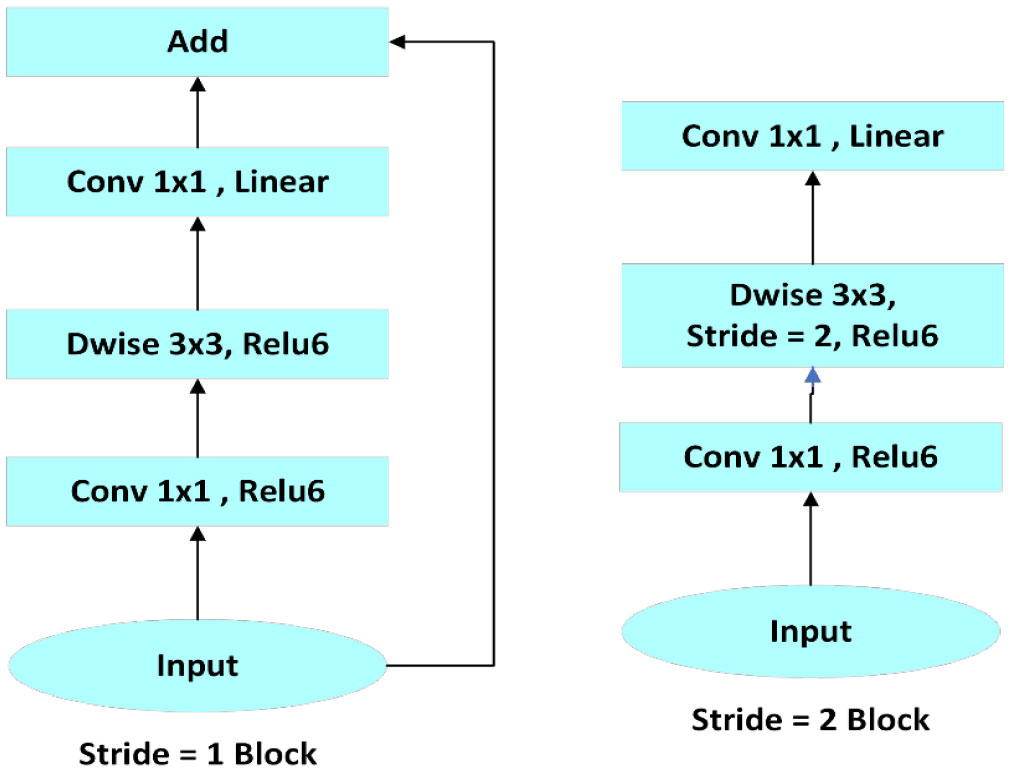
Figure 3 Illustration of primary sort of blocks.
Table 2 shows the architecture of MobileNetV2, which includes the first fully convolution layer with 32 filters. The original authors of Mobile-Net V2 used ReLU6 because of its robustness when used with low-precision computation (Andrew et al., 2021). A kernel of size 3 × 3 is used as it is a standard for modern networks and utilizes dropout and batch normalization during training.
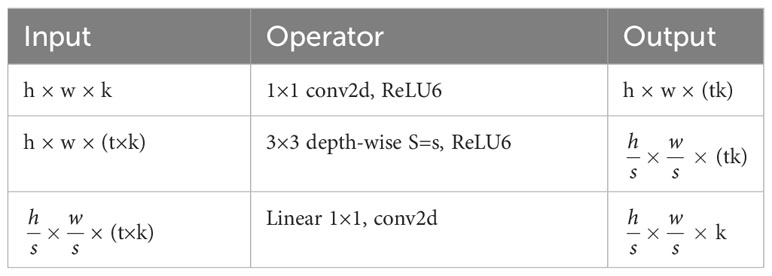
Table 2 Bottleneck residual block transforming from k to k0 channels, with stride s, and expansion factor t, height (h), and width (w) explaining the shape of the feature maps after each mentioned operation.
MobileNetV2 was trained to learn the features of genuine saffron and identify differences in color, shape, and texture that are indicative of fake saffron. By analyzing two thousand images of both genuine and fake saffron, the model was able to learn to recognize patterns and features that differentiate the two. This allows it to accurately identify genuine saffron and detect any signs of adulteration, such as the presence of artificial colorants or other additives, which can affect the color, shape, and texture of the spice.
The model was trained using the Adam optimizer, a well-liked and efficient optimization technique. Adam utilizes variable learning rates for specific parameters, combining parts of both RMSprop and momentum approaches, enabling it to converge rapidly and effectively on challenging optimization landscapes.
The environment for training such a model was a high-computation NVIDIA T4 GPU from Google Colab It is based on NVIDIA’s Turing architecture and features 16 GB of GDDR6 memory enabling high-speed training for deep learning models along with 16 GB RAM and virtual 80GB of disk space to store and process the data efficiently.
2.4 Data processing
Deep learning models commonly use data augmentation as a method of augmenting datasets. It entails applying transformations to the current data, such as horizontal flipping, color space enhancements, and random cropping, which produce considerable variances in the data. These transformations deal with the invariances that hampered the development of early models for image recognition tasks. The model become more robust and able to handle a variety of scenarios by increasing the training data.
To generate training examples, the model selects photo images from the dataset and applies different changes. When the initial dataset is very small, horizontal, and vertical transformations are utilized to expand the diversity of the dataset. By adjusting, the model can more effectively adapt to various inputs, while zooming the images further improves the model’s comprehension of the data.
Along with a mixture of the methods, vertical image shifts, and random horizontal shifts are used to enhance the data. In addition, random shifts of up to 20% of the image’s width and height and rotations of up to 45 degrees are used. The model becomes more adaptive and precise in identifying different patterns and objects because of the usage of these various augmentations, which ensures that the model is exposed to a wide range of changes.
The Keras Image Generator class in Python is used to implement these enhancements. This class effectively enhances the dataset while saving memory and storage space by efficiently generating the augmented data on-the-fly during training. The model can increase generalization and performance, yielding superior outcomes in a variety of image-related tasks by utilizing data augmentation approaches and the Keras Image Generator class. (Tensor Flow V291, 2022).
Secondly, the data was divided into the train, test, and validation to accurately measure the model performance. Table 3 provides the number of images for each split.
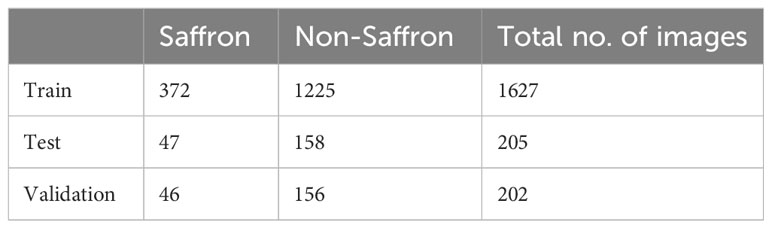
Table 3 Number of images in each directory from authentic and adulterated saffron samples.
The whole data set was 2034 images, and the training of the model used 1627 images, out of which 205 were used for testing and 202 for validation (Table 3). The data is divided into three sets including training, testing, and validation. The amount of data is equal to 80%, 10%, and 10% respectively due to an uneven number of images, and data was divided unequally.
3 Results and discussion
Computer vision techniques have shown strong power to visualize model predictions. It has revealed a useful tool to understand the patterns and relationships in data and to validate the accuracy of the predictions through graphical representations of the output generated by a machine learning model, such as scatter plots or heat maps (Simonyan et al., 2013; Nguyen et al., 2015; Zhou et al., 2016). This can further be used to identify areas for improvement and to make more informed decisions based on the insights gained from the visualizations. In this study, the set of images (Figure 4) showed the features that make the model predict the class of the image. The first image on the left side is the original image, which is the input to the model. The second image is a random feature map learned from the CNN filters, in which light yellow color points at sections that are significant, while the darker color indicates sections that are not in the specific feature. As the layer of CNN has many filters and each one have a feature, they are all combined at the end to make the classification. The third image on the bottom left side of the image is the Class Activation Map (CAM), which shows the section that lights in all featured maps combined to produce the classification. Finally, the bottom right image is the combination of all feature maps superimposed with the original image. This shows the parts of the image that made the model take the decision.
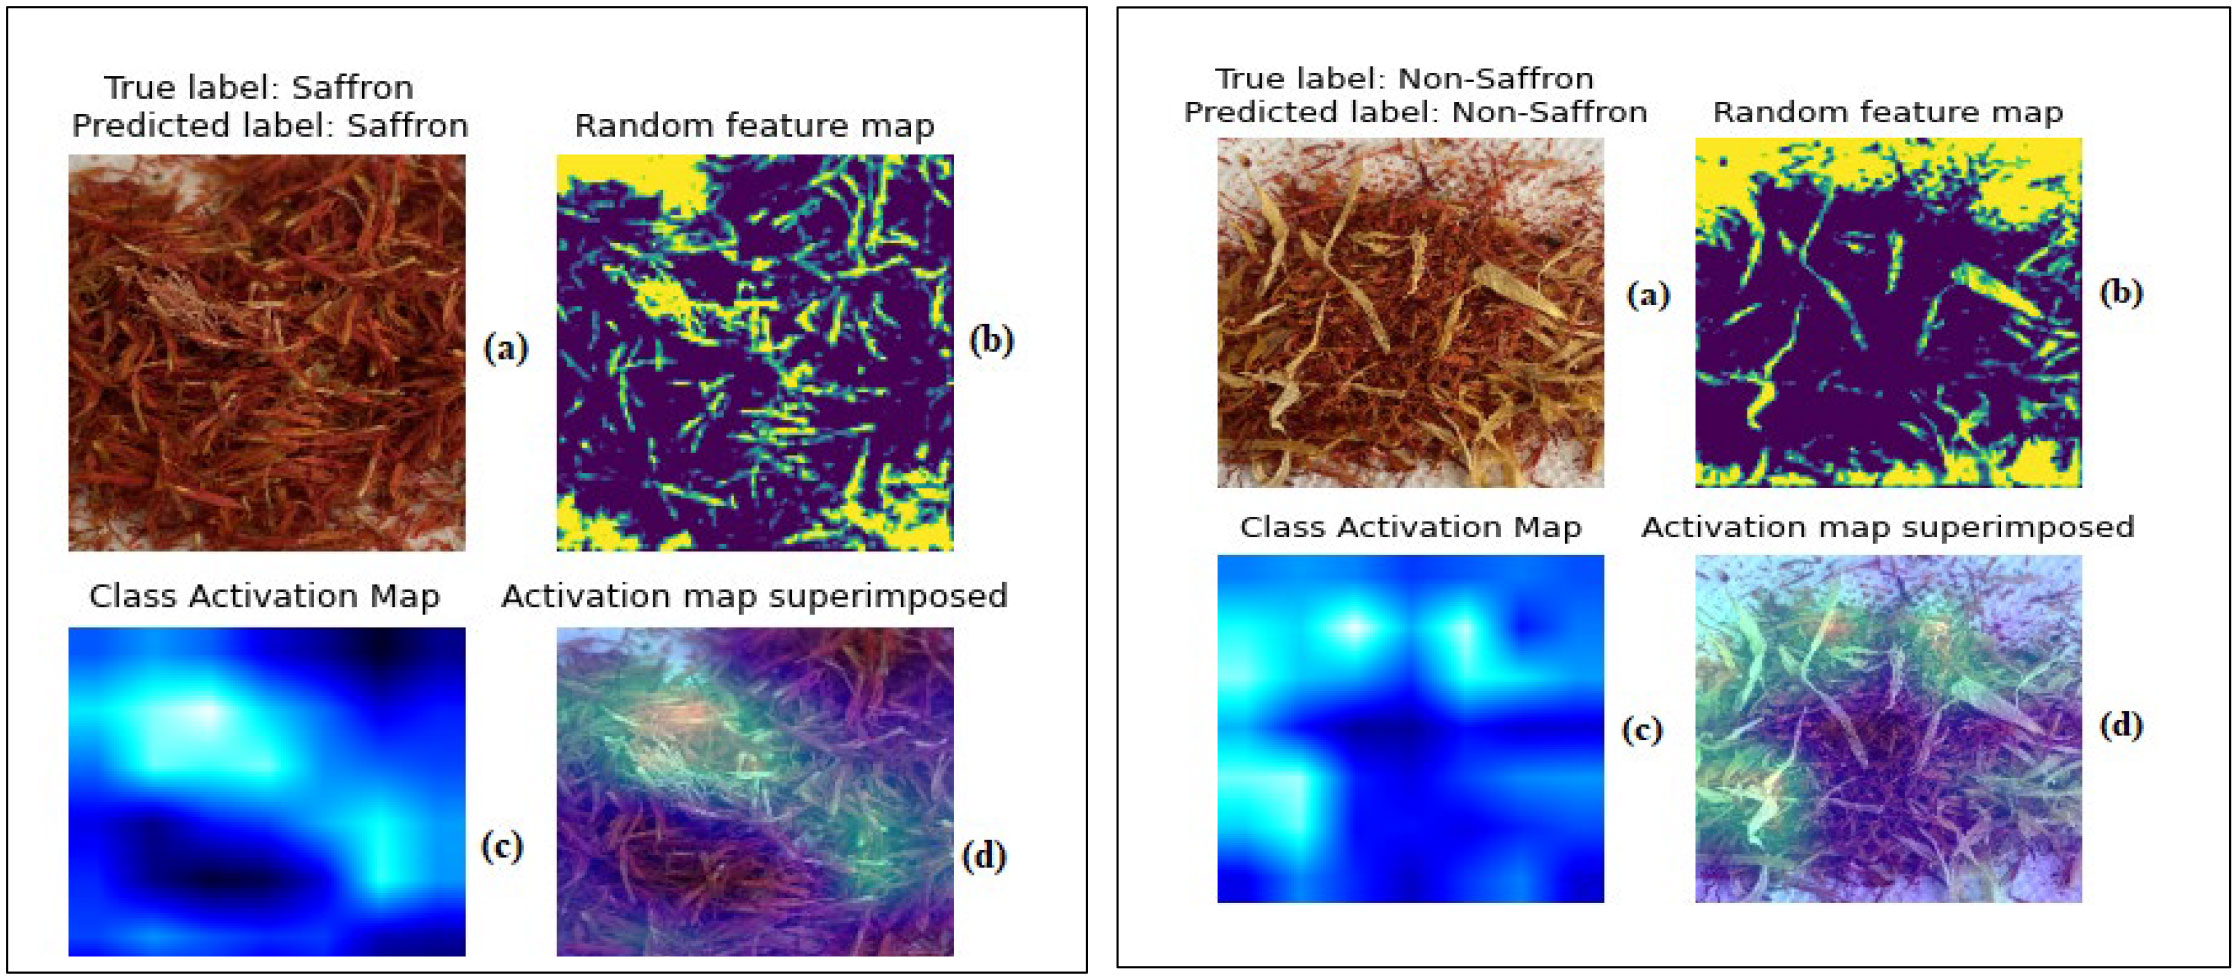
Figure 4 Set of images and activation maps produced on an authentic and fake sample while applying the model.
In (a) the original image is the input for the model. (b) A random feature map from thousands of activation maps. (c) A class activation map is a combination of all feature maps together. (d) The learned feature maps projected to the input image explain the most parts that activate the model to produce the predicted label.
After 5 epochs of training, the model successfully achieved a 99.02% accuracy score (Table 4). However, the model could be limited when handling complex input images. In such a case it may require a lot of ram and graphics memory resources for the training. The next table demonstrates the classification report of the model performance on unseen data (test data).
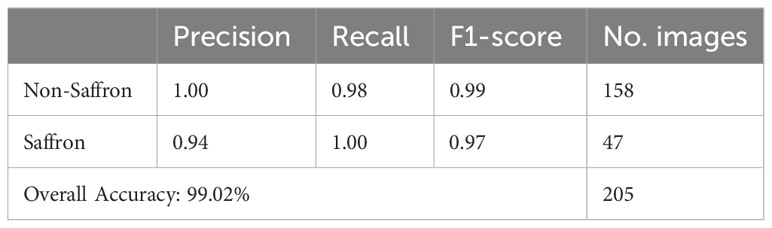
Table 4 The classification report of the model accuracy on 205 test images.
True Positive (TP), False Negative (FN), False Positive (FP), True Negative (TN)
The model provided a high accuracy within a short time, which showed that this type of model can be applied effectively to the identification of saffron. While a fast-quality inspection of food products using computer vision has been mainly focused on color (Al-Marakeby et al., 2013), it has been suggested that deep convolutional networks process objects through three variables: shape, texture, and color (Bianco et al., 2018). Baker et al. (2018) concluded that DCNNs (unlike the human eye that can integrate) are not as accurate at classifying when the need is to target shapes in their entirety. However, saffron appears to be a good food matrix to use with DCNN, regardless of the form, as the model performed well in both whole filament and powder versions. Thus, it is likely that the intrinsic color of saffron is playing an important role in this high performance. More research is needed to verify this with different cultivars of saffron. Furthermore, the fact that similar CNN and DCNN models (Zhong et al., 2021; Lanjewar and Gurav, 2022) have been developed with excellent performance for identifying texture characteristics and other properties of soil and allow their classification, suggests these models can efficiently classify texture of sample materials with different water and mineral content profile. If the latter is confirmed to be the case with the high performance of saffron, it is also safe to expect that similar results could be obtained with trained models for detecting pure herbs of different colors.
MobileNetV2 performs very well on the saffron detection problem for several reasons. Firstly, its lightweight architecture allows it to efficiently process large datasets of saffron images, making it a suitable solution for resource-constrained devices such as mobile phones. Secondly, its use of depth wise separable convolutions allows it to extract features from images with high accuracy and low computation cost. Finally, MobileNetV2 can be trained using transfer learning, which leverages pre-trained networks to improve its accuracy and reduce training time. By combining these features, MobileNetV2 can offer a highly accurate and efficient solution for detecting fake saffron, making it a valuable tool for ensuring the authenticity of saffron products.
The results presented in this study confirm that trained data can achieve a high level of performance under different scenarios. For classifying adulterated saffron Alighaleh et al. (2022) obtained 99.67% accuracy in 36.26 ms using 7 different samples. In our study, with twice the sample volume and different substances, the accuracy levels were similar. Nevertheless, there is a need to test this type of model in larger volumes and optimize the system accordingly. The outlook is promising as the model in its current form already produced high performance. This performance in theory is achieving the ISO requirement of up to 1% adulterant detection (Marieschi et al., 2012), which should be encouraging as a rapid commercial alternative to an official method. Simple detection tools should be given special consideration in current times when production volumes have declined in important areas of the world (e.g. Kashmir, India) and supply chains are fragile and prone to disruption as exemplified during the recent COVID-19 Pandemic (Fujii et al., 2022). Finally, while this work focused on qualitative analysis, further research is warranted to assess its use in combination with techniques such as near-infrared spectroscopy to target quantitative detection that may provide estimates of the levels of adulteration (Li et al., 2020).
4 Conclusion
This study with 205 validated images has shown that a CNN-based model developed with trained data could be easily applied in regular commercial trade operations. Further analysis with more specific levels of contamination may serve to determine the versatility and consistency of the model. The outlook is promising for CNN to be used broadly as a tool to classify spices of high market value given the high accuracy to classify the images. The reason behind this high accuracy still requires confirmation but it is likely that in addition to the intrinsic power of CNN, the texture and color (and not necessarily shape) of saffron are the key variables for the identification of pure samples.
Data availability statement
The original contributions presented in the study are included in the article/supplementary material. Further inquiries can be directed to the corresponding author.
Author contributions
AE and HA contributed to conception and design of the study. HA organized the database. BZ performed the statistical analysis. JF wrote the first draft of the manuscript. AE, BZ, and HA wrote sections of the manuscript. All authors contributed to the article and approved the submitted version.
Acknowledgments
Mr. Khalil Mirza (CEO of Saffrosystems, LLC) was instrumental in this study, particularly in guiding sourcing of the samples and confirming quality traits of the commercial saffron products.
Conflict of interest
The authors declare that the research was conducted in the absence of any commercial or financial relationships that could be construed as a potential conflict of interest.
The author JF declared that they were an editorial board member of Frontiers, at the time of submission. This had no impact on the peer review process and the final decision.
Publisher’s note
All claims expressed in this article are solely those of the authors and do not necessarily represent those of their affiliated organizations, or those of the publisher, the editors and the reviewers. Any product that may be evaluated in this article, or claim that may be made by its manufacturer, is not guaranteed or endorsed by the publisher.
References
Ahmed A. B., Taha R. M., Anuar N., Elias H., Abdullah S., Khan A., et al. (2021). “Saffron as a natural food colorant and its applications,” in Saffron. Ed. Galanakis C. (Cambridge, MA, USA: Academic Press), 221–239. doi: 10.1016/B978-0-12-821219-6.00006-3
Alighaleh P., Khosravi H., Rohani A., Saeidirad M. H., Einafshar S. (2022). The detection of saffron adulterants using a deep neural network approach based on RGB images taken under controlled conditions. Expert Syst. Appl. 198, 116890. doi: 10.1016/j.eswa.2022.116890
Al-Marakeby A., Aly A., Salem F. (2013). Fast quality inspection of food products using computer vision. Int. J. Advanced Res. Comput. Communication Engineering 11, 2278–1021. Available at: https://www.ijarcce.com/upload/2013/november/1-h-ashraf_Marakeby_-fast.pdf.
Andrew G., Thakkar O., McMahan B., Ramaswamy S. (2021). Differentially private learning with adaptive clipping. Adv. Neural Inf. Process. Syst. 34, 17455–17466. Available at: https://proceedings.neurips.cc/paper_files/paper/2021/file/91cff01af640a24e7f9f7a5ab407889f-Paper.pdf.
Baker N., Lu H., Erlkhman G., Kellman P. J. (2018). Deep convolutional networks do not classify based on global object shape. PloS Comput. Biol. 14 (12), e1006613. doi: 10.1371/journal.pcbi.1006613
Bianco S., Cusano C., Napoletano P., Schettini R. (2018). Improving CNN-Based Texture classification by color balancing. J. Imaging 3, 33. doi: 10.3390/jimaging3030033
Elaraby A., Hamdy W., Alanazi S. (2022a). Classification of citrus diseases using optimization deep learning approach. Computational Intelligence and Neurosci. 1687-5265, 2022. doi: 10.1155/2022/9153207
Elaraby A., Hamdy W., Alruwaili M. (2022b). Optimization of deep learning model for plant disease detection using particle swarm optimizer. Computers Mater. Continua 71 (2), 4019–4031. doi: 10.32604/cmc.2022.022161
Fazal M. I., Patel M. E., Tye J., Gupta Y. (2018). The past, present and future role of artificial intelligence in imaging. Eur. J. Radiol. 105, 246–250. doi: 10.1016/j.ejrad.2018.06.020
Fernández J. A. (2004). Biology, biotechnology and biomedicine of saffron. Recent Res. developments Plant Sci. 2, 127–159.
Fujii S., Morita Y., Ohtal T., Uto T., Shoyama Y. (2022). Saffron (Crocus sativus L.) as a valuable spice and food product: a narrative review. Longhua Chin. Med. 5. doi: 10.21037/lcm-22-1
Garcia-Rodriguez M. V., Serrano-Diaz J., Tarantiliz P. A., Lopez-Corcoles H., Carmona M., Alonso G. L. (2014). Determination of saffron quality by the high-performance liquid chromatography. J. Agric. Food Chem. 62 (32), 8068–8074. doi: 10.1021/jf5019356
Gheshm R., Brown R. N. (2021). Growing saffron crocus in the northewaster United States: Effects of winter protection and planting density. HorTechnology 31 (4), 524–531. doi: 10.21273/HORTTECH04836-21
Goyal K., Kumar P., Verma K. (2022). Food adulteration detection using artificial intelligence: A systematic review. Arch. Computat Methods Eng. 29, 397–426. doi: 10.1007/s11831-021-09600-y
Grand View Research. (2020). Saffron market size, share, and trends analysis report and segment forecasts 2020–2027 (Accessed March 15, 2022).
Heidarbeigi K., Mohtasebi S. S., Foroughirad A., Ghasemi-Varnamkhasti M., Rafiee S., Rezaei K. (2015). Detection of adulteration in saffron samples using an electronic nose. Int. J. Food Propert. 18, 1391–1401. doi: 10.1080/10942912.2014.915850
Husaini A., Bhat M., Kamili A., Mir M. (2013). Kashmir saffron in crisis. Curre. Scie. 104, 686–687.
Iymen G., Tanriver G., Hayirlioglu Y. Z., Ergen O. (2020). Artificial intelligence-based identification of butter variations as a model study for detecting food adulteration. Innovative Food Sci. Emerging Technol. 66, 102527. doi: 10.1016/j.ifset.2020.102527
Kalinowska K., Wojnowski W., Tobiszewki M. (2021). Smartphones as tools for equitable food quality assessment. Trends Food Sci. Technol. 111, 271–279. doi: 10.1016/j.tifs.2021.02.068
Khorasany A. R., Hosseinzadeh H. (2016). Therapeutic effects of saffron (Crocus sativus L.) in digestive disorders: a review. Iranian J. basic Med. Sci. 19 (5), 455. Available at: https://www.ncbi.nlm.nih.gov/pmc/articles/PMC4923465/.
Kiani S., Minaei S., Ghasemi-Varnamkhasti M. (2018). Instrumental approaches and innovative systems for saffron quality assessment. J. Food Engineer. 216, 1–10. doi: 10.1016/j.jfoodeng.2017.06.022
Kumari L., Jaiswal P., Tripathy S. S. (2021). Various techniques useful for determination of adulterants in valuable saffron: A review. Trends Food Sci. Technol. 111, 301–321. doi: 10.1016/j.tifs.2021.02.061
Lage M., Cantrell C. L. (2009). Quantification of saffron (Crocus sativus L.) metabolites crocins, picrocrocin, and safranal for quality determination of the spice grown under different environmental Moroccan conditions. Sci. Hortic. 121, 366–373. doi: 10.1016/j.scienta.2009.02.017
Lanjewar M. G., Gurav O. L. (2022). Convolutional neural networks based classifications of soil images. Multimedia Tools applications 81, 10313–10336. doi: 10.1007/s11042-022-12200-y
Li S., Xing B., Lin D., Yi H., Shao Q. (2020). Rapid detection of saffron (Crocus sativus L.) adulterated with lotus stamens and corn stigmas by near-infrared spectroscopy and chemometrics. Ind. Crops Products 152, 112539. doi: 10.1016/j.indcrop.2020.112539
Marieschi M., Torelli A., Renato B. (2012). Quality control of saffron (Crocus sativus L.): Development of SCAR markers for the detection of plant adulterants used as bulking agents. J. Agric. Food Chem. 60, 10998–11004. doi: 10.1021/jf303106r
Moghaddasi M. S. (2010). Saffron chemicals and medicine usage. J. Med. Plants Res. 4 (6), 427–430. doi: 10.5897/JMPR09.001
Moras B., Lofredo L., Rey S. (2018). Quality assessment of saffron (Crocus sativus L.) extracts via UHPLC-DAD-MS analysis and detection of adulteration using gardenia fruit extract (Gardenia jasminoides Ellis). Food Chem. 257, 325–332. doi: 10.1016/j.foodchem.2018.03.025
Nguyen A., Yosinski J., Clune J. (2015). “Deep neural networks are easily fooled: High confidence predictions for unrecognizable images,” in Proceedings of the IEEE conference on computer vision and pattern recognition. IEEE Conference Proceedings. 427–436.
Parihar K., Sharma K., Sankhla M. S., Kumar R. (2020). Forensic identification of fake and genuine saffron (KKESAR) from local market of greater Noida. Forensic Sci. Addict. Res. 5 (2), 401–405. doi: 10.31/fsar.2020.05.000615
Pitsikas N. (2015). The effect of Crocus sativus L. and its constituents on memory: basic studies and clinical applications. Evidence-Based Complementary Altern. Med. 2015, 1–7. doi: 10.1155/2015/926284
Sabatino L., Scordino M., Bargano M., Belligno A., Traulo P., Gagliano G. (2011). HPLC/PDA/ESI-MS evaluation of saffron (Crocus sativus L.) adulteration. Nat. Prod Commun. 6 (12), 1873–1876. doi: 10.1177/1934578X1100601220
Shukla S. K., Iqbal M. (2015). Forensic analysis of the saffron: rapid authenticity testing. Int. J. Res. Appl. Sci. Eng. Technol. (IJRASET) 3 (4), 139–143. doi: 10.22214/IJRASET.2015.307009136
Simonyan K., Vedaldi A., Zisserman A. (2013). Deep inside convolutional networks: Visualising image classification models and saliency maps. arXiv preprint arXiv:1312.6034. doi: 10.48550/arXiv.1312.6034
Tensor Flow V291. (2022). Available at: https://www.tensorflow.org/api_docs/python/tf/keras/preprocessing/image/ImageDataGenerator (Accessed August 22).
United Nations. (2022). Annual international trade statistics. Available at: https://trendeconomy.com./ (Accessed March 15).
Varliklioz S. E., Eksi-Kocak H., Yetim H., Boyaci I. H. (2017). Novel spectroscopic method for determination and quantification of saffron adulteration. Food Anal. Methods 10, 1547–1555. doi: 10.1007/s12161-016-0710-4
Zhang Y., Jiang H., Ye T., Juhas M. (2021). Deep learning for imaging and detection of microorganisms. Trends Microbiol. 29, 569–572. doi: 10.1016/j.tim.2021.01.006
Zhong L., Guo X., Xu Z., Ding M. (2021). Soil properties: their prediction and feature extraction from the LUCAS spectral library using deep convolutional neural networks. Geoderma 402, 115366. doi: 10.1016/j.geoderma.2021.115366
Keywords: classification, Convolutional Neural Networks (CNN), Deep Neural Networks (DNN), red spices, saffron
Citation: Elaraby A, Ali H, Zhou B and Fonseca JM (2023) Digging for gold: evaluating the authenticity of saffron (Crocus sativus L.) via deep learning optimization. Front. Hortic. 2:1225683. doi: 10.3389/fhort.2023.1225683
Received: 19 May 2023; Accepted: 29 August 2023;
Published: 29 September 2023.
Edited by:
Marwa Moumni, Marche Polytechnic University, ItalyReviewed by:
Mehdi Hosseinifarahi, Islamic Azad University, IranFrancesco Genovese, University of Basilicata, Italy
Copyright © 2023 Elaraby, Ali, Zhou and Fonseca. This is an open-access article distributed under the terms of the Creative Commons Attribution License (CC BY). The use, distribution or reproduction in other forums is permitted, provided the original author(s) and the copyright owner(s) are credited and that the original publication in this journal is cited, in accordance with accepted academic practice. No use, distribution or reproduction is permitted which does not comply with these terms.
*Correspondence: Ahmed Elaraby, YWhtZWQuZWxhcmFieUBzdnUuZWR1LmVn; Hussein Ali, aHVzc2Vpbi5tbC5lbmdAZ21haWwuY29t