- 1Institute of Health Data Analytics and Statistics, College of Public Health, National Taiwan University, Taipei, Taiwan
- 2Master of Public Health Degree Program, College of Public Health, National Taiwan University, Taipei, Taiwan
Introduction: After the era of genome-wide association studies (GWAS), thousands of genetic variants have been identified to exhibit main effects on human phenotypes. The next critical issue would be to explore the interplay between genes, the so-called “gene-gene interactions” (GxG) or epistasis. An exhaustive search for all single-nucleotide polymorphism (SNP) pairs is not recommended because this will induce a harsh penalty of multiple testing. Limiting the search of epistasis on SNPs reported by previous GWAS may miss essential interactions between SNPs without significant marginal effects. Moreover, most methods are computationally intensive and can be challenging to implement genome-wide.
Methods: I here searched for GxG through variance quantitative trait loci (vQTLs) of 29 continuous Taiwan Biobank (TWB) phenotypes. A discovery cohort of 86,536 and a replication cohort of 25,460 TWB individuals were analyzed, respectively.
Results: A total of 18 nearly independent vQTLs with linkage disequilibrium measure r2 < 0.01 were identified and replicated from nine phenotypes. 15 significant GxG were found with p-values <1.1E-5 (in the discovery cohort) and false discovery rates <2% (in the replication cohort). Among these 15 GxG, 11 were detected for blood traits including red blood cells, hemoglobin, and hematocrit; 2 for total bilirubin; 1 for fasting glucose; and 1 for total cholesterol (TCHO). All GxG were observed for gene pairs on the same chromosome, except for the APOA5 (chromosome 11)—TOMM40 (chromosome 19) interaction for TCHO.
Discussion: This study provided a computationally feasible way to search for GxG genome-wide and applied this approach to 29 phenotypes.
1 Introduction
Over the past decade, thousands of genetic variants have been found to be responsible for disease risk (Uffelmann et al., 2021). The next critical topic is to explore “gene-gene interaction” (GxG), also known as “epistasis,” indicating that “the effect of a gene on a phenotype is dependent on another gene.” The importance of GxG has widely been recognized (Van Steen, 2012). However, due to the curse of multiplicity, GxG remains challenging to identify and replicate (Moore and Williams, 2009).
Some statistical methods have been proposed for identifying GxG (Ritchie et al., 2003; Lou et al., 2007). For example, by prioritizing single-nucleotide polymorphisms (SNPs) with prior biological knowledge, Ma et al. identified an interaction between the LIPC (on chromosome 15) and HMGCR (on chromosome 5) genes influencing high-density lipoprotein cholesterol (HDL-C) levels (Ma et al., 2015). To alleviate the penalty of multiple testing, Ma et al. only tested SNP pairs supported by prior knowledge, including the quantitative trait loci (QTLs) identified from genome-wide association studies (GWAS) of lipid traits.
The multifactor dimensionality reduction (MDR) approach is well-known for detecting GxG for binary disease outcomes (Ritchie et al., 2003). This method was later generalized for both binary and continuous phenotypes (Lou et al., 2007). However, the permutation testing to assess the statistical significance of GxG in MDR is computationally intensive (Pattin et al., 2009). It is impractical to analyze genome-wide pairwise SNPs through this MDR approach (Abo Alchamlat and Farnir, 2017). Although some computationally efficient methods were derived by extending MDR, they were mainly designed for case-control studies (Pattin et al., 2009; Abo Alchamlat and Farnir, 2017). It remains a challenging task to identify GxG from continuous traits on a genome-wide scale.
In addition to MDR, Machine learning (ML) approaches such as “random forests” (Botta et al., 2014) and “neural networks” (Motsinger et al., 2007) were also proposed to explore GxG. However, training the ML models is computationally expensive, and a genome-wide search for GxG is implausible. Therefore, investigators usually perform a variable selection before searching for GxG (Wu et al., 2018). Hence, critical SNPs can be missed during the variable selection process (Chattopadhyay and Lu, 2019).
The above-mentioned sophisticated models are difficult to implement on hundreds of thousands of SNPs. Another computationally feasible method is prioritizing SNPs via variance quantitative trait loci (vQTLs) (Marderstein et al., 2021; Westerman et al., 2022). Leveraging phenotypic variability across the three genotypes of an SNP can facilitate the discoveries of GxG or gene-environment interactions (GxE). In this study, I searched for GxG through vQTLs of 29 continuous Taiwan Biobank (TWB) phenotypes.
2 Materials and methods
2.1 Taiwan Biobank data
TWB was approved by the Institutional Review Board on Biomedical Science Research/IRB-BM, Academia Sinica, and the Ethics and Governance Council of Taiwan Biobank, Taiwan. TWB approved my application to access the data on 18 February 2020 (application number: TWBR10810-07). The current work further received approval from the Research Ethics Committee of the National Taiwan University Hospital (NTUH-REC no. 201805050RINB).
Since October 2012, TWB has recruited Taiwan residents aged 30 to 70 and collected their genomic and lifestyle factors (Chen et al., 2016). After signing informed consent, community-based volunteers took physical examinations and provided blood and urine samples. TWB health professionals collected lifestyle information through a face-to-face interview with each participant.
As of March 2022, 27,719 and 103,332 individuals (aged 30–70 years) have been whole-genome genotyped by the TWB 1.0 and TWB 2.0 genotyping arrays, respectively. The TWB 1.0 array was designed for Taiwan’s Han Chinese, running on the Axiom Genome-Wide Array Plate System (Affymetrix, Santa Clara, CA). The TWB 2.0 array was developed according to the experience of designing the TWB 1.0 array and the next-generation sequencing of ∼1,000 TWB individuals. These two arrays were released in April 2013 and August 2018, respectively. Because the sample size of “individuals genotyped by the TWB 2.0 array” (called “the TWB2 cohort”) was larger than that genotyped by the TWB 1.0 array (called “the TWB1 cohort”), the TWB2 cohort was treated as a discovery set. In contrast, the TWB1 cohort was used as a replication set.
A total of 1,462 individuals were genotyped by both arrays. To ensure that the replication set was independent of the discovery set, I removed these 1,462 individuals from the TWB2 cohort. I also tried to exclude individuals with more than 10% missing in their genotype calls, where 10% is a commonly adopted cutoff in quality control (Band et al., 2019). Nonetheless, no individuals were removed due to this criterion.
To remove cryptic relatedness, I calculated PI-HAT = Probability (IBD = 2) + 0.5
TWB 2.0 and TWB 1.0 arrays comprised 648,611 and 632,172 autosomal SNPs, respectively. I excluded 17,419 SNPs with Hardy-Weinberg test p-values <5.7 × 10⁻⁷ (WTCCC, 2007) and 22,614 SNPs with genotyping rates <95% from the TWB2 cohort and removed 6,900 SNPs with Hardy-Weinberg test p values <5.7 × 10⁻⁷ (WTCCC, 2007) and 27,628 SNPs with genotyping rates <95% from the TWB1 cohort. The remaining 608,578 TWB2 SNPs and 597,644 TWB1 SNPs were used to construct ancestry principal components (PCs).
The Michigan Imputation Server (https://imputationserver.sph.umich.edu/index.html) was further used to impute genotypes. The East Asian population from the 1,000 Genomes Phase 3 v5 was chosen as the reference panel. I removed SNPs with low imputation information scores (R-square <0.8), with imputation rates <95%, or with Hardy-Weinberg test p-values <5.7 × 10⁻⁷ (WTCCC, 2007). The TWB2 and TWB1 individuals were finally genotyped (or imputed) on 6,546,183 and 7,433,014 autosomal SNPs, respectively.
With a larger sample size, TWB2 (n = 86,536) was treated as the discovery cohort. A total of 4,807,430 TWB2 SNPs with minor allele frequencies (MAFs)
(A) Six lung function traits: vital capacity, tidal volume, inspiratory reserve volume, expiratory reserve volume, forced vital capacity, and forced expiratory volume in 1 s.
(B) Four lipid traits: HDL, low-density lipoprotein cholesterol (LDL), total cholesterol (TCHO), and triglyceride (TG).
(C) Five obesity traits: BMI, body fat percentage (BFP), waist circumference (WC), hip circumference (HC), and waist-hip ratio (WHR).
(D) Five blood traits: red blood cells (RBC), white blood cells (WBC), platelets, hemoglobin (HB), and hematocrit (HCT).
(E) Three kidney traits: Creatinine, uric acid (UA), blood urea nitrogen.
(F) Two liver traits: total bilirubin (TB) and albumin.
(G) Two hypertension traits: diastolic and systolic blood pressure levels.
(H) Two diabetes traits: fasting glucose (FG) and glycated hemoglobin (HbA1c).
2.2 Variance quantitative trait loci (vQTLs)
The total number of pairwise interaction tests among 4,807,430 SNPs is very huge. Considering 29 phenotypes, conventionally, investigators need to perform
where
I obtained
2.3 Genome-wide vQTL search for 29 TWB phenotypes
To provide results robust to outliers and the distributions of traits, I performed the “rank-based inverse normal transformation” (RINT) transformation (McCaw et al., 2020) on each trait before the vQTL analysis. RINT-trait was transformed to be normally distributed through this step. Subsequently, I obtained “genotypes-and-covariates adjusted RINT-trait” via the residuals of regressing RINT-trait on genotypes and covariates. Specifically, for each SNP, I adjusted RINT-trait with genotype effects as two dummy variables and covariates, including sex (male vs. female), age (in years), body mass index (BMI, in kg/m2), performing regular exercise (yes vs. no), educational attainment (an integer from 1 to 7), smoking status (yes vs. no), drinking status (yes vs. no), and the first 10 ancestry PCs.
The abovementioned covariates are commonly adjusted for continuous phenotypes, because each can influence the phenotypes to some extent (Lin et al., 2020b; Lin, 2022c). Current smoking indicated “having smoked cigarettes for at least 6 months and having not quit smoking when joining the TWB. Drinking was defined as “having a weekly intake of more than 150 mL of alcoholic beverages for at least 6 months and having not stopped drinking when joining the TWB.” Regular exercise was defined as “performing exercise lasting for 30 min thrice a week.” Educational attainment was an integer ranging from 1 to 7: 1 (illiterate), 2 (no formal education but literate), 3 (primary school graduate), 4 (junior high school graduate), 5 (senior high school graduate), 6 (college graduate), and 7 (Master’s or higher degree). When analyzing the five obesity traits (BMI, BFP, WC, HC, and WHR), BMI was excluded from the covariates.
Through the above step, I obtained the “genotypes-and-covariates adjusted RINT-trait,” denoted as “
This scale test for vQTL identification is not novel. Several studies have previously introduced it (Pare et al., 2010; Soave et al., 2015; Soave and Sun, 2017; Staley et al., 2022; Westerman et al., 2022). Some investigators used Levene’s statistics (Levene, 1960) to test for equal variance (Pare et al., 2010; Westerman et al., 2022), while others reformulated the concept to a regression framework (Soave et al., 2015; Soave and Sun, 2017; Staley et al., 2022). However, these two approaches are conceptually identical. The workflow shown here is based on the regression framework with the potential to allow for continuous exposures (Soave et al., 2015; Soave and Sun, 2017; Staley et al., 2022). The R code to implement this regression for vQTL testing can be downloaded from https://github.com/WanYuLin/Univariate-scale-test-UST.
I analyzed 4,807,430 SNPs with MAFs
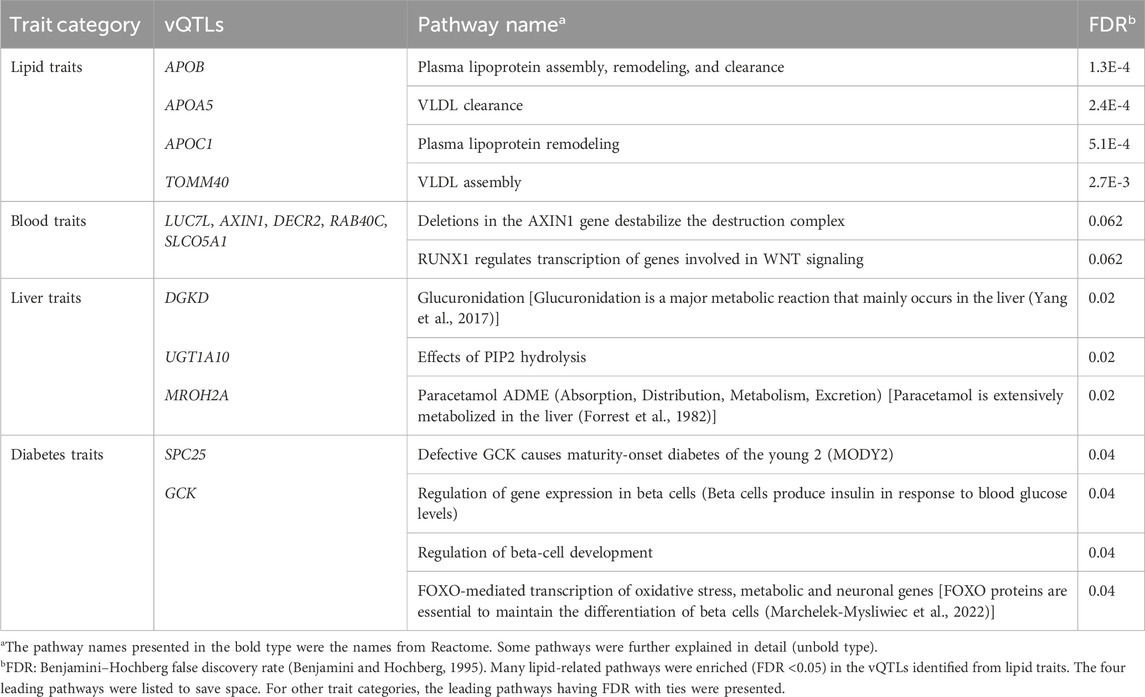
Based on the replicated vQTLs, I then performed an over-representation analysis on the Reactome pathway webpage (Fabregat et al., 2017) (https://reactome.org/). Over-representation analysis assesses whether some Reactome pathways are enriched (over-represented) in the vQTLs identified within the same trait category. It answers the question, “Do the vQTLs from a trait category contain more proteins for a certain pathway than that is expected by chance?” This over-representation test generates a p-value based on the hypergeometric distribution, which is then corrected by the Benjamini–Hochberg false discovery rate (FDR) procedure (Benjamini and Hochberg, 1995) (https://reactome.org/userguide/analysis).
2.4 Simulation studies
Although the scale test is not novel, I still conducted a simulation study to assess its power of detecting GxG, given the sample sizes of TWB2 and TWB1. Without loss of generality, four SNPs (rs150856817 on chromosome 2, rs2075291 and rs662799 on chromosome 11, and rs4144003 on chromosome 16) were, in turn (one by one), regarded as SNP2. The TWB2 and TWB1 SNPs on chromosome 1 were, in turn, treated as SNP1. As derived by Equation 2,
where
(I) Without SNP main effects: By specifying
(II) With SNP main effects: By specifying
To sum up, a total of
2.5 GxG analysis for any two vQTL SNPs
For any two vQTL SNPs, RINT-trait was regressed on the numbers of minor alleles (0, 1, or 2) of the two SNPs and their product term (interaction term) while adjusting for the same covariates: sex (male vs. female), age (in years), BMI (in kg/m2), performing regular exercise (yes vs. no), educational attainment (an integer from 1 to 7), smoking status (yes vs. no), drinking status (yes vs. no), and the first 10 ancestry PCs. Similarly, when analyzing the five obesity traits (BMI, BFP, WC, HC, and WHR), BMI was excluded from the covariates. To avoid the multicollinearity problem, I calculated the variance inflation factor (VIF) of each regression model using the R package “car” (Fox and Weisberg, 2018). A VIF <5 was considered acceptable, which was commonly used as the VIF cutoff value (Rogerson, 2001).
3 Results
3.1 Simulation results
Figures 1, 2 show the quantile-quantile (QQ) plots and power curves of the vQTL method, where the power was evaluated at
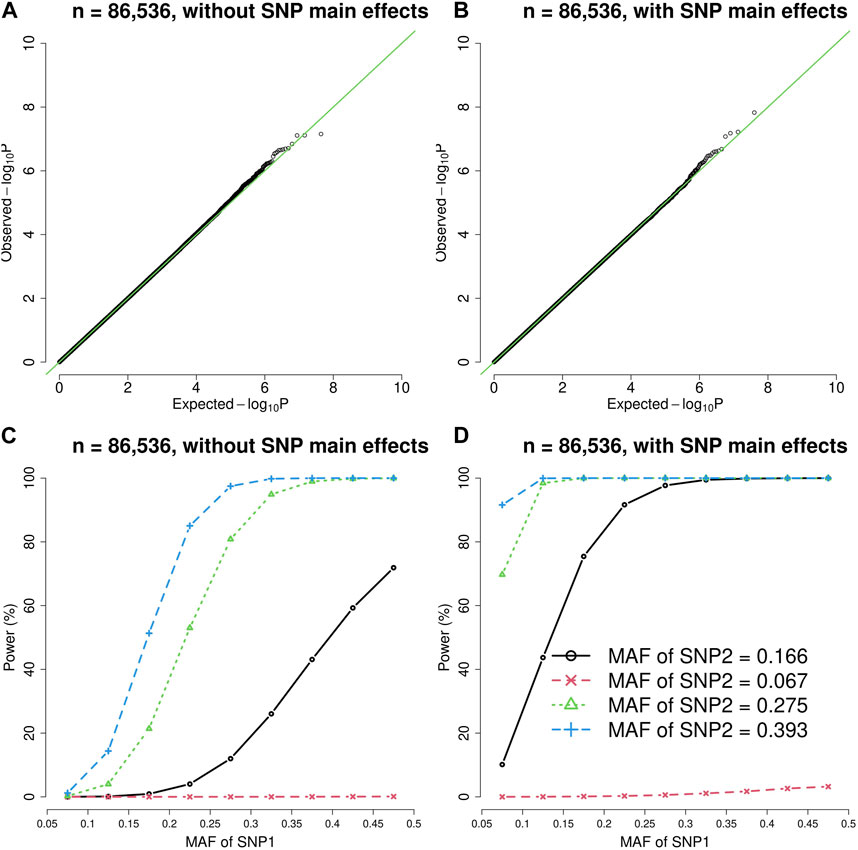
FIGURE 1. The quantile-quantile (QQ) plots and power curves of the vQTL method when n = 86,536. The figures in the top row are QQ plots in the absence of epistasis, without SNP main effects (A) and with SNP main effects (B). The bottom row shows the power curves (significance level = 3.6E-10), without SNP main effects (C) and with SNP main effects (D). As expected, larger MAF at SNP1 or SNP2 boosted the statistical power.
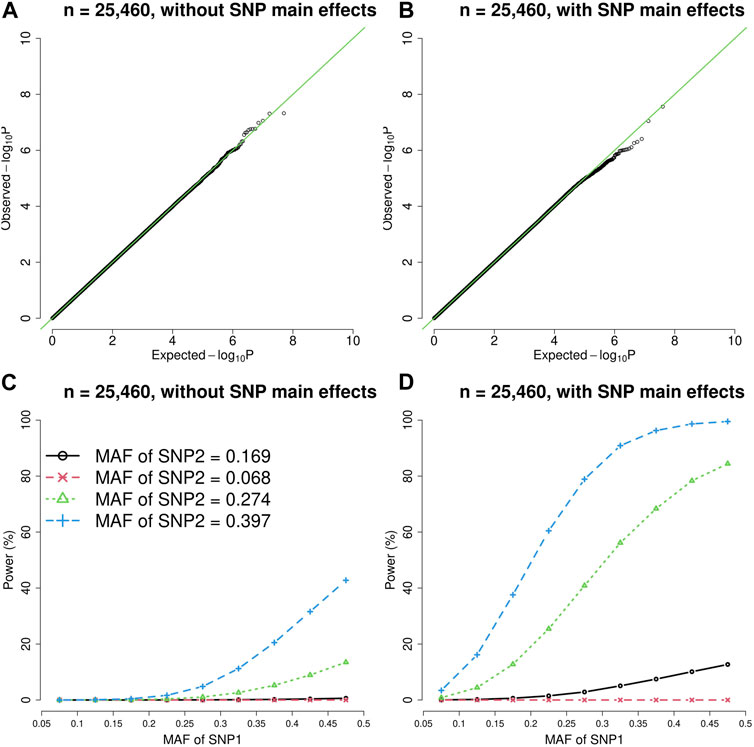
FIGURE 2. The quantile-quantile (QQ) plots and power curves of the vQTL method when n = 25,460. The figures in the top row are QQ plots in the absence of epistasis, without SNP main effects (A) and with SNP main effects (B). The bottom row shows the power curves (significance level = 3.6E-10), without SNP main effects (C) and with SNP main effects (D). As expected, larger MAF at SNP1 or SNP2 boosted the statistical power.
As shown by Figures 1, 2, the presence of SNP main effects boosted the statistical power (D compared with C) while preserving the validity of the vQTL method (B). As expected, a larger MAF at SNP1 or SNP2 also increased the power. Moreover, the vQTL method is also capable of detecting “pure epistasis” (without individual SNP main effects) (Russ et al., 2022), as demonstrated by Figures 1, 2C.
3.2 Scale test to identify vQTLs
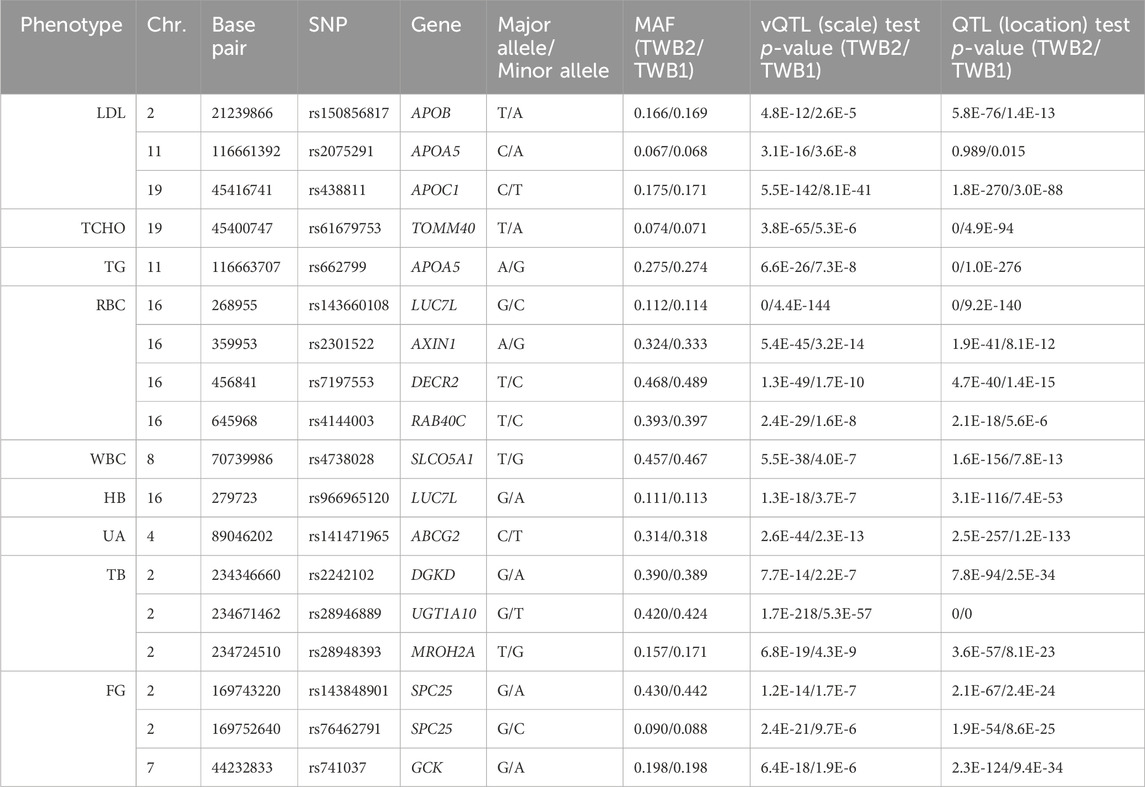
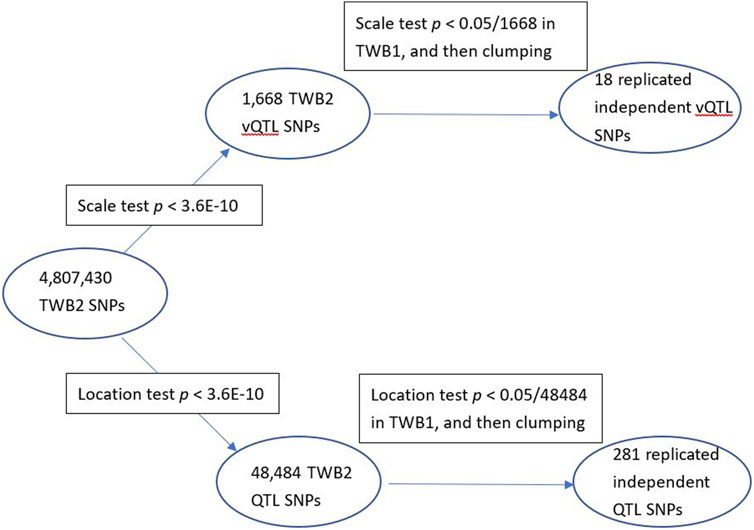
I identified 1,668 vQTL SNPs from all 29 TWB2 phenotypes (p < 3.6E-10). I then performed the scale test on these 1,668 SNPs using the TWB1 cohort. If the p-value <0.05/1,668 = 3.0E-5, the SNP was considered to be successfully replicated in the TWB1. I further used the PLINK clumping command (Purcell et al., 2007) to find 18 nearly independent vQTL SNPs with linkage disequilibrium measure r2 < 0.01 (Table 1). Only 9 out of the 29 phenotypes demonstrated evidence of vQTLs, including three lipid traits: LDL (3 vQTLs), TCHO (1 vQTL), and TG (1 vQTL); three blood traits: RBC (4 vQTLs), WBC (1 vQTL), and HB (1 vQTL); a kidney trait: UA (1 vQTL); a liver trait: TB (3 vQTLs); and a diabetes trait: FG (3 vQTLs). Except for APOA5-rs2075291, all vQTLs were also QTLs (the last column of Table 1).
Five vQTLs identified from lipid traits are located in the APOB, APOA5, APOC1, and TOMM40 genes (Table 1). Many of these vQTL SNPs have been reported to be associated with complex diseases or to exhibit interactions with other SNPs. For example, APOA5-rs662799 presented a solid association with TG levels in various ethnicity samples (Liu et al., 2012), and this SNP was identified as a TG-vQTL and a TG-QTL through my analysis (Table 1). Korean data showed that the two vQTL SNPs in the APOA5 gene, rs2075291 and rs662799 (Table 1), were associated with increased arterial stiffness and decreased adiponectin levels (Kim et al., 2018). 13 Alzheimer’s disease (AD) GWAS cohorts demonstrated that the vQTL SNP in the APOC1 gene, rs438811, significantly interacted with the APOE-ε4 allele. Carrying one minor allele T of rs438811 increased the AD risk by 26.75% in APOE-ε4 carriers (Zhang et al., 2018). Data recruited from China’s Second Affiliated Hospital of Xi’an Jiaotong University showed that AXIN1-rs2301522 was significantly associated with the risk of osteoporosis (Cui et al., 2022).
3.3 Location tests to identify QTLs
While vQTLs were searched through the scale test, QTLs were identified by the location test (testing whether the phenotype mean was dependent on the genotypes) (Staley et al., 2022). Some previous searches for genome-wide epistasis were based on QTLs (Bocianowski, 2013; Laurie et al., 2014; Yang et al., 2018). As a comparison, I also searched for epistasis through the QTL approach as follows. Specifically, I regressed RINT-trait on the number of minor alleles (0, 1, or 2) for each SNP respectively (one SNP at a time) while adjusting for the same 17 covariates, including sex (male vs. female), age (in years), BMI (in kg/m2), performing regular exercise (yes vs. no), educational attainment (an integer from 1 to 7), smoking status (yes vs. no), drinking status (yes vs. no), and the first 10 ancestry PCs. The R code for QTL testing can also be downloaded from https://github.com/WanYuLin/Univariate-scale-test-UST.
I found 48,484 QTL SNPs (p < 0.05/(4,807,430
3.4 Results of GxG analysis for any two vQTL SNPs
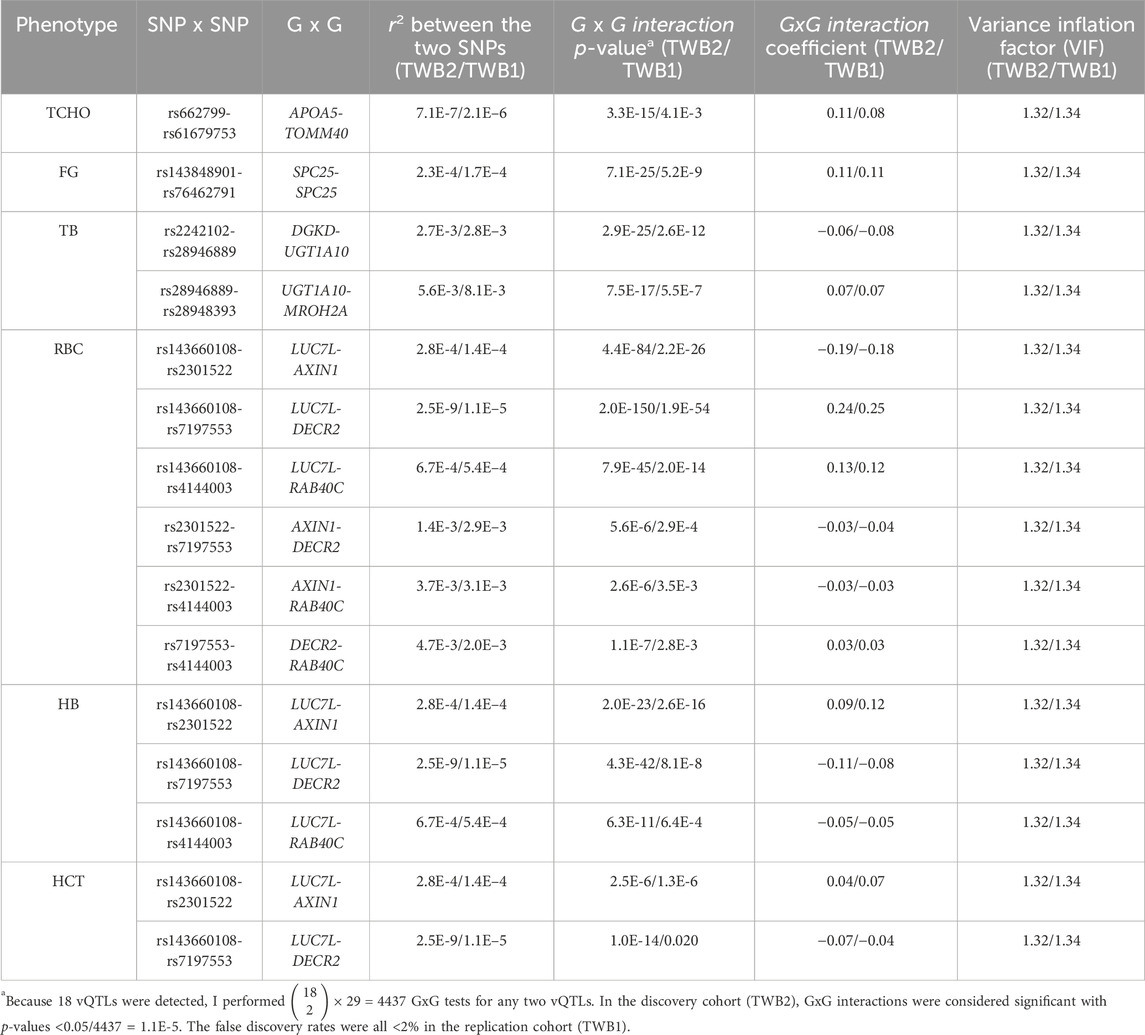
According to the 18 vQTLs listed in Table 1,
Figures 4–6 show the GxG interaction plots for TCHO (1 GxG), FG (1 GxG), TB (2 GxG), RBC (6 GxG), HB (3 GxG), and HCT (2 GxG). The y-axis represents the averages of RINT-trait of nine genotype combinations of two SNPs. Lines with different slopes suggest that the effect of an SNP depends on the genotype of another SNP, which is a clue of GxG. Nonetheless, these interaction plots may not completely correspond to the GxG interaction p-values (Table 2). Unlike the epistasis test results (Table 2), these plots are descriptive summaries without adjusting for any covariate. For example, lines converging at genotype GG of rs2301522 (Figure 4E) represented that individuals with rs2301522-GG had similar RBC, while individuals with rs2301522-AA (or rs2301522-AG) had divergent RBC depending on rs143660108’s genotypes. Lines showing crosscut (Figure 5E) indicated “cross-over interaction,” meaning that rs143660108’s genotypes with the larger mean HB switched over at rs2301522-GG.
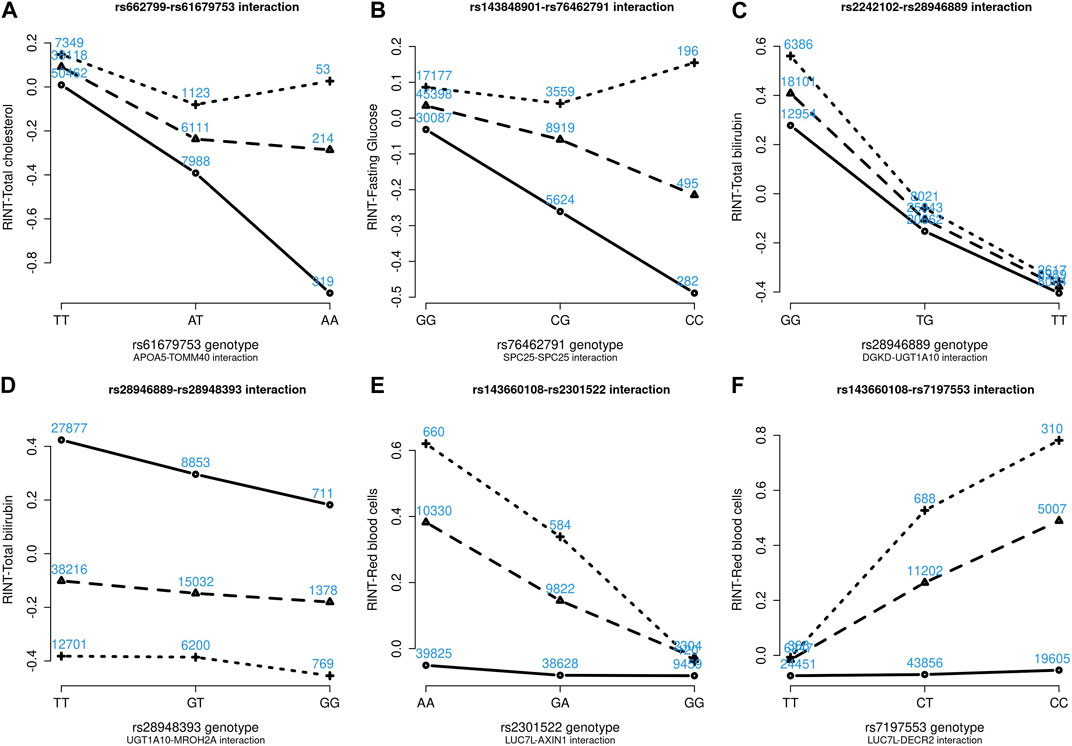
FIGURE 4. Six GxG interaction plots for total cholesterol (A), fasting glucose (B), total bilirubin (C, D), and red blood cells (E, F). (A) Represents rs662799-rs61679753 interaction plot combining the TWB2 and TWB1 cohorts, where the x-axis denotes the three genotypes of rs61679753, and the y-axis calibrates the mean RINT-total cholesterol. The solid, dashed, and dotted lines mark the three genotypes of rs662799: AA (two major alleles), AG, and GG (two minor alleles), respectively. The blue number shown around each point is the sample size of that genotype combination. Other plots were made similarly.
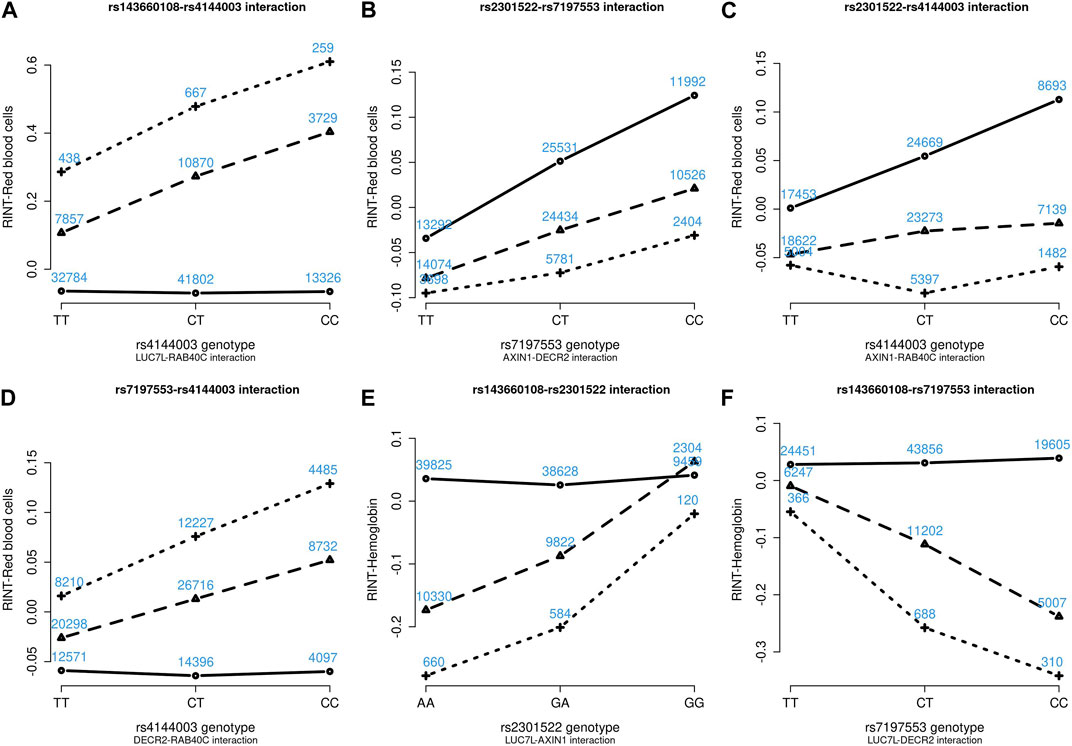
FIGURE 5. Six GxG interaction plots for red blood cells (A–D) and hemoglobin (E, F). (A) Represents rs143660108-rs4144003 interaction plot combining the TWB2 and TWB1 cohorts, where the x-axis denotes the three genotypes of rs4144003, and the y-axis calibrates the mean RINT-red blood cells. The solid, dashed, and dotted lines mark the three genotypes of rs143660108: GG (two major alleles), CG, and CC (two minor alleles), respectively. The blue number shown around each point is the sample size of that genotype combination. Other plots were made similarly.
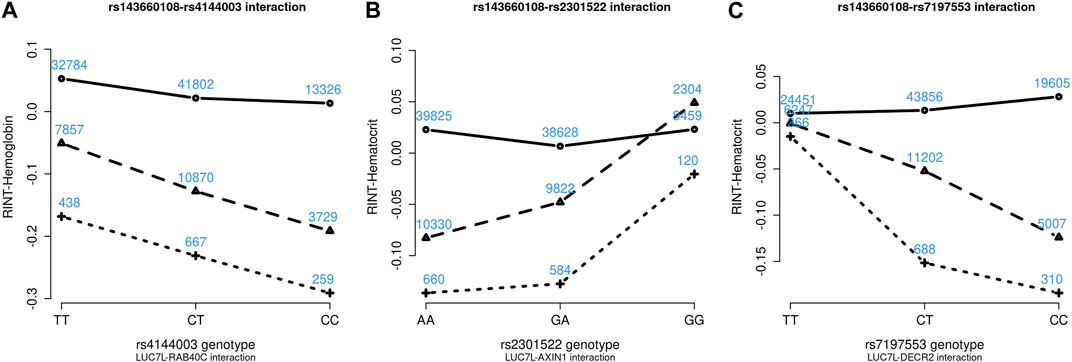
FIGURE 6. Three GxG interaction plots for hemoglobin (A) and hematocrit (B, C). (A) Represents rs143660108-rs4144003 interaction plot combining the TWB2 and TWB1 cohorts, where the x-axis denotes the three genotypes of rs4144003, and the y-axis calibrates the mean RINT-hemoglobin. The solid, dashed, and dotted lines mark the three genotypes of rs143660108: GG (two major alleles), CG, and CC (two minor alleles), respectively. The blue number shown around each point is the sample size of that genotype combination. Other plots were made similarly.
All GxG were observed for gene pairs on the same chromosome, except for the APOA5 (chromosome 11)—TOMM40 (chromosome 19) interaction for TCHO. Both APOA5 and TOMM40 are involved in lipid metabolism (Hishida et al., 2014). The GxG analysis showed that minor alleles of APOA5-rs662799 and TOMM40-rs61679753 exhibited significant synergistic interaction on TCHO (Figure 4A).
Because all phenotypes were RINT-transformed before the analysis, the 15 GxG interaction coefficients (Table 2) could be directly compared. Both cohorts suggested that LUC7L-rs143660108 and DECR2-rs7197553 presented the most substantial interaction on RBC. The minor alleles of these two SNPs exhibited a notable synergistic interaction on RBC (Figure 4F).
3.5 Reactome pathway analysis results
Table 3 shows the Reactome pathway analysis results on genes identified within the same trait category. Many lipid-related pathways were enriched (FDR <0.05) in the vQTLs identified from lipid traits (APOB, APOA5, APOC1, and TOMM40). “Glucuronidation” and “Paracetamol ADME” (Absorption, Distribution, Metabolism, Excretion) pathways were over-represented in the vQTLs of liver traits (DGKD, UGT1A10, and MROH2A). Glucuronidation is a major metabolic reaction in the liver (Yang et al., 2017), while paracetamol is also extensively metabolized in this organ (Forrest et al., 1982). Pathways related to beta cells were enriched in diabetes’ vQTLs (SPC25 and GCK). Beta cells are critical to diabetes by producing insulin to control blood glucose levels (Cerf, 2013). These pathway analysis results showed that the vQTLs found in this study were highly relevant to the traits.
4 Discussion
In this work, 11 GxG were detected for blood traits including RBC, HB, and HCT; 2 for TB (liver trait); 1 for FG (diabetes trait); and 1 for TCHO (lipid trait). Among the 15 significant GxG, 8 demonstrated synergistic interaction effects, while the other 7 GxG exhibited antagonistic interaction effects. The interaction directions for 15 GxG were consistent across the two TWB cohorts (Table 2).
A computationally feasible GxG approach will facilitate the discovery of critical epistasis. This study provided a viable way to search for epistasis genome-wide, and I have applied this approach to 29 phenotypes. With this vQTL method, SNPs presenting epistasis will not be overlooked because of the lack of marginal effects.
The vQTL method can identify interactions with marginal effects (Figures 1, 2D) and can also detect pure epistasis (Figures 1, 2C). As derived by Equation 2,
Although the associations between diseases and low-frequency or rare variants have been investigated over the past decade (Bomba et al., 2017), I here only analyzed SNPs with MAFs
Data availability statement
The individual-level Taiwan Biobank data supporting the findings in this study are available upon application to Taiwan Biobank (https://www.twbiobank.org.tw/new_web/). Taiwan Biobank approved my application to access the data on February 18, 2020 (application number: TWBR10810-07; principal investigator: W-YL).
Ethics statement
TWB was approved by the Institutional Review Board on Biomedical Science Research/IRB-BM, Academia Sinica, and the Ethics and Governance Council of Taiwan Biobank, Taiwan. TWB approved the application to access the data on February 18, 2020 (application number: TWBR10810-07). The current work further received approval from the Research Ethics Committee of the National Taiwan University Hospital (NTUH-REC no. 201805050RINB).
Author contributions
W-YL: Conceptualization, Data curation, Formal Analysis, Funding acquisition, Investigation, Methodology, Project administration, Resources, Software, Supervision, Validation, Visualization, Writing–original draft, Writing–review and editing.
Funding
The author(s) declare financial support was received for the research, authorship, and/or publication of this article. This study was supported by the National Science and Technology Council of Taiwan (grant number 112-2628-B-002-024-MY3) and the National Taiwan University (grant number NTU-CDP-112L7776).
Acknowledgments
I would like to thank the reviewers for their insightful and constructive comments, and the Taiwan Biobank for approving my application to access the data.
Conflict of interest
The author declares that the research was conducted in the absence of any commercial or financial relationships that could be construed as a potential conflict of interest.
Publisher’s note
All claims expressed in this article are solely those of the authors and do not necessarily represent those of their affiliated organizations, or those of the publisher, the editors and the reviewers. Any product that may be evaluated in this article, or claim that may be made by its manufacturer, is not guaranteed or endorsed by the publisher.
References
Abo Alchamlat, S., and Farnir, F. (2017). KNN-MDR: a learning approach for improving interactions mapping performances in genome wide association studies. BMC Bioinforma. 18, 184. doi:10.1186/s12859-017-1599-7
An, J. Y., Gharahkhani, P., Law, M. H., Ong, J. S., Han, X. K., Olsen, C. M., et al. (2019). Gastroesophageal reflux GWAS identifies risk loci that also associate with subsequent severe esophageal diseases. Nat. Commun. 10, 4219. doi:10.1038/s41467-019-11968-2
Band, G., Le, Q. S., Clarke, G. M., Kivinen, K., Hubbart, C., Jeffreys, A. E., et al. (2019). Insights into malaria susceptibility using genome-wide data on 17,000 individuals from Africa, Asia and Oceania. Nat. Commun. 10, 5732. doi:10.1038/s41467-019-13480-z
Benjamini, Y., and Hochberg, Y. (1995). Controlling the false discovery rate: a practical and powerful approach to multiple testing. J. R. Stat. Soc. B 57, 289–300. doi:10.1111/j.2517-6161.1995.tb02031.x
Bocianowski, J. (2013). Epistasis interaction of QTL effects as a genetic parameter influencing estimation of the genetic additive effect. Genet. Mol. Biol. 36, 93–100. doi:10.1590/S1415-47572013000100013
Bomba, L., Walter, K., and Soranzo, N. (2017). The impact of rare and low-frequency genetic variants in common disease. Genome Biol. Apr 27 (18), 77. doi:10.1186/s13059-017-1212-4
Botta, V., Louppe, G., Geurts, P., and Wehenkel, L. (2014). Exploiting SNP correlations within random forest for genome-wide association studies. Plos One 9, e93379. doi:10.1371/journal.pone.0093379
Calabro, M., Drago, A., Sidoti, A., Serretti, A., Crisafulli, C., Antonina, S., et al. (2015). Genes involved in pruning and inflammation are enriched in a large mega-sample of patients affected by Schizophrenia and Bipolar Disorder and controls. Psychiatry Res. 228, 945–949. doi:10.1016/j.psychres.2015.06.013
Cerf, M. E. (2013). Beta cell dysfunction and insulin resistance. Front. Endocrinol. (Lausanne) 4, 37. doi:10.3389/fendo.2013.00037
Chattopadhyay, A., and Lu, T. P. (2019). Gene-gene interaction: the curse of dimensionality. Ann. Transl. Med. 7, 813. doi:10.21037/atm.2019.12.87
Chen, C. H., Yang, J. H., Chiang, C. W. K., Hsiung, C. N., Wu, P. E., Chang, L. C., et al. (2016). Population structure of Han Chinese in the modern Taiwanese population based on 10,000 participants in the Taiwan Biobank project. Hum. Mol. Genet. 25, 5321–5331. doi:10.1093/hmg/ddw346
Cui, Y., Hu, X., Zhang, C., and Wang, K. (2022). The genetic polymorphisms of key genes in WNT pathway (LRP5 and AXIN1) was associated with osteoporosis susceptibility in Chinese Han population. Endocr. Feb 75, 560–574. doi:10.1007/s12020-021-02866-z
Fabregat, A., Sidiropoulos, K., Viteri, G., Forner, O., Marin-Garcia, P., Arnau, V., et al. (2017). Reactome pathway analysis: a high-performance in-memory approach. BMC Bioinforma. 18, 142. doi:10.1186/s12859-017-1559-2
Forrest, J. A. H., Clements, J. A., and Prescott, L. F. (1982). Clinical pharmacokinetics of paracetamol. Clin. Pharmacokinet. 7, 93–107. doi:10.2165/00003088-198207020-00001
Hishida, A., Wakai, K., Naito, M., Suma, S., Sasakabe, T., Hamajima, N., et al. (2014). Polymorphisms of genes involved in lipid metabolism and risk of chronic kidney disease in Japanese - cross-sectional data from the J-MICC study. Lipids Health Dis. 13, 162. doi:10.1186/1476-511X-13-162
Kim, M., Kim, M., Yoo, H. J., Bang, Y. J., Lee, S. H., and Lee, J. H. (2018). Apolipoprotein A5 gene variants are associated with decreased adiponectin levels and increased arterial stiffness in subjects with low high-density lipoprotein-cholesterol levels. Clin. Genet. Nov. 94, 438–444. doi:10.1111/cge.13439
Laurie, C., Wang, S. C., Carlini-Garcia, L. A., and Zeng, Z. B. (2014). Mapping epistatic quantitative trait loci. Bmc Genet. Nov. 4 (15), 112. doi:10.1186/s12863-014-0112-9
Levene, H. (1960). “Robust tests for equality of variances,” in Contributions to probability and statistics; essays in honor of Harold Hotelling (Stanford University Press), 278-292.
Lin, W. Y. (2022a). Genome-wide association study for four measures of epigenetic age acceleration and two epigenetic surrogate markers using DNA methylation data from Taiwan Biobank. Hum. Mol. Genet. 31, 1860–1870. doi:10.1093/hmg/ddab369
Lin, W. Y. (2022b). Lifestyle factors and genetic variants on 2 biological age measures: evidence from 94 443 taiwan biobank participants. J. Gerontol. A Biol. Sci. Med. Sci. 77, 1189–1198. doi:10.1093/gerona/glab251
Lin, W. Y. (2022c). The most effective exercise to prevent obesity: a longitudinal study of 33,731 Taiwan biobank participants. Front. Nutr. Sep. 23 (9), 944028. doi:10.3389/fnut.2022.944028
Lin, W. Y., Chan, C. C., Liu, Y. L., Yang, A. C., Tsai, S. J., and Kuo, P. H. (2020a). Sex-specific autosomal genetic effects across 26 human complex traits. Hum. Mol. Genet. 29, 1218–1228. doi:10.1093/hmg/ddaa040
Lin, W. Y., Liu, Y. L., Yang, A. C., Tsai, S. J., and Kuo, P. H. (2020b). Active cigarette smoking is associated with an exacerbation of genetic susceptibility to diabetes. Diabetes. Dec 69, 2819–2829. doi:10.2337/db20-0156
Liu, S. M., Xu, F. X., Shen, F., and Xie, Y. (2012). Rapid genotyping of APOA5 -1131T>C polymorphism using high resolution melting analysis with unlabeled probes. Gene. May 498 (1), 276–279. doi:10.1016/j.gene.2012.02.025
Lou, X. Y., Chen, G. B., Yan, L., Ma, J. Z., Zhu, J., Elston, R. C., et al. (2007). A generalized combinatorial approach for detecting gene-by-gene and gene-by-environment interactions with application to nicotine dependence. Am. J. Hum. Genet. 80, 1125–1137. doi:10.1086/518312
Ma, L., Keinan, A., and Clark, A. G. (2015). Biological knowledge-driven analysis of epistasis in human GWAS with application to lipid traits. Methods Mol. Biol. 1253, 35–45. doi:10.1007/978-1-4939-2155-3_3
Marchelek-Mysliwiec, M., Nalewajska, M., Turon-Skrzypinska, A., Kotrych, K., Dziedziejko, V., Sulikowski, T., et al. (2022). The role of forkhead box O in pathogenesis and therapy of diabetes mellitus. Int. J. Mol. Sci., 23. doi:10.3390/ijms231911611
Marderstein, A. R., Davenport, E. R., Kulm, S., Van Hout, C. V., Elemento, O., and Clark, A. G. (2021). Leveraging phenotypic variability to identify genetic interactions in human phenotypes. Am. J. Hum. Genet. Jan. 7 (108), 49–67. doi:10.1016/j.ajhg.2020.11.016
McCaw, Z. R., Lane, J. M., Saxena, R., Redline, S., and Lin, X. (2020). Operating characteristics of the rank-based inverse normal transformation for quantitative trait analysis in genome-wide association studies. Biom. Dec 76, 1262–1272. doi:10.1111/biom.13214
Mitt, M., Kals, M., Parn, K., Gabriel, S. B., Lander, E. S., Palotie, A., et al. (2017). Improved imputation accuracy of rare and low-frequency variants using population-specific high-coverage WGS-based imputation reference panel. Eur. J. Hum. Genet. Jun 25, 869–876. doi:10.1038/ejhg.2017.51
Moore, J. H., and Williams, S. M. (2009). Epistasis and its implications for personal genetics. Am. J. Hum. Genet. Sep. 85, 309–320. doi:10.1016/j.ajhg.2009.08.006
Motsinger, A. A., Fanelli, T. J., and Ritchie, M. D. (2007). Power of grammatical evolution neural networks to detect gene-gene interactions in the presence of error common to genetic epidemiological studies. Genet. Epidemiol. 31, 491. doi:10.1002/gepi.20247
Pare, G., Cook, N. R., Ridker, P. M., and Chasman, D. I. (2010). On the use of variance per genotype as a tool to identify quantitative trait interaction effects: a report from the women's genome health study. Plos Genet. 6, e1000981. doi:10.1371/journal.pgen.1000981
Pattin, K. A., White, B. C., Barney, N., Gui, J., Nelson, H. H., Kelsey, K. T., et al. (2009). A computationally efficient hypothesis testing method for epistasis analysis using multifactor dimensionality reduction. Genet. Epidemiol. Jan. 33, 87–94. doi:10.1002/gepi.20360
Purcell, S., Neale, B., Todd-Brown, K., Thomas, L., Ferreira, M. A., Bender, D., et al. (2007). PLINK: a tool set for whole-genome association and population-based linkage analyses. Am. J. Hum. Genet. 81, 559–575. doi:10.1086/519795
Ritchie, M. D., Hahn, L. W., and Moore, J. H. (2003). Power of multifactor dimensionality reduction for detecting gene-gene interactions in the presence of genotyping error, missing data, phenocopy, and genetic heterogeneity. Genet. Epidemiol. Feb 24, 150–157. doi:10.1002/gepi.10218
Russ, D., Williams, J. A., Cardoso, V. R., Bravo-Merodio, L., Pendleton, S. C., Aziz, F., et al. (2022). Evaluating the detection ability of a range of epistasis detection methods on simulated data for pure and impure epistatic models. PLoS One 17, e0263390. doi:10.1371/journal.pone.0263390
Soave, D., Corvol, H., Panjwani, N., Gong, J., Li, W., Boelle, P. Y., et al. (2015). A joint location-scale test improves power to detect associated SNPs, gene sets, and pathways. Am. J. Hum. Genet. Jul 2 (97), 125–138. doi:10.1016/j.ajhg.2015.05.015
Soave, D., and Sun, L. (2017). A generalized Levene's scale test for variance heterogeneity in the presence of sample correlation and group uncertainty. Biometrics. 73, 960–971. doi:10.1111/biom.12651
Staley, J. R., Windmeijer, F., Suderman, M., Lyon, M. S., Davey Smith, G., and Tilling, K. (2022). A robust mean and variance test with application to high-dimensional phenotypes. Eur. J. Epidemiol. 37, 377–387. doi:10.1007/s10654-021-00805-w
Sun, L., Craiu, R. V., Paterson, A. D., and Bull, S. B. (2006). Stratified false discovery control for large-scale hypothesis testing with application to genome-wide association studies. Genet. Epidemiol. 30, 519–530. doi:10.1002/gepi.20164
Uffelmann, E., Huang, Q. Q., Munung, N. S., de Vries, J., Okada, Y., Martin, A. R., et al. (2021). Genome-wide association studies. Nat. Rev. Method Prime 1, 59–21. doi:10.1038/s43586-021-00056-9
Van Steen, K. (2012). Travelling the world of gene-gene interactions. Brief. Bioinform. Jan. 13, 1–19. doi:10.1093/bib/bbr012
Wang, H. W., Zhang, F. T., Zeng, J., Wu, Y., Kemper, K. E., Xue, A. L., et al. (2019). Genotype-by-environment interactions inferred from genetic effects on phenotypic variability in the UK Biobank. Sci. Adv. 5, eaaw3538. doi:10.1126/sciadv.aaw3538
Westerman, K. E., Majarian, T. D., Giulianini, F., Jang, D. K., Miao, J., Florez, J. C., et al. (2022). Variance-quantitative trait loci enable systematic discovery of gene-environment interactions for cardiometabolic serum biomarkers. Nat. Commun. 13, 3993. doi:10.1038/s41467-022-31625-5
WTCCC (2007). Genome-wide association study of 14,000 cases of seven common diseases and 3,000 shared controls. Nature 447, 661–678. doi:10.1038/nature05911
Wu, M. Y., Huang, J., and Ma, S. G. (2018). Identifying gene-gene interactions using penalized tensor regression. Stat. Med. Feb 20 (37), 598–610. doi:10.1002/sim.7523
Yang, G. Y., Ge, S. F., Singh, R., Basu, S., Shatzer, K., Zen, M., et al. (2017). Glucuronidation: driving factors and their impact on glucuronide disposition. Drug Metab. Rev. 49, 105–138. doi:10.1080/03602532.2017.1293682
Yang, Z. F., Jin, L. L., Zhu, H. T., Wang, S. K., Zhang, G. Q., and Liu, G. F. (2018). Analysis of epistasis among QTLs on heading date based on single segment substitution lines in rice. Sci. Rep-Uk 8, 3059. doi:10.1038/s41598-018-20690-w
Keywords: continuous trait, epistasis, homoscedasticity, heteroscedasticity, scale test
Citation: Lin W-Y (2024) Searching for gene-gene interactions through variance quantitative trait loci of 29 continuous Taiwan Biobank phenotypes. Front. Genet. 15:1357238. doi: 10.3389/fgene.2024.1357238
Received: 17 December 2023; Accepted: 27 February 2024;
Published: 07 March 2024.
Edited by:
Phillip E. Melton, University of Tasmania, AustraliaReviewed by:
Sathish Periyasamy, The University of Queensland, AustraliaRen-Hua Chung, National Health Research Institutes, Taiwan
Copyright © 2024 Lin. This is an open-access article distributed under the terms of the Creative Commons Attribution License (CC BY). The use, distribution or reproduction in other forums is permitted, provided the original author(s) and the copyright owner(s) are credited and that the original publication in this journal is cited, in accordance with accepted academic practice. No use, distribution or reproduction is permitted which does not comply with these terms.
*Correspondence: Wan-Yu Lin, bGlud3lAbnR1LmVkdS50dw==
†ORCID: Wan-Yu Lin, orcid.org/0000-0002-3385-4702
 Wan-Yu Lin