 Elisabeth Högg
 Tobias Horneber
 Cornelia Rauh
94% of researchers rate our articles as excellent or good
Learn more about the work of our research integrity team to safeguard the quality of each article we publish.
Find out more
ORIGINAL RESEARCH article
Front. Food. Sci. Technol., 24 February 2025
Sec. Food Modeling
Volume 5 - 2025 | https://doi.org/10.3389/frfst.2025.1443376
This article is part of the Research TopicAdvancing Food Processing: Novel Technologies and Modeling TechniquesView all 4 articles
Introduction: High-moisture extrusion (HME) has become a key method in the food industry for texturizing plant-based proteins to create high-moisture meat analogues (HMMAs) with meat-like textures. Despite its importance, the texturization process within the cooling die of the extruder remains not fully understood. This study aims to bridge this knowledge gap by combining experimental and numerical methods to analyze protein matrix solidification.
Methods: In-situ measurements, including temperature, pressure, velocity, and flow profiles, were conducted for various HME setups and die geometries. Numerical simulations based on the finite volume method incorporated thermophysical material properties from previous research to predict flow dynamics and structural changes. An inverse modeling approach was used to estimate unmeasurable parameters, and experimental validation included textural analysis, such as slice shear force and tensile strength.
Results: The experimental and numerical studies showed strong agreement, validating the numerical model’s accuracy in simulating cooling die processes. Flow profiles visualized experimentally and numerically highlighted the correlation between structuring coefficients derived from kinematic variables and textural analysis results. Key findings indicated that cooling die geometries and process conditions significantly influence protein matrix solidification and the resulting texture of HMMAs.
Discussion: This study provides novel insights into the dynamics within cooling dies and establishes a robust framework for optimizing HME processes to enhance the textural quality of meat analogues. The validated numerical model enables future studies to explore diverse geometries and process conditions, contributing to advancements in plant-based protein texturization.
• The texturization process in the cooling die of high-moisture extrusion (HME) has been investigated for plant based meat analogues.
• Experimental data and numerical simulations were used to analyze the flow properties and textural properties for different die geometries.
• Strong correlation between experimental and simulation results validated the numerical model’s accuracy.
• The results provide valuable insights for the optimisation of HME to improve the texture of meat analogues.
The quality of high-moisture meat analogues (HMMAs) can be affected by multiple factors, including the raw material, extruder type, screw configuration, cooling die and extrusion process conditions; these conditions include barrel temperature, moisture content, cooling temperature and cooling rate (Lin et al., 2002; Day and Swanson, 2013; Zhang et al., 2015). Previous studies have investigated the effects of process variables on the extruder response, thus, on system parameters, and product properties (Chen et al., 2010; Meng et al., 2010). However, changes in process conditions impact the thermomechanical stresses in the screw section, which, in turn, affect the properties of the protein matrix in the cooling die. The texturization process in the cooling die is a crucial stage during high-moisture extrusion (HME), as it determines the final texture and structure of the extruded product (Kyriakopoulou et al., 2019; Kołodziejczak et al., 2021; Guyony et al., 2022). In the cooling die section, the extruded material is rapidly cooled and solidified, leading to conservation of the formed flow profile. The orientation of the protein network is dependent on the flow profile characteristics in the cooling die, including the flow rate, material temperature, and die geometry among others (Noguchi, 1989; Akdogan, 1999). However, the correlation between product properties and thermo-fluid-dynamic conditions along the cooling die, such as changes in the flow profile, shear stress, and/or shear rate due to changes in temperature distribution has not been discussed in detail. Furthermore, the die configuration also affects the pressure and degree of filling in the screw section, and, thus, the thermomechanical stress on the protein matrix. This, in turn, impacts the viscosity and flow properties in the die and, consequently, the product structure. In order to consider the influence of the cooling die on flow properties and, thus, on final product texture displaying a multilayered fibrous structure, it is necessary to consider the interaction of process conditions in both the screw and cooling die sections.
The HME process, especially the cooling die section, is a complex system that is difficult to measure in real-time due to limited access and intricate flow behavior (Emin and Schuchmann, 2016; Osen and Schweiggert-Weisz, 2016; Sandoval Murillo et al., 2019; Zhang et al., 2019; Wittek et al., 2021; Guyony et al., 2022). Numerical simulations, particularly those based on the finite volume method (FVM), are used to model transport phenomena such as fluid flow and heat transfer in HME. These methods ensure conservation of mass, momentum, and energy, essential for understanding the protein matrix’s behavior within the cooling die (Rauh and Delgado, 2015; Högg et al., 2017; Kristiawan et al., 2020; Kristiawan and Della Valle, 2020).
In particular, the spatial and temporal resolution of flow processes in the cooling die are of crucial importance for the mechanical and biochemical product changes and the associated product properties. Therefore, it is important to use experimental methods that provide detailed information on the mechanisms involved for modeling complex flow conditions in HME processes (Emin, 2015).
To accurately model the behavior of the extruded material inside the cooling die, a finite volume simulation of the cooling die requires several input variables. These inputs include geometry of the cooling die, boundary conditions, material properties, mesh and solver settings (Emin, 2015; Rauh and Delgado, 2015; Emin and Schuchmann, 2016; Sandoval Murillo et al., 2019; Kristiawan et al., 2020; Kaunisto et al., 2024).
Systematic investigations of the cooling die’s influence on texturization in HME remain scarce, particularly those combining experimental and numerical approaches. Sandoval Murillo et al. (2019) compared experimental studies with numerical simulations for pea protein structure formation during HME, demonstrating that fibrous structures arise through spinodal phase separation under a temperature gradient. However, this study used a mesh-free simulation approach, where particles represent the domain, while our approach employs a mesh-driven finite volume method (FVM), which offers higher accuracy for geometrically simple domains like the cooling die (Hoffer et al., 2021).
Kaunisto et al. (2024) applied a finite element model based on spinodal decomposition to investigate the effects of die width and length on fiber formation for pea protein. Wittek et al. (2021) used numerical flow simulations to determine flow characteristics, such as temperature, tensile strength, and shear stress. Despite these advances, none of these studies provided detailed insights into the cooling die’s specific impact on product solidification and textural properties in plant-based meat analogues (HMMAs).
Our primary goal was to investigate at which point the material in the cooling die begins to solidify and how velocity and cooling profiles influence the structuring of the protein matrix. To achieve this, we calculated solidification profiles, velocity, and cooling profiles, and derived a structuring index from these variables. This required solving the conservation of mass, momentum, and energy equations to accurately model the system behavior (Rauh and Delgado, 2015; Kristiawan et al., 2020; Kristiawan and Della Valle, 2020). Our study improves upon existing models by incorporating experimentally derived thermophysical properties specifically tailored for HME (Högg and Rauh, 2023a; Högg and Rauh, 2023b), allowing for more accurate predictions of these profiles across various cooling die geometries.
One of the novel aspects of our study is the use of inverse modeling to refine critical parameters related to rheology and wall slip behavior, based on data obtained from rheometers and texture analyzers. This iterative process allowed us to fine-tune the model by comparing simulation results with experimental data, improving the accuracy of our predictions (Högg and Rauh, 2023a; Högg and Rauh, 2023b). This approach differs from previous models that rely on generalized assumptions, offering a more detailed understanding of how cooling conditions impact protein structure and texture quality.
Soy protein concentrate (SPC ALPHA® 8 IP) was purchased from Solae Europe S.A. (Solae, LLC, United States) for HME experiments. This raw material is often used as a benchmark reference ingredient for HME by the food industry. SPC ALPHA® 8 IP will be referred to hereafter as SPC Alpha 8. To ensure consistency in product functionality, the same batch of the plant-based material SPC Alpha 8 was used, which eliminates the influence of ingredient fluctuations, as plant-based materials are naturally subject to fluctuations due to factors such as variety, growing region, and agrotechnical practices (Kyriakopoulou et al., 2021). Refill Ink (Light Cyan) was purchased from vhbw–B and W Handelsgesellschaft GmbH (Kamenz, Germany).
HME experiments were performed using a co-rotating twin screw extruder ZSK 25 (Coperion, Stuttgart, Germany) with a screw diameter of 25 mm and a length–diameter ratio of 28.8. A visual description of the HME setup is shown in Figure 1. The individual extrusion sections, screw and cooling die process parameters as well as final product properties are described below.
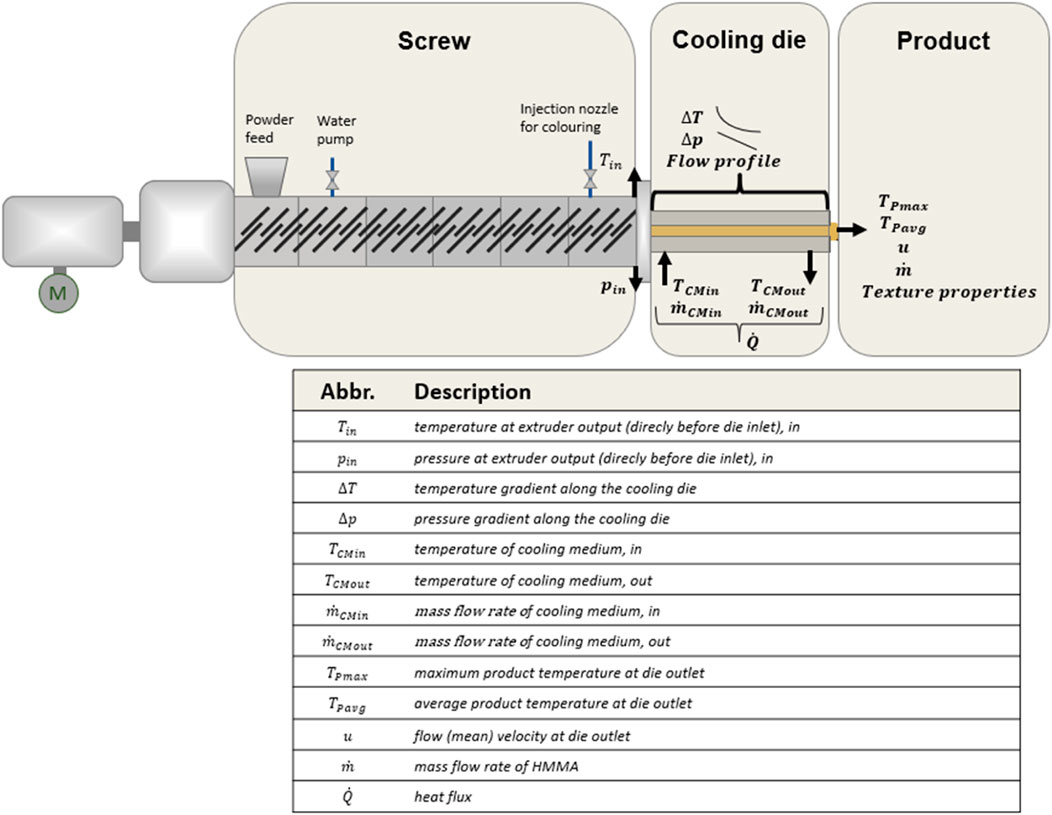
Figure 1. Schematic illustration of HME extrusion with process parameters (in the screw and cooling die section) and product parameters measured during experiments.
The screw section of the extruder was segmented into six temperature-controlled barrels, which were heated to a constant temperature by an oil-operated temperature control system (SINGLE Temperiertechnik GmbH, Hochdorf, Germany), except for the first two segments. These segments were tempered with tap water at ambient temperature. SPC Alpha 8 was fed into the first section of the extruder by a gravimetrically controlled K-Tron T22 twin screw feeder (Coperion K-Tron GmbH, Niederlenz, Switzerland), while tap water was fed into the second extruder segment by a diaphragm metering pump (LEWA ecoflow®, LEWA GmbH, Leonberg, Germany). A low shear screw profile was used. The experimental studies were conducted with the process parameters listed in Table 1. Material temperature (Tin) and extruder pressure (pin) were measured at the extruder outlet, just before the cooling die inlet, using a type J thermocouple (Voltcraft, Wollerau, Switzerland) and an MDT422 melt pressure sensor (Dynisco Instruments, LLC, Franklin, Massachusetts, United States), respectively.
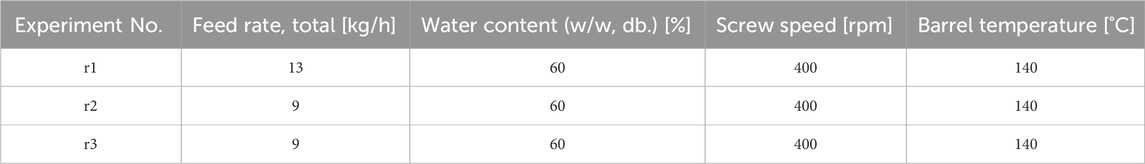
Table 1. Fixed extrusion process parameter for HME experiments r1, r2 and r3.
The protein matrix was texturized by attaching a transition plate and a long cooling die to the extruder. Three different cooling die geometries were evaluated, which are listed in Table 2.
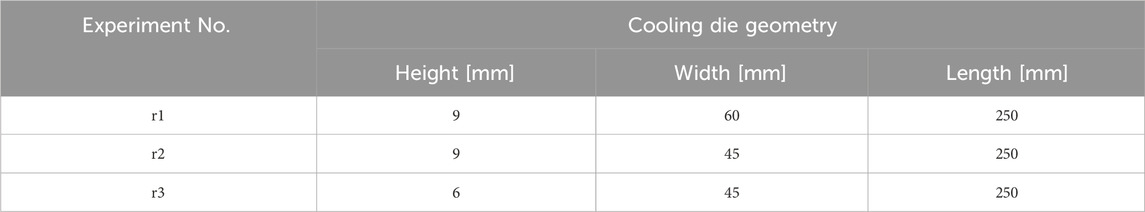
Table 2. Cooling die geometry for HME experiments r1, r2 and r3.
The cooling die was cooled to 40°C using an air-cooled thermostat (LAUDA DR. R. WOBSER GMBH and CO. KG, Lauda-Königshofen, Germany) and tap water as the coolant. Pressure gradient in the cooling die was measured using five melt pressure sensors (MDT422, Dynisco Instruments, LLC, Franklin, Massachusetts, United States) at intervals of 0.03 m, 0.06 m, 0.12 m, 0.18 m and 0.24 m along the cooling die. In addition, temperature gradient was determined by measuring temperatures at intervals of 0.05 m, 0.14 m and 0.23 m along the cooling die using type J thermocouples (Voltcraft, Wollerau, Switzerland). The pressure sensors were placed in the center of the die plate, while the thermocouples were placed 0.01 m from the center. Temperature difference
The experiments labeled as r1, r2, and r3 were conducted adhering to the specifications delineated in Tables 1, 2. In this study, the data from r1 experiment was employed to validate and refine the numerical model described under 2.3. Simulations were conducted for experiments r2 and r3 after optimization of the numerical model, and their outcomes were then compared with the experimental results.
The maximum and average product temperatures were measured directly inline at the outlet of the cooling die using a type J thermocouple (Voltcraft, Wollerau, Switzerland). The thermocouple was inserted approximately 5 mm into the emerging HMMA sample at multiple sampling points to ensure accurate and consistent temperature readings. In addition, the flow velocity of the HMMA at the outlet of the cooling die was determined by measuring the length of the extruded material that emerged over a fixed period of 10 s. This length was then converted into flow velocity using the SI unit metres per second (m/s).
The visualisation of the flow profile within in the cooling die and the texture analysis conducted on the HMMA are described in detail below.
Experimental flow visualisation techniques were applied in the cooling die to overcome the black box of extrusion and the limitations of in-situ observations and direct measurements of process and material properties. Dead-stop experiments were therefore conducted to characterize the spatial and temporal resolution of flow processes throughout the entire cooling die. In these experiments, the dead-stop method was employed by abruptly stopping the extruder and opening the entire cooling die to collect samples spanning over its entire length, allowing for monitoring of structure formation across the entire cooling process. The rapid collection of samples ensured that the internal structure was not affected by the cessation of the extrusion process. This method is widely accepted for observing in-situ protein alignment and solidification during high-moisture extrusion and does not significantly affect the results as it is applied uniformly across experiments. Refill ink was used as a dye to colour the protein matrix. Ink was chosen as it had no significant influence on texturization. To perform the colouring tests, ink was added to the last extruder segment for 2 s using a high pressure pump (KNAUER Wissenschaftliche Geräte GmbH, Berlin, Germany) at a constant flow rate of 10 mL/min (Table 1). The coloured HMMA samples were collected immediately and stored in sealed, airtight plastic bags at −20°C. For analysis, the frozen samples were cut in the center (z = 0.0045 m or 0.0030 m, respectively) parallel to the flow direction using an electric kitchen slicer (Gebr. Graef GmbH and Co. KG., Arnsberg, Germany). In addition, the stained HMMA samples were sliced in the xz-plane.
Two different texture analyses were carried out on HMMA samples, which had fully exited the cooling die: (1) Slice shear force (SFF) to determine the structuring index (
The commercial software ANSYS ICEM and CFX (ANSYS, Inc., Canonsburg, Pennsylvania, United States) was used for grid generation, as well as for numerical studies. Fiber formation in the cooling die section was investigated by continuum mechanical simulations based on fundamental physical laws, including conservation of mass, momentum and energy, considering bio-thermo-fluid dynamic effects, including plasticisation of the protein mixture, adjustment of non-Newtonian behaviour, solidification, stickiness and sliding properties, excluding molecular effects.
The numerical model considered a single-phase fluid at the inlet of the cooling die, which underwent rheological changes along the cooling die and divided into a flowable and solidified part of the protein matrix. The transport of mass, momentum and energy was observed. The dimensions of the cooling die permit a continuum mechanical description with the following set of equations (Equations 1–3) being solved:
(i) Continuity equation:
(ii) Momentum conservation equation:
(iii) Energy conservation equation (here in temperature form):
where
where
The grid independence study was conducted for a cooling die of 100 m length (Figure 2) and different grid resolutions varying in the number of grid points in the three spatial directions (level 0 to level 3, Table 3). It could be shown that the numerical simulation of the solidifation process in the cooling die (including the modeling of the thermophysical properties, flow conditions and boundary conditions) converged and an accurate grid resolution could be defined. Based on this validation the numerical simulation of the scaled up cooling dies was conducted.

Figure 2. Illustration of the section of the cooling die simulated in the grid-independent solution.

Table 3. Grid resolutions for the grid study.
Literature values were used for the numerical simulation with a total of three different constitutive laws: Newtonian fluid, Ostwald-de-Waele and Ostwald-de-Waele coupled with Arrhenius for temperature dependence. Table 4 lists all material values used.
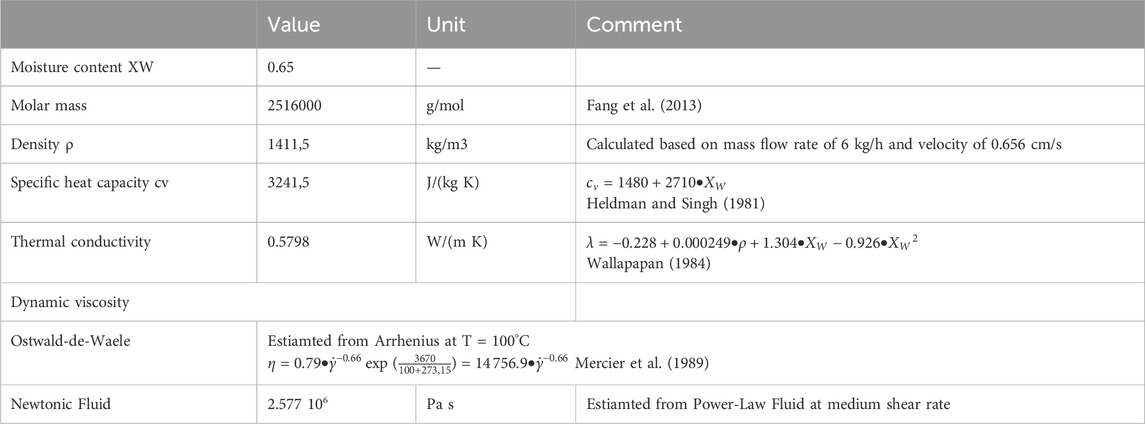
Table 4. Material values of the simulated fluids.
The fluid was assumed to exhibit yield stress, leading to a plug flow in the center of the flowable protein matrix.
The transport effects of momentum and thermal energy took place on different time scales. The transport of thermal energy into the interior was dominated by diffusion processes at the wall of the cooling die. These processes required significantly longer characteristic time scales (
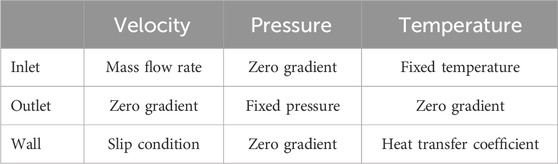
Table 5. Types of boundary conditions for numerical studies to elucidate the texturization mechanisms of the protein matrix in the cooling die.
The boundary condition at the die wall was described by the heat transfer coefficient h and was determined by measuring the temperature difference of the cooling medium
with heat flux
A slip condition was defined as the second boundary condition at the wall, which allowed a slipping of the HMMA along the die wall starting above a critical shear stress
with wall shear stress
If the calculated wall shear stress is below the critical shear stress, adhesion condition (
To build the numerical model, four parameters (τ0, n, k0,
The results of the measured process parameters (in the screw and cooling die section) and product parameters of the HME experiments (Table 1) are summarised in Table 6. The material properties of HMMA samples are listed in Table 7, and have been adopted from our previous work and also from existing literature (Wallapapan et al., 1984; Fang et al., 2013; Pietsch et al., 2019; Högg and Rauh, 2023a; Högg and Rauh, 2023b).
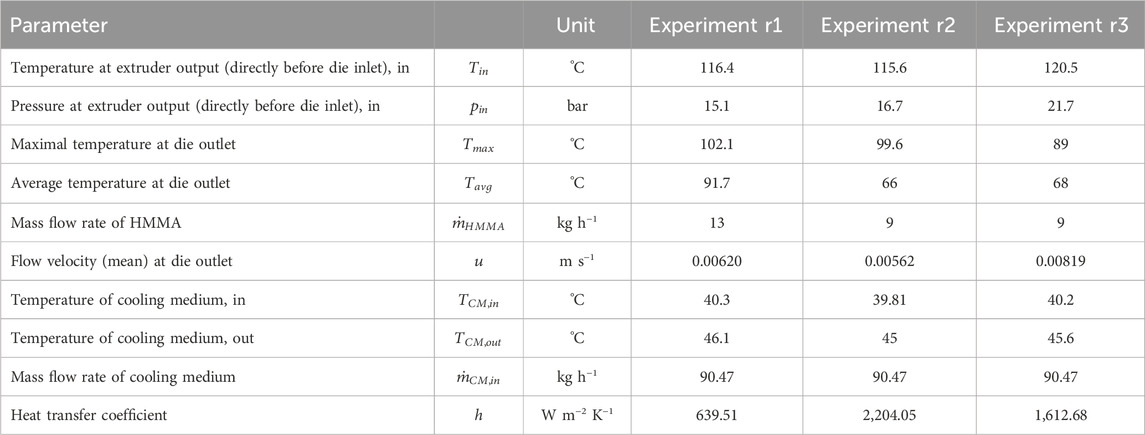
Table 6. Process, system and product parameters measured during HME experiments r1, r2 and r3.
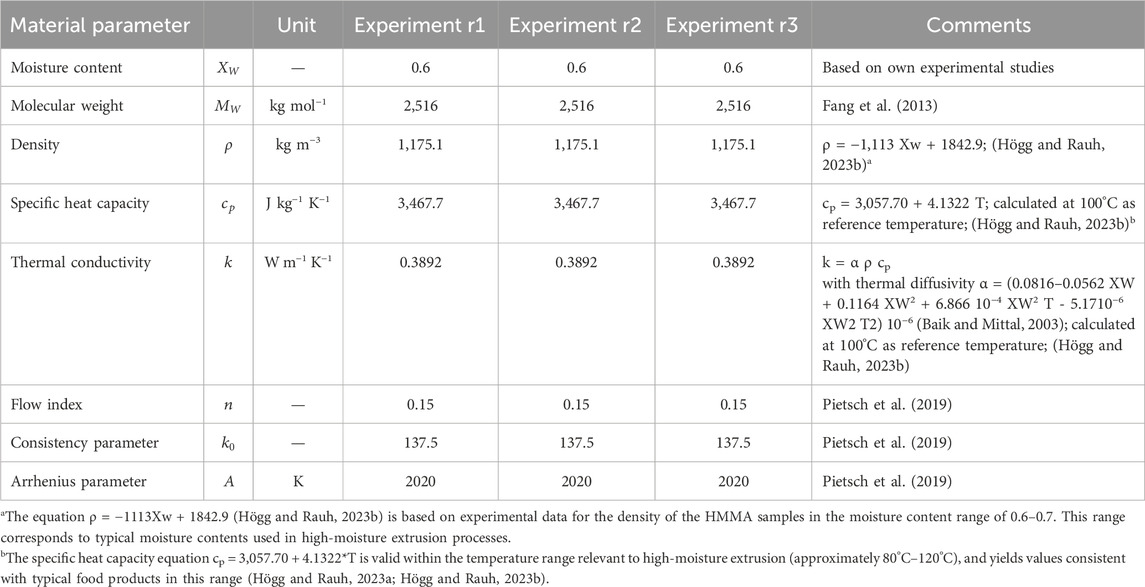
Table 7. Material properties of the HME experiments r1, r2 and r3.
The pseudoplastic material behavior, described using the Ostwald-de Waele model and a flow index derived from literature values (flow index −0.66), showed a lower viscosity in areas of low shear rates (near the centre of the cooling die) than in areas of high shear rates (near the wall). Figure 3 illustrates the viscosity distribution and the corresponding development of the velocity profile. Up to about 2/3 of the die length, the flow transitioned from block flow at the inlet to a fully developed, parabola-like profile. Beyond this point, the velocity stabilized, reaching its maximum at the center.
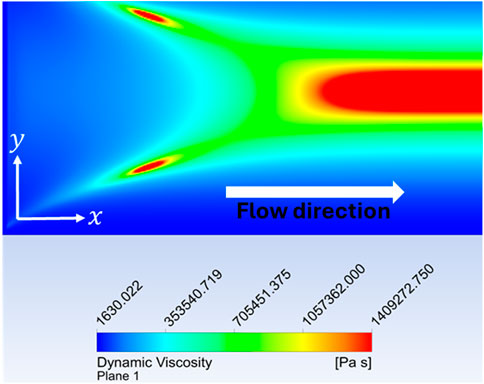
Figure 3. Viscosity in the xy plane through the centre of the cooling die; flow direction from left to right, Ostwald-de-Waele model.
Due to the symmetry of the system, the shear rate (∂u_x/∂z) at the center of the die is zero, a result consistent with the simulation, with deviations smaller than the chosen accuracy of 106. Fiber formation appears to be influenced by more than just shear effects, as formation occurs from the outer regions inwards, where shear rates are lower. Three constitutive laws (Newtonian, Ostwald-de Waele with and without temperature dependence), based on literature data, were modified based on experimental measurements to provide detailed spatially resolved information on shear rate, temperature, and viscosity.
Inverse modeling was employed to optimize the cooling die process by adjusting critical flow parameters. The critical wall shear stress (
To estimate the influence of different parameters, the values to be determined inversely were varied. The result of the variations of the critical (wall shear) stress
The two shown simulations differed in the two tuples (
The analysis showed that these parameter variations have minimal effect on the temperature field as well as on the viscosity and the velocity field. However, the pressure field variable or the pressure drop across the cooling die changed significantly. For the experimental trials a pressure drop of 14.10 bar was measured. The ratio of the pressure drop of simulation I and simulation II is (
In both simulations, the aforementioned measured inlet temperature (116.4°C, Table 6) was set as a boundary condition at the inlet. The maximum material temperature at the cooling die outlet was 104.93°C for Simulation I, and 106.15°C for Simulation II. The measured material temperature (max) at the cooling die outlet was 102.10°C (Table 6). The mean product outlet temperature was 84.05°C for Simulation I, and 84.72°C for Simulation II. The measured mean product outlet temperature was 91.70°C (Table 6). A boundary temperature of the material at the cooling die outlet was set to 58.00°C for all simulations.
Figure 4 illustrates the dynamic viscosity distribution in a horizontal cross-section of the flow domain for the aforementioned simluations [Simulation I (1,000, 10,000) and Simulation II (500, 22,500)]. The color scale represents the dynamic viscosity, with blue areas corresponding to low viscosity regions and red areas to high viscosity regions.
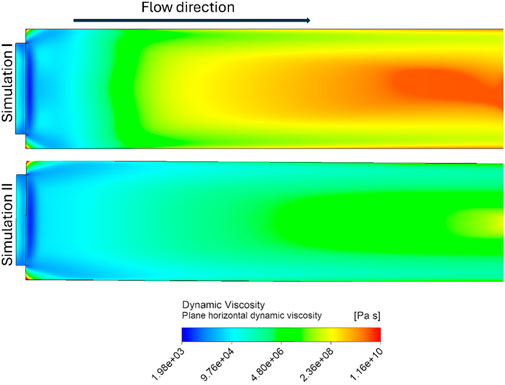
Figure 4. Cross-section of the cooling die at z = 0.0045 m: Dynamic viscosity.
Simuation I depicted a significant increase in viscosity towards the exit of the cooling die. The central region near the outlet showed markedly high viscosity, suggesting a strong build-up of material resistance, possibly due to localized shear stress or cooling effects. This could indicate that the material in this area was undergoing solidification or a higher degree of structure formation as it exited the die.
In contrast, Simulation II showed a more uniform viscosity distribution over the entire length of the die, with less variations between high and low viscosity regions. This suggests a more stable and consistent flow, with less structural variation and lower resistance within the cooling die.
The contrasting viscosity distributions between the two simulations are likely to reflect differences in process parameters, die geometry, or material properties, influencing the flow and structuring behavior in each case.
The velocity profiles across the width of the cooling die at different distances from the cooling die inlet (0.01 m–0.20 m) for the two simulations, Simulation I and Simulation II, are shown in Figure 5.
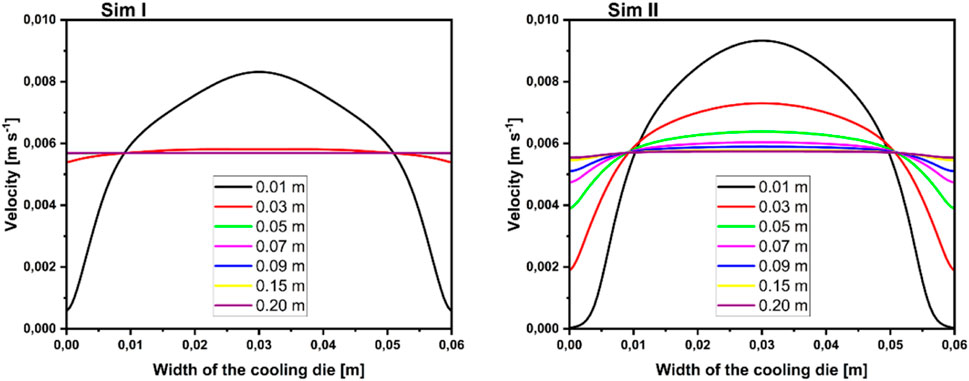
Figure 5. Velocity profiles perpendicular to the flow direction at different distances from the cooling die inlet at z = 0.0045 m for Simulation I (left) and Simulation II (right).
In Simulation I, the wall slip velocities increased from 0.00058 m s−1 at x = 0.01 m to 0.00569 m s−1 at x = 0.2 m. The approximation to the mean flow velocity led to a reduction in the maximum velocity at the centre (y = 0.03 m) of the cooling die, where for x = 0.01 m the peak velocity was 0.00833 m s−1. After x = 0.05 m the velocity remained relatively consistent in magnitude (∼0.00581 m s−1) across the width of the die.
In Simulation II, however, the velocity profiles varied more, with significant differences observed near the die walls compared to the core. The wall slip velocities increased from 0.00003 m s−1 at x = 0.01 m to 0.00554 m s−1 at x = 0.2 m. The peak velocity of 0.00933 m s−1 for x = 0.01 m at the centre (y = 0.03 m) of the cooling die reduced by the slowly increasing wall slip velocity along the length of the cooling die. At x = 0.15 m, the velocity across the width of the cooling die was almost constant.
Comparison of the two simulations revealed a significant difference in flow distribution, with Simulation I showing a more uniform and steady velocity profile, while Simulation II showed more complex velocity gradients, particularly near the walls. These observations suggested that the parameters used in Simulation II created additional resistance or variability in the flow, potentially affecting cooling and material structure formation within the die. The rapid establishment of a constant velocity field across the width of the cooling die in Simulation I may also be due to the increased dynamic viscosity in the centre, as shown in Figure 4.
The flow profiles for Simulation I and Simulation II at various times: 10 s, 15 s, 20 s, and 25 s are depicted in Figure 6. The streamlines illustrate the particle paths over time, indicating the evolution of the flow fields within the cooling die.
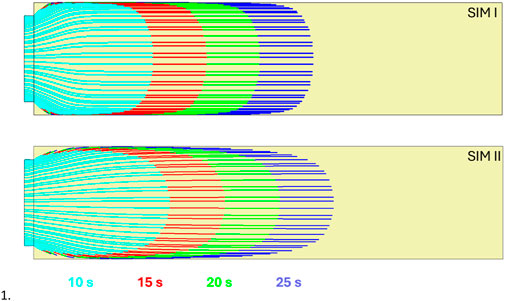
Figure 6. Streamlines for Sim I (top) and Sim II (bottom) after 5 s, 10 s, 15 s and 20 s.
In Simulation I, the flow exhibited a more symmetrical and streamlined pattern across the width of the die. The streamlines extended smoothly from the inlet to the outlet with minimal distortion or deviation. This indicated a stable flow pattern with the material moving steadily through the cooling die. The evenly spaced streamlines suggested that the velocity field across the die width remained relatively constant over time, a finding that correlated with the previously observed velocity profile (Figure 5) where the flow quickly stabilised. The rapid establishment of a constant velocity field in Simulation I was probably due to the increased dynamic viscosity in the core, as shown in Figure 4.
In contrast, Simulation II showed a more varied flow behavior. The streamlines at 10 s and 15 s displayed a less uniform progression, with more curvature and deviations near the walls, indicating areas of increased shear or resistance. In Simulation II, fewer flow changes are observed over time, with greater asymmetry and variation remaining compared to Simulation I. The differences in the flow pattern are likely to be related to the more heterogeneous viscosity distribution observed in Figure 4, where the increased viscosity near the walls likely created additional resistance to flow, leading to more complex streamlines in these regions. This increased resistance may also account for the slower stabilization of the velocity field in Simulation II.
Comparison of the boundary curves of the two simulations showed that although both eventually reached steady state flow, Simulation I achieved this much faster and with a more uniform distribution. In Simulation II, the more complex flow development was evident from the greater variation in streamline curvature and spacing, particularly at the earlier time steps. These differences in flow behavior between the two simulations highlighted the influence of the viscosity distribution on the overall flow dynamics in the cooling die.
Overall, the more uniform flow in Simulation I, combined with its rapid stabilization, suggested that the increased dynamic viscosity in the core region plays a crucial role in facilitating steady flow. Meanwhile, the greater viscosity variation in Simulation II introduced additional complexities that delayed flow stabilization and contributed to a more irregular flow profile.
Based on the results of inverse modeling, the critical wall shear stress
The numerical model was developed on the basis of the experimental results (Tables 6, 7). The unknown parameter of the numerical model (τ0, n, k0, us, τc, τn, A) were determined using inverse modeling. Numerical results were compared with experimental results and adjusted accordingly (Sections 3.3). The final values of the seven unknown parameters obtained by inverse modeling are given in Table 8.
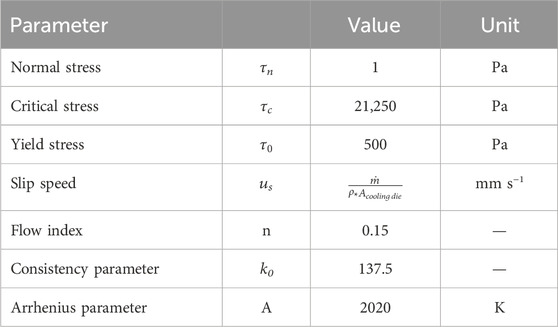
Table 8. Non-measurable parameters of material properties determined by inverse modeling.
The numerical model developed by inverse modeling using the data from Table 6–8 proved to be well suited to investigate in detail the texturization mechanisms in the cooling die section during HME. This becomes evident when comparing the results of the numerical simulation with the results of the HME experiment r1. The temperature and pressure curve of the numerical model agreed well with the temperature and pressure curve measured during experiment r1 (Figure 7).
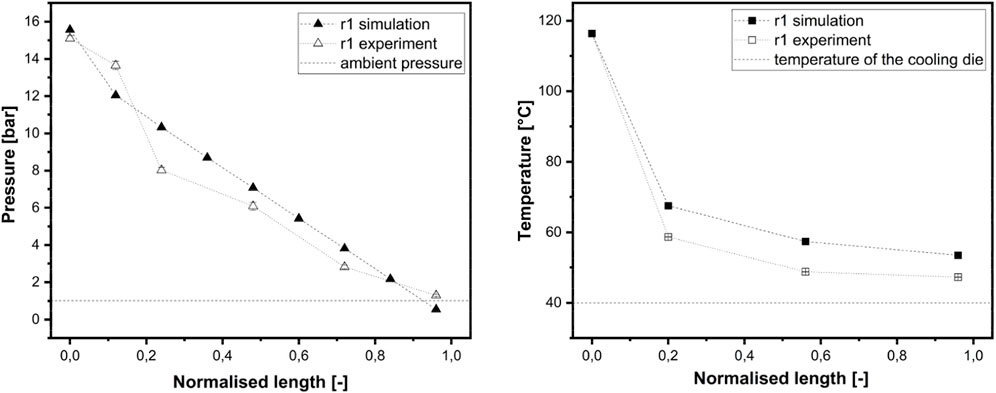
Figure 7. (left) Pressure values measured during the HME experiment r1 compared to calculated pressures in the numerical studies at various positions along the cooling die. (right) Temperatures measured during HME experiment r1 compared to calculated temperatures in the numerical studies at various positions along the cooling die. Extrusion settings are listed in Table 6.
Although the temperatures and pressures measured during the HME experiment were slightly lower than those calculated in the numerical studies, the values obtained from the simulation showed good agreement with those of the experiment. In both studies, a rapid temperature and pressure drop was observed (Figure 7). The temperature in the cooling die dropped in the first 20% (corresponding to the first 0.05 m of the cooling die) and converged to the set cooling temperature of 40°C.
The pressure dropped rapidly in the first 0.05 m of the cooling die, and then decreased linearly to ambient pressure (p = 101,325 Pa), which was set as a boundary condition in the numerical simulation. The pressure drop was consistent with presumptions reported by Bounie and van Hecke (1997), and is defined as the sum of the pressure differences at die inlet, the pressure difference along the cooling die due to shear flow, and the pressure difference at die outlet (Bounie and van Hecke, 1997).
Using the numerical simulation model, a spatial and temporal resolution of the flow processes in the cooling die could be achieved by visualising the profiles of temperature, velocity and dynamic viscosity in the cooling die channel (Figure 8). The following figures (Figures 8–10) show the simulation results based on the experimental setup of r1.
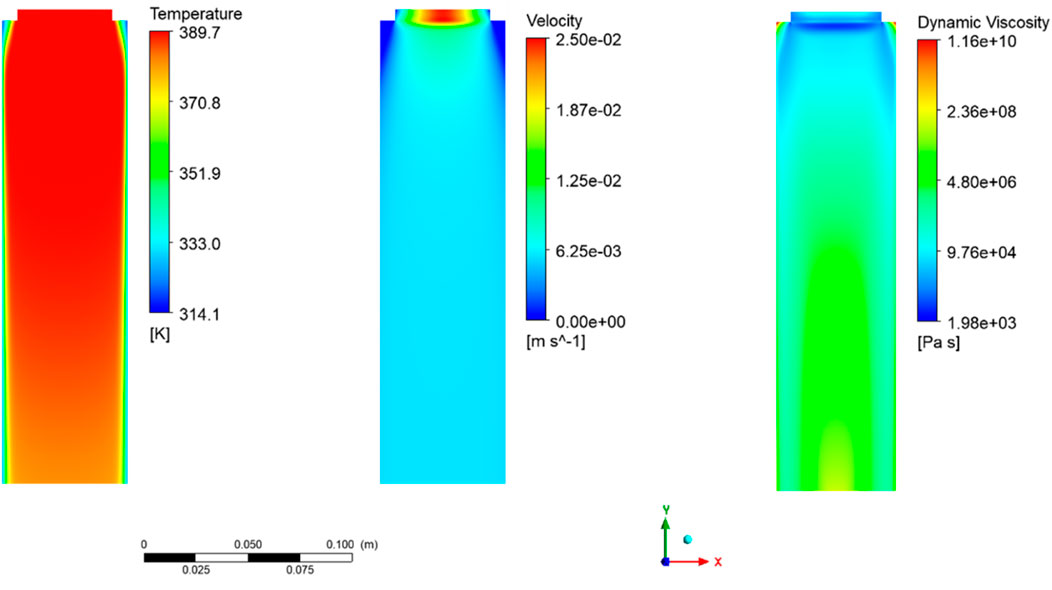
Figure 8. Temperature, velocity, and dynamic viscosity profiles in the cooling die at z = 0.0045 m for HME experiment r1. The numeric model used is based on the parameters listed in Tables 6–8.
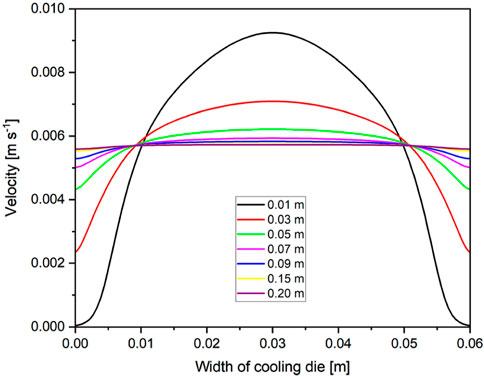
Figure 9. Velocity profiles perpendicular to flow direction of the numerical studies at different distances from the cooling die inlet at z = 0.0045 m for experiment r1.
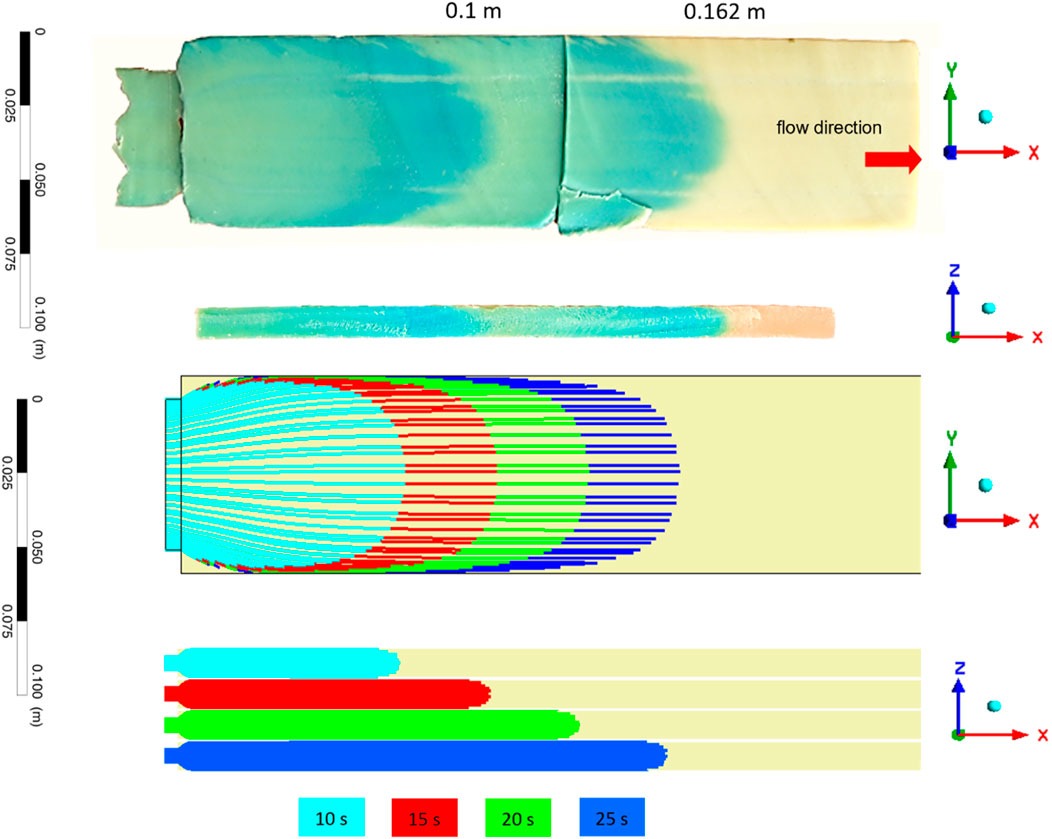
Figure 10. (Top) Picture of stained HMMA sample obtained after dead-stop procedure (intentional shut down of the extrusion process): The HMMA sample was cut perpendicular to the flow direction at half height (z = 0.0045 m; horizontal xy-plane) and lengthwise at half-width (y = 0.030 m; xz-plane). (Bottom) Illustration of the numerical solution on streamlines to determine the flow behavior of a plant-based protein melt in a cooling die: Streamlines after 10 s (light blue), 15 s (red), 20 s (green), and 25 s (blue) in x-direction on xy-plane at half height (z = 0.0045 m). Streamlines after 10 s (light blue), 15 s (red), 20 s (green), and 25 s (blue) in x-direction on xz-plane at half-width (y = 0.03 m).
With the temperature, velocity, and dynamic viscosity profiles of the numerical simulation shown in Figure 8, it was possible for the first time to look inside the cooling die and visualize the bio-thermo-fluid-dynamical effects taking place. It was clearly demonstrated that the temperature of the protein matrix decreased from the outside to the inside, leading to solidification from the cooled walls towards the center. The cooling effect of the walls did not penetrate far enough into the product, so the material temperature dropped slowly and a hot core of over 95°C remained, while the outer areas were cooled to approx. 55°C. Similar results have been published by Sandoval Murillo et al. (2019). The slow temperature drop could be due to the low heat transfer properties of the protein matrix (Högg and Rauh, 2023a; Högg and Rauh, 2023b). The solidification process along the cooling die could be analyzed in more detail illustrating the magnitude of the velocity on the horizontal xy-plane. After a small inlet and transition effects in the front area of the cooling die, a plug flow regime (after 0.09 m) occurs due to the sliding conditions at the die wall. This plug flow regime becomes even clearer if the velocity profile perpendicular to the flow direction is calculated at different distances from the cooling die inlet (Figure 9).
The wall slip velocities for the different widths increased from 0.00004 m s−1 at x = 0.01 m to 0.0057 m s−1 at x = 0.2 m. The approximation to the mean flow velocity leads to a reduction in the maximum velocity at the centre (y = 0.03 m) of the cooling die and thus to a block flow.
The effect of the yield strength is clearly visible in the front region of the cooling die, e.g., at x = 0.03 m, where it causes a nearly constant velocity range from approximately y = 0.02 m to y = 0.04 m. As the viscosity increases due to the drop in temperature, the influence of the yield strength decreases. Shear flow occurred in the cooling die, resulting in a velocity profile similar to Hagen-Poiseuille flow and an increased velocity gradient (Sandoval Murillo et al., 2019). Once the protein matrix had travelled more than 0.09 m from the die inlet, a plug flow regime with a nearly constant velocity of 0.0057 m s−1 was observed. This plug flow could indicate the final solidification of the protein matrix.
Our simulations showed varied flow patterns across the cooling die due to temperature and viscosity changes (Figure 8), leading to gradual solidification of the protein matrix from the die wall to the center. This solidification, along with rheological changes, is vital for structure formation and preservation. Ultimately, these effects, along with the yield stress in the protein matrix, lead to plug flow with a homogeneous velocity profile.
Similar findings were reported by Kaunisto et al. (2024), who built upon the work of Sandoval Murillo et al. (2019), for a pea protein matrix using FEM simulation in a cooling die. One difference is our use of a wall slip condition, whereas they employed a no-slip boundary condition at the cooling die wall. Worth noting, a no-slip boundary condition may not fully capture the situation. Additionally, they relied on generic literature data for thermophysical properties not tailored for HME, whereas we utilized data-driven models, that closely resembled specific HME conditions (Högg and Rauh, 2023b).
Further, Kaunisto et al. (2024) and Sandoval Murillo et al. (2019) concentrated on fiber formation based on spinodal decomposition in the cooling die, our approach focused on analyzing viscosity, temperature, velocity, and flow patterns, combined with experimental comparison. Figure 9 validates the solidification mechanism towards the cooling die outlet, as the dynamic viscosity increases due to cooling. According to Cheftel et al. (1992) and Akdogan (1999), this could be considered as the origin of fiber formation.
The temperature of the protein matrix gradually decreased from the outside to the inside along the cooling die. According to the simulation results, the protein matrix close to the die wall cooled rapidly, while the product core cooled slowly. In the HME experiment, the material temperature at the extruder outlet, just before the die inlet, was measured to be 116.4°C (Table 6). This inlet temperature (Tin) was used as a boundary condition for the numerical studies (Table 5). The experimentally measured average product temperature at the die outlet was 91.70° ± 8.14°C, while the numerical simulation calculated 84.62°C, giving a percentage difference of 7.7%. The maximum product temperature of the simulation study was even more accurate, with a percentage difference of 3.7%. The maximum temperature at the die outlet of the simulation was 105.92°C, while the experimental maximum core temperature was 102.10°C. The temperature and pressure changes along the cooling die were in satisfactory agreement between the HME experiment and the simulation results. The visualisation of temperature, velocity, and dynamic viscosity fields in the cooling die during HME supports the texturization mechanism hypothesised by Cheftel et al. (1992) and Akdogan (1999), for which no direct evidence has been provided to date (Cornet et al., 2021).
Additionally, experimental flow visualization techniques were applied in the cooling die to overcome the black box of extrusion and the limits of in-situ observations and direct measurements of process and material properties. Dead stop experiments were performed to map the spatial and temporal resolution of flow processes in the cooling die during HME processing. The solid transformation of a soy protein-based matrix in the cooling die was investigated using an in-situ staining method combined with dead stop experiments as an optically detection of the flow profile (Figure 10). The in-situ staining method was also simulated in numerical studies by calculating streamlines equivalent to particle paths in steady-state flow. For this, a stationary flow profile was taken as the basis and streamlines were calculated as the distance travelled by a particle in a given time. Additionally, streamlines were plotted in the xz-plane to determine the effect of the shear rate on texturization. For comparison, the stained HMMA samples were also cut in the xz-plane to compare the experimental results with the simulation results. The results are shown in Figure 10.
The protein matrix was stained twice at 10 s intervals, followed by a dead-stop procedure 35 s after the first staining. The resulting HMMA sample showed a clear laminar flow, indicated by the blue color on the xy-plane at z = 0.0045 m. The sample traversed two line-like parts located at the outer HMMA region, each at the same level as the edges of the transition plate. Those parts were not fully stained. The time-delayed flow may be caused by the compression and retention of the protein matrix at the transition edges. The transition plate had a cross-section geometry of 4.1 × 45.74 mm2 (HxW), which is smaller than the die channel with a geometry of 9 × 60 mm2 (HxW).
The HMMA sample, stained and cut lengthwise in the flow direction, clearly shows a defined three-dimensional orientation on the xz-plane at y = 0.03 m. Similar flow results have been published by Osen (2017) for comparable materials and extrusion conditions.
Our simulation results depict a slight change in the streamlines over time, leading to an elongated particle pattern with a more pronounced peak in the x-direction after seconds of passing through the cooling die. In contrast, changes in the experimental coloured flow pattern along the die channel could not be clearly observed. Bounie and van Hecke (1997) as well as Semenov and Schimpf (2004) assumed that the temperature-induced change in flow characteristics results in a lengthening of the flow velocity profile towards the outlet. The differences could be explained by the fact that changes occurred right at the beginning of the cooling die channel, so that after approximately 15 s a fully developed profile leading to plug flow can be assumed, which is comparable to the results shown in Figure 4.
The flow pattern of the HME experiment appeared to be more pronounced in the axial direction than the numerical streamline patterns. The shape of the flow velocity profile of experiment r1 could be attributed to the axial mixing in the extruder barrel rather than an alteration of the velocity profile in the cooling die (Osen, 2017), and can be supported by the velocity profiles of the numerical studies (Figure 9). The velocity gradients along the width were pronounced for the first 0.03 m and decreased rapidly with almost no velocity gradient detectable after 0.07 m. In addition, the dynamic viscosity of the protein matrix was lower at the die inlet than at the die outlet (Figure 8), which means that the protein matrix was exposed to less shear stress at the beginning of the cooling die than towards the end of die leading to a lower influence on the velocity gradient (Cheftel et al., 1992; Akdogan, 1999).
As the experiment and simulation are highly concordant, the developed numerical model could be further applied to study the texturization mechanism in the cooling die during HME. As described previously, the stained HMMA sample revealed a defined, three-dimensional orientation on the xz-plane at half-width (y = 0.03 m). The depicted pattern could be described as a parabolic V-shape pattern, which was also evident in the simulation results and could be ascribed to shear stress during cooling (Högg and Rauh, 2023b). Thus, HMMA samples preserve fluid-mechanical stresses in their multilayered, fibrous structures, allowing conclusions to be drawn about fluid-mechanical fields even after HME processing.
In our previous studies, differences in HMMA structures could be identified by texture analyses. HMMA products with the most pronounced parabolic profiles were defined as well-textured (Högg and Rauh, 2023a; Högg and Rauh, 2023b). Thus, differences in flow behavior were assumed. Therefore, to further elucidate the texturization mechanism during HME, three different experiments that differed in die width and/or die height were performed. The geometry of the cooling die used was rectangular. The different die geometries are summarized in Table 2.
The mass flow rate was reduced for smaller cross-sectional die areas (r2 and r3) to keep the ratio of die cross-section to mass flow rate nearly constant (Table 1). The additional process parameters of the screw section, and the cooling die section are listed in Tables 1, 2, 6. These HME experiments were simulated using the developed numerical model described above. The results of the experimental and simulation study are compared in Table 9. The load history in the screw section due to energy input is almost identical for the three die cross-sections, as shown by the material temperatures. This resulted in similar rheological properties and material properties (Table 1, 10).
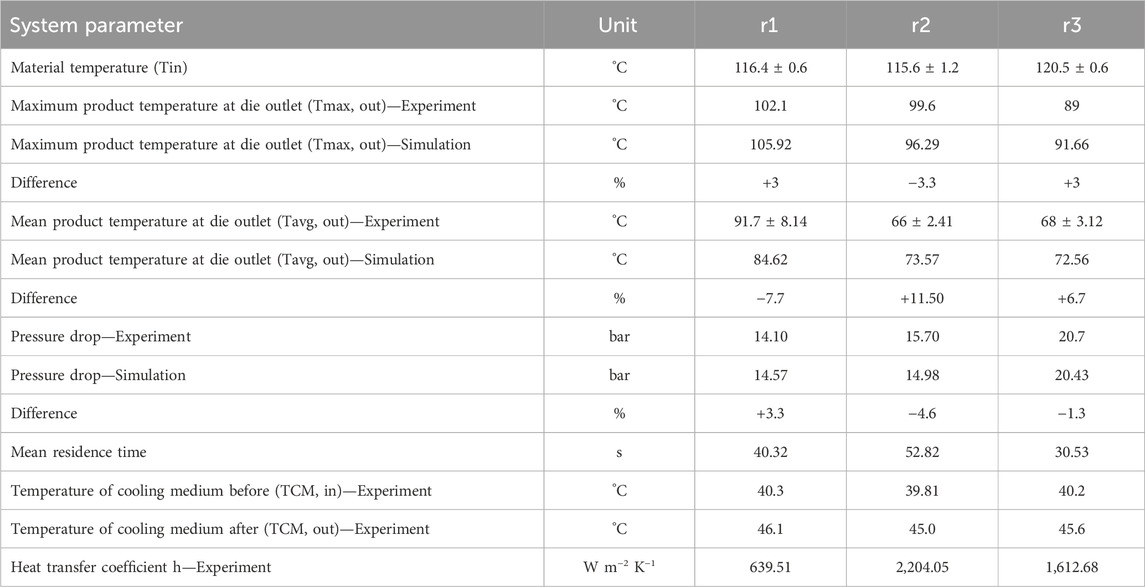
Table 9. System parameters of HME experiments and simulations studying different rectangular cross-sections of the cooling die.
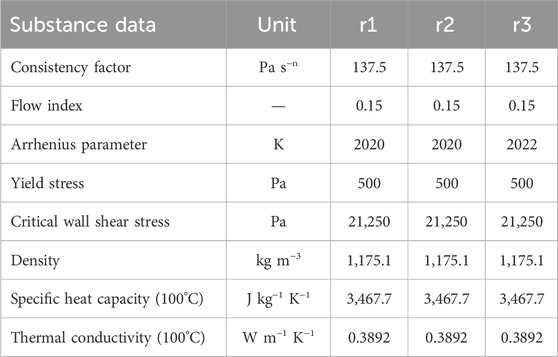
Table 10. Substance data of HME experiments and simulations studying different rectangular cross-sections of the cooling die.
As described previously, the pressure along the cooling die was utilized as partial validation for the numerical model. The deviations (±) in pressure drop between simulation and experiment ranged from 1.3 to 4.6% for all three die setups studied (Table 9). The main reason for the differences in pressure drop between the experimental and simulation results could be primarily attributed to the marginal difference between the calculated and measured inlet pressure of the cooling die. As illustrated for experiment r1 (Table 2), after 0.05 m of the cooling die, the pressures of the experiment and the simulation are largely similar. These results were observed for all of the tested geometries (r1, r2 and r3).
The material temperature (Tin) measured directly before the cooling die inlet served as a boundary condition for the numerical study. The temperature profiles at the different temperature sensors along the cooling die of the simulation study agreed well with the temperature measurements during the HME experiments. The results are shown in Figure 11.
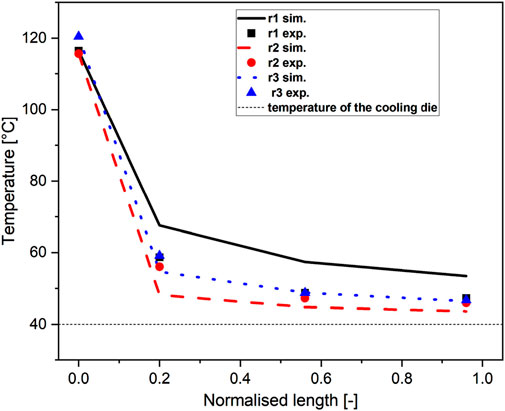
Figure 11. Comparison of in-situ temperature measurements along the cooling die in the HME experiments (r1—exp; r2—exp; r3—exp) and the temperature profiles of the simulations (r1—sim, r2—sim, r3—sim).
The temperatures of the product measured experimentally along the cooling die using three temperature sensors differed from the numerical results as follows: r1 = +6.8%, r2 = −8.1%, and r3 = −2.6%. Both experimental results and numerical studies showed a clear temperature drop in the first 0.05 m of the cooling die, followed by a gradual approach to the set cooling temperature of 40°C. The configuration setting with the narrowest cross-section (r3) depicted the highest temperature drop, the die configuration with the broadest cross-section (r1) depicted the lowest temperature drop. The agreement of the results between the experiment and simulation was more accurate for smaller die cross-sections.
The numerical results of r1, representing the die setting with the broadest die cross-section (WxH = 60 × 90 in mm2), showed higher product surface temperatures than the experimentally measured temperature values. This difference could be due to the lower heat transfer coefficient for r1 (Table 9), which defines the heat transfer intensity at an interface (Maskan and Altan, 2016), and which was implemented as a parameter in the numeric model. In the HME experiments, the temperature sensors on the surface of the die plate, which record the surface temperature of the protein matrix, could be significantly influenced by the temperature of the cooling medium and, consequently, the temperature of the cooling die. The maximum temperature (Tmax) and average temperature (Tavg), measured at die outlet during HME experiments could be simulated with an accuracy range of 3%–11% (Table 9). The aforementioned placement of the temperature sensors could also be the reason for the minor differences between Tmax and Tavg numerical and experimentally assessed.
Furthermore, the flow profiles of the different die geometries that were stained in the cooling die during HME experiments and obtained by dead-stop procedure, as described above, were compared with the streamlines calculated in the numerical studies. The results are shown in Figure 12.
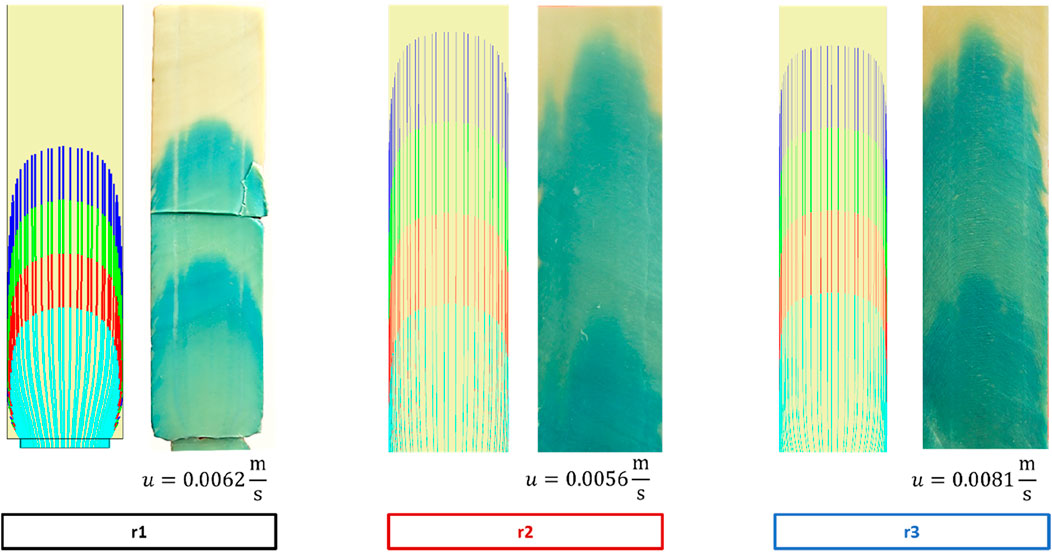
Figure 12. Comparison of streamlines obtained in numerical simulations (left) and flow velocity obtained in HME experiments (r1, r2 and r3) by staining the HMMA samples before the dead-stop approach (right) of different cooling die cross-sections. The HMMA samples were cut perpendicular to the flow direction at half height (z = 0.0045 m; horizontal on the xy-plane) and lengthwise at half-width (y = 0.030 m; xz-plane). The streamlines were visualized after 10 s (light blue), 15 s (red), 20 s (green), and 25 s (blue) in x-direction on xy-plane at half height (z = 0.0045 m).
The results are highly concordant and no qualitative profile changes along the cooling die could be noticed.
The good correlation between experimental and numerical studies regarding the validation points, such as color profiles, pressure, and temperature values in the cooling die, proved that the developed numerical model is highly valid and applicable for different cooling die cross-sections. This numerical model was also successfully applied to other cooling die designs (Högg et al., 2018).
Furthermore, non-measurable local values such as temperature, shear rate, viscosity, and velocity could be calculated using this numerical model due to the good agreements of the mentioned validation points, such as color profiles, pressure, and temperature values. Therefore, the calculated temperature, w component of velocity, shear rate, and dynamic viscosity along the normalized cooling die height z* at half-length and half-width are plotted in Figures 13A–D.
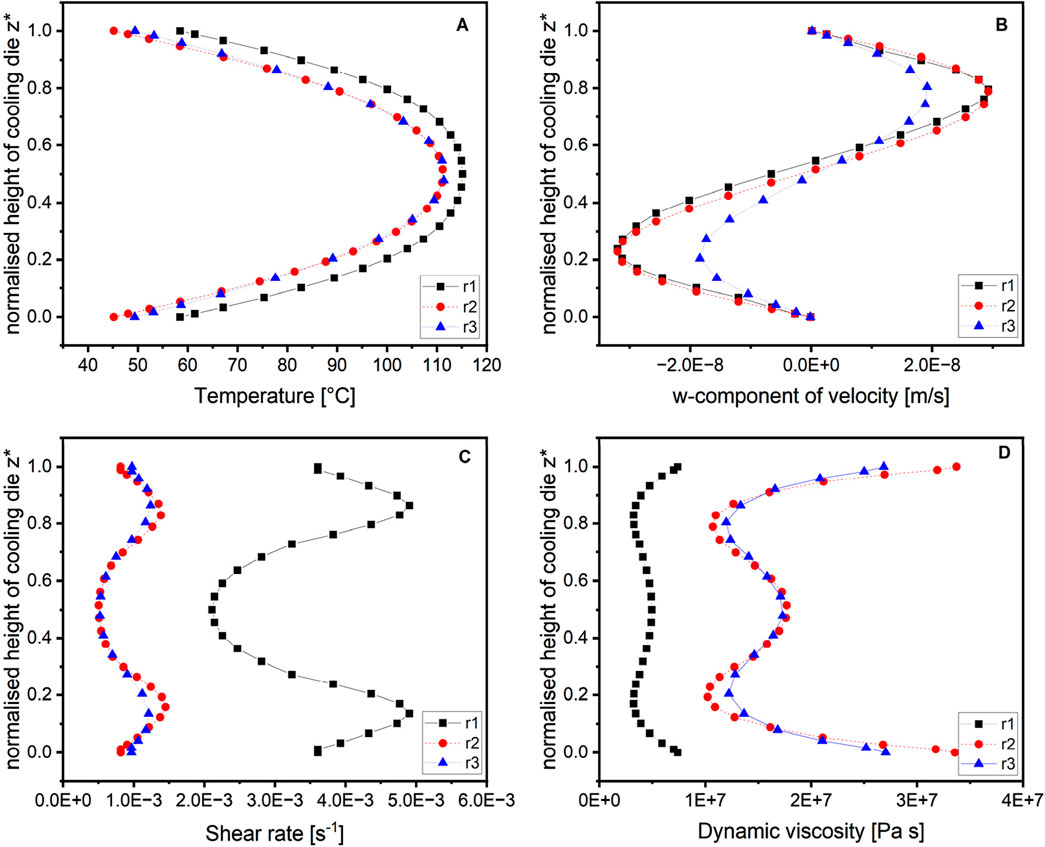
Figure 13. Local distribution of temperature (A), w-component of velocity, (B) shear rate, (C) and dynamic viscosity and (D) a long the normalized cooling die height z* at half-length and half-width. Different cooling die cross-sections (r1, r2 and r3) were studied applying the numerical model developed in this study.
The different temperature curves (Figure 13A) of r1 and r2, which had a similar product temperature at die inlet (r1: Tin = 116.4°C; r2: Tin = 115.6°C; Table 6, 9) could be ascribed to the greater width of r1 (r1: 60 mm vs. r2: 45 mm). The heat transfer from the center to the die wall changed due to the changes in width. Experiment r2 and r3 depicted similar temperature profiles, although the product temperatures in the screw section differed slightly (ΔT of 5°C). Despite the lower inlet temperature compared to r3 and higher residence time of r2, a higher maximum product temperature at the outlet (Tmax,out) could be measured as well as numerically calculated (Table 9). This shows the high complexity of the shear-thinning material: the viscosity increases as the temperature decreases. The viscosity (Figure 13D) and shear rate (Figure 13C) underline the high degree of dependence of the system variables of the cooling die.
The numerical simulation provided an elucidation of the correlation at a local level. The plotted curves of the w-component velocity (Figure 13B) exemplified solidification starting from the cooling die wall, which was assumed in several publications (Högg et al., 2017; Sandoval Murillo et al., 2019; Cornet et al., 2021; Sengar et al., 2023), but never proven. At cooling die height
In addition to the in-situ staining method to investigate the flow behavior in the cooling die, texture analyses on the HMMA samples were carried out. Two experimental indices were determined (Högg and Rauh, 2023a). The structuring index (SI) was calculated based on the slice shear force (SSF) measurements: (
The anisotropy index (AI) was determined from tensile strength tests. The modulus of elasticity in the longitudinal direction (
The AI measures the anisotropy of the product, with higher values indicating greater alignment of fibers in the longitudinal direction, a key factor in mimicking the texture of meat. These indices were chosen to quantify the structural characteristics of the HMMA samples and have been validated in previous studies (Högg and Rauh, 2023a; Pietsch et al., 2019).
Although no models describing the texture of the protein matrix were implemented in the numerical simulation, an approach was found that allowed to assess the texturization quality within the numerical study. This involved leveraging the statistics-proven coefficient of variation (CV) of kinematic variables as a structuring parameter for texturization studies. The coefficient of variation (CV) was derived from the velocity profiles obtained in the numerical simulations of the cooling die. The velocity at different points along the die was recorded, and the CV was calculated as:
To the best of our knowledge, no studies exist investigating and considering the texturization degree in numerical models based on HME processing. The structuring parameter of the numerical simulation was compared with the indices of the experimental study (Figure 14).
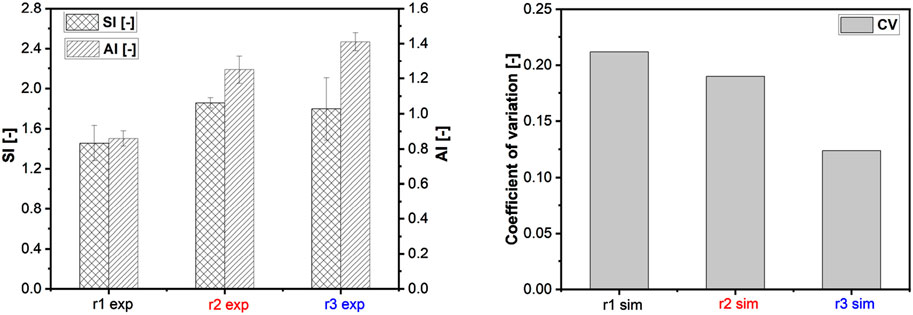
Figure 14. Comparison of the texturization indices of the experimental studies (left) with the texturization parameter CV of the numerical simulation (right). The cooling die configuration of the different experiments were as follows: r1: 9 × 60 × 250 in mm3 (WxHxL); r2: 9 × 45 × 250 in mm3 (WxHxL); r3: 6 × 45 × 250 in mm3 (WxHxL). The temperature of the cooling medium was set to 40°C.
Drawing on the results of the texturization studies, the calculated CV revealed an opposite behavior as the texturization indices of the experimental studies, as shown in Figure 14. However, a dependency of texturization on the width of the cooling die is recognizable: the narrower the width, the higher the texturization in the experimental study and the lower the texturization quality in the numerical study. Thus, a structuring index (SI) of 1.46 ± 0.13 was measured for exp. r1 (width of 60 mm), of 1.85 ± 0.19 for exp. r2 (width of 45 mm) and of 1.78 ± 0.61 for exp. r3 (width of 45 mm). The anisotropy index (AI) also increased with decreasing width from 0.86 ± 0.04 (exp. r1) to 1.25 ± 0.08 (exp. r2) to 1.41 ± 0.05 (exp. r3).
The CV of the simulation, on the other hand, dropped from 0.2119 (sim. r1) to 0.1896 (sim. r2) respectively 0.1238 (sim. r3). The anisotropy index is a direct indicator of the texture and structure of extruded plant-based meat alternatives. A higher anisotropy index indicates a more aligned fibre orientation and thus a more realistic imitation of the meat-like structure, as conventional meat products also have an anisotropic structure. The anisotropy index takes into account the directionality of the material properties and provides a deeper insight into the complex product structure. This insight can be helpful in adjusting process parameters to achieve the desired texture of HMMA.
The height of the cooling die had no significant influence (Figure 14; r2 and r3). The increase in texturization indices with decreasing die width can be explained by the flow profiles developed (Figure 12): a more pronounced flow profile was developed when the protein matrix was allowed to flow through a smaller die channel (Figures 12, 13). As a result SI increased with increasing Reynolds number (Re = ρ u dh η−1), which in turn could be explained by the developed velocity profile of the protein matrix in the cooling die and the resulting simulation outcome (Figures 12, 15).
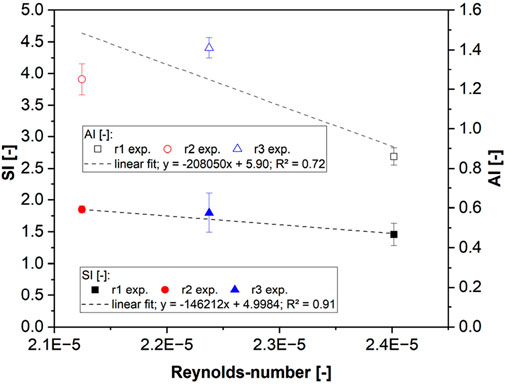
Figure 15. Reynolds number of texturization indices of HMMA samples produced using different cooling die geometries.
To summarize, a low CV means that the local velocity values in the measuring/cutting volume of the simulation study deviate less from the mean value. Consequently, the protein matrix of experiment r2 and r3 developed earlier a plug flow due to high strengths. The rapid development of the plug flow increases the time in which no local changes lead to texturization, which means that the texturization profile in the HMMA samples is preserved more quickly and thus maintained.
This comparison allows conclusions to be drawn about the texturization mechanism in the cooling die during HME processing, substantiated by the previous demonstrations illustrating the ability of numerical simulation to provide detailed insights at a local level. The computed coefficient of variation (CV), thus, serves as a reliable quality indicator for texturization, establishing a vital bridge between experimental data and simulation results.
In the literature, various texturization mechanisms have been discussed, with most theories assuming fiber formation due to laminar flow in the cooling die section (Cheftel et al., 1992; Akdogan, 1999; Guyony et al., 2022). The mechanisms result in a velocity gradient, leading to the formation of multilayered and fiber-like structure (Cheftel et al., 1992; Akdogan, 1999). Temperature-induced viscosity gradients are thought to enhance the velocity gradient and could be confirmed in our simulation results (Figure 8) (Bounie and van Hecke, 1997; Semenov and Schimpf, 2004).
The primary texture formation in high-moisture extrusion occurs within the cooling die. While the screw section plays a crucial role by denaturing and partially aligning the proteins, it primarily initiates the process. The controlled cooling within the cooling die is responsible for the final alignment and solidification of the fibrous structure (Osen, 2017; Schreuders et al., 2021).
Considering the aforementioned findings, the texturization mechanism in the cooling die appears to stem from bio-thermo-fluid-dynamic effects, shaping flow behavior during cooling and preserving fluid-mechanical properties in the protein matrix. These effects contribute to the formation of a multilayered fiber-like structure, ultimately defining the characteristics of the HMMA product.
To the best of our knowledge, no existing studies investigated and considered the texturization degree in numerical models based on HME processing. In this work, the fiber formation due to bio-thermo-fluid-dynamic effects along the cooling die was investigated and experimental studies were compared with numerical studies. With these data a validation of the numerical model was performed. A high agreement between experiment and numerical simulation could be shown, so that the numerical model can be used to elucidate the structure formation in the cooling die in further investigations. Control of the extrusion process is still challenging due to comprehensive effects of the thermal and mechanical energy input, coupled with complex physicochemical transformations of the material. While this study provides valuable insights into the texturization mechanisms during HME, several limitations should be acknowledged. Firstly, the experimental setup, although meticulously designed, may not fully capture the complex interplay of variables present in industrial-scale processes. Variations in temperature, pressure, and shear rates, among other factors, could influence texturization outcomes differently under real-world conditions. Additionally, the numerical simulation, while effective in elucidating local flow behavior, relies on certain assumptions and simplifications inherent to computational modeling. These assumptions may overlook nuanced phenomena or interactions occurring at smaller scales. Moreover, the choice of texturization indices and parameters, while supported by existing literature, may not encapsulate the entirety of texturization complexities, leaving room for alternative or complementary metrics to be explored. Furthermore, the scope of this study primarily focuses on the cooling die section, neglecting potential texturization effects occurring upstream in the screw section. Future research could aim to integrate a more comprehensive analysis of texturization dynamics across different processing stages. Despite these limitations, this study lays a foundation for further investigations into optimizing texturization processes in HME processing, offering valuable insights for both industry practitioners and researchers in the field.
The raw data supporting the conclusions of this article will be made available by the authors, without undue reservation.
EH: Conceptualization, Data curation, Formal Analysis, Funding acquisition, Investigation, Methodology, Project administration, Validation, Visualization, Writing–original draft, Writing–review and editing. TH: Conceptualization, Data curation, Formal Analysis, Investigation, Methodology, Software, Validation, Writing–review and editing. CR: Funding acquisition, Project administration, Resources, Supervision, Writing–review and editing.
The author(s) declare that financial support was received for the research, authorship, and/or publication of this article. This research project was supported by the German Ministry of Economics and Energy (via AiF) and FEI (Forschungskreis der Ernährungsindustrie e.V., Bonn) in the scope of project AiF 18727N. Further, we acknowledge the support of the German Research Foundation and the Open Access Publication Fund of TU Berlin.
The authors declare that the research was conducted in the absence of any commercial or financial relationships that could be construed as a potential conflict of interest.
The author(s) declared that they were an editorial board member of Frontiers, at the time of submission. This had no impact on the peer review process and the final decision.
All claims expressed in this article are solely those of the authors and do not necessarily represent those of their affiliated organizations, or those of the publisher, the editors and the reviewers. Any product that may be evaluated in this article, or claim that may be made by its manufacturer, is not guaranteed or endorsed by the publisher.
Akdogan, H. (1999). High moisture food extrusion. Int. J. Food Sci. Tech. 34, 195–207. doi:10.1046/j.1365-2621.1999.00256.x
Baik, O.-D., and Mittal, G. S. (2003). Determination and modeling of thermal properties of tofu. Int. J. Food Prop. 6, 9–24. doi:10.1081/JFP-120016621
D. Bounie, and E. van Hecke (1997). High moisture extrusion: optimisation of texturisation through control of rheological and textural parameters (Melbourne, Austarlia: CSIRO (Division of Food Science & Technology)).
Cheftel, J. C., Kitagawa, M., and Quéguiner, C. (1992). New protein texturization processes by extrusion cooking at high moisture levels. Food Rev. Int. 8, 235–275. doi:10.1080/87559129209540940
Chen, F., Wei, Y. M., Zhang, B., and Ojokoh, A. O. (2010). System parameters and product properties response of soybean protein extruded at wide moisture range. J. Food Eng. 96, 208–213. doi:10.1016/j.jfoodeng.2009.07.014
Cornet, S. H. V., Snel, S. J. E., Schreuders, F. K. G., van der Sman, R. G. M., Beyrer, M., and van der Goot, A. J. (2021). Thermo-mechanical processing of plant proteins using shear cell and high-moisture extrusion cooking. Crit. Rev. Food Sci. Nutr. 62, 3264–3280. doi:10.1080/10408398.2020.1864618
Day, L., and Swanson, B. G. (2013). Functionality of protein-fortified extrudates. Compr. Rev. Food Sci. Food Saf. 12, 546–564. doi:10.1111/1541-4337.12023
Emin, M. A. (2015). “Modeling extrusion processes,” in Modeling food processing operations (Elsevier), 235–253.
Emin, M. A., and Schuchmann, H. P. (2016). A mechanistic approach to analyze extrusion processing of biopolymers by numerical, rheological, and optical methods. Trends Food Sci. and Technol. 60, 88–95. doi:10.1016/j.tifs.2016.10.003
Fang, Y., Zhang, B., Wei, Y., and Li, S. (2013). Effects of specific mechanical energy on soy protein aggregation during extrusion process studied by size exclusion chromatography coupled with multi-angle laser light scattering. J. Food Eng. 115, 220–225. doi:10.1016/j.jfoodeng.2012.10.017
Guyony, V., Fayolle, F., and Jury, V. (2022). Die dimensions impact on fibrous plant protein formation during high moisture extrusion. Appl. Food Res. 2, 100228. doi:10.1016/j.afres.2022.100228
Hoffer, J. G., Geiger, B. C., Ofner, P., and Kern, R. (2021). Mesh-free surrogate models for structural mechanic FEM simulation: a comparative study of approaches. Appl. Sci. 11, 9411. doi:10.3390/app11209411
E. Högg, T. Horneber, and C. Rauh (2017). Experimental and numerical analyses of the texturisation process of a viscoelastic protein matrix in a cooling die after high moisture extrusion cooking (Karlsruhe, Germany: German Association for Laser Anemometry GALA e.V).
Högg, E., Horneber, T., Rauh, C., Emin, M. A., Pietsch, V. L., Schuchmann, H. P., et al. (2018). “Aufklärung der Texturierungsmechanismen bei der Nassextrusion von Soja-und Erbsenprotein unter besonderer Berücksichtigung biothermofluiddynamischer und proteinchemischer Aspekte auf Basis experimenteller und numerischer Untersuchungen,” in Schlussbericht zu IGV-Vorhaben Nr. AiF 18727 N.
Högg, E., and Rauh, C. (2023a). Towards a better understanding of texturization during high-moisture extrusion (HME)-Part I: modeling the texturability of plant-based proteins. Foods 12, 1955. doi:10.3390/foods12101955
Högg, E., and Rauh, C. (2023b). Towards a better understanding of texturization during high-moisture extrusion (HME)—Part II: characterization of thermophysical properties of high-moisture meat analogues. Foods 12, 2283. doi:10.3390/foods12122283
Kaunisto, E., Wassén, S., and Stading, M. (2024). A thermodynamical finite element model of the fibre formation process during extrusion of high-moisture meat analogues. J. Food Eng. 362, 111760. doi:10.1016/j.jfoodeng.2023.111760
Kołodziejczak, K., Onopiuk, A., Szpicer, A., and Poltorak, A. (2021). Meat analogues in the perspective of recent scientific research: a review. Foods 11, 105. doi:10.3390/foods11010105
Kristiawan, M., and Della Valle, G. (2020). Transport phenomena and material changes during extrusion. Extrus. Cook. (Elsevier), 179–204. doi:10.1016/b978-0-12-815360-4.00006-7
Kristiawan, M., Guessasma, S., and Della Valle, G. (2020). “Extrusion cooking modeling, control, and optimization,” in Extrusion cooking (Elsevier), 295–330.
Kyriakopoulou, K., Dekkers, B., and van der Goot, A. J. (2019). Plant-based meat analogues, 103–126. doi:10.1016/B978-0-12-814874-7.00006-7
Kyriakopoulou, K., Keppler, J. K., and van der Goot, A. J. (2021). Functionality of ingredients and additives in plant-based meat analogues. Foods 10, 600. doi:10.3390/foods10030600
Lin, S., Huff, H. E., and Hsieh, F. (2002). Extrusion process parameters, sensory characteristics, and structural properties of a high moisture soy protein meat analog. J Food Sci. 67, 1066–1072. doi:10.1111/j.1365-2621.2002.tb09454.x
Meng, X., Threinen, D., Hansen, M., and Driedger, D. (2010). Effects of extrusion conditions on system parameters and physical properties of a chickpea flour-based snack. Food Res. Int. 43, 650–658. doi:10.1016/j.foodres.2009.07.016
C. Mercier, P. Linko, and J. M. HARPER (1989). Extrusion cooking (St. Paul, Minn: American Association of Cereal Chemists).
Noguchi, A. (1989). “Extrusion cooking of high-moisture protein foods,” in Extrusion cooking. Editors C. Mercier, P. Linko, and J. M. HARPER (St. Paul, Minn: American Association of Cereal Chemists).
Osen, R. (2017). “Texturization of pea protein isolates using high moisture extrusion cooking,” in Technische universität muenchen, fakultät wissenschaftszentrum weihenstephan.
Osen, R., and Schweiggert-Weisz, U. (2016). “High-moisture extrusion: meat analogues,” in Reference module in food science. Editor G. W. Smithers (Elsevier).
Pietsch, V. L., Bühler, J. M., Karbstein, H. P., and Emin, M. A. (2019). High moisture extrusion of soy protein concentrate: influence of thermomechanical treatment on protein-protein interactions and rheological properties. J. Food Eng. 251, 11–18. doi:10.1016/j.jfoodeng.2019.01.001
Rauh, C., and Delgado, A. (2015). “Different modelling and simulation approaches for food processing operations,” in Modeling food processing operations (Elsevier), 3–33.
Sandoval Murillo, J. L., Osen, R., Hiermaier, S., and Ganzenmüller, G. (2019). Towards understanding the mechanism of fibrous texture formation during high-moisture extrusion of meat substitutes. J. Food Eng. 242, 8–20. doi:10.1016/j.jfoodeng.2018.08.009
Schreuders, F. K., Sagis, L. M., Bodnár, I., Erni, P., Boom, R. M., and van der Goot, A. J. (2021). Mapping the texture of plant protein blends for meat analogues. Food Hydrocolloids 118, 106753.
Semenov, S., and Schimpf, M. (2004). Thermophoresis of dissolved molecules and polymers: consideration of the temperature-induced macroscopic pressure gradient. Phys. Rev. E Stat. Nonlin Soft Matter Phys. 69, 011201. doi:10.1103/PhysRevE.69.011201
Sengar, A. S., Beyrer, M., McDonagh, C., Tiwari, U., and Pathania, S. (2023). Effect of process variables and ingredients on controlled protein network creation in high-moisture plant-based meat alternatives. Foods 12, 3830. doi:10.3390/foods12203830
Wallapapan, K., Sweat, V. E., Arce, J. A., and Dahm, P. F. (1984). Thermal diffusivity and conductivity of defatted soy flour. Trans. ASAE 27, 1610–1613. doi:10.13031/2013.33013
Wittek, P., Ellwanger, F., Karbstein, H. P., and Emin, M. A. (2021). Morphology development and flow characteristics during high moisture extrusion of a plant-based meat analogue. Foods 10, 1753. doi:10.3390/foods10081753
Zhang, B., Zhang, Y., Dreisoerner, J., and Wei, Y. (2015). The effects of screw configuration on the screw fill degree and special mechanical energy in twin-screw extruder for high-moisture texturised defatted soybean meal. J. Food Eng. 157, 77–83. doi:10.1016/j.jfoodeng.2015.02.019
Zhang, J., Chen, Q., Kaplan, D. L., and Wang, Q. (2022). High-moisture extruded protein fiber formation toward plant-based meat substitutes applications: science, technology, and prospect. Trends Food Sci. and Technol. 128, 202–216. doi:10.1016/j.tifs.2022.08.008
Keywords: high-moisture extrusion (HME), numerical simulation (finite volume method), cooling die dynamics, protein texturization, plant-based meat analogues, experimental validation, flow behavior
Citation: Högg E, Horneber T and Rauh C (2025) Modeling and experimental analysis of protein matrix solidification in cooling dies during high-moisture extrusion. Front. Food. Sci. Technol. 5:1443376. doi: 10.3389/frfst.2025.1443376
Received: 03 June 2024; Accepted: 06 January 2025;
Published: 24 February 2025.
Edited by:
Carlos M. Corvalan, Purdue University, United StatesReviewed by:
Emmanuel Purlis, National Scientific and Technical Research Council (CONICET), ArgentinaCopyright © 2025 Högg, Horneber and Rauh. This is an open-access article distributed under the terms of the Creative Commons Attribution License (CC BY). The use, distribution or reproduction in other forums is permitted, provided the original author(s) and the copyright owner(s) are credited and that the original publication in this journal is cited, in accordance with accepted academic practice. No use, distribution or reproduction is permitted which does not comply with these terms.
*Correspondence: Cornelia Rauh, Y29ybmVsaWEucmF1aEB0dS1iZXJsaW4uZGU=
Disclaimer: All claims expressed in this article are solely those of the authors and do not necessarily represent those of their affiliated organizations, or those of the publisher, the editors and the reviewers. Any product that may be evaluated in this article or claim that may be made by its manufacturer is not guaranteed or endorsed by the publisher.
Research integrity at Frontiers
Learn more about the work of our research integrity team to safeguard the quality of each article we publish.