- 1Faculty of Geomatics, Lanzhou Jiaotong University, Lanzhou, China
- 2Lanzhou Nonferrous Metallurgy Design and Research Institute Co., Ltd., Lanzhou, Gansu, China
- 3National-Local Joint Engineering Research Center of Technologies and Applications for National Geographic State Monitoring, Lanzhou, China
- 4Key Laboratory of Science and Technology in Surveying and Mapping, Lanzhou Jiaotong University, Lanzhou, Gansu, China
The urban functional zone, serving as a bridge to understanding the complex interactions between human spatial activities and surface thermal environmental changes, explores the driving force information of its internal temperature changes, which is crucial for improving the urban thermal environment. However, the impacts of the current urban functional zones on the thermal environment, based on the delineation of human activities, have yet to be sufficiently investigated. To address the issue, we constructed a two-factor weighted dominant function vector model of “population heat—land use scale” to identify urban functional zones. This model is based on multisource data and considers the perspective of urban functional supply and demand matching. We then analyzed the spatial differentiation and driving factors of the relationship between urban functional zones and the surface thermal environment using the random forest algorithm, bivariate spatial autocorrelation, geographical detectors, and geographically weighted regression models. The results showed that there are significant differences in the Land Surface Temperature among different urban functional zones in the central urban area of Lanzhou. Among these, the life service zone has the greatest impact on the surface thermal environment, followed by the industrial zone and catering service zone, while the green space zone has the least impact. The surface thermal environment exhibits high-high clusters in localized spatial clustering patterns with life service, industrial, catering service, and residential zones. In contrast, it tends to exhibit low-high clusters with green spaces. Significant spatial clustering and dependence exist between various functional zones and the surface thermal environment. The land cover types characterized by the Normalized Difference Bare Land and Building Index, the vegetation coverage represented by the Fraction of Vegetation Cover, and the density of industrial activities indicated by the Industrial POI Kernel Density Index are the main drivers of the surface thermal environment in the various functional zones of the central urban area of Lanzhou, and all exhibit significant spatial heterogeneity.
1 Introduction
The rapid urbanization has reshaped human settlements and transformed production modes (Bertinelli and Black, 2004). With the increase in human activities such as residential life, industrial production, and urban transportation, the continuous expansion of construction land has led to changes in the physical properties of the urban subsurface and an increase in the concentration of anthropogenic heat emissions, which in turn generates the urban heat island (UHI) effect (Liu et al., 2021; Xiong and Zhang, 2021; Yu et al., 2022). Due to the enhanced UHI effect, the deterioration of the urban thermal environment has recently garnered significant attention (Manoli et al., 2019). This phenomenon threatens the quality of urban living environments and represents one of the crucial factors affecting the health of urban ecosystems (Yang et al., 2021; Meng et al., 2023).
In recent years, scholars have conducted numerous studies on the driving mechanisms and influencing factors of urban thermal environments (Peng et al., 2020). These studies mainly used Land Surface Temperature (LST) as a quantitative indicator of the thermal environment (Wu and Ren, 2019; Huo et al., 2021), and they predominantly focused on the impacts of land use/surface cover changes, landscape patterns, city scale, and urban functions, among others, on the urban thermal environment. Currently, studies of the urban thermal environment involve a variety of analysis scales, including grid scales (Chen G et al., 2023), block units (Zhang L. et al., 2023), and local climate zones (Xu et al., 2023). Among them, grid scales offer the advantages of a simple structure, easy comparison, and flexibility in spatial scaling in analyzing urban thermal environments; however, they fail to adequately capture the structural and functional boundaries and internal heterogeneity of cities. Block units are primarily bounded by city roads or canals, compensating for the limitations of grid scales, but they are somewhat inadequate in revealing the distribution of human socio-economic activities. Local climate zones have been widely used by scholars as an effective tool to quantify the UHI effect. However, the scales of local climate zones often focus predominantly on climate-related factors and do not sufficiently represent the impacts of human activities in the industry, science and education, healthcare, and catering (Huang and Wang, 2019). In contrast, urban functional zones exhibit functional boundaries within the city, which reflect the heterogeneity of the city. Urban functional zones experience human interference from intensive socio-economic activities, which induces and strengthens the UHI effect. Concurrently, different functional zones exhibit marked variations in surface thermal environmental effects due to disparities in human activities, development intensity, and uses (Wang A. et al., 2022). Therefore, studies conducted at the scale of urban functional zones can elucidate the complex interactions between human activities and the surface thermal environment.
Scholars had already utilized urban functional zones as entry points to elucidate the effects of the urban thermal environment. For instance, Li et al. (2021) utilized IKONOS remote sensing image data to classify urban functional zones and investigated the seasonal variations in LST across different functional zones. Chen et al. (2022) utilized POI data to classify urban functional zones into six categories and investigated the contributions of different functional zones to urban LST in Shenyang. Min et al. (2019) used the central district of Nanjing as an empirical case, classified urban functional zones into six categories based on POI data, and investigated the correlations and driving factors between different urban functions and LST. Existing studies have demonstrated significant differences in the surface thermal environments of various functional zones, with industrial, commercial, and residential zones exhibiting higher surface temperatures. These variations are primarily influenced by factors such as vegetation cover and building density (Li G. et al., 2020; Huo et al., 2023; Wen et al., 2023; Du et al., 2024). Although previous studies have explored the correlations and influencing factors between urban functional zones and thermal environments, their results are limited by the delineation of urban functional zones solely based on POI or remote sensing image data. Although POI data are widely used, readily accessible, and reflect the spatial distribution of industries and organizations, the functional zoning based on POI data overlooks the impact of human activities on the surface thermal environment. On the other hand, remote sensing imagery primarily captures the natural characteristics of features and lacks the socio-economic information included in POI data. Additionally, the current delineation of functional zones primarily relies on the first-level classification of urban construction land. It lacks a comprehensive exploration of the second-level subcategories of functions, which are closely related to residents’ daily lives. It is noteworthy that the single-factor analysis method employed in the current study is insufficient to fully capture the interaction of different influencing factors and the geospatial differentiation of the thermal environment in urban functional zones (Xiong and Zhang, 2021). Meanwhile, most current studies have conducted statistical analyses from the perspective of the contributions of different functional zones to the thermal environment, with fewer comprehensive analyses addressing their spatial heterogeneity.
Urban functional zones, serving as the spatial carriers for the division of labor among different functional types in the city, are the basic units for urban planning, management, and resource allocation (Du et al., 2020; Xie et al., 2024). In the traditional data context, urban functional zone identification methods primarily rely on remote sensing imagery (Zhang et al., 2018). With the increasing capacity for data collection, a growing number of large-scale data sources based on human behavior have emerged. These sources feature high spatial and temporal resolution, timeliness, and sensitivity to social functional attributes, including mobile signaling data (Pei et al., 2014), social media data (Chen et al., 2017), and GPS data (Li and Liu, 2022). These developments offer new perspectives for the functional zone identification method. For example, Liu et al. (2020) analyzed hourly traffic trips on both weekdays and weekends using taxi trajectory data and classified the functional zones within the Chengdu Ring Road into six categories. Zhi et al. (2016) classified Shanghai’s urban functional zones into four categories using social media check-in data at different times of the day with the consideration of the activity patterns of the interviewed residents. Compared to fragmented activity data that reflects minority groups, such as those from social media and transportation, mobile signaling data, with its continuous dynamic records and high holding rates, offers more significant advantages in studying urban functional zones from the perspective of population distribution and activity trajectories. Mobile signaling data can capture high-frequency human activity information; however, it is limited by the number of participants and the positioning accuracy of their locations, leading to the loss of certain urban functional attributes. POI data can compensate for the lack of geographic elements and urban functional attributes in mobile signaling data (Huang H. et al., 2024). Therefore, integrating mobile signaling data with POI data can more comprehensively depict urban functions and capture the temperature variations within the city due to human activities. Meanwhile, secondary subcategories such as healthcare, scientific, educational, and cultural functions, and catering services are closely linked to residents’ lives (Yan et al., 2023). Including these categories in the classification of urban functions allows for a more detailed reflection of the impacts of various human activities on the urban thermal environment.
Furthermore, in identifying driving factors, the single-factor quantitative analysis methods currently employed by scholars, such as regression analysis, only explain the influence strength of factors and do not adequately capture the interaction and spatial heterogeneity of the influencing factors. Conversely, the Geographical Detector (GeoDetector) (Wang et al., 2021), in conjunction with the Geographically Weighted Regression model (GWR) (Wang et al., 2019), can analyze the interaction of different factors and their spatial distribution. For instance, Chen W. et al. (2023), using GeoDetector, investigated the factors influencing the spatial distribution characteristics of traditional villages in the Yangtze River Basin, as well as the interactions among multiple factors. Li J. et al. (2024), using the GWR models, revealed the spatial heterogeneity of the main driving factors for landscape ecological risk in the Irtysh River Basin. Combining bivariate spatial autocorrelation analysis methods to explore the spatial differentiation in the relationship between urban functional zones and the surface thermal environment assists in formulating more precise spatial planning strategies. To some extent, this approach bridges the gap between urban climate research and urban planning applications (Stone et al., 2012; Georgescu et al., 2014; Zhao et al., 2018).
As a typical river-valley industrial city in China, Lanzhou, like other industrial cities worldwide, experiences severe air pollution due to the long-term accumulation of pollutants from the petrochemical heavy industry. This issue is compounded by limited air mobility due to the topographical constraints of the river valleys, which impede the diffusion of pollutants (Li T. et al., 2020). Consequently, the UHI effect is intensified. Xue et al. (2023), based on observational data from ground meteorological stations and environmental monitoring stations, found that the urban heat island effect in Lanzhou showed an overall increasing trend from 2013 to 2018. Chai et al. (2023) found that the average temperature difference between Lanzhou city and its non-construction land from 2001 to 2021 ranged from 10.00°C to 20.00°C. The heat island phenomenon spread in a “pie” style.
In light of the above research, this study comprehensively analyzes the spatial differentiation in the relationship between urban functional zones and the surface thermal environment and its driving factors, using multisource data from the perspective of spatial-temporal matching of urban function supply and demand. Specifically, the research objectives include: (1) Construct a two-factor weighted dominant function vector model of “population heat—land use scale” to address the neglect of human activity influences and the reliance on a single data source in classifying urban functional zones. (2) Refine the classification of urban functional zones by introducing secondary subcategories of functions related to residential lives to address the insufficient categorization in the current urban functional zones study. (3) Utilize GeoDetector to investigate the driving factors and their interactions, and due to the presence of spatial heterogeneity, the GWR models is employed to better reveal the spatial relationships between urban thermal environment and various features. (4) Reveal the correlation and spatial differentiation patterns of surface thermal environments through random forest models and bivariate spatial autocorrelation methods. This study presents a comprehensive analysis framework based on multisource data, using Lanzhou City—a typical river-valley industrial city in China with prominent thermal environment problems—as a study case to provide references for improving the urban thermal environment, enhancing the urban management mechanism, and promoting the sustainable development of the city.
2 Materials and methods
2.1 Study area
Lanzhou is situated along the central axis of the “One Belt, One Road” initiative. It is the capital of Gansu Province and a significant industrial base in Northwest China. It has the strategic advantage of being a hub connecting six major regions and radiating influence throughout Northwest China. Lanzhou experiences a temperate continental climate characterized by low and concentrated rainfall, with an average annual precipitation of 324.8 mm and an average annual temperature of 9.3°C. The city comprises five districts and three counties, covering a total area of 13,100 square kilometers. As of the end of 2023, it has a resident population of 4.425 million and an urbanization rate of 84.07%.
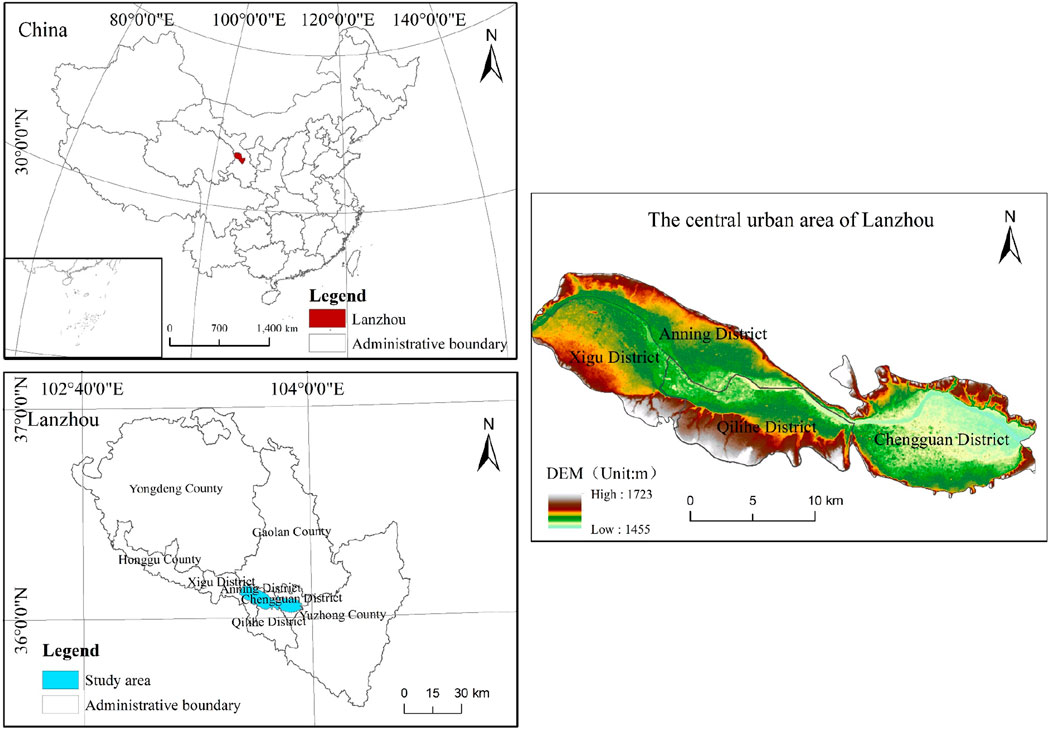
Lanzhou, a typical river valley city, has its central urban area within the river valley basin. This area encompasses the Chengguan, Qilihe, Anning, and Xigu districts, which collectively administer 50 streets, including a high-tech development zone management committee, as depicted in Figure 1. Lanzhou’s typical belt-shaped group structure leads to dispersed and complex urban functions, which exhibit greater typicality and representativeness and can comprehensively reflect the differences in the surface thermal environment of urban functional zones to a certain extent.
2.2 Data source and process
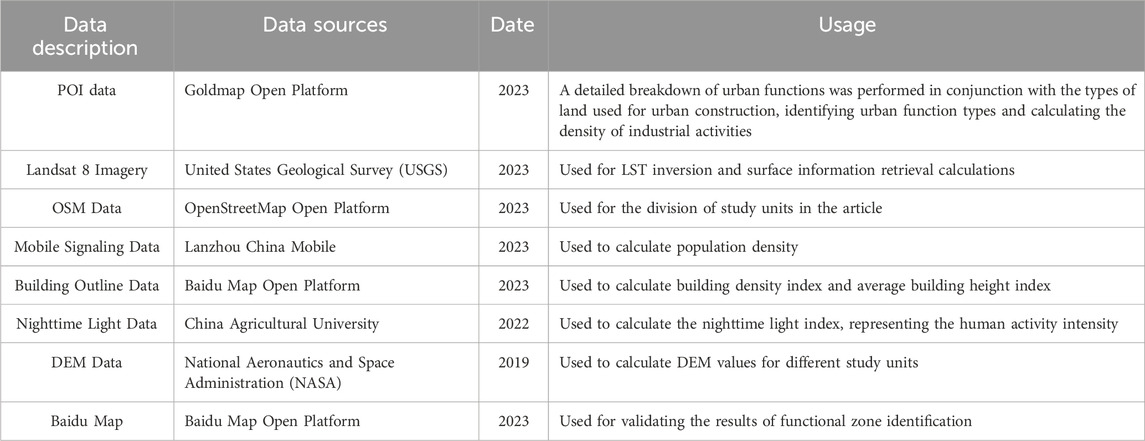
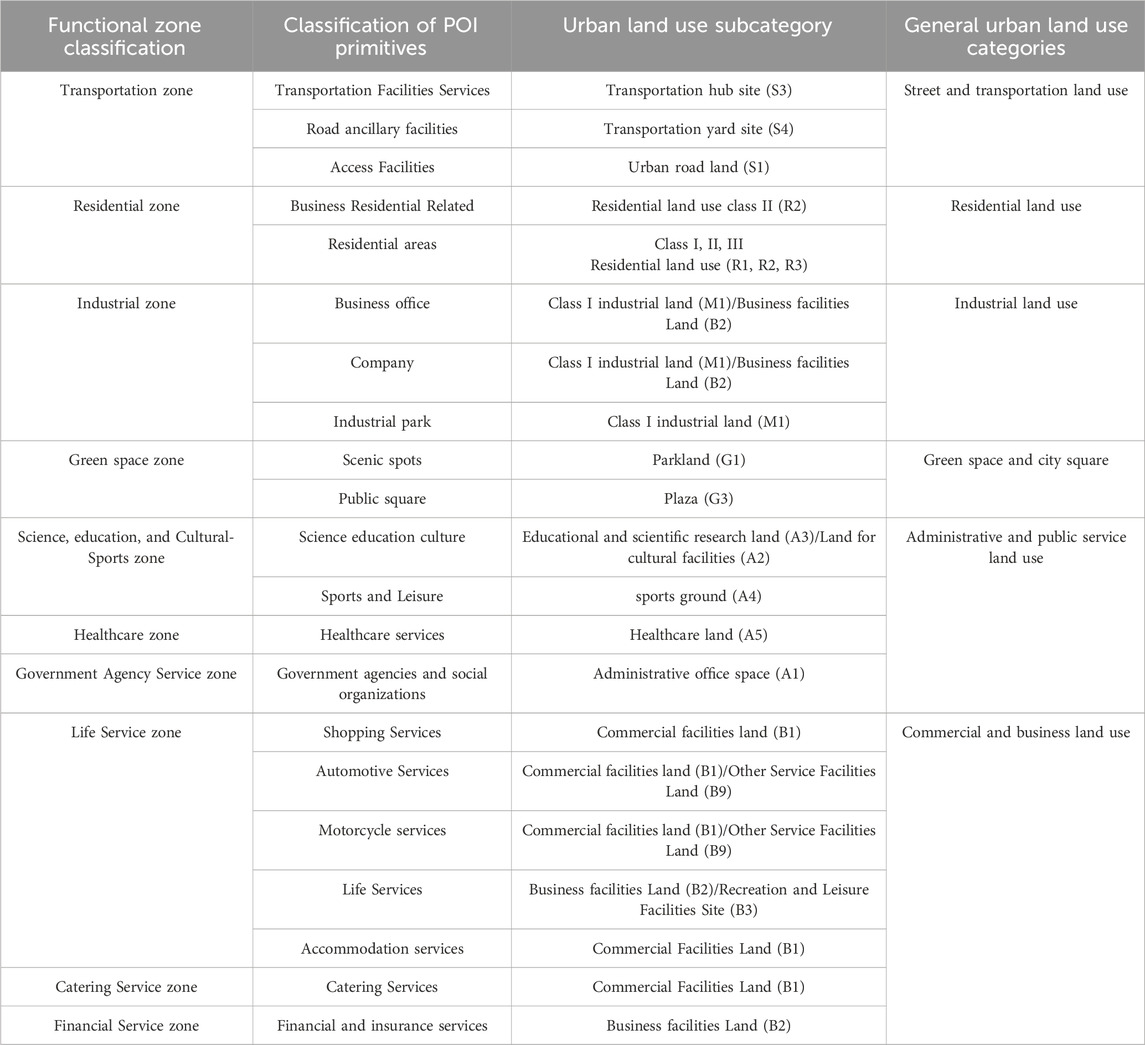
The multisource data utilized in this study include POI data, Landsat 8 imagery, OSM road network data, Mobile Signaling Data, building outline data, nighttime lighting data, and DEM data. The detailed parameters of these data sources are shown in Table 1. Specifically, a total of 91,787 POI records for Lanzhou City as of August 2023 were obtained through the open API provided by Goldmap. Due to issues such as redundant types, cross-repetition, and inconsistent coordinates in the original POI data, this study integrates the POI categories with the Urban Land Use Classification and Planning and Construction Land Use Standards (GB50137-2011) to subdivide urban functions in detail. The POI data were classified into 21 types and summarized level-wise according to the main urban functional characteristics, ultimately identifying 10 types of urban functional zones. The detailed results are provided in Table 2. The Landsat 8 imagery was acquired on 13 August 2023, with a resolution of 30 m and a cloud cover of 0.01%. In this study, the imagery was preprocessed using geometric correction, atmospheric correction, and study area cropping.
OSM road network data are derived from the OpenStreetMap geodata platform. The Mobile Signaling Data were obtained from gridded datasets collected by China Mobile in Lanzhou City on 23 August 2023 (a weekday), with a spatial resolution of 200 m by 200 m. The building contour data were obtained through the open API provided by Baidu Map, which contains building contour lines and height information. A total of 41,911 building contour records were obtained in August 2023 within the study area after data cleaning and clipping. The nighttime light data were obtained from China Agricultural University, which integrated nighttime light observations from DMSP and VIIRS to generate a comprehensive and consistent NTL dataset on a global scale. The resolution is 1 km. The DEM data were obtained from the National Aeronautics and Space Administration (NASA) at a resolution of 12.5 m.
2.3 Research methodology
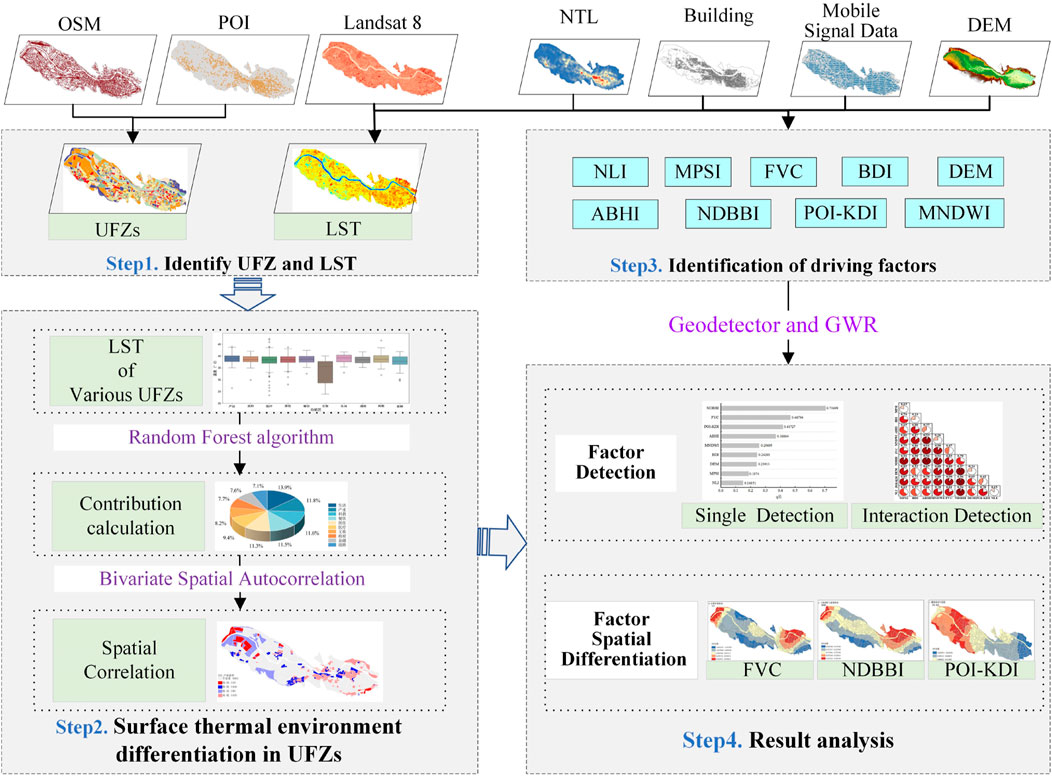
The research technology roadmap constructed in this study is shown in Figure 2. Firstly, this paper proposed a two-factor weighted dominant function vector model of “population heat—land use scale” that couples mobile signaling data and POI data to determine the urban function type of each minimum plot unit based on the OSM road network. Secondly, Landsat 8 imagery was selected to invert and analyze the LST of the central urban area of Lanzhou. Thirdly, A Random Forest algorithm was used to assess the contribution of each type of urban functional zone to the surface thermal environment, and a bivariate spatial autocorrelation method was employed to explore the spatial differentiation of the surface thermal environment in each type of urban functional zone. Finally, GeoDetector and GWR models were selected to analyze the spatial heterogeneity of the drivers of the urban thermal environment and their influence effects. Finally, GeoDetector and GWR models were selected to analyze the spatial heterogeneity of the driver factors of the urban thermal environment and their influences.
2.3.1 Land surface temperature inversion
2.3.1.1 Mono-window algorithm
The mono-window algorithm, derived by Qin et al. (Qin et al., 2001) from the surface radiation conduction equation, utilizes data from Landsat TM band 6 to invert surface temperatures. This algorithm is applicable to deriving surface temperatures from single thermal band remote sensing data. Additionally, it is suitable for use with Landsat 8 data. In this study, we use the algorithm to invert the surface temperature of the downtown area of Lanzhou City, as shown in Equations 1–3 (Chen et al., 2022):
where,
2.3.1.2 Classification of urban thermal field intensity
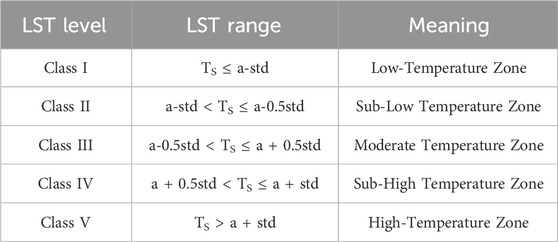
The intensity of the urban thermal field can reflect the spatial distribution characteristics of relatively high and low-temperature regions in the city. To avoid the influence of temperature differences on the research results, this study normalizes the temperature and uses the mean - standard deviation method to normalize the LST inversion results hierarchically, as shown in Equation 4:
where,
2.3.2 Identification of urban functional zones
2.3.2.1 Division of study units
In this study, the OSM road network is preprocessed by selecting highways, railroads, primary roads in towns, primary urban roads, and secondary roads to address the interrupted paths. For isolated roads, if the distance between the ends of the road and the nearest neighboring road is less than 10 m, they are extended and connected; the remaining segments are deleted. Based on GF-2 imagery, road information such as highways, railroads, primary roads in townships, and primary and secondary roads in urban areas were integrated and appropriately deleted. Subsequently, the central urban area of Lanzhou City was divided into 1,160 block units.
2.3.2.2 Construction of a two-factor weighted dominant function vector model
Since POI data does not contain land use scale information, this study constructs general land use scale weights for assignment. Meanwhile, from the perspective of the supply and demand relationship in urban functions, POI data only provides geospatial supply information and fails to capture residents’ demand. Therefore, this study combines POI data with mobile signaling data that reflects population dynamics to capture the diverse socio-economic elements and residents’ travel information and depict urban functions comprehensively. Accordingly, this study divides urban functional categories by constructing a standardized dominant function vector model based on the two factors of “population heat—land use scale”. Among them, the general land scale is assigned and scored based on “China’s Current Business Classification Standards” (GB/T18106-2010) and “Urban Public Service Facilities Planning Standards” (GB50442), as detailed in Table 4. The study calculated the population density per POI unit for different functional types within each area, that is, population heat weights, which reflect the demand and usage intensity of residents for each type of functional area. As shown in Equation 5, for specific calculations.
where,
To this end, the kernel density of POIs within the smallest research unit is first calculated, as shown in Equation 6 (Yu et al., 2015):
where,
where,
2.3.3 Methodology for analyzing surface thermal environment differentiation in urban functional zones
To analyze the surface thermal environment differentiation in urban functional zones, firstly, we employ the One-way analysis of variance (ANOVA) to preliminarily test if there are significant differences in the surface thermal environments across different urban functional zones. Secondly, the Random Forest algorithm is used to further explore the contribution levels of different urban functional zones to the surface thermal environment. Lastly, the Bivariate spatial autocorrelation method is applied to analyze the spatial distribution relationships and dependencies between urban functional zones and the surface thermal environment. Additionally, these three methods have been successfully applied in the field of urban studies (Adeola Fashae et al., 2019; Ma et al., 2023; Ai et al., 2024).
2.3.3.1 One-way analysis of variance (ANOVA)
The basic principle of ANOVA is to decompose the overall variance into within-group variance and between-group variance, and to determine whether there is a significant difference between group means by comparing these two variances (Chen et al., 2022). Based on its simplicity and effectiveness, we employ the ANOVA to test whether there are significant differences in the surface thermal environments across different urban functional zones.
2.3.3.2 Random forest algorithm
The Random Forest algorithm was used to assess the differences in surface thermal environments in different urban functional zones. It is a classical machine learning algorithm that is widely used in regression and classification analysis (Breiman, 2001). The algorithm has the advantage of high accuracy without overfitting (Gao et al., 2020). Therefore, based on the ANOVA, we introduce the Random Forest algorithm to further analyze the contributions of various urban functional zones to the surface thermal environment.
2.3.3.3 Bivariate spatial autocorrelation
Spatial autocorrelation analysis is a measure used to study the degree of aggregation in spatial unit observations. Bivariate local spatial autocorrelation is mainly used to measure the spatial distribution association and dependence characteristics between two variables. The larger the value of bivariate local Moran’s I, the higher the degree of spatial autocorrelation. The specific calculation method is detailed in the literature (Zhang Z. et al., 2023). Based on the foundation of the ANOVA and the Random Forest algorithm, we introduce the Bivariate local spatial autocorrelation method to further investigate the surface thermal environment differentiation in urban functional zones from a spatial relationship perspective.
2.3.4 Driving factors of surface thermal environment differentiation in urban functional zones
To analyze the driving factors behind the differentiation of the surface thermal environment in urban functional zones, we select the GeoDetector to measure the influence strength and interactions of various driving factors. The GWR models are employed to better reveal the spatial relationships between the urban thermal environment and various driving factors.
2.3.4.1 GeoDetector and indicator selection
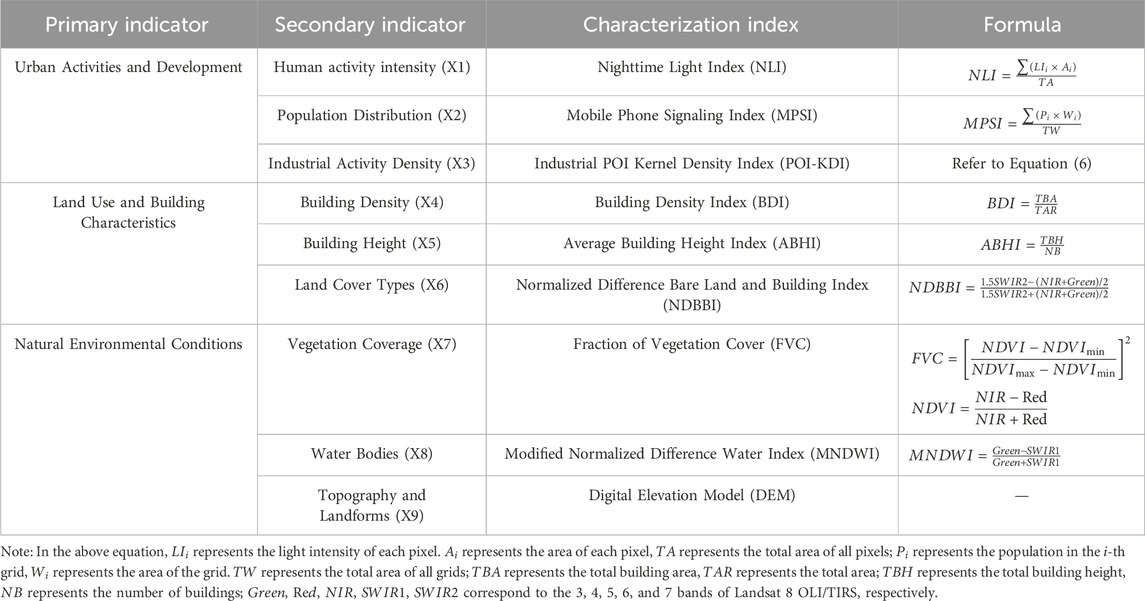
GeoDetector is a statistical method for detecting spatial dissimilarity and revealing driving forces. It measures the explanatory power of each independent variable on the dependent variable by comparing the consistency of their spatial distributions. In this paper, with factor detection and interaction detection modules, we screen the critical factors affecting the variability of surface thermal environments in different urban functional zones. The specific calculation methods used are described in the literature (Wang et al., 2021). The selection and calculation methods of the indicators in the study are shown in Table 5.
2.3.4.2 Geographically weighted regression model
GWR models incorporate the spatial characteristics of the data, enabling the examination of spatial differences and variability in local parameters. This approach reflects the spatial non-stationarity of variable relationships. In this study, GWR models are used to illustrate the spatial heterogeneity of driving factors across different research units. The specific calculation methods are detailed in the literature (Wang et al., 2019).
3 Results and analysis
3.1 Spatial distribution characteristics of the surface thermal environment
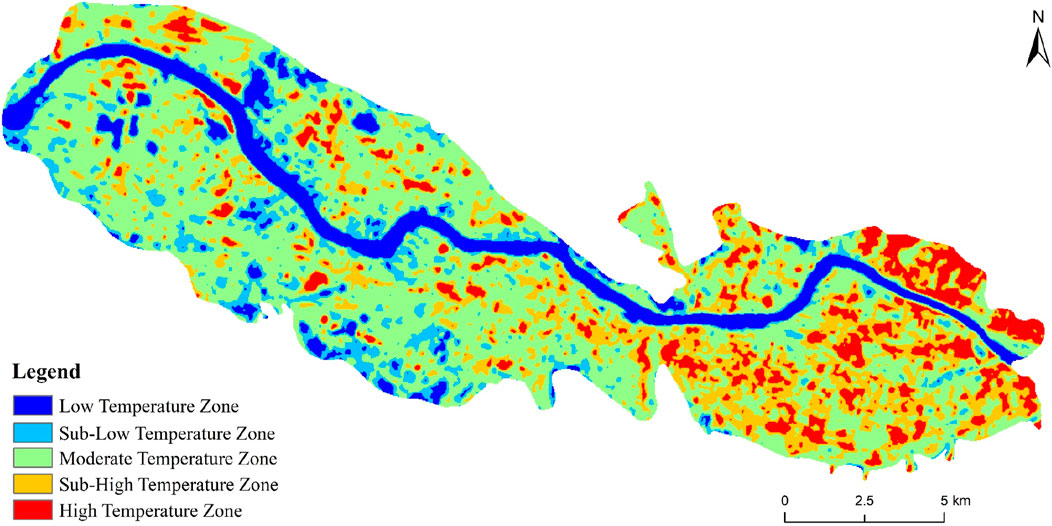
August is the period with the highest mean surface temperatures and relatively minor surface temperature fluctuations in Lanzhou. Therefore, this paper inverts the LST in the central urban area of Lanzhou on 13 August 2023, based on the single-channel algorithm. The mean - standard deviation method is utilized to normalize and classify the inverted LST results, dividing the study area’s LST into five levels: Low-Temperature Zone, Sub-Low Temperature Zone, Moderate Temperature Zone, Sub-High Temperature Zone, and High-Temperature Zone. The calculation results are shown in Figure 3. The overall analysis indicates that the temperature is lower in the central city near the Yellow River and relatively higher in the urban fringe areas. High-temperature zones are primarily located in Chengguan District, the city’s economic, political, and demographic center; Xigu District, which bears the burden of heavy petrochemical industry; northwestern Anning District; and eastern Qilihe District. These areas overlap highly with major industrial zones and large-scale business districts.
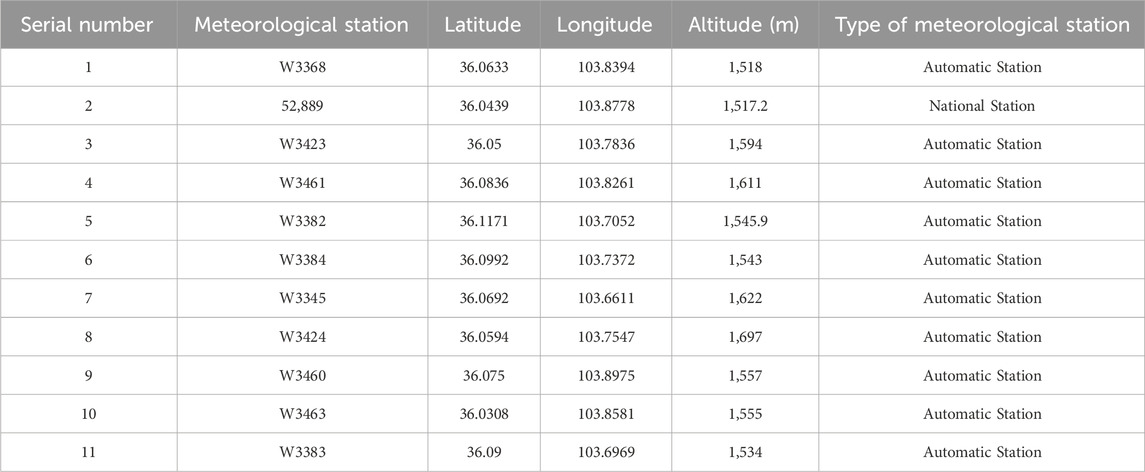
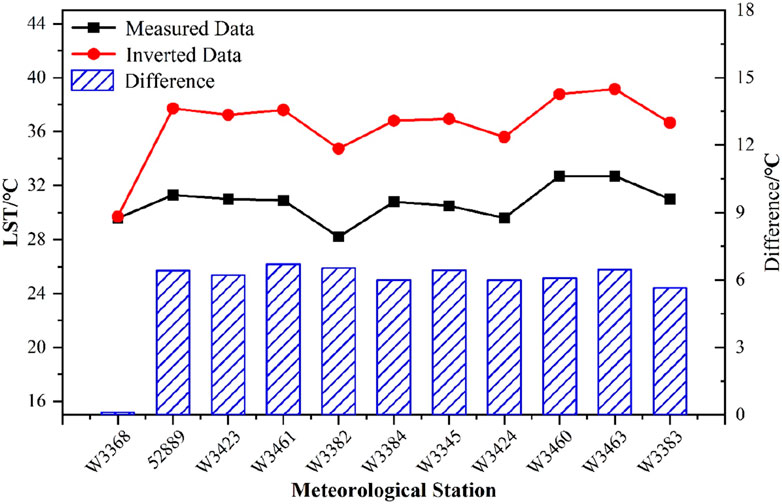
The accuracy of the LST inversion results was verified using air temperatures obtained from 11 meteorological stations within the study area, including 10 automatic meteorological stations and 1 national basic meteorological station. Details of the meteorological stations are provided in Table 6. The Landsat 8 image of Lanzhou city was acquired at 11:37 a.m. Beijing Time, which is the LST inversion time. Therefore, the weighted average of the meteorological station data obtained at 11:00 a.m. and 12:00 p.m. Beijing Time was used as the validation data and compared with the average inverted LST of the 3 × 3 pixel area closest to the weather station. The results are shown in Figure 4. The mean LST at the meteorological stations was approximately 5.7°C higher than the mean air temperature because the meteorological stations monitor air temperature at 2 m above ground level, which is usually lower than the LST. Nevertheless, the inverted temperature trend closely matches the measured temperature trend, confirming that the proposed algorithm used for temperature inversion has high stability. We used the Pearson correlation analysis method (Huang R. et al., 2024) to explore the correlation between measured data and inverted data, obtaining a correlation coefficient of 0.7125 with a p-value of 0.0139. Since the p-value is less than 0.05, the results indicate a significant positive correlation between the two. This outcome suggests that the reliability of our LST inversion results is high.
3.2 Spatial distribution characteristics of urban functional zones
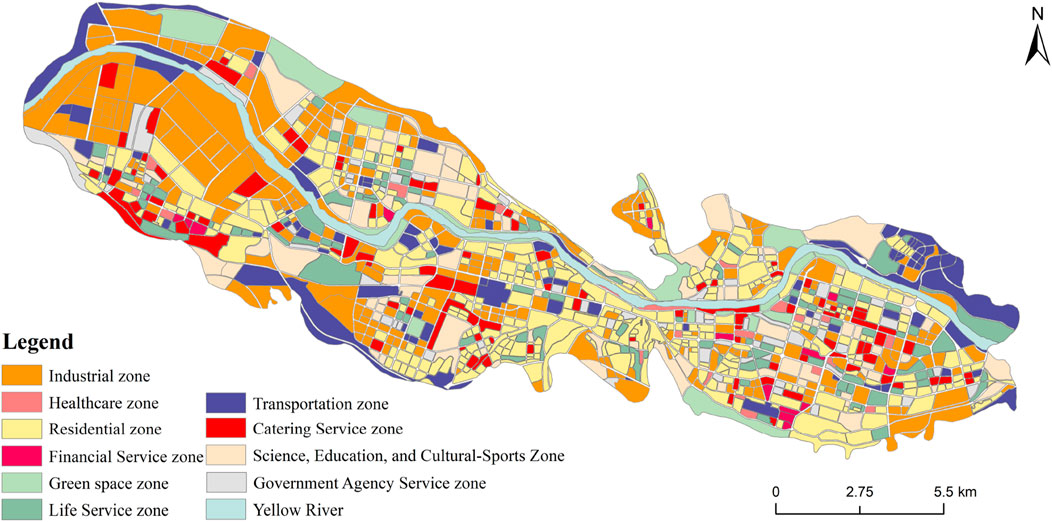
The identification results (Figure 5) are obtained by calculating the dominant functional vector for each POI category within each block unit using a two-factor weighted model of “population heat—land use scale,” and determining the type of dominant functional zone based on its maximum value. The results show that the industrial zone has the largest percentage of the area, while the financial service zone has the smallest. From the perspective of spatial distribution, industrial zones are clustered in large contiguous areas in Xigu District, the core industrial zone of Lanzhou. Residential zones exhibit an overall spatial pattern characterized by higher density in the east and lower density in the west, as well as higher density in the south and lower density in the north. The science, education, and cultural-sports zones are primarily concentrated in Chengguan District and Anning District, which have rich education resources and high population densities. Zones characterized by green spaces, healthcare, government agency service, residential, catering service, transportation, and financial service functions exhibit a spatial distribution pattern of overall dispersion with local concentrations.
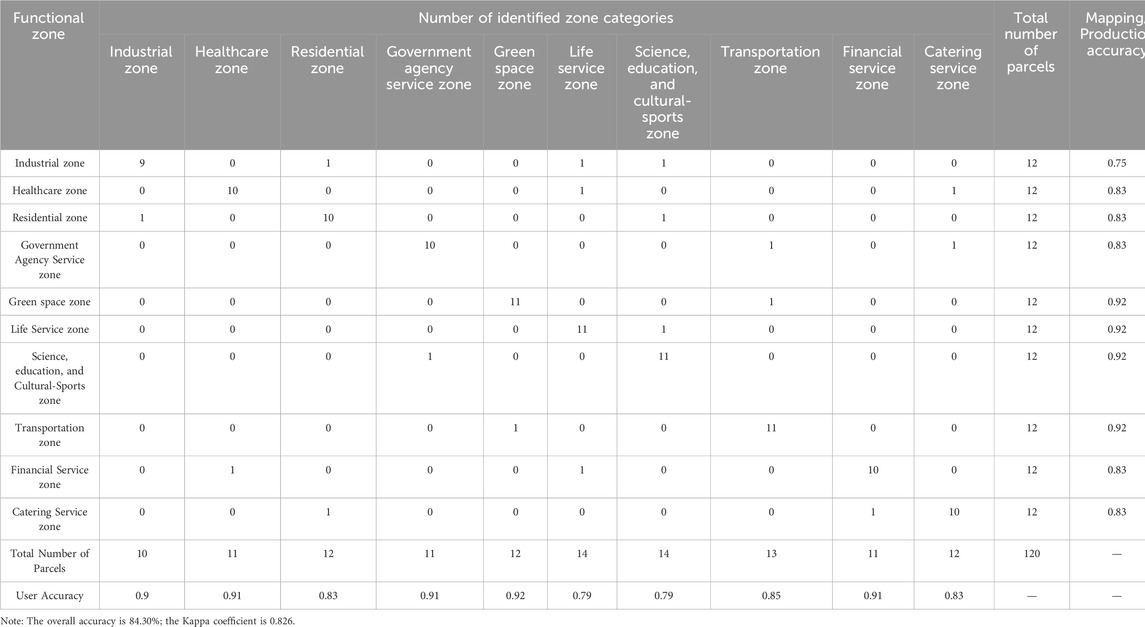
To evaluate the accuracy of urban functional zone recognition, this study utilizes the confusion matrix to assess image classification accuracy and perform the validation (Xu et al., 2021). Specific accuracy assessment metrics include: user accuracy, producer/mapping accuracy, overall accuracy, and the kappa coefficient. The true value selection of urban functional zones is mainly based on the Detailed Regulatory Planning for Lanzhou City Center and Baidu map, obtained through manual visual interpretation. From each functional type, 12 sample plots were randomly and uniformly selected, resulting in 120 sample plots for the precision evaluation of urban functional zone identification. The detailed results are listed in Table 7, showing an overall precision of 84.3% and a Kappa coefficient of 0.826. Overall, the high level of accuracy demonstrates the method’s effectiveness.
3.3 Surface thermal environment differentiation in urban functional zones
3.3.1 Relevance between urban functional zones and surface thermal environment
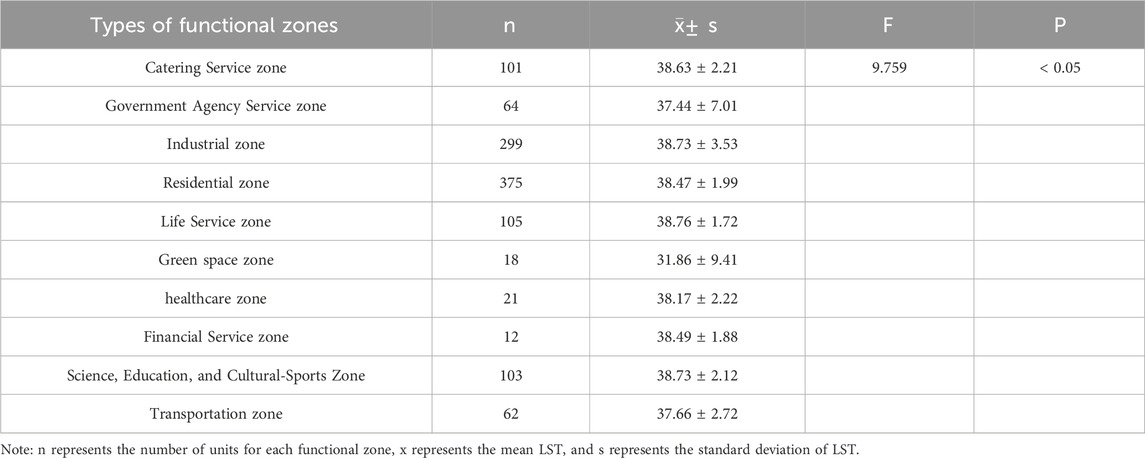
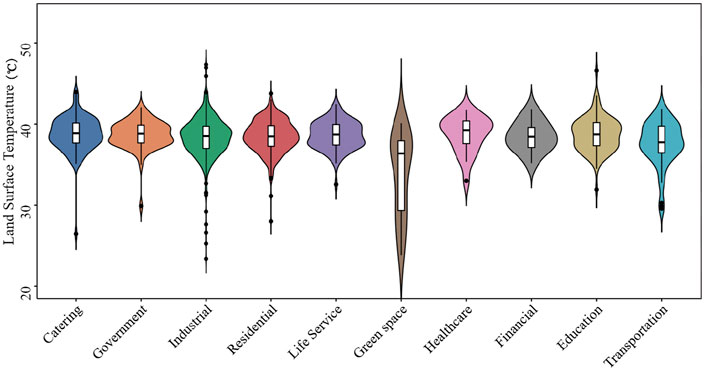
To investigate the different surface thermal environments in various urban functional zones, this study conducted an ANOVA between urban functional zones and LST. The results show a P-value of < 0.05, suggesting significant differences in LST across different urban zones. The specific analysis outcomes are detailed in Table 8. Meanwhile, the LST distributions of different functional zones were counted, and the results are shown in Figure 6. The analysis of the results indicates that the LST is relatively high in the life service, industrial, science, education, and cultural-sports, catering service, and transportation zones.
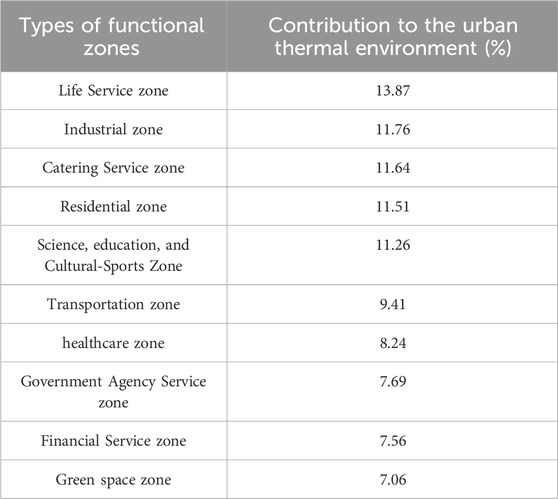
To further assess the impact of different urban functional zones on the surface thermal environment, this study estimates the contribution of each zone to the surface thermal environment using the Random Forest algorithm. This study improves the overall predictive performance and computational efficiency of the model by constructing 100 decision trees (n_estimators = 100) and synthesizing their prediction results. The performance of the model is evaluated by calculating the Mean Squared Error (MSE) and R-squared values. The final calculation results are listed in Table 9. Among the various types of urban functional zones, the life service zone has the most significant impact on the surface thermal environment due to its dense human flow and high energy consumption. Closely following is the industrial zone, whereas the green space zone has the least impact. The impact of various urban functional zones on the surface thermal environment ranked from greatest to least is as follows: life service zone > industrial zone > catering service zone > residential zone > science, education, and cultural-sports zone > transportation zone > healthcare zone > government agency service zone > financial service zone > green space zone.
3.3.2 Surface thermal environment spatial differentiation in urban functional zones
This study calculates the local spatial autocorrelation indices between various types of functional zones and the surface thermal environment to investigate the spatial correlation between urban functional zones and the surface thermal environment. The results show that the Moran’s I index for different urban functional zones is significant at the 1% confidence level, which indicates significant spatial agglomeration and dependence between urban functional zones and the surface thermal environment in Lanzhou city center. The study creates the bivariate local spatial autocorrelation (LISA) cluster map, the results are shown in Figure 7. Overall, except for the green space zone, the spatial correlation between the surface thermal environment and other urban functional zones is predominantly characterized by high-high clusters. However, high-low clusters are not significant and are mostly scattered. Low-high clusters are mainly concentrated along the Yellow River.
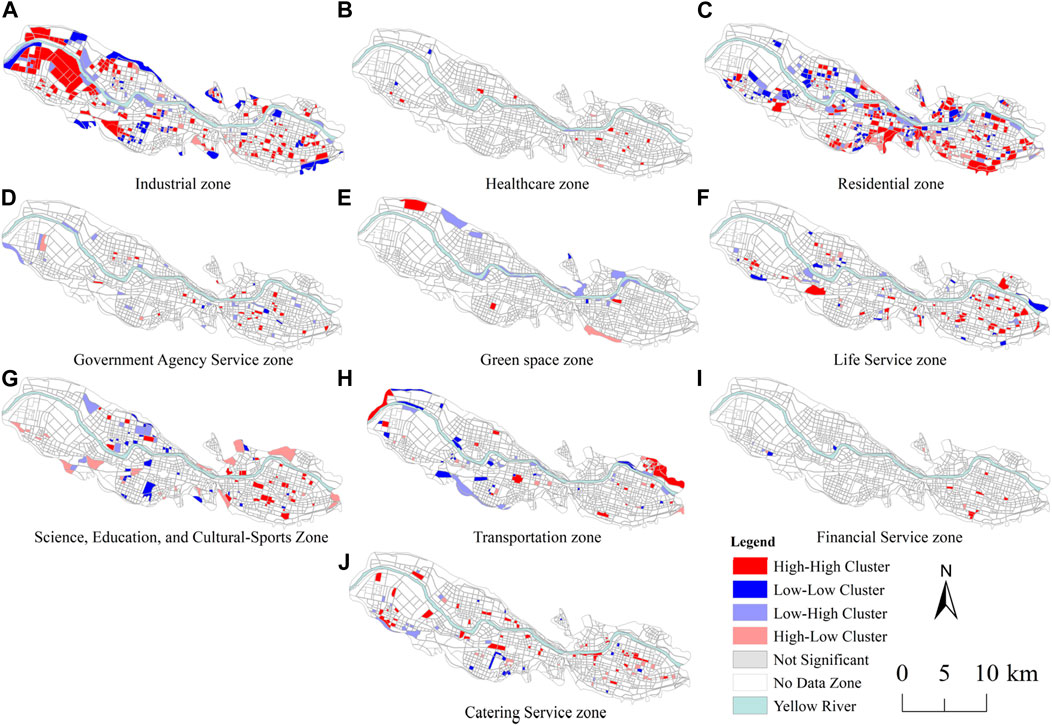
Figure 7. Bivariate local spatial autocorrelation (LISA) cluster map of LST with various kinds of urban functional zones. (A) Industrial zone. (B) Healthcare zone. (C) Residential zone. (D) Government Agency Service zone. (E) Green Space zone. (F) Life Service zone. (G) Science, Education, and Cultural-Sports Zone. (H) Transportation zone. (I) Financial Service zone. (J) Catering Service zone.
Detailed analysis reveals that the high-high clusters of the surface thermal environment and industrial zones are distributed in Xigu District, the core industrial zone of Lanzhou. Low-low clusters are concentrated in the peripheral areas of the central city. High-high clusters of the surface thermal environment and life service zone are concentrated in the densely populated urban district. Low-low clusters are located at the edge of the central city. High-high clusters of the surface thermal environment and catering service zone are distributed along Zhangye Road Street in Chengguan District and Xihu Street in Qilihe District, among others. Low-low clusters are located on the periphery of the central city. High-high clusters of the surface thermal environment and residential zone are primarily located in the densely populated Chengguan District. Low-low clusters are frequently found in areas with good green coverage in Xigu and Anning Districts. High-high clusters of the surface thermal environment and science, education, and cultural-sports zone are concentrated in Chengguan District. Low-high clusters are mainly found in the Anning District, which has abundant high-education resources and good green coverage. Low-low clusters are sporadically distributed. High-high clusters of the surface thermal environment and transportation zone are concentrated around major transport hubs and the city outskirts. Low-low clusters are sporadically distributed. Low-high clusters of the surface thermal environment and green space zone are primarily concentrated along the banks of the Yellow River and at tourist attractions and other recreational areas. High-high clusters of the surface thermal environment and the financial service zone, government agency service zone, and healthcare zone are mostly concentrated in Chengguan District. Other types of clusters are sporadically distributed.
3.4 Analysis of surface thermal environment driving factors
Surface Thermal Environment Differentiation in Urban Functional Zones is influenced by various factors, including the natural environment, human activities, land use, and building characteristics (Yuan and Bauer, 2007). This study synthesizes earlier research findings and selects nine influencing factors across three dimensions—urban activities and development, land use and building characteristics, and natural environmental conditions. Using different functional blocks as a basis, it investigates how these factors influence the spatial patterns of the surface thermal environment within urban functional zones.
3.4.1 Single factor detection
In this study, continuous independent variables were discretized using Jenks’ natural break analysis to transform them into type variables for factor detection and to obtain the explanatory power of single factors, referred to as the q-value; results are shown in Figure 8. The p-values for each factor were below 0.001, and all passed the significance test. Among them, the q-values for NDBBI, FVC, and POI-KDI are all greater than 0.4, indicating that the thermal environment of urban functional zones is significantly influenced by land cover types, vegetation coverage, and industrial activity density.
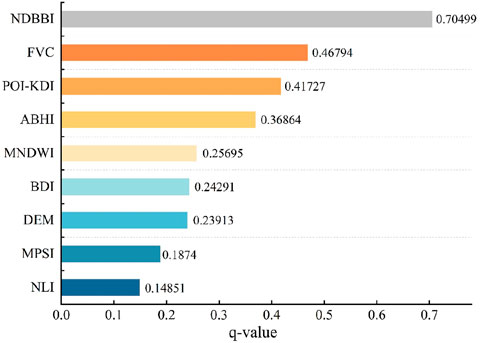
Figure 8. Explanatory power statistics for impact factors. NDBBI, Normalized Difference Bare Land and Building Index; FVC, Fraction of Vegetation Cover; POI-KDI, Industrial POI Kernel Density Index; ABHI, Average Building Height Index; MNDWI, Modified Normalized Difference Water Index; BDI, Building Density Index; DEM, Digital Elevation Model; MPSI, Mobile Phone Signaling Index; NLI, Nighttime Light Index.
The strong capacity of Bare Land and Building to absorb and reflect solar radiation, coupled with a high proportion of building-covered areas in central Lanzhou City, results in the most substantial impact on LST. Furthermore, the transpiration effect of vegetation helps to reduce LST. With well-established green infrastructure in the central urban area of Lanzhou, vegetation coverage plays a crucial role in regulating the urban thermal environment. Additionally, areas with dense industrial activity are also regions of high energy consumption and heat emissions. As an industrial city, Lanzhou has a relatively high proportion of secondary industry, with large contiguous clusters in Xigu District, the core industrial zone of Lanzhou. Therefore, it is also a key factor contributing to the UHI effect.
3.4.2 Interaction detection of factors
The study utilized the Interaction Detection module of GeoDetector, and the results are shown in Figure 9. The results show that the interaction between various driving factors exhibits nonlinear enhancement, indicating that the interaction of any two factors has a stronger explanatory power compared to single factors.
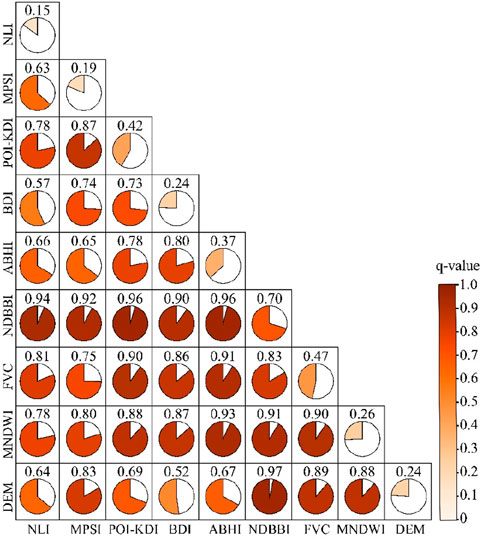
Figure 9. Interactions of different driving factors. NDBBI, Normalized Difference Bare Land and Building Index; FVC, Fraction of Vegetation Cover; POI-KDI, Industrial POI Kernel Density Index; ABHI, Average Building Height Index; MNDWI, Modified Normalized Difference Water Index; BDI, Building Density Index; DEM, Digital Elevation Model; MPSI, Mobile Phone Signaling Index; NLI, Nighttime Light Index.
NDBBI, FVC, and MNDWI generally have high interactions with other factors, with q-values greater than 0.7. The interactions between these four factors are also very significant, with q-values greater than 0.8, further indicating their essential roles in mutual influence. The underlying reason is that the above factors have direct physical or ecological links with the surface thermal environment of urban functional zones while also playing complementary or mutually reinforcing roles with other factors in regulating the urban thermal environment. For example, areas with high bare land and building coverage often have dense commercial activities. The interactions between these areas and industrial activity density, building density, and human activity intensity enhance the UHI effect in various urban functional zones.
The MPSI and NLI have lower explanatory power when acting alone, but their explanatory power improves to ranges of 0.63–0.92 and 0.57–0.94, respectively, when interacting with other factors. This result indicates that population distribution and human activity intensity do not directly affect the surface thermal environment in urban functional zones but instead influence its spatial differentiation indirectly through coupling with other factors.
3.4.3 Analysis of spatial heterogeneity of driving factors
The three critical driving factors identified by the GeoDetector were incorporated into the GWR models to investigate the spatial heterogeneity of their impact on the surface thermal environment in urban functional zones further. The calculation results are shown in Figure 10.
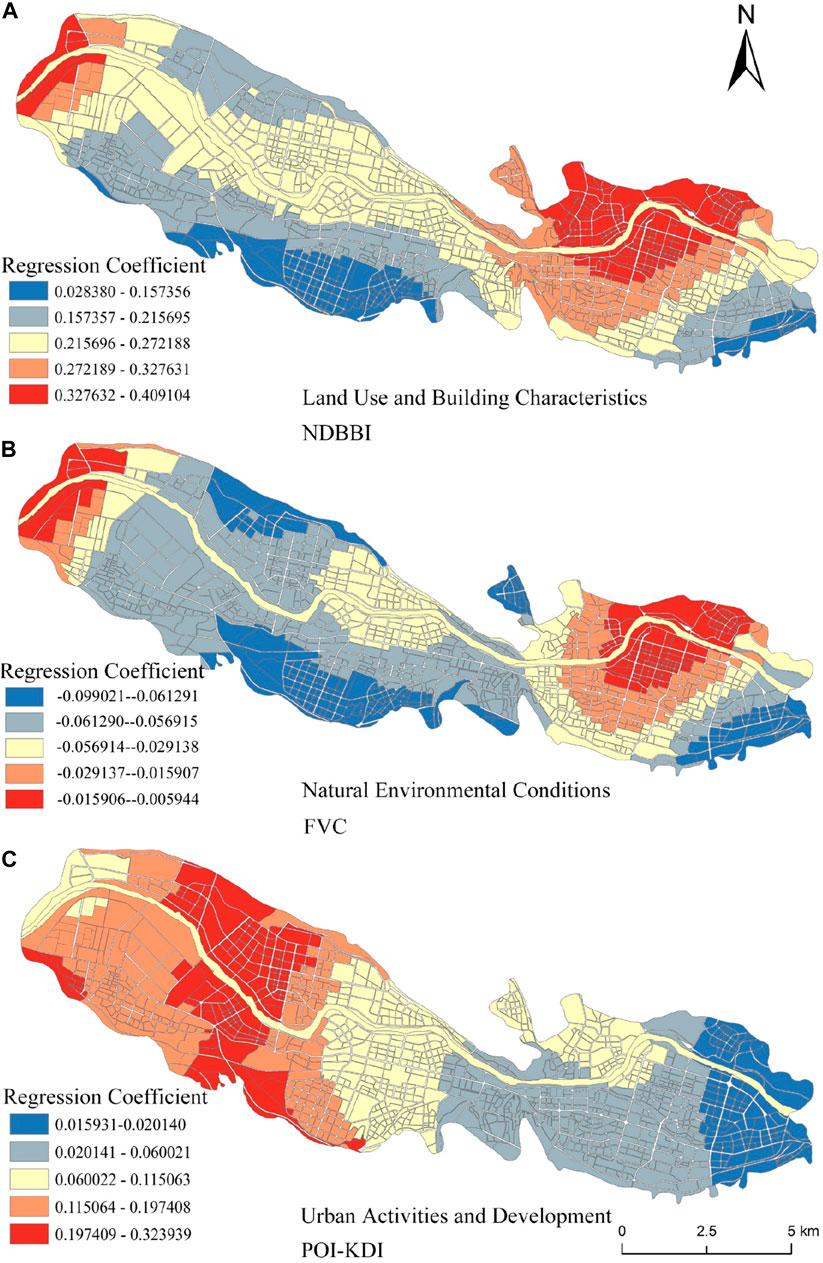
Figure 10. Spatial differentiation of regression coefficients for driving factors in the GWR. (A) Land use and building characteristics NDBBI. (B) Natural environmental conditions FVC. (C) Urban activities and development POI-KDI.
In the dimension of land use and building characteristics, the overall regression coefficient for NDBBI ranges from 0.028 to 0.409, indicating a positive directional impact on the surface thermal environment in urban functional zones. The trend generally exhibits a decrease from the central Chengguan District outward. The high-value zone is concentrated on Yanchang Road and Caochang Street in Chengguan District. The low-value zone is located in Pengjiaping town, in the southern part of Qilihe District. In the dimension of natural environmental conditions, the regression coefficient for FVC ranges from −0.099 to −0.006, indicating that vegetation coverage has a negative directional impact on the surface thermal environment in urban functional zones. Areas with high absolute values are primarily located on Donggang Street in Chengguan District, Pengjiaping Town in Qilihe District, and Anningbao Street in Anning District. Areas with low absolute values are concentrated in Chengguan District. In the dimension of urban activities and development, the regression coefficient for POI-KDI ranges from 0.016 to 0.324, indicating a positive directional impact on the surface thermal environment in urban functional zones. High-value zones are primarily located on Chenping Street in the Xigu District and Liujiabao Street in the Anning District. The low-value zone is located on the eastern side of Chengguan District.
4 Discussion
As the UHI effect intensifies, quantitative research on the spatial differentiation and influencing factors of the surface thermal environment within urban functional zones, at the scale of functional zones that characterize the physical interior of the city, can effectively demonstrate the impact of various human activities on the formation of UHI. However, most current studies employ either POI or remote sensing images as the sole data source to identify urban functional zones (Min et al., 2019; Li et al., 2021; Chen et al., 2022; Wang H. et al., 2022), and the impacts of urban functional zones delineated based on human activities on the thermal environment have not been fully considered. Meanwhile, current studies primarily rely on urban construction land classification, which divides urban functional zones into six categories: residential zone, government agency service zone, commercial zone, industrial zone, green space zone, and transportation zone (Min et al., 2019; Chen et al., 2022). However, these studies lack in-depth discussions on the secondary subcategories of functional zones closely related to residents’ daily lives, such as life service zone, catering service zone, healthcare zone, and science, education, and cultural-sports zone. Therefore, this study integrates mobile signaling data, including information on residents’ behavioral demands, with POI data that reflects the supply of spatial entity elements to classify urban functional zones into ten categories, effectively reflecting the impact of human activities on UHI formation from the perspective of multiple urban functional zoning.
In this study, it was found that the life service zone, industrial zone, catering service zone, and residential zone exhibited higher surface temperatures, which is largely consistent with the findings of Huo et al. (2023) and Li T. et al. (2020). The differences in the surface thermal environment across various urban functional zones are primarily influenced by the NDBBI, FVC, and POI-KDI. Therefore, urban planning should focus on the layout of buildings, green space and water bodies. In residential zones, natural surface patches such as green spaces and water bodies can be interspersed, and building density can be controlled. Additionally, local ventilation and heat dissipation can be enhanced through the combination of buildings of varying heights. In the life service, catering service, and financial service zones, building density should be reasonably restricted, with attention to variations in building height and volume, to enhance the convection heat exchange of air. In the science, education, and cultural-sports zone, healthcare zone, and government agency service zone, ecological retrofit measures such as rooftop greening and wall greening can be integrated with the functions of the buildings to enhance the evaporative cooling effects within the area. Green spaces and water bodies of a certain scale should be established at the edges or inside industrial zones to minimize their warming effect on the surrounding urban functional zones. The planting of deciduous broad-leaved trees, such as willows, should be increased in the green space zone to reduce the extent of impervious surfaces. For instance, the use of non-essential impervious surfaces, such as paved concrete, should be minimized in park construction. In the transportation zone, the layout should incorporate as many natural surfaces as possible, such as protective green space, parkland, and street greening. The government should develop and enforce a stringent policy for the protection of urban non-built land, while promoting the implementation of green roofs, vertical gardens, and other eco-building measures in both new and existing buildings.
Principal component analysis (PCA), GeoDetector, and GWR models are employed to analyze the extent to which various influences affect the target variable. PCA, based on linear algebra, utilizes dimensionality reduction to transform multiple indicators into a few composite indicators, known as principal components (Xue et al., 2023). For instance, Xiong and Zhang (2021) employed the PCA method to analyze the factors influencing the thermal environment in human residential areas, finding that urban construction intensity and topography are the main influencing factors. However, PCA can only determine the influence strength of different factors and does not reflect the interactions and spatial heterogeneity of these factors. GeoDetector is based on statistical principles and explores the influences behind geographic phenomena through stratified analysis and interaction detection (Wang et al., 2021). For instance, Li M. et al. (2024) utilized the interaction detection module of the GeoDetector to explore the interactions among factors influencing snow cover changes in the headwaters of the Yangtze and Yellow Rivers, finding that the interaction between relative humidity and temperature had the strongest explanatory power. Meanwhile, GWR models are used to analyze local relationships in spatial data, taking into account the effects of changes in geographic locations on the regression relationships (Wee et al., 2024). For example, Wang et al. (2019) utilized the GWR models to explore the spatial variation in the determinants of urban carbon emissions in China. Therefore, the GeoDetector and GWR models employed in this study are more effective in exploring the interaction and spatial heterogeneity of the drivers of the surface thermal environment in urban functional zones, compared to the PCA used by current scholars.
The local climate zone (LCZ) system effectively highlights the impact of surface geometry and cover characteristics on the local climate (Liu et al., 2017). For example, Zheng et al. (2024) investigated the effects of nine LCZs in Beijing on UHI and urban dry islands (UDI) using LCZ data at 120 m resolution, along with hourly temperature and humidity data from automatic weather stations. The study found that open LCZs were the main contributors to UHI and UDI. Chen Y. et al. (2023) analyzed the UHI effect in six LCZs in Guangzhou using temperature data collected from stationary measurements over 405 days. The study revealed that heat island intensity was significantly higher in high-density built-up areas compared to open LCZs. The LCZ system is an effective approach for investigating the UHI effect; however, the LCZ system primarily emphasizes the relationship between the physical characteristics of the urban landscape and UHI. Compared to the LCZ system, the urban functional zone scale focuses more on capturing the impacts of human activities on UHI. From an urban management perspective, the urban functional zone scale better facilitates the understanding and analysis of human activities’ impact on urban temperatures, enabling more effective formulation of urban thermal environment management measures at the fundamental unit of urban planning (Yu et al., 2021). Therefore, the urban functional zone can be used as another effective tool to quantify the UHI effect.
However, this study still has some shortcomings. For example, the Landsat 8 imagery only provides LST observations during the daytime, which hinders the effective monitoring of the surface thermal environment in urban functional zones at night. In addition, the inherent limitations of POI data characteristics and classification labels impede further refinement of urban functional divisions. Moreover, the recognition capability of POI data is relatively weak in areas with low building densities and on the urban outskirts. Due to the influence of the spatial distribution characteristics of data, this study focuses solely on the central urban area characterized by a dense transportation network and high population density and does not discuss the characteristics of functional zones across the entire Lanzhou City. Future studies will utilize multi-temporal data to incorporate the temporal characteristics of the spatial differentiation of the urban thermal environment based on functional zoning.
5 Conclusion
This study uses Lanzhou City, a central city in Northwest China, as a study area to propose a quantitative method for identifying urban functional zones based on the two-factor weighted dominant function vector model of “population heat—land use scale” and categorizes urban functions accordingly. Furthermore, using Landsat 8 imagery for LST inversion, the study explored the spatial heterogeneity and driving factors of the surface thermal environment in urban functional zones. The results indicate:
(1) LST is lower near the Yellow River area in the central urban district of Lanzhou City, while LST in the urban fringe areas is relatively higher. High-temperature zones highly overlap with major industrial zones and large-scale business districts. Based on observational data from meteorological stations for validation, the analysis results indicate high LST inversion accuracy. Ten functional zones were identified in the study area, with the most widespread industrial zones and the least distributed financial service zones. Industrial, residential, science, education, and cultural-sports zones exhibit relatively concentrated distribution characteristics, while the spatial layout of other functional zones is relatively dispersed. The overall accuracy of the identification results obtained using the confusion matrix method is 84.30%, demonstrating the effectiveness of the proposed method.
(2) ANOVA was conducted on urban functional zones and LST. The results show a P-value of < 0.05, suggesting significant differences in LST across different urban functional zones. Using the Random Forest algorithm to estimate the contribution of various urban functional zones to the surface thermal environment, the order from greatest to least is as follows: life service zone > industrial zone > catering service zone > residential zone > science, education, and cultural-sports zone > transportation zone > healthcare zone > government agency service zone > financial service zone > green space zone. Urban functional zones and the surface thermal environment exhibit significant spatial agglomeration and interdependence. The spatial correlation between the surface thermal environment and life service, industrial, catering service, and residential zones is predominantly characterized by high-high clusters in local spatial clustering patterns, while it is mostly characterized by low-high clusters in green space zones.
(3) Land cover types, vegetation coverage, and industrial activity density are the main driving factors of the surface thermal environment in various urban functional zones in the central urban area of Lanzhou City, and their spatial heterogeneity is very significant. Specifically, FVC has a negative directional impact on the surface thermal environment, while all other driving factors have a positive directional impact. Meanwhile, the interaction of NDBBI, water bodies, and FVC with other factors has a stronger explanatory power compared to single factors.
Data availability statement
The data analyzed in this study is subject to the following licenses/restrictions: The datasets used and/or analyzed during the current study are not publicly available due to General Data Protection Regulations; however, they are available from the corresponding author upon reasonable request. Requests to access these datasets should be directed to Shuwen Yang, eXN3MDQwOTY2QDE2My5jb20=.
Author contributions
YW: Conceptualization, Data curation, Formal Analysis, Investigation, Validation, Writing–original draft, Writing–review and editing. SY: Funding acquisition, Methodology, Supervision, Writing–review and editing.
Funding
The author(s) declare that financial support was received for the research, authorship, and/or publication of this article. This research work is co-funded by National Natural Science Foundation of China (No. 42161069), the National Key R&D Program of China (Grant No. 2022YFB3903604) and Key Research and Development Project of Lanzhou Jiao Tong University (LZJTU-ZDYF2301).
Acknowledgments
Thanks to the reviewers and editors for their valuable comments and suggestions.
Conflict of interest
YW was employed by Lanzhou Nonferrous Metallurgy Design and Research Institute Co., Ltd.
The remaining author declares that the research was conducted in the absence of any commercial or financial relationships that could be construed as a potential conflict of interest.
Publisher’s note
All claims expressed in this article are solely those of the authors and do not necessarily represent those of their affiliated organizations, or those of the publisher, the editors and the reviewers. Any product that may be evaluated in this article, or claim that may be made by its manufacturer, is not guaranteed or endorsed by the publisher.
References
Adeola Fashae, O., Abiola Ayorinde, H., Oludapo Olusola, A., and Oluseyi Obateru, R. (2019). Landuse and surface water quality in an emerging urban city. Appl. Water Sci. 9, 25–12. doi:10.1007/s13201-019-0903-2
Ai, M., Chen, X., and Yu, Q. (2024). Spatial correlation analysis between human disturbance intensity (HDI) and ecosystem services value (ESV) in the Chengdu-Chongqing urban agglomeration. Ecol. Indic. 158, 111555. doi:10.1016/j.ecolind.2024.111555
Bertinelli, L., and Black, D. (2004). Urbanization and growth. J. Urban Econ. 56 (1), 80–96. doi:10.1016/j.jue.2004.03.003
Chai, J., Zhang, Z., Chen, L., Ma, X., and Wu, Z. (2023). Analysis of the spatial and temporal evolution characteristics and driving forces of the surface thermal environment in Lanzhou city. Sustainability 15 (9), 7700. doi:10.3390/su15097700
Chen, G., Chen, Y., Tan, X., Zhao, L., and Cai, Y. (2023). Assessing the urban heat island effect of different local climate zones in Guangzhou, China. Build. Environ. 244, 110770. doi:10.1016/j.buildenv.2023.110770
Chen, Y., Liu, X., Li, X., Liu, X., Yao, Y., Hu, G., et al. (2017). Delineating urban functional areas with building-level social media data: a dynamic time warping (DTW) distance based k-medoids method. Landsc. urban Plan. 160, 48–60. doi:10.1016/j.landurbplan.2016.12.001
Chen, Y., Yang, J., Yang, R., Xiao, X., and Xia, J. C. (2022). Contribution of urban functional zones to the spatial distribution of urban thermal environment. Build. Environ. 216, 109000. doi:10.1016/j.buildenv.2022.109000
Chen, W., Yang, L., Wu, J., Wu, J., Wang, G., Bian, J., et al. (2023). Spatio-temporal characteristics and influencing factors of traditional villages in the Yangtze River Basin: a Geodetector model. Herit. Sci. 11 (1), 111. doi:10.1186/s40494-023-00948-x
Chen, Y., Yang, J., Yu, W., Ren, J., Xiao, X., and Xia, J. C. (2023). Relationship between urban spatial form and seasonal land surface temperature under different grid scales. Sustain. Cities Soc. 89, 104374. doi:10.1016/j.scs.2022.104374
Du, S., Liu, B., Zhang, X., and Zheng, Z. (2020). Large-scale urban functional zone mapping by integrating remote sensing images and open social data. GIScience Remote Sens. 57 (3), 411–430. doi:10.1080/15481603.2020.1724707
Du, S., Wu, Y., Guo, L., Fan, D., and Sun, W. (2024). How does the 2D/3D urban morphology affect the urban heat island across urban functional zones? A case study of Beijing, China. ISPRS Int. J. Geo-Information 13 (4), 120. doi:10.3390/ijgi13040120
Gao, S., Zhan, Q., Yang, C., and Liu, H. (2020). The diversified impacts of urban morphology on land surface temperature among urban functional zones. Int. J. Environ. Res. Public Health 17 (24), 9578. doi:10.3390/ijerph17249578
Georgescu, M., Morefield, P. E., Bierwagen, B. G., and Weaver, C. P. (2014). Urban adaptation can roll back warming of emerging megapolitan regions. Proc. Natl. Acad. Sci. 111 (8), 2909–2914. doi:10.1073/pnas.1322280111
Huang, H., Huang, J., Chen, B., Xu, X., and Li, W. (2024). Recognition of functional areas in an old city based on POI: a case study in fuzhou, China. J. Urban Plan. Dev. 150 (1), 04024001. doi:10.1061/jupddm.upeng-4593
Huang, R., Hanif, M. F., Siddiqui, M. K., and Hanif, M. F. (2024). On analysis of entropy measure via logarithmic regression model and Pearson correlation for Tri-s-triazine. Comput. Mater. Sci. 240, 112994. doi:10.1016/j.commatsci.2024.112994
Huang, X., and Wang, Y. (2019). Investigating the effects of 3D urban morphology on the surface urban heat island effect in urban functional zones by using high-resolution remote sensing data: a case study of Wuhan, Central China. ISPRS J. Photogrammetry Remote Sens. 152, 119–131. doi:10.1016/j.isprsjprs.2019.04.010
Huo, F., Xu, L., Li, Y., Famiglietti, J. S., Li, Z., Kajikawa, Y., et al. (2021). Using big data analytics to synthesize research domains and identify emerging fields in urban climatology. Wiley Interdiscip. Rev. Clim. Change 12 (1), e688. doi:10.1002/wcc.688
Huo, H., Geng, X., Zhang, W., Guo, L., Leng, P., and Li, Z. L. (2023). Simulation of urban functional zone air temperature based on urban weather generator (UWG): a case study of Beijing, China. Int. J. Remote Sens., 1–24. doi:10.1080/01431161.2023.2201389
Li, T., Xu, Y., and Yao, L. (2021). Detecting urban landscape factors controlling seasonal land surface temperature: from the perspective of urban function zones. Environ. Sci. Pollut. Res. 28, 41191–41206. doi:10.1007/s11356-021-13695-y
Li, Y., and Liu, C. (2022). Identification of urban functional areas and their mixing degree using point of interest analyses. Land 11 (7), 996. doi:10.3390/land11070996
Li, G., Zhang, J., Mirzaei, P. A., Ding, S., Ding, Y., and Liu, M. (2020). Monitoring thermal field, humidity field and energy balance over heterogeneous surfaces in the typical valley-city. J. Geogr. Sci. 30, 2015–2032. doi:10.1007/s11442-020-1825-5
Li, J., Li, S., and Pi, H. (2024). Interaction effects of various impact factors on the snow over the Yangtze and Yellow River headwater region, China. Ecol. Indic. 166, 112330. doi:10.1016/j.ecolind.2024.112330
Li, M., Abuduwaili, J., Liu, W., Feng, S., Saparov, G., and Ma, L. (2024). Application of geographical detector and geographically weighted regression for assessing landscape ecological risk in the Irtysh River Basin, Central Asia. Ecol. Indic. 158, 111540. doi:10.1016/j.ecolind.2023.111540
Li, T., Cao, J., Xu, M., Wu, Q., and Yao, L. (2020). The influence of urban spatial pattern on land surface temperature for different functional zones. Landsc. Ecol. Eng. 16, 249–262. doi:10.1007/s11355-020-00417-8
Liu, H., Huang, B., Zhan, Q., Gao, S., Li, R., and Fan, Z. (2021). The influence of urban form on surface urban heat island and its planning implications: evidence from 1288 urban clusters in China. Sustain. Cities Soc. 71, 102987. doi:10.1016/j.scs.2021.102987
Liu, L., Lin, Y., Liu, J., Wang, L., Wang, D., Shui, T., et al. (2017). Analysis of local-scale urban heat island characteristics using an integrated method of mobile measurement and GIS-based spatial interpolation. Build. Environ. 117, 191–207. doi:10.1016/j.buildenv.2017.03.013
Liu, X., Tian, Y., Zhang, X., and Wan, Z. (2020). Identification of urban functional regions in chengdu based on taxi trajectory time series data. ISPRS Int. J. Geo-Information 9 (3), 158. doi:10.3390/ijgi9030158
Ma, X., Yang, J., Sun, D., Zhang, R., Xiao, X., and Xia, J. (2023). Fine allocation of sectoral carbon emissions at block scale and contribution of functional zones. Ecol. Inf. 78, 102293. doi:10.1016/j.ecoinf.2023.102293
Manoli, G., Fatichi, S., Schläpfer, M., Yu, K., Crowther, T. W., Meili, N., et al. (2019). Magnitude of urban heat islands largely explained by climate and population. Nature 573 (7772), 55–60. doi:10.1038/s41586-019-1512-9
Meng, F., Yan, S., Tian, G., and Wang, Y. (2023). Surface urban heat island effect and its spatiotemporal dynamics in metropolitan area: a case study in the Zhengzhou metropolitan area, China. Front. Environ. Sci. 11. doi:10.3389/fenvs.2023.1247046
Min, M., Lin, C., Duan, X., Jin, Z., and Zhang, L. (2019). Spatial distribution and driving force analysis of urban heat island effect based on raster data: a case study of the Nanjing metropolitan area, China. Sustain. Cities Soc. 50, 101637. doi:10.1016/j.scs.2019.101637
Pei, T., Sobolevsky, S., Ratti, C., Shaw, S. L., Li, T., and Zhou, C. (2014). A new insight into land use classification based on aggregated mobile phone data. Int. J. Geogr. Inf. Sci. 28 (9), 1988–2007. doi:10.1080/13658816.2014.913794
Peng, J., Qiao, R., Liu, Y., Blaschke, T., Li, S., Wu, J., et al. (2020). A wavelet coherence approach to prioritizing influencing factors of land surface temperature and associated research scales. Remote Sens. Environ. 246, 111866. doi:10.1016/j.rse.2020.111866
Qin, Z.-H., et al. (2001). Mono-window algorithm for retrieving land surface temperature from Landsat TM6 data. ACTA Geogr. Sinica-Chin. Edition 56 (4), 466–474. doi:10.11821/xb200104009
Shi, T., Huang, Y., Wang, H., Shi, C. E., and Yang, Y. J. (2015). Influence of urbanization on the thermal environment of meteorological station: satellite-observed evidence. Adv. Clim. Change Res. 6 (1), 7–15. doi:10.1016/j.accre.2015.07.001
Stone, B., Vargo, J., and Habeeb, D. (2012). Managing climate change in cities: will climate action plans work? Landsc. Urban Plan. 107 (3), 263–271. doi:10.1016/j.landurbplan.2012.05.014
Wang, A., Zhang, M., Ren, B., Zhang, Y., Al Kafy, A., and Li, J. (2022). Ventilation analysis of urban functional zoning based on circuit model in Guangzhou in winter, China. Urban Clim. 47 (2023), 101385. doi:10.1016/j.uclim.2022.101385
Wang, H., Li, B., and Wu, J. (2022). Heterogeneous urban thermal contribution of functional construction land zones: a case study in shenzhen, China. Remote Sens. 14 (8), 1851. doi:10.3390/rs14081851
Wang, H., Qin, F., Xu, C., Guo, L., and Wang, Z. (2021). Evaluating the suitability of urban development land with A geodetector. Ecol. Indic. 123, 107339. doi:10.1016/j.ecolind.2021.107339
Wang, S., Shi, C., Fang, C., and Feng, K. (2019). Examining the spatial variations of determinants of energy-related CO2 emissions in China at the city level using Geographically Weighted Regression Model. Appl. energy 235, 95–105. doi:10.1016/j.apenergy.2018.10.083
Wee, S. J., Park, E., Alcantara, E., and Lee, J. S. H. (2024). Exploring multi-driver influences on Indonesia's biomass fire patterns from 2002 to 2019 through geographically weighted regression. J. Geovisualization Spatial Anal. 8 (1), 4. doi:10.1007/s41651-023-00166-w
Wen, Z., Tian, D., and Zhu, Y. (2023). Research on spatial and temporal patterns of heat island variability and influencing factors in urban center areas: a case study of Beijing’s central area. Buildings 13 (8), 1887. doi:10.3390/buildings13081887
Wu, Z., and Ren, Y. (2019). A bibliometric review of past trends and future prospects in urban heat island research from 1990 to 2017. Environ. Rev. 27 (2), 241–251. doi:10.1139/er-2018-0029
Xie, X., Xu, Y., Feng, B., and Wu, W. (2024). Multiscale urban functional zone recognition based on landmark semantic constraints. ISPRS Int. J. Geo-Information 13 (3), 95. doi:10.3390/ijgi13030095
Xiong, Y., and Zhang, F. (2021). Effect of human settlements on urban thermal environment and factor analysis based on multi-source data: a case study of Changsha city. J. Geogr. Sci. 31 (6), 819–838. doi:10.1007/s11442-021-1873-5
Xu, D., Zhang, Q., Zhou, D., Yang, Y., Wang, Y., and Rogora, A. (2023). Local climate zone in Xi'an city: a novel classification approach employing spatial indicators and supervised classification. Buildings 13 (11), 2806. doi:10.3390/buildings13112806
Xu, N., Luo, J., Wu, T., Dong, W., Liu, W., and Zhou, N. (2021). Identification and portrait of urban functional zones based on multisource heterogeneous data and ensemble learning. Remote Sens. 13 (3), 373. doi:10.3390/rs13030373
Xue, J., Zong, L., Yang, Y., Bi, X., Zhang, Y., and Zhao, M. (2023). Diurnal and interannual variations of canopy urban heat island (CUHI) effects over a mountain–valley city with a semi-arid climate. Urban Clim. 48, 101425. doi:10.1016/j.uclim.2023.101425
Yan, J., Feng, P., Jia, F., Su, F., Wang, J., and Wang, N. (2023). Identification of secondary functional areas and functional structure analysis based on multisource geographic data. Geocarto Int. 38 (1), 2191995. doi:10.1080/10106049.2023.2191995
Yang, J., Ren, J., Sun, D., Xiao, X., Xia, J. C., Jin, C., et al. (2021). Understanding land surface temperature impact factors based on local climate zones. Sustain. Cities Soc. 69, 102818. doi:10.1016/j.scs.2021.102818
Yu, W., Ai, T., and Shao, S. (2015). The analysis and delimitation of Central Business District using network kernel density estimation. J. Transp. Geogr. 45, 32–47. doi:10.1016/j.jtrangeo.2015.04.008
Yu, W., Shi, J., Fang, Y., Xiang, A., Li, X., Hu, C., et al. (2022). Exploration of urbanization characteristics and their effect on the urban thermal environment in Chengdu, China. Build. Environ. 219, 109150. doi:10.1016/j.buildenv.2022.109150
Yu, Z., Jing, Y., Yang, G., and Sun, R. (2021). A new urban functional zone-based climate zoning system for urban temperature study. Remote Sens. 13 (2), 251. doi:10.3390/rs13020251
Yuan, F., and Bauer, M. E. (2007). Comparison of impervious surface area and normalized difference vegetation index as indicators of surface urban heat island effects in Landsat imagery. Remote Sens. Environ. 106 (3), 375–386. doi:10.1016/j.rse.2006.09.003
Zhang, L., Hou, Q., Duan, Y., and Liu, W. (2023). Spatial correlation between water resources and rural settlements in the Yanhe watershed based on bivariate spatial autocorrelation methods. Land 12 (9), 1719. doi:10.3390/land12091719
Zhang, X., Du, S., Wang, Q., and Zhou, W. (2018). Multiscale geoscene segmentation for extracting urban functional zones from VHR satellite images. Remote Sens. 10 (2), 281. doi:10.3390/rs10020281
Zhang, Z., Luan, W., Yang, J., Guo, A., Su, M., and Tian, C. (2023). The influences of 2D/3D urban morphology on land surface temperature at the block scale in Chinese megacities. Urban Clim. 49, 101553. doi:10.1016/j.uclim.2023.101553
Zhao, C., Jensen, J., Weng, Q., and Weaver, R. (2018). A geographically weighted regression analysis of the underlying factors related to the surface urban heat island phenomenon. Remote Sens. 10 (9), 1428. doi:10.3390/rs10091428
Zheng, Z., Luo, F., Gao, H., and Yang, Y. (2024). Impact of local climate zones on the urban heat and dry islands in Beijing: spatial heterogeneity and relative contributions. J. Meteorological Res. 38 (1), 126–137. doi:10.1007/s13351-024-3081-6
Keywords: surface thermal environment, urban functional zones, remote sensing, driving factors, Lanzhou city
Citation: Wang Y and Yang S (2024) Identification of surface thermal environment differentiation and driving factors in urban functional zones based on multisource data: a case study of Lanzhou, China. Front. Environ. Sci. 12:1466542. doi: 10.3389/fenvs.2024.1466542
Received: 18 July 2024; Accepted: 13 September 2024;
Published: 27 September 2024.
Edited by:
Sawaid Abbas, University of the Punjab, PakistanReviewed by:
Zhongli Lin, Fujian University of Technology, ChinaFei Guo, Dalian University of Technology, China
Copyright © 2024 Wang and Yang. This is an open-access article distributed under the terms of the Creative Commons Attribution License (CC BY). The use, distribution or reproduction in other forums is permitted, provided the original author(s) and the copyright owner(s) are credited and that the original publication in this journal is cited, in accordance with accepted academic practice. No use, distribution or reproduction is permitted which does not comply with these terms.
*Correspondence: Shuwen Yang, eXN3MDQwOTY2QDE2My5jb20=
 Yixuan Wang
 Shuwen Yang