 Yujia Zhang
 Haisheng Cai1,2,3*
94% of researchers rate our articles as excellent or good
Learn more about the work of our research integrity team to safeguard the quality of each article we publish.
Find out more
ORIGINAL RESEARCH article
Front. Environ. Sci., 16 November 2023
Sec. Land Use Dynamics
Volume 11 - 2023 | https://doi.org/10.3389/fenvs.2023.1227682
This article is part of the Research TopicRealization of Ecological Product Value, Land Use Change and EnvironmentView all 11 articles
Throughout human history, human activities have resulted in land use and land cover changes (LUCC) and can have a direct impact on the land surface thermal environment (LSTE). In the existing studies, the holistic nature of changes in land use and land cover (LULC) has been neglected in favor of focusing on the interactions between different LULC types and the land surface thermal environment. This study used ArcGIS Pro 3.0, ENVI 5.3, and SPSS software to construct a contribution index model and stepwise regression equation to investigate the relationship between LULC type, structure, and pattern changes and LSTE changes in Nanchang City, Jiangxi Province, China, from 1990 to 2020. The findings revealed that 1) rapid urbanization has led to a surge in the area of built-up land and a decrease in the area of arable land in Nanchang; between 1990 and 2020, the area of built-up land in Nanchang increased by 433.29 km2, while the area of arable land decreased by 291.99 km2; 2) The land surface temperature (LST) was divided into five classes according to the equal spacing method, and the areas with the highest and lowest temperature classes were the high temperature zone and the low temperature zone, respectively. Over the past 30 years, the LSTE in Nanchang has gradually deteriorated, with the area of the low temperature zone shrinking by 554.2 km2 and the area of other classes appearing to increase significantly; 3) the contribution index and stepwise regression equation demonstrate that the primary reasons for the worsening of the LSTE are an increase in the scale of cultivated land and construction land. It was found that rationalization of urban LULC type, structure, and pattern can effectively reduce land surface temperature.
As industrialization and economic levels rise, the world is experiencing rapid urbanization (Souza et al., 2016). More than half of the world’s population now lives in cities, and this figure is expected to rise further in the future (Wu et al., 2023). The key feature of present global urbanization is population mobility from rural to urban locations (Silva et al., 2018). However, as the urban population grows, the area of urban constructed land increases dramatically, having a wide range of effects on regional ecosystems (Qiao et al., 2023). On the one hand, rapid urbanization has played a positive role in promoting urban-rural population mobility and the circulation of production factors. On the other hand, it has had a significant influence on urban LULC types, structures, and patterns, resulting in problems such as spatially disordered urban expansion, increased impervious surfaces, and the discharge of production and domestic waste from urban populations (Fu and Weng, 2016; Wong et al., 2016; Wang et al., 2018; Wang et al., 2022). Previous studies has shown that changing LULC disrupts land-atmosphere energy transfer, resulting in the urban heat island (UHI) phenomenon, which causes cities to have warmer weather than the surrounding countryside (Huang et al., 2015; Bokaie et al., 2016). At the same time, the UHI effect is strongly linked to global warming and local environmental changes in the region’s climate (Guo et al., 2015), posing a serious threat to public health (Shiva et al., 2019), and is an important factor influencing the quality of life and safety of human settlements (Oke, 1982; Hang and Rahman, 2018; Pramanik and Punia, 2020).
The dynamics of LUCC and the LSTE are critical components of urban ecology research (Pelletier et al., 2015), and current research has reached a unified consensus that LUCC directly leads to changes in the LSTE (Chang et al., 2022; Chapman et al., 2017; Mushore et al., 2017; Souza et al., 2016; Tarawally et al., 2018; Yildiz et al., 2018; Zhao et al., 2020). Nevertheless, because of differences in research methodology and study locations, the effects of LUCC on the LSTE are not well defined (Sun and Chen, 2017). The findings demonstrate that the average temperature of trees changed in summer, as did their cooling effect on LST, and that treeless urban green spaces were less successful in lowering LST (Schwaab et al., 2021); similarly, different LULC patterns had different effects on LST. The intensity of the UHI effect has been found to be directly related to building density (Li et al., 2020); the effect of LULC change on LST also varies by season (Chen et al., 2017), with LUCC having a greater effect on LST in the winter than in the summer (Estalkhsari et al., 2022). And there are differences in the effects of LULC landscape patterns on LST (Schwaab et al., 2021). Existing studies have found that the size, shape complexity, and degree of aggregation of urban impervious surfaces and greenfield patches were significantly related to LST and that urban impervious surfaces had an average LST around 3°C higher than green fields (Estoque et al., 2017).
Existing studies, all have one flaw in common: they fail to recognize LUCC as a complex whole. Changes in LULC inevitably result in changes in LULC types, quantity, structure, function, and landscape pattern, and existing studies frequently develop from a single perspective of LULC types and quantity, lacking an integrated analysis between LULC types, structure, and pattern and the LSTE; second, most of the existing studies are mainly static, and the analysis of the dynamic changes between LULC and LST is more lacking; and third, in most existing studies, the impact of global climate change is ignored. According to the IPCC study (Intergovernmental Panel on Climate Change, 2023), the worldwide average LST has risen by around 1°C during 1850–1900, and the global temperature rise is predicted to approach or exceed 1.5°C over the next 20 years. Previous studies ignored this and did not take place in the same climatic context. In order to solve the above problems, this study investigated the dynamic relationship between LULC type, structure, and pattern and LST by constructing a contribution index model and a stepwise regression equation based on eliminating the effect of climate change on LST.
China has been one of the world’s fastest urbanizing countries in the last 30 years (Peng et al., 2018), with an urbanization rate of 60.31% as of 2019, exceeding the world average of 55.7%, and is expected to continue to grow at the fastest rate over the next 50 years. The urban heat island effect and heat waves will occur more frequently. At the same time, the need for solutions has become even more pressing (Yu et al., 2022). In 2017, the China Meteorological Administration’s National Climate Centre (http://www.ncc-cma.net/) announced the ten hottest cities in China in summer, with Chongqing, Fuzhou, Hangzhou, and Nanchang dubbed the “Four Furnaces.” Nanchang, the capital city of Jiangxi Province, has seen rapid population growth and increased building density over the last 30 years. The standard of living is constantly being challenged.
In summary, the study’s objectives are threefold: 1) to analyze the changes in LULC and LSTE in Nanchang City during the summer (June-August) from 1990 to 2020; 2) to investigate the relationship between LULC type, structure, and pattern change and LSTE; and 3) to integrate the three dimensions of LULC type, structure, and pattern and systematically propose recommendations for improving LST reduction.
Nanchang is one of the most important central cities in East China, located in the north of central Jiangxi, downstream of the Gan and Fei rivers, and on the southwestern shore of Poyang Lake. One of the Yangtze River urban agglomeration’s central cities (Wang et al., 2020). (Figure 1). Nanchang has a subtropical monsoon climate with plenty of heat, rain, and light, but it is prone to monsoon winds, uneven precipitation distribution, high temperatures and drought, and frequent meteorological disasters such as low temperatures and cold damage, along with torrential rainfall and flooding, and it is one of the hottest cities in China in summer. To mitigate the UHI effect and improve the living environment in similar cities, it is critical to investigate the relationship between LUCC and Nanchang’s LSTE.
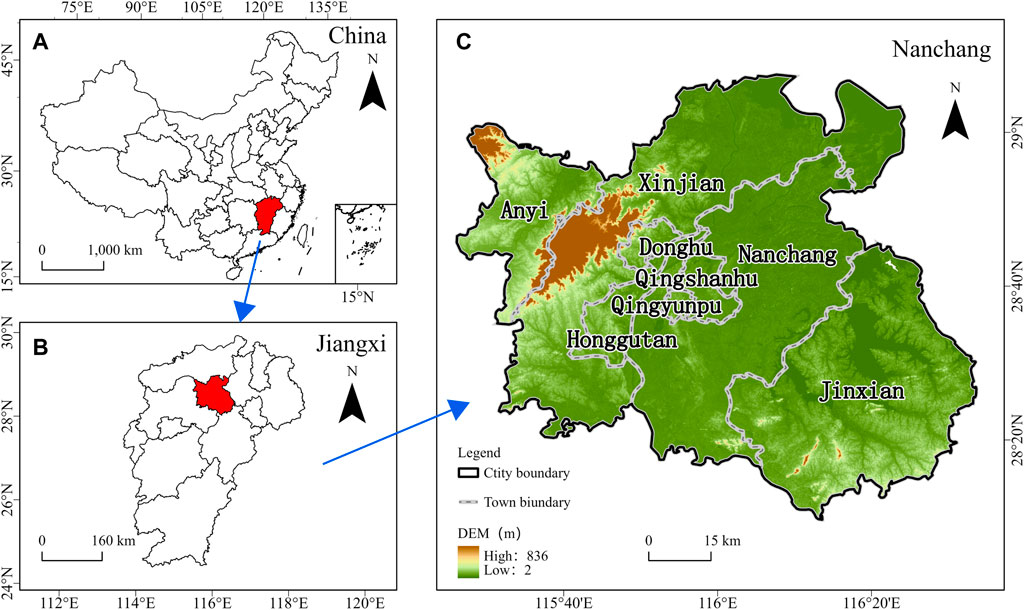
FIGURE 1. Location of the study area. (A) Location of Jiangxi province in China. (B) Location of the study area in Jiangxi province. (C) Location and elevation of the study area.
LULC data, Landsat remote sensing image data, and administrative data were used in this paper. The 1990, 2000, 2010, and 2020 LULC data were obtained from the Chinese Academy of Sciences’ Center for Resource and Environmental Science and Data (https://www.resdc.cn/), with a spatial resolution of 30 m, and included six primary types of cropland, forest land, grassland, watersheds, inhabited land, and unutilized land, as well as 25 secondary types. This dataset has been frequently utilized in LUCC research and related studies, and the data accuracy meets the requirements of the research. Landsat remote sensing images were chosen from Landsat 5 TM and Landsat 8 OLI remote sensing images collected during the summer of the corresponding year (June-August). The Landsat data used in this study were obtained from the Geographic Data Cloud (https://www.gscloud.cn/) and the United States Geological Survey (https://www.usgs.gov/), both in the summer of the year (June-August), and with a spatial resolution of 30 m. Landsat data are widely used for research on urban heat islands (Senf et al., 2015; Hang and Rahman, 2018). The National Basic Geographic Information Center (http://www.ngcc.cn/) provided the administrative zoning data. Despite administrative zoning changes during the study period, this study used the Nanchang City administrative zoning of 2020 uniformly. Table 1 lists the data sources in detail. To ensure a consistent coordinate system, all data in this paper were pre-processed.
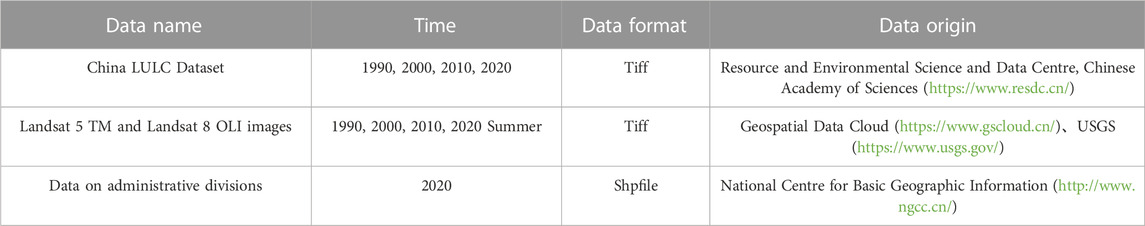
TABLE 1. Data sources.
Figure 2 depicts the detailed workflow of this study. Firstly, data collection was carried out to obtain LULC data and Landsat remote sensing images of the study area during the study period; Second, using ArcGIS Pro 3.0 software, LULC data were pre-processed and classified into six categories: cultivated land, forest land, grassland, water bodies, construction land, and unused land (Figure 3). Using ENVI 5.3 software, Landsat remote sensing images were inverted to real LST, and the accuracy was verified, as well as the real LST was normalised for comparability (Figure 4). Finally, the contribution index approach and the stepwise regression method were used to study the relationship between LUCC and the LSTE.
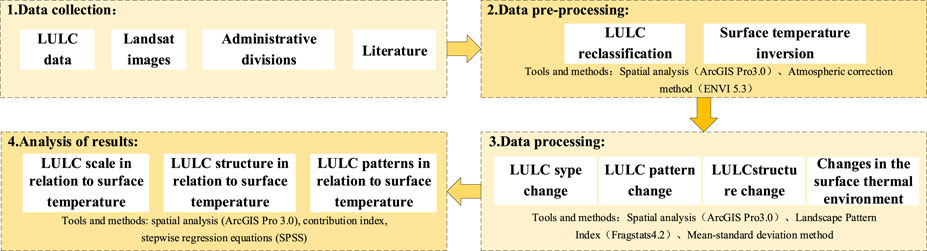
FIGURE 2. Methodological framework.
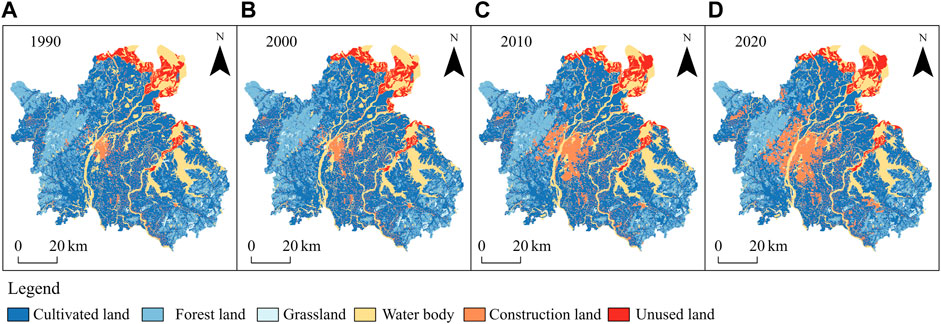
FIGURE 3. LULC of Nanchang City. (A–D) represent the years 1990, 2000, 2010 and 2020.
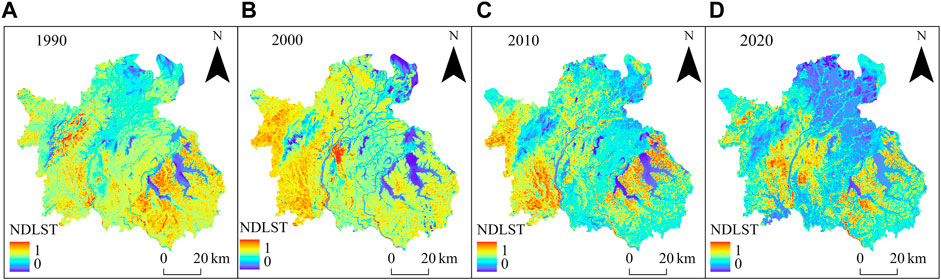
FIGURE 4. Normalised LST in Nanchang City. (A–D) represent the years 1990, 2000, 2010 and 2020.
For LST inversion, the atmospheric correction method was used, with specific steps including thermal infrared radiation calibration, normalized vegetation index calculation, vegetation cover calculation, surface specific emissivity calculation, blackbody radiance brightness calculation, and true LST inversion (Zareie et al., 2016; Hang and Rahman, 2018).
The data were processed using ArcGIS Pro 3.0 software to obtain the average LST data of Nanchang City in summer using the Chinese 1 km resolution daily LST data provided by the National Qinghai-Tibet Plateau Data Centre. Following that, the LST data from Landsat image inversion was resampled to make it consistent with the resolution of daily LST data at 1 km resolution in Nanchang, and finally 150 sample points were randomly selected to process the difference between the extracted sample point temperature data, and the results showed that the average difference between the sample points in the three periods of 2000, 2010, and 2020 was 3.37°C, 4.76°C, and 0.13°C, respectively. It demonstrates that the LST inversion results meet the research requirements.
According to the Blue Book on Climate Change in China 2022, global climate change caused the average LST in Asia in 2020 to be 1.06°C higher than the base period (1981–2010), with China’s average LST showing a significant upward trend, with 2020 being the warmest year since the beginning of the 20th century. In order to eliminate the impact of global climate change on LST and truly reflect the relationship between LUCC and LST, this study takes 1990 as the base period, refers to the trend of annual LST change by climate impact in the region where Nanchang is located (East China) in the Blue Book on Climate Change in China 2022, and with the help of the raster calculator tool of the ArcGIS 3.0 Pro software, the value of climate change impacts was subtracted from the LST of the corresponding year to eliminate the impacts of global climate change to a certain extent.
The landscape pattern index is categorized into patch, class, and landscape levels and is a useful tool for quantifying landscape patterns within a region (Su et al., 2014; Saleh et al., 2022). Among them, class level and landscape level can reflect the landscape pattern indices of different LULCs within the study unit and the overall landscape pattern index, respectively. The following criteria have been set for the selection of landscape pattern indices in previous studies: 1) the chosen indicators can represent various aspects of landscape characteristics (size, shape, connectivity, and so on); 2) the chosen indicators should not be highly redundant; and 3) the chosen indicators should be widely accepted (Weng, 2007). In order to study the relationship between different LULC patterns and regional patterns with LST, following the above principles, five landscape pattern indices were chosen at the class level: patch density (PD), largest patch area index (LPI), landscape shape index (LSI), mean fractional dimension (FRAC MN), and aggregation index (AI), and at the landscape level: patch density (PD), largest patch area index (LPI), landscape shape index (LSI), mean fractional dimension (FRAC MN), aggregation index (AI), contagion index (CONTAG), and shannon diversity index (SHDI).
A contribution index (CI) was developed to investigate the contribution and spatial and temporal relationships between various land types and the LSTE during LUCC in Nanchang from 1990 to 2020 (Das Majumdar and Biswas, 2016; Sun and Chen, 2017; Huang et al., 2019). It was calculated as follows:
SPSS software was used to create stepwise regression equations to examine the association between LUCC and LST change, with LUCC serving as the independent variable and LST change serving as the response variable. To address the possibility of multicollinearity, factors with no significant regression connections were included and eliminated from the stepwise regression (Su et al., 2014).
Statistics on LULC types in Nanchang were picked up using the ArcGIS Pro software spatial analysis tool (Table 2). The findings show that the LULC area of Nanchang City changed significantly between 1990 and 2020, as evidenced by an increase in construction land and a decrease in cultivated land. After 30 years, Nanchang City’s construction land area has grown from 279.14 km2 to 712.43 km2. In contrast, the area of cultivated land shrank from 4,090.89 km2 to 3,798.90 km2. The overall change in forest land, grassland, water, and unused land is small.
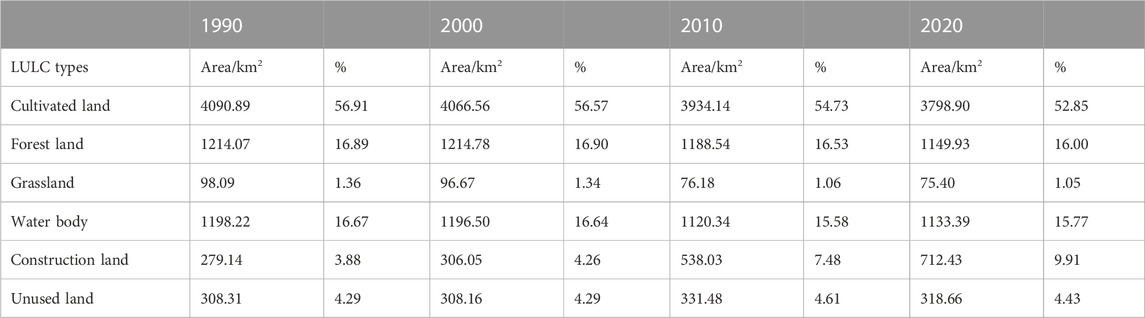
TABLE 2. Percentage of LULC type in Nanchang.
The reasons for this are that Nanchang has experienced rapid economic development and population growth since 1990, with total GDP increasing from 6.32 billion RMB in 1990 to 574.55 billion RMB in 2020 and the resident population increasing from 372.59 million to 625.55 million, resulting in an increasing scale of construction land. General Programme for the Reform of the Ecological Civilization System, which explicitly required the spatial use control of national land, limiting the disorderly expansion of construction land to the greatest extent possible, resulting in a moderating trend in the growth of construction land area in Nanchang during the period 2010–2020; on the other hand, to alleviate the deteriorating ecological environment, the Chinese government in the last few years has implemented a number of policies to address the issue. To address the deteriorating ecological environment, the Chinese government implemented a strategy of gradually returning farmland to forest and grass at the end of the last century, gradually returning farmland on slopes and mountains, as well as in critical ecological function areas, to forest and grass, resulting in a reduction in farmland area.
The spatial analysis tool of ArcGIS Pro 3.0 software was used to analyze the LULC structure change in Nanchang from 1990 to 2020, as well as the LULC shift matrix (Table 3) and the LULC shift chord diagram of Nanchang (Figure 5), to further investigate the relationship between LULC change and the LSTE.
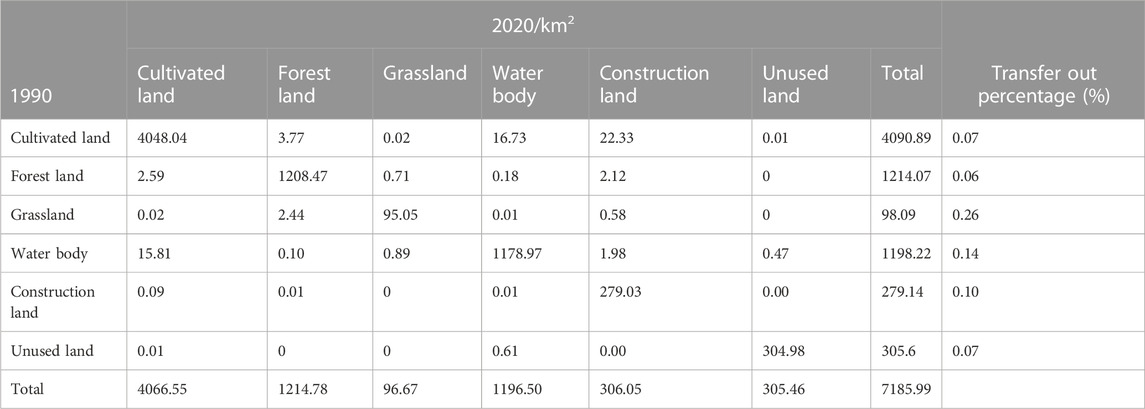
TABLE 3. LULC transfer matrix for Nanchang 1990–2020.
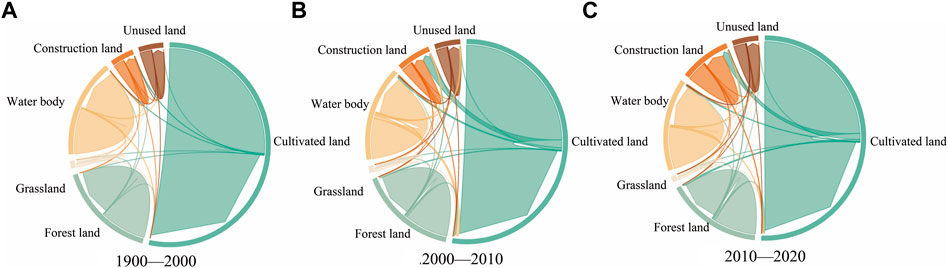
FIGURE 5. LULC transfer chord Map of Nanchang. (A) 1990–2020. (B) 1990–2020. (C) 1990–2020.
The findings show that changes in LULC structure in Nanchang from 1990 to 2020 primarily take the form of arable land being transferred to other land and other land types being transferred to construction land. The area of arable land flowing into construction land is 383.01 km2, with an upward and then downward trend, followed by arable land flowing into forest land and water bodies, which are 70.41 km2 and 99.66 km2, respectively, with other land types changing less.
The areas where the LULC structure of Nanchang City has changed significantly in terms of both temporal and spatial distribution are primarily located in Qingyunpu District, Xihu District, and Qingshan Lake District, specifically in the transformation of other land into construction land, owing primarily to the fact that the aforementioned areas are the central urban areas in Nanchang City General Urban Development Plan. The city’s urban nature as a major economic, cultural, scientific and technological, and information center for the province, as well as the urban spatial pattern of development across the river, led to a gradual increase in the amount of construction land in Nanchang’s central urban area.
LULC class level (Figure 6) and landscape level indices (Table 4) were calculated using Fragstats 4.2 software for 1990, 2000, 2010, and 2020.
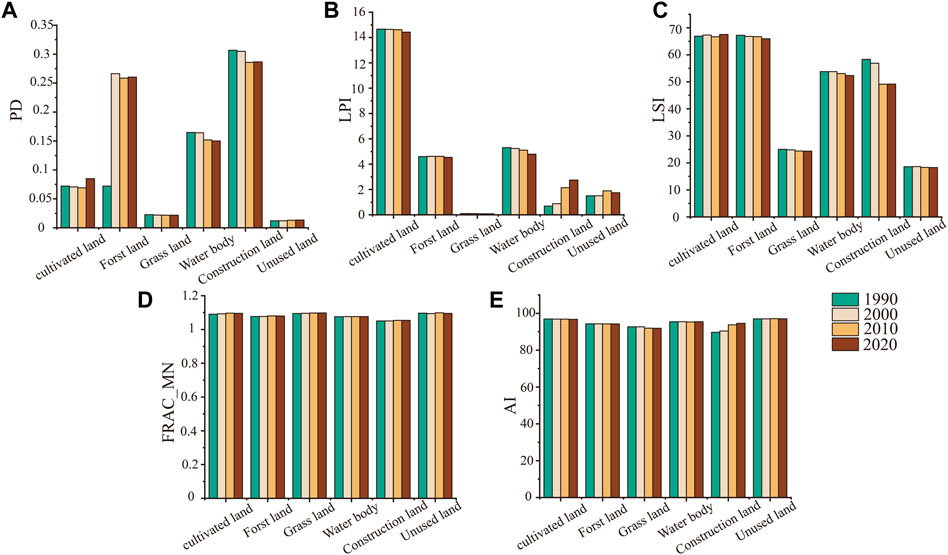
FIGURE 6. LULC class level changes in Nanchang. (A)PD, (B) LPI, (C) LSI, (D) FRAC_MN, (E) AI.
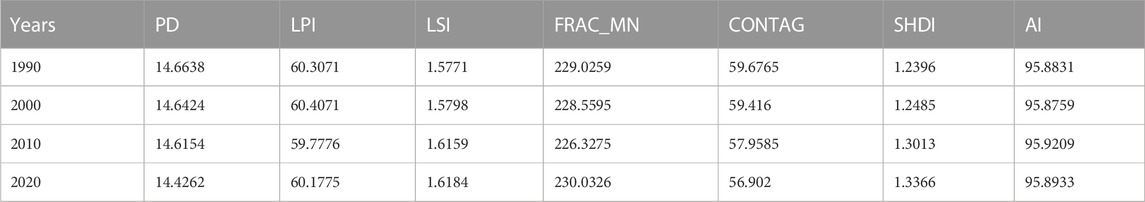
TABLE 4. Changes in LULC landscape levels in Nanchang.
The class level index calculation results show that the PD changed more clearly between 1990 and 2020, with cultivated land increasing to a greater extent, followed by unused land, while the PD of the other land types showed a decreasing trend or fluctuated less, indicating that cultivated land was more influenced by human activities, while the area of cultivated land transferred to other land types decreased. The most extensive LPI of construction land and unused land have increased significantly, while the rest of the land types have shown a decreasing trend, which also confirms the rapid economic development and population explosion at this stage, resulting in the continuous expansion of the area of construction land, leading to the rise of the landscape status of construction land; the LSI and PD change trends are similar, in which the FRAC_MN of each category and the AI have remained relatively stable over the last 30 years, indicating that the overall shape of each class category has remained relatively stable, with the AI of construction land showing a slight upward trend, indicating that the density of buildings in Nanchang has increased. Patches have become more aggregated as social and economic development has progressed.
The landscape level index calculation results show that between 1990 and 2020, the density of LULC patches, the LPI, and the CONTAG of Nanchang City all show a decreasing trend, while the AI, the FRAC_MN, and the LSI all show an increasing trend, indicating from both positive and negative perspectives that with socio-economic development, the patches among various LULC types in Nanchang will become more diverse. The SHDI that the complexity of LULC landscape composition has increased, confirming landscape type diversity while reflecting greater spatial heterogeneity of LULC landscape types within Nanchang and the diversification of LULC types.
To investigate the trend of LSTE change in Nanchang City, the normalized LST of Nanchang City was used in four periods and classified into five levels using the equidistant method, as shown in Table 5 (Siqi and Yuhong, 2020). The area and proportion of each temperature class in each of the four periods were counted separately (Table 6; Figure 7). The findings indicate that the relationship between LST and LULC types is very close; between 1990 and 2020, the high temperature and sub-high temperature zones of LST in Nanchang primarily belong to arable land and construction land, while the low temperature and sub-moderate temperature zones primarily belong to water bodies and forest land. The study found that water bodies and forest land can reduce LST to some extent, whereas construction land and arable land can increase LST. The LST in Nanchang has significant spatial heterogeneity. It gradually demonstrates the development trend of high- and secondary-temperature areas from the periphery to the center, owing to the concentration of construction land in Nanchang’s central area. The construction land area is rapidly expanding, causing high-temperature areas to shift from the periphery to the center. In terms of temperature class expansion, the Sub-high -temperature zone has grown significantly in the last 30 years, covering 563.45 km2, or about 7.84% of Nanchang’s total area. The area of the low-temperature zone shrank by 554.1993 km2 in 30 years, accounting for 7.72% of Nanchang’s area, while the area of the sub-middle-temperature zone increased by 58.45% and the area of the middle-temperature zone decreased by 58.32%, indicating a significant change.

TABLE 5. Criteria for classification of LSTEs.
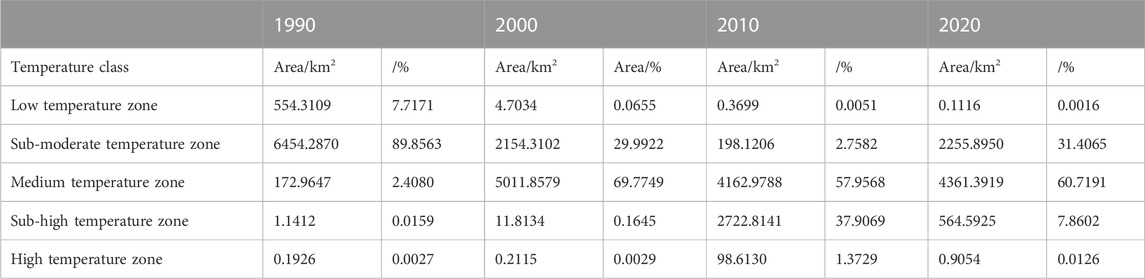
TABLE 6. Area and percentage of LSTE class.
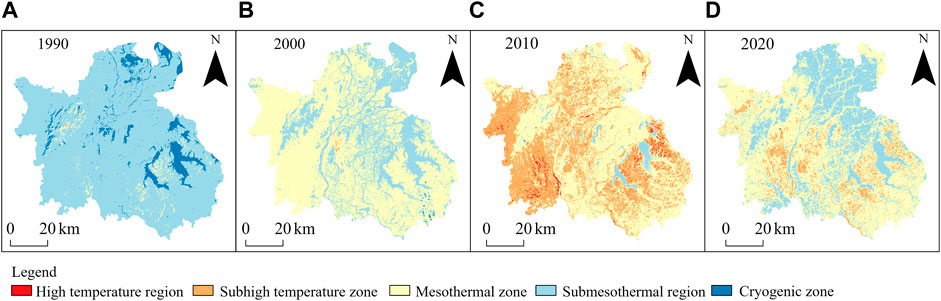
FIGURE 7. Distribution of LST classes. (A–D) represent the years 1990, 2000, 2010 and 2020.
Since the LUCC in Nanchang City between 1990 and 2020 is mainly concentrated on cultivated land and construction land, this paper focuses on the relationship between cultivated land and construction land and LST. The four periods of LULC types and LST in Nanchang City from 1990, 2000, 2010, and 2020 were overlaid and analyzed using the ArcGIS Pro 3.0 software spatial overlay tool to obtain the LST of various LULC types in Nanchang City from 1990 to 2020 (Table 7). The average LST of construction and cultivated land was found to be the highest, and the overall increase in LST over the past 30 years was very significant, indicating that urbanization had a significant effect on raising the LST. The contribution index was used to calculate the contribution of different LULC types to LST in Nanchang to further investigate the relationship between different LULC types and the LSTE (Figure 8). The results show that the contribution indices of arable land and construction land are all positive. The contribution index of cultivated land is significantly higher than that of construction land, indicating that the expansion of arable land and construction land contributes to the rise in LST.
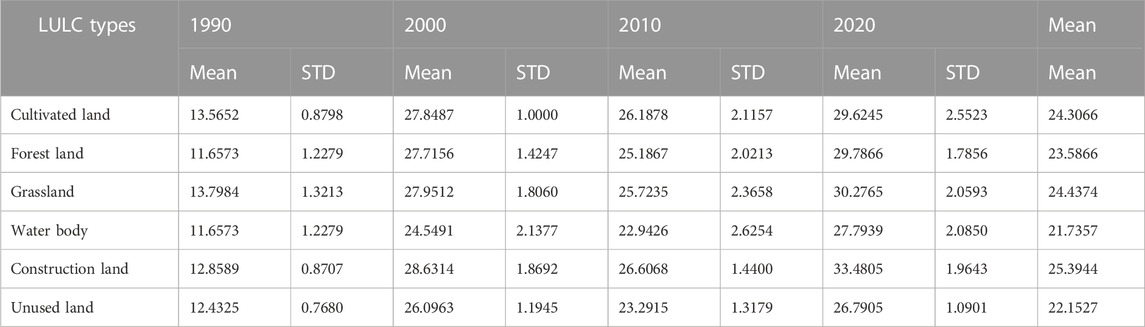
TABLE 7. Changes in mean temperature and standard deviation of LULC types in Nanchang.
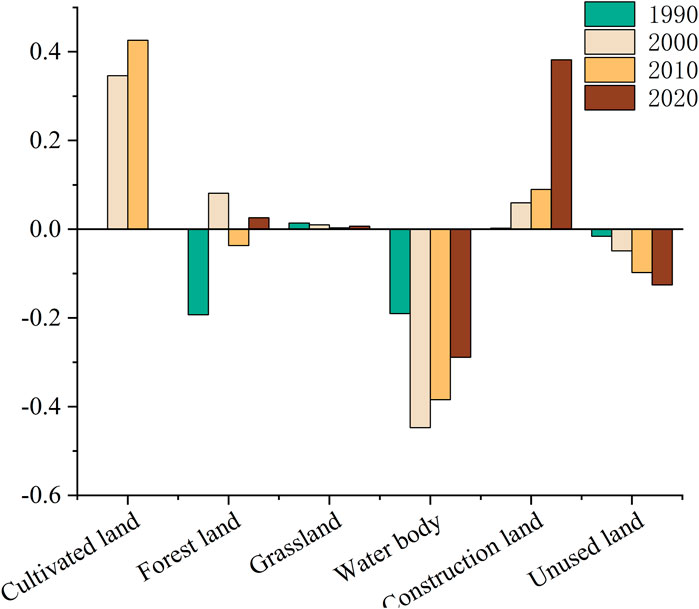
FIGURE 8. LULC types contribution.
In contrast, the year-on-year growth in the contribution index for constructed land is intrinsically related to Nanchang City’s rapid economic development and the conversion of a substantial amount of cultivable land to construction land. At the same time, the studies suggest that bodies of water and undeveloped land have a considerable cooling effect.
The LULC structure was characterized by the area share of different LULC types, and a 2 km × 2 km grid (1961 in total) was generated in the study area. The best regression equation was chosen (tolerance of each variable>1.0 and VIF<10, no covariance between variables), and the results are as follows:
The results show that at the scale of 2 km × 2 km grid, the increase in the area of construction land, cultivated land, and unused land all play a positive role in the rise of the LSTE, among which construction land has the most decisive influence on the LSTE. A 10% increase in the proportion of built-up land in the grid between 2010 and 2020 results in a 70.66 increase in the total normalized temperature of the grid, indicating that changes in the area of built-up land are highly correlated with changes in the area of the LSTE.
The class level index and landscape level index were calculated separately for each grid using Fragstats 4.2 software. The regression relationship between the difference in class level index, the landscape level index, and the difference in mean normalized LST was established using a stepwise regression method for the three time periods 1990–2000, 2000–2010, and 2010–2020. (The best regression equation was selected (tolerance of each variable >1.0, and VIF <10, no covariance between variables).
According to a class level analysis, the degree of correlation between the difference in class indices and the difference in LST for different land types varied significantly over time, indicating that the landscape pattern indices had varying degrees of influence on LST over time. The regression analysis results were as follows (Table 8):
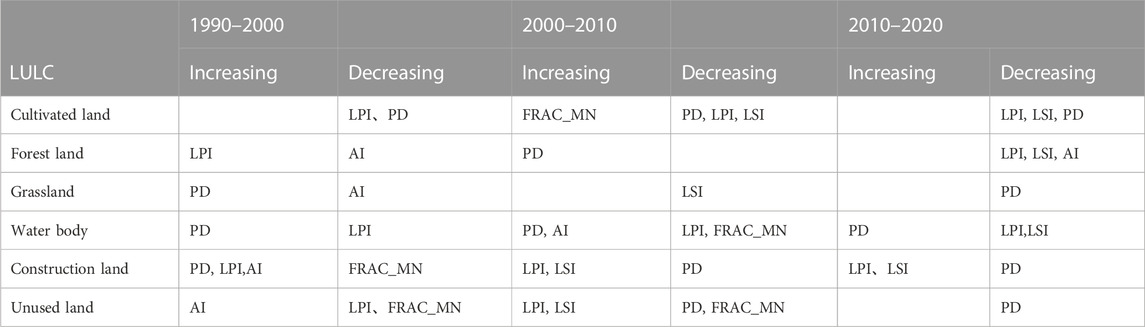
TABLE 8. Relationship between changes in the LULC class level and LST.
Cultivated land
Forest land
Grass land
Water body:
Construction land:
Unused land
It was found that between 1990 and 2000, LPI and PD decreased LST for cultivated land; LPI increased LST and AI decreased LST for forested land; AI decreased LST and PD increased LST for grassland; PD increased LST and AI decreased LST for waterbodies; FRAC_MN decreased LST for constructed land; and LPI and FRAC_MN decreased LST for unused land.
Between 2000 and 2010, FRAC_MN for cultivated land increases LST while PD, LPI, and LSI decrease LST; PD for forest land increases LST; LSI for grassland decreases LST; PD and AI for water bodies increase LST while LPI and FRAC_MN decrease LST; LPI and LSI for construction land increase LST while PD decreases LST; and PD and FRAC_MN for unused land decrease LST while LPI and LSI increase LST.
From 2010 to 2020, LPI, LSI, and PD decrease LST for cultivated land and forest land; PD decreases LST for grassland; LPI and LSI decrease LST and PD increases LST for waterbodies; LPI and LSI increase LST and PD decreases LST for construction land; and PD decreases LST for unused land. In general, higher PD and LPI of construction land and cultivated land can lead to increases in LST, while increases in landscape dominance and AI can lead to increases in the LST of cultivated land and cultivated land, while the opposite is true for forest land and water bodies, where higher aggregation, landscape dominance, and connectivity can improve the LST.
The results show that the class index of different LULCs has an unstable effect on LST and also indicate that the study of the relationship between the LULC landscape pattern index and LST in different periods is of great research significance for analyzing the changes in the LSTE.
The following is the regression equation between the change in the landscape type index and the transformation of the thermal environment at the surface:
The regression equation between the difference in landscape level indices and the difference in mean normalized LST demonstrates that the correlation between landscape level indices is also highly variable, implying that the influence of landscape level indices on the LSTE is also unstable.
From 1990 to 2000, the regression equation shows that only the difference in SHDI is associated with the difference in normalized LST while decreasing LST; from 2000 to 2010, FRAC_MN, AI, and LSI are all associated with the difference in normalized LST and will increase LST; from 2010 to 2020, PD, FRAC_MN, CONTAG, SHDI, and AI will all have an impact on LST.
When the class level and landscape type level results are combined, it is discovered that the class level difference and landscape type level difference all influence the normalized LST difference. However, different landscape pattern indices correlate differently with the normalized LST difference over time. According to a thorough analysis, the lower the PD of woodlands and water bodies, the higher the LPI and LSI, and the more effective at lowering LST and mitigating the urban heat island effect. In contrast, the greater the aggregation and landscape dominance of construction and arable land, the more likely they are to produce the heat-gathering effect, increasing LST and deteriorating LSTE. At the same time, the spatial and temporal distribution of the LSTE in Nanchang shows that most of the areas with a higher LSTE are located in residential areas or arable land and gradually shift towards the city center, owing to the concentration of construction land and arable land patches in the area and the high degree of aggregation, proving that the landscape pattern has an influence on the LSTE. Finally, concentrated and large-scale arable and construction land will degrade the LSTE. Simultaneously, increasing the area of forests and water bodies in the region, as well as the complexity and diversity of the structure of the LULC, can effectively reduce the region’s LST.
The analysis of the relationship between LUCC and the LST in Nanchang revealed that different LULC, structural, and landscape pattern changes all have a direct impact on the LST. In terms of static LULC, cultivated and constructed land has significantly higher average temperatures than other LULC. After conversion to cultivated or constructed land, the LST of various LULCs increased significantly. Some studies have found that changes in unused land areas have an impact on the LSTE (Huang et al., 2019), but this study found no significant warming effect of unused land. The classification of unused land in this study, where the majority of the unused land in the LULC is swamp and mudflat, could explain this. In contrast, the majority of unused land classification in existing studies is bare land, which has resulted in disparities in study results.
The dynamic role of LUCC on LST was discovered to vary at different scales (Kuang et al., 2017). To choose the best study scale, the study area was divided into 1 km × 1 km, 1.5 km × 1.5 km, and 2 km × 2 km fishing nets. It was discovered that the regression equations constructed for 1 km × 1 km and 1.5 km × 1.5 km fishing nets could not pass the significance test or there was no regression relationship, so the study scale was set to 2 km × 2 km, but in reality, LUCC have a strong influence on local climate (Tarawally et al., 2018), however, there may be differences in the effect and the range of influence, and the research on the effect of LULC on LST at different scales should be further deepened in the future.
However, there are some flaws in this study. To begin, due to data constraints, the study’s LST data were processed using Landsat data. The timing of Landsat image acquisition increased the study’s uncertainty (Schwaab et al., 2020). Because the Landsat 5 TM and Landsat 8 OLI images used in the study were from cloud-free weather, it is impossible to conclude that the relationship between LUCC and LST on cloudy or rainy days. The second limitation is the research methodology. While this study concludes that increasing the area of built-up land and cultivated land increases LST, the article lacks research on the relationship between urban building height and LST in the case of built-up land, with urban building height and area also being an influencing factor on urban heat islands (Morabito et al., 2016; Chen et al., 2022; Han et al., 2023). The study confirms that changes in LULC type, structure, and pattern all affect LST; however, LUCC contains many elements, such as arable land quality, water quality, changes in different types of trees in forest land, and changes in vegetation cover, all of which may affect LST, and the above studies should be strengthened in the future.
Notwithstanding its limitations, the study methodology reflects the relationship between type, structure, pattern, and LSTE of LUCC. It has no direct effect on the study’s findings.
Nanchang, a “furnace city,” was chosen for the study because of the complexity of LUCC and the close relationship between LUCC and LSTE change. The contribution index and regression analysis were used to study the relationship between scale, structure, morphology, and LSTE in LULC change separately. The study found that LUCCs in Nanchang primarily show a decrease in the area of cultivated land, a continuous expansion of construction land, a rapid increase in the proportion of construction land within the urban area, a gradual fragmentation of the overall patches, and a tendency to diversify the LULC structure. Also confirmed The thermal environment of Nanchang’s land surface is deteriorating, with high-temperature areas gradually expanding, primarily in densely built-up areas in the city center, while low-temperature areas are primarily located in the area of Poyang Lake in the north of Nanchang, with obvious spatial heterogeneity. According to the contribution index, construction land and arable land are the main contributors to the deterioration of the urban LSTE, whereas water bodies can effectively improve the LSTE. The regression equation also confirms that increasing the proportion of arable land and construction land area will significantly worsen the LSTE, while increasing the proportion of water body area will improve the LSTE. At the same time Different land type patterns have different effects on surface thermal conductivity. Different land-use patterns have different effects on the LSTE. For example, higher LPI and LSI for woodlands and water bodies can be effective in reducing LST and improving thermal trends in the LSTE. Therefore, in order to avoid the generation of urban heat island effect, the layout arrangement of land use type, quantity and landscape structure should be considered comprehensively in urban planning and design, and the deterioration of LSTE should be mitigated and the UHI effect should be avoided by appropriately increasing urban green areas and water bodies and enriching landscape structure types.
The original contributions presented in the study are included in the article/Supplementary material, further inquiries can be directed to the corresponding author.
YZ and HC: methodology, YZ: software, YZ and TZ: validation, YZ, HC and TZ: formal analysis, YZ: investigation, XG: resources, JZ: data curation, JZ and LH: writing—original draft preparation, YZ: writing—review and editing, YZ and HC: visualization, YZ and TZ: supervision, HC: project administration, TZ and HC: funding acquisition. All authors contributed to the article and approved the submitted version.
This research was funded by National Natural Science Foundation of China, grant No. 31660140 and 42001232; Natural Science Foundation of Jiangxi province, grant No. 20171BAA218021; Key Re-search Bases of Humanities and Social Sciences for Universities in Jiangxi province, grant no. 2018-32; and Special Funding Program for Graduate Student Innovation in Jiangxi Province, grant No. YC2022-s414.
The authors declare that the research was conducted in the absence of any commercial or financial relationships that could be construed as a potential conflict of interest.
All claims expressed in this article are solely those of the authors and do not necessarily represent those of their affiliated organizations, or those of the publisher, the editors and the reviewers. Any product that may be evaluated in this article, or claim that may be made by its manufacturer, is not guaranteed or endorsed by the publisher.
Bokaie, M., Zarkesh, M. K., Arasteh, P. D., and Hosseini, A. (2016). Assessment of urban heat island based on the relationship between land surface temperature and land use/land cover in tehran. Sustain. Cities Soc. 23, 94–104. doi:10.1016/j.scs.2016.03.009
Chang, Y., Xiao, J. F., Li, X. X., Zhou, D. C., and Wu, Y. P. (2022). Combining GOES-R and ECOSTRESS land surface temperature data to investigate diurnal variations of surface urban heat island. Sci. Total Environ. 823 (15), 153652. doi:10.1016/j.scitotenv.2022.153652
Chapman, S., Watson, J. E. M., Salazar, A., Thatcher, M., and McAlpine, C. A. (2017). The impact of urbanization and climate change on urban temperatures: a systematic review. Landsc. Ecol. 32 (10), 1921–1935. doi:10.1007/s10980-017-0561-4
Chen, J. K., Zhan, W. F., Du, P. J., Li, L., Li, J. F., Liu, Z. H., et al. (2022). Seasonally disparate responses of surface thermal environment to 2D/3D urban morphology. Build. Environ. 214 (15), 108928. doi:10.1016/j.buildenv.2022.108928
Chen, Y. C., Chiu, H. W., Su, Y. F., Wu, Y. C., and Cheng, K. S. (2017). Does urbanization increase diurnal land surface temperature variation? Evidence and implications. Landsc. Urban Plan. 157, 247–258. doi:10.1016/j.landurbplan.2016.06.014
Das Majumdar, D., and Biswas, A. (2016). Quantifying land surface temperature change from LISA clusters: an alternative approach to identifying urban land use transformation. Landsc. Urban Plan. 153, 51–65. doi:10.1016/j.landurbplan.2016.05.001
Estalkhsari, B. M., Mohammad, P., and Razavi, N. (2022). Change detection in a rural landscape: a case study of processes and main driving factors along with its response to thermal environment in Farim, Iran [Article; Early Access]. Environ. Sci. Pollut. Res. 17. doi:10.1007/s11356-022-24504-5
Estoque, R. C., Murayama, Y., and Myint, S. W. (2017). Effects of landscape composition and pattern on land surface temperature: an urban heat island study in the megacities of Southeast Asia. Sci. Total Environ. 577, 349–359. doi:10.1016/j.scitotenv.2016.10.195
Fu, P., and Weng, Q. H. (2016). A time series analysis of urbanization induced land. use and land cover change and its impact on land surface temperature with Landsat imagery. Remote Sens. Environ. 175, 205–214. doi:10.1016/j.rse.2015.12.040
Guo, G. H., Wu, Z. F., Xiao, R. B., Chen, Y. B., Liu, X. N., and Zhang, X. S. (2015). Impacts of urban biophysical composition on land surface temperature in urban heat island clusters. Landsc. Urban Plan. 135, 1–10. doi:10.1016/j.landurbplan.2014.11.007
Han, D., An, H., Cai, H., Wang, F., Xu, X., Qiao, Z., et al. (2023). How do 2D/3D urban landscapes impact diurnal land surface temperature: insights from block scale and machine learning algorithms. Sustain. Cities Soc. 99, 104933. doi:10.1016/j.scs.2023.104933
Hang, H. T., and Rahman, A. (2018). Characterization of thermal environment over heterogeneous surface of National Capital Region (NCR), India using LANDSAT-8 sensor for regional planning studies. Urban Clim. 24, 1–18. doi:10.1016/j.uclim.2018.01.001
Huang, C. C., Zhang, M. L., Zou, J., Zhu, A. X., Chen, X., Mi, Y., et al. (2015). Changes in land use, climate and the environment during a period of rapid economic development in Jiangsu Province, China. Sci. Total Environ. 536, 173–181. doi:10.1016/j.scitotenv.2015.07.014
Huang, Q. P., Huang, J. J., Yang, X. N., Fang, C. L., and Liang, Y. J. (2019). Quantifying the seasonal contribution of coupling urban land use types on Urban Heat Island using Land Contribution Index: a case study in Wuhan, China. Sustain. Cities Soc. 44, 666–675. doi:10.1016/j.scs.2018.10.016
Intergovernmental Panel on Climate Change (2023). Climate change 2022 – impacts, adaptation and vulnerability. doi:10.1017/9781009325844
Kuang, W. H., Yang, T. R., Liu, A. L., Zhang, C., Lu, D. S., and Chi, W. F. (2017). An EcoCity model for regulating urban land cover structure and thermal environment: taking Beijing as an example. Sci. China-Earth Sci. 60 (6), 1098–1109. doi:10.1007/s11430-016-9032-9
Li, Y., Schubert, S., Kropp, J. P., and Rybski, D. (2020). On the influence of density and morphology on the Urban Heat Island intensity. Nat. Commun. 11 (1), 2647. doi:10.1038/s41467-020-16461-9
Morabito, M., Crisci, A., Messeri, A., Orlandini, S., Raschi, A., Maracchi, G., et al. (2016). The impact of built-up surfaces on land surface temperatures in Italian urban areas. Sci. Total Environ. 551-552, 317–326. doi:10.1016/j.scitotenv.2016.02.029
Mushore, T. D., Mutanga, O., Odindi, J., and Dube, T. (2017). Linking major shifts in land surface temperatures to long term land use and land cover changes: a case of Harare, Zimbabwe. Urban Clim. 20, 120–134. doi:10.1016/j.uclim.2017.04.005
Oke, T. R. (1982). The energetic basis of the urban heat island. Q. J. R. Meteorological Soc. 108 (455), 1–24. doi:10.1002/qj.49710845502
Pelletier, J. D., Murray, A. B., Pierce, J. L., Bierman, P. R., Breshears, D. D., Crosby, B. T., et al. (2015). Forecasting the response of Earth's surface to future climatic and land use changes: a review of methods and research needs. Earths Future 3 (7), 220–251. doi:10.1002/2014ef000290
Peng, J., Ma, J., Liu, Q. Y., Liu, Y. X., Hu, Y. N., Li, Y. R., et al. (2018). Spatial-temporal change of land surface temperature across 285 cities in China: an urban-rural contrast perspective. Sci. Total Environ. 635, 487–497. doi:10.1016/j.scitotenv.2018.04.105
Pramanik, S., and Punia, M. (2020). Land use/land cover change and surface urban heat island intensity: source-sink landscape-based study in Delhi, India. Environ. Dev. Sustain. 22 (8), 7331–7356. doi:10.1007/s10668-019-00515-0
Qiao, Z., Lu, Y., He, T., Wu, F., Xu, X., Liu, L., et al. (2023). Spatial expansion paths of urban heat islands in Chinese cities: analysis from a dynamic topological perspective for the improvement of climate resilience. Resour. Conservation Recycl. 188, 106680. doi:10.1016/j.resconrec.2022.106680
Saleh, S. K., Sanaei, A., Amoushahi, S., and Ranjbar, S. (2022). Effect of landscape pattern changes and environmental indices on land surface temperature in a fragile ecosystem in southeastern Iran [Article; Early Access]. Environ. Sci. Pollut. Res. 17. doi:10.1007/s11356-022-24602-4
Schwaab, J., Davin, E. L., Bebi, P., Duguay-Tetzlaff, A., Waser, L. T., Haeni, M., et al. (2020). Increasing the broad-leaved tree fraction in European forests mitigates hot temperature extremes. Sci. Rep. 10 (1), 14153. doi:10.1038/s41598-020-71055-1
Schwaab, J., Meier, R., Mussetti, G., Seneviratne, S., Burgi, C., and Davin, E. L. (2021). The role of urban trees in reducing land surface temperatures in European cities. Nat. Commun. 12 (1), 6763. doi:10.1038/s41467-021-26768-w
Senf, C., Leitão, P. J., Pflugmacher, D., van der Linden, S., and Hostert, P. (2015). Mapping land cover in complex Mediterranean landscapes using Landsat: improved classification accuracies from integrating multi-seasonal and synthetic imagery. Remote Sens. Environ. 156, 527–536. doi:10.1016/j.rse.2014.10.018
Shiva, J. S., Chandler, D. G., and Kunkel, K. E. (2019). Localized changes in heat wave properties across the United States. Earths Future 7 (3), 300–319. doi:10.1029/2018ef001085
Silva, J. S., da Silva, R. M., and Santos, C. A. G. (2018). Spatiotemporal impact of land use/land cover changes on urban heat islands: a case study of Paco do Lumiar, Brazil. Build. Environ. 136, 279–292. doi:10.1016/j.buildenv.2018.03.041
Siqi, J., and Yuhong, W. (2020). Effects of land use and land cover pattern on urban temperature variations: a case study in Hong Kong. Urban Clim. 34, 100693. doi:10.1016/j.uclim.2020.100693
Souza, D. O. d., Alvalá, R. C. d. S., and Nascimento, M. G. d. (2016). Urbanization effects on the microclimate of Manaus: a modeling study. Atmos. Res. 167, 237–248. doi:10.1016/j.atmosres.2015.08.016
Su, S., Wang, Y., Luo, F., Mai, G., and Pu, J. (2014). Peri-urban vegetated landscape pattern changes in relation to socioeconomic development. Ecol. Indic. 46, 477–486. doi:10.1016/j.ecolind.2014.06.044
Sun, R., and Chen, L. (2017). Effects of green space dynamics on urban heat islands: mitigation and diversification. Ecosyst. Serv. 23, 38–46. doi:10.1016/j.ecoser.2016.11.011
Tarawally, M., Xu, W. B., Hou, W. M., and Mushore, T. D. (2018). Comparative analysis of responses of land surface temperature to long-term land use/cover changes between a coastal and inland city: a case of freetown and bo town in Sierra Leone. Remote Sens. 10 (1), 112. doi:10.3390/rs10010112
Wang, C., Yu, C., Chen, T., Feng, Z., Hu, Y., and Wu, K. (2020). Can the establishment of ecological security patterns improve ecological protection? An example of Nanchang, China. Sci. Total Environ. 740, 140051. doi:10.1016/j.scitotenv.2020.140051
Wang, S. M., Ma, Q. F., Ding, H. Y., and Liang, H. W. (2018). Detection of urban expansion and land surface temperature change using multi-temporal landsat images. Resour. Conservation Recycl. 128, 526–534. doi:10.1016/j.resconrec.2016.05.011
Wang, Y. X., Li, X. S., Zhang, C., and He, W. K. (2022). Influence of spatiotemporal changes of impervious surface on the urban thermal environment: a case of Huai'an central urban area. Sustain. Cities Soc. 79 (11), 103710. doi:10.1016/j.scs.2022.103710
Weng, Y.-C. (2007). Spatiotemporal changes of landscape pattern in response to urbanization. Landsc. Urban Plan. 81 (4), 341–353. doi:10.1016/j.landurbplan.2007.01.009
Wong, P. P. Y., Lai, P. C., Low, C. T., Chen, S., and Hart, M. (2016). The impact of environmental and human factors on urban heat and microclimate variability. Build. Environ. 95, 199–208. doi:10.1016/j.buildenv.2015.09.024
Wu, S., Chen, B., Webster, C., Xu, B., and Gong, P. (2023). Improved human greenspace exposure equality during 21(st) century urbanization. Nat. Commun. 14 (1), 6460. doi:10.1038/s41467-023-41620-z
Yildiz, N. D., Avdan, U., Yilmaz, S., and Matzarakis, A. (2018). Thermal map assessment under climate and land use changes; a case study for Uzundere Basin. Environ. Sci. Pollut. Res. 25 (1), 940–951. doi:10.1007/s11356-017-0424-1
Yu, W. P., Shi, J. A., Fang, Y. L., Xiang, A. M., Li, X., Hu, C. H., et al. (2022). Exploration of urbanization characteristics and their effect on the urban thermal environment in Chengdu, China. Build. Environ. 219 (13), 109150. doi:10.1016/j.buildenv.2022.109150
Zareie, S., Khosravi, H., Nasiri, A., and Dastorani, M. (2016). Using Landsat Thematic Mapper (TM) sensor to detect change in land surface temperature in relation to land use change in Yazd, Iran. Solid earth. 7 (6), 1551–1564. doi:10.5194/se-7-1551-2016
Keywords: LUCC, landsat images, evolution in time and space, dynamic analysis, nanchang
Citation: Zhang Y, Cai H, Zhu T, Guo X, Zeng J and Huang L (2023) Impact of land use changes on the land surface thermal environment in Nanchang, Jiangxi province, China. Front. Environ. Sci. 11:1227682. doi: 10.3389/fenvs.2023.1227682
Received: 23 May 2023; Accepted: 30 October 2023;
Published: 16 November 2023.
Edited by:
Hualin Xie, Jiangxi University of Finance and Economics, ChinaReviewed by:
Lucian Sfica, Alexandru Ioan Cuza University, RomaniaCopyright © 2023 Zhang, Cai, Zhu, Guo, Zeng and Huang. This is an open-access article distributed under the terms of the Creative Commons Attribution License (CC BY). The use, distribution or reproduction in other forums is permitted, provided the original author(s) and the copyright owner(s) are credited and that the original publication in this journal is cited, in accordance with accepted academic practice. No use, distribution or reproduction is permitted which does not comply with these terms.
*Correspondence: Haisheng Cai, Y2hzQGp4YXUuZWR1LmNu
Disclaimer: All claims expressed in this article are solely those of the authors and do not necessarily represent those of their affiliated organizations, or those of the publisher, the editors and the reviewers. Any product that may be evaluated in this article or claim that may be made by its manufacturer is not guaranteed or endorsed by the publisher.
Research integrity at Frontiers
Learn more about the work of our research integrity team to safeguard the quality of each article we publish.