 Xuwei Li1,2Da Ding1,2Wenyi Xie1,2Xuzhi Li1,2Mengjie Wang1,2Lingya Kong1,2Dengdeng Jiang1,2Shaopo Deng1,2*
- 1Nanjing Institute of Environmental Sciences, Ministry of Ecology and Environment of China, Nanjing, China
- 2State Environmental Protection Key Laboratory of Soil Environmental Management and Pollution Control, Nanjing, China
As efforts to mitigate soil and groundwater pollution intensify nationwide, the incidence of volatile organic compound (VOC) contaminated sites has risen significantly. These sites exhibit continuous release and dispersion of VOCs during and after remediation/control processes, thereby adversely affecting the local environment and residents. This issue has emerged as a prominent concern in contemporary society. This study takes a representative pesticide-contaminated site as the research subject. The pollutant levels, composition, spatiotemporal distribution, and source characteristics of VOCs in the ambient air environment from 2016 to 2021 were investigated by statistical analysis, Geographic Information System (GIS) spatial interpolation, Positive Matrix Factorization (PMF) model, and characteristic ratio source. The results showed that the average mass concentration proportions of the five types of pollutants are: benzene, toluene, ethylbenzene, and xylenes (BTEX) (29.73%) > alkanes (26.85%) > oxygenated hydrocarbons (21.96%) > halogenated hydrocarbons (19.12%) > sulfides (2.35%). M-/p-xylenes and toluene were the main contributing pollutants of BTEX and appeared frequently in the lists of top three pollutant in the contribution rates at various sites. The average concentration range of VOCs inside (EA1∼EA5) and outside the site (CK1∼CK4) were 810.71–1437.24 μg/m³, and 784.47–1358.16 μg/m³, respectively. The spatial distribution and variation trend in concentrations of halogenated hydrocarbons and alkanes were similar, with both being high in the middle of the site in 2017 and high in the south in 2018, and then sharply falling to a lower level in 2019. The source analysis results showed that the main contribution sources of environmental air varied over time. There were three types of emission sources for VOCs during the monitoring periods in 2016 and 2018. The maximum contributions to total volatile organic compounds (TVOCs) in 2016 and 2018 were volatile sources of characteristic pollutants within the site (45.6%) and volatile source of fuel (70.6%), respectively. This study provides scientific evidence for the environmental management, planning, and VOCs pollution control of pesticide-contaminated sites in China.
1 Introduction
Volatile organic compound (VOCs) typically refer to a broad range of organic compounds with an initial boiling point not greater than 250°C and a vapor pressure below the standard atmospheric pressure of 101.3 kPa, or those organic compounds that have volatility under specific conditions (EPA, 2023). VOCs are characterized by their diversity, complex composition, wide distribution, and involvement in complex photochemical reaction mechanisms (Guo et al., 2017; Chenxi et al., 2019). They can be broadly divided into two groups: hydrocarbons, which include alkanes, alkenes, alkynes, aromatics, and cycloalkanes, and heteroatom-substituted compounds, which include aldehydes, ketones, ethers, esters, and chlorinated hydrocarbons. Most VOCs, especially those containing aromatics, which largely contribute to ozone formation, have irritating and poisonous qualities and may be harmful to human’s health (Cetin et al., 2018; Hu et al., 2018).
In recent years, with the worsening situation of VOCs pollution, research related to atmospheric VOCs has become a significant focus of attention among scholars. Extensive research has been conducted, particularly in terms of VOCs pollution characterization, sources, and health risks. Currently, most of China’s research on VOCs is at the regional scale, focusing on areas with high carbon emissions like Beijing, the Yangtze River Delta, the Pearl River Delta, and Chengdu-Chongqing region, which have become research hotspots. For instance, research by Liu et al. on the composition characteristics and sources of VOCs during the frequent winter haze in Beijing showed that benzene, toluene, ethylbenzene, xylenes and halogenated hydrocarbons dominated, with solvent use and vehicle exhaust emissions being the main emission sources (Dan et al., 2016). In another study, Yu et al. found that in Guangzhou’s urban areas, the total volatile organic compounds (TVOCs) concentration was higher in winter and lower in summer, and the dominant pollutants were alkanes and BTEX, both of which were associated with fuel and vehicle emissions (Xiaofang, 2019). Using gas chromatography-flame ionization detector online measurement method, Xia et al. analyzed the VOCs in the northern suburb of Nanjing and found that the concentration in the area was mainly originate from vehicle emissions, industrial emissions, and organic solvent use, with the highest contribution from olefins among VOCs components (Li, 2013). These research findings have important reference significance for the investigation of the current situation, characteristics, and causes of atmospheric VOCs pollution at the regional scale. However, most of these studies were based on short time series data and relatively large study units, without a focus on point-source pollution. Therefore, it is difficult to accurately reveal the spatiotemporal distribution characteristics and evolution trends of VOCs pollution in small-scale air environments.
With the growth of soil and groundwater pollution control work in China, risk control and remediation of VOCs contaminated sites have become common issues. During and after the restoration/control process, VOCs at some of these sites continue to be emitted and spread, having negative effects on the local environment and population, making it a crucial environmental problem in today’s society. Regarding the issue of atmospheric secondary pollution during the restoration of contaminated sites, some domestic scholars have conducted relevant research. For instance, Gan et al. found that during the soil restoration project at a former chemical plant site in Beijing, the pollutant concentration decreased with distance in the dominant wind direction, showing an alternating pattern of concentration peaks and valleys. The diffusion range of pollutants was related to the pollutant type, meteorological parameters, and terrain (Ping et al., 2013). Yan et al. investigated the effects of excavation disturbance on the distribution of hexachlorocyclohexanes (HCHs) and dichloro-diphenyl-trichloroethane (DDTs) in the air of polluted sites and suggested that excavation work during the restoration of organic chlorinated pesticide-contaminated sites should be avoided as much as possible under high-temperature or strong convective weather conditions (Yunzhong et al., 2014). Ma et al. analyzed the air samples collected during the restoration process of a chemical pollution site and found that the main VOCs pollutants were acetone and propylene, which originated from the production and processing of nitrochlorobenzene, the use of organic solvents, and exhaust emissions from the production processes (Honglu, 2021). However, there are few reports on the comprehensive investigation of long-term monitoring, spatiotemporal characteristic changes, and source analysis of air VOCs in polluted sites. Understanding the spatiotemporal variation patterns and dynamic source analysis of air VOCs in polluted sites can provide a comprehensive understanding of the pollution status and potential risks of the site, and provide a basis for scientific management and remediation of the site.
This study aims to investigate the characteristics and evolution trends of VOCs in different times and spaces, reveal the concentration levels, spatial differences, and variation trends of pollutants, and use Positive Matrix Factorization (PMF) model to analyze the source contributions of pollutants using statistical analysis data of VOCs in the environmental air from a typical pesticide-contaminated site between 2016 and 2021 (Paatero and Tapper, 1993; Fending, 2011). The findings could serve as a solid scientific foundation for China’s pesticide-contaminated sites’ environmental management, planning, and VOC pollution reduction.
2 Materials and methods
2.1 Site overview
The investigated region exhibits a significant historical record of manufacturing activities conducted by the initial corporation. The primary focus of production centered around the synthesis of various pesticides such as DDT, dipterex, monocrotophos, butachlor, acetochlor, glyphosate, quizalofop, and other similar compounds. Furthermore, the company was engaged in the production of refined chemicals encompassing caustic soda, liquid chlorine, hydrochloric acid, diketene, n-methyl acetoacetylamide, modified resins, polytetrafluoroethylene, and various other substances. The assessment of the site showed that the main pollutants include BTEX, chlorinated aliphatic hydrocarbons (CAH), chlorobenzene (CB), phenol, polycyclic aromatic hydrocarbons (PAHs), glyphosate, chlorpyrifos (Mengjie et al., 2022). Shallow soil remediation (up to a depth of 6 m) was completed from 2013 to 2016, while due to economic and technical constraints, groundwater underwent a five-year monitoring and monitored natural attenuation from 2016 to 2021. The decommissioned site is located in a sensitive area of the city, with a dense population surrounding it. There are elderly apartments, kindergartens, residential areas, schools and other sensitive areas within a 500 m radius around the source of pollution, which may easily trigger public opinion risks caused by odor diffusion and disturbance of residents. The dominant wind direction in the region is predominantly southeasterly, with an average wind speed of 4.3 m/s, an average rainfall of 1086 mm, and a temperature range of 0°C–31°C.
2.2 Sample collection
According to the on-site situation, nine atmospheric VOCs sample collection points were scattered within the polluted site and 1 km surrounding the residential areas. Among them, EA1∼EA5 were located near the key polluted areas within the site, and CK1∼CK4 were in the residential areas surrounding the site. The sampling locations were distributed as shown in Figure 1. Sampling was conducted from July 2016 to June 2021, with at least one set of samples collected every quarter, totaling 26 sets. This study has clear requirements for sampling conditions and sampling time, to ensure that the weather on the day of sampling is sunny and windless, to minimize the impact of meteorological factors on the monitoring of concentrations, to account for the peak of motor vehicle traffic in the morning and evening of weekdays, and to ensure that all samples are collected in the same sampling environment.
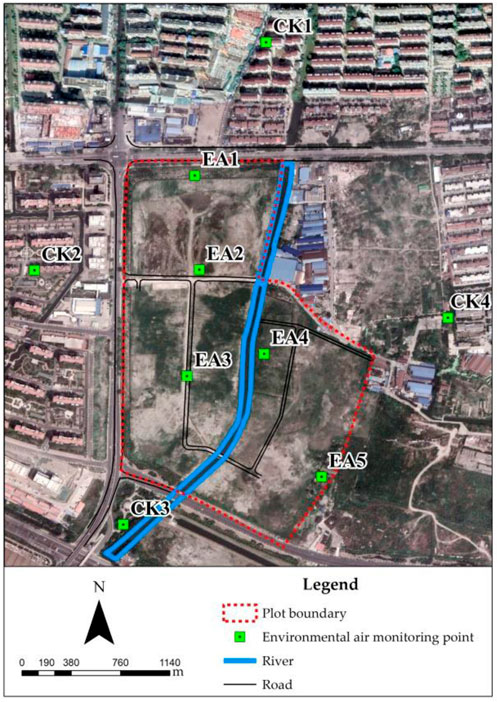
FIGURE 1. Distribution of environmental air sampling points within the study area.
VOCs sample collection was carried out in accordance with the relevant requirements of Technical Specifications for Manual Monitoring of Environmental Air Quality (HJ194–2017) and Ambient air—Determination of 65 volatile organic compounds—Collected in canisters and analyzed by gas chromatography/mass spectrometry (HJ 759–2015). The environmental air was collected using Summa canisters, with the sampling port at a height of 1.5 m above the ground and ensured that there were no significant obstructions surrounding it. One air sample is collected within 24 h, at least one sample is taken from each batch (less than 10) to check for airtightness, and the canisters are evacuated and allowed to stand for a number of days prior to use to ensure that the internal pressure change is less than or equal to 0.7 kPa/d (P. Ministry Of Ecology and Environment, 2017; P. Ministry Of Ecology and Environment, 2023).
2.3 Sample handling and analysis
In this experiment, a preconcentration gas chromatography–mass spectrometry/flame ionization detection (GC—MS/FID) system was used for qualitative and quantitative analysis of VOC components in the samples. A total of 77 kinds of VOC components were detected, including 10 BTEXs, 5 oxygenated hydrocarbons, 26 halogenated hydrocarbons, 35 alkanes, and 1 sulfonate compound. The collected samples were taken at 400 mL through an Entech 7016 auto-sampler and loaded with 20 mL internal standard into the Entech 7200 atmospheric preconcentration system. After pre-concentration, the samples underwent third-stage cryogenic trapping enrichment and were subsequently desorbed and analyzed using a direct-connect GC-MS system (Agilent7890—5977). After obtaining the chromatogram and mass spectrometry result, the peak response areas of the target compound and the internal standard were calculated and quantified using the internal standard method to measure the concentration of the compound, the internal standard gas components used in this study were 4-Bromofluorobenzene, 1,4-difluorobenzene, chlorobenzene d5 (EPA, 1999).
2.4 Data analysis
2.4.1 Spatial interpolation
Spatial interpolation is the most widely used method for characterizing atmospheric pollutant concentrations (Yonglin et al., 2016; Bari and Kindzierski, 2018; Peng et al., 2020). Research has found that inverse distance weighting (IDW) is simpler and more direct to use than other methods, and is fast and accurate, especially for sites with fewer discrete points, and the maps form a circle around the high values, which gives a more intuitive representation of the pollutant concentration (Yan, 2019). Due to the above advantages of IDW, which can maintain high accuracy of monitoring results and highlight overall trends, this study used ArcGIS 10.3 software and selected IDW to draw spatial distribution maps of VOCs concentration in and around the polluted site.
2.4.2 Positive Matrix Factorization
PMF model is a novel and effective source analysis method (Paatero and Tapper, 1993). It combines the identification of emissions sources and computational results to infer source types and their contributions to the atmospheric environment. The analysis results are more in line with the actual situation and significantly better than other source analysis methods. It has been demonstrated that the PMF model has unique software, parses more sources than the PCA/APCS model, and parses better than the PCA/APCS model (Meng et al., 2014). PMF is a multivariate receptor model that decomposes an i × j dimensional matrix (xij) into a contribution matrix (gik) and a factor matrix (fkj):
In the above equation, i and j respectively represent the number of samples and types of pollutants, k represents the number of factors, and eij is the residual fraction. The PMF model obtains factor profiles and source contributions by using least square method to minimize the objective function Q:
In the above equation, Uij represents the monitoring uncertainty for each species concentration in each sample. Uij was calculated using Eqs 3, 4. If VOCs concentrations are above their method detection limit (MDL), then Eq. 3 is utilized:
Error fraction is set to 15% in this study (EPA, 2023). If VOCs concentrations are below their MDL, then Eq. 4 is employed:
In this study, the concentrations of VOCs were processed as follows to assure accuracy and reasonableness of source analysis:1) remove components with detection rates less than 50%; 2) calculate the concentration of undetected components according to half of the detection limit (Zijin et al., 2021); 3) set the number of factors to be between 3 and 6, perform multiple model reconstructions to stabilize the Q value, adjust the ratio residual value and R2 value to ensure that the proportion of component ratio residual value between +3 and −3 is greater than 95%, and that the R2 value is above 0.98. The United States Environmental Protection Agency (USEPA) PMF 5.0 software was employed for PMF analysis (EPA, 2023).
2.4.3 Characteristic species ratio method
By analyzing the characteristics of VOCs pollution sources, the contribution rates of various pollution sources to pollutant components in the air can be quickly understood. The concentration ratio of toluene and benzene (T/B) is a commonly used method for determining vehicle exhaust emissions (Cui et al., 2022). When the ratio of T/B is in the range of 0.9–2.2, the main emission source of VOCs in the atmosphere is motor vehicle exhaust. If the T/B value is greater than 2, it indicates that VOCs are also affected by other pollution sources (Xiao, 2021; Cui et al., 2022). In this study, the T/B ratio of characteristic compounds, such as toluene and benzene, was analyzed to clarify the VOCs emission characteristics of the polluted site and its surrounding areas.
3 Results and discussion
3.1 Pollution characteristics and levels of VOCs
3.1.1 VOCs composition features
In this study, hourly concentration monitoring was conducted for 77 types of VOCs, including 10 BTEXs, 5 oxygenated hydrocarbons, 26 halogenated hydrocarbons, 35 alkanes, and 1 sulfonate compound. As shown in Figure 2A, the average mass concentrations of BTEX, oxygenated hydrocarbons, sulfonate compounds, halogenated hydrocarbons, and alkanes were in the range of 14.65%–45.57%, 6.62%–37.24%, 1.23%–3.85%, 8.29%–25.34%, and 17.15%–40.62%, respectively. From Figure 2B, it can be seen that the average mass concentrations of BTEX and alkanes were relatively high, accounting for 29.73% and 26.85%, respectively, of the total VOCs concentration monitored throughout the day.
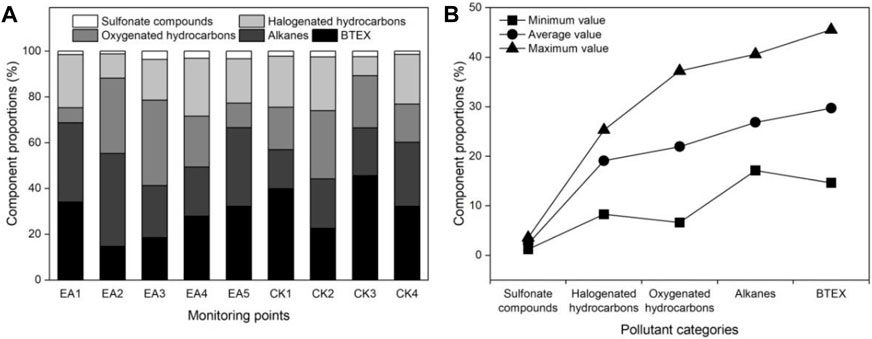
FIGURE 2. The concentration ratios of VOCs components at different monitoring points in the study area over a five-year period. (A) The concentration ratios of VOCs types at different monitoring points; (B) Statistical analysis of the concentration of different types of VOCs.
As indicated in Figure 3 and Table 1, this study analyzed the contribution rates of VOCs components with high rankings at each monitoring site during the monitoring period. The results showed that the sum of the contribution rates of the top 20 VOCs components in terms of total concentration at each sampling point during the study period exceeded 82%, ranging from 82.16% to 90.91%. The sum of the contribution rates of the top 10 VOCs components in terms of total concentration at each sampling point during the study period exceeded 50%, ranging from 55.12% to 75.70%. Among these, components such as m/p-xylene, n-hexane, isobutane, tetrachloroethylene, toluene, chlorobenzene, isopentane, 1,2-dichloroethane had relatively high content and accounted for more than 10% of the total, making them the main pollutants contributing to TVOCs. According to Table 1, there were a total of 17 VOCs components with average contribution rates greater than 5% during the study period, mainly including BTEX, halogenated hydrocarbons, and alkanes. The contribution rates of m/p-xylene at 9 sampling points were all above 6%, ranging from 6.16% to 22.08%, and its contribution rate was ranked in the top four. Next was toluene, which accounted for 5.48%–14.88%, respectively. These two pollutants were the main contributors to BTEX and appeared frequently in the top three pollutant lists at each sampling point, indicating a close relationship between the variation characteristics of BTEX.
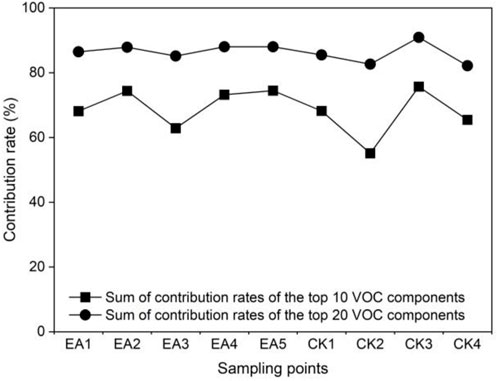
FIGURE 3. Sum of contribution rates of components with high rankings at different monitoring points in the study area.
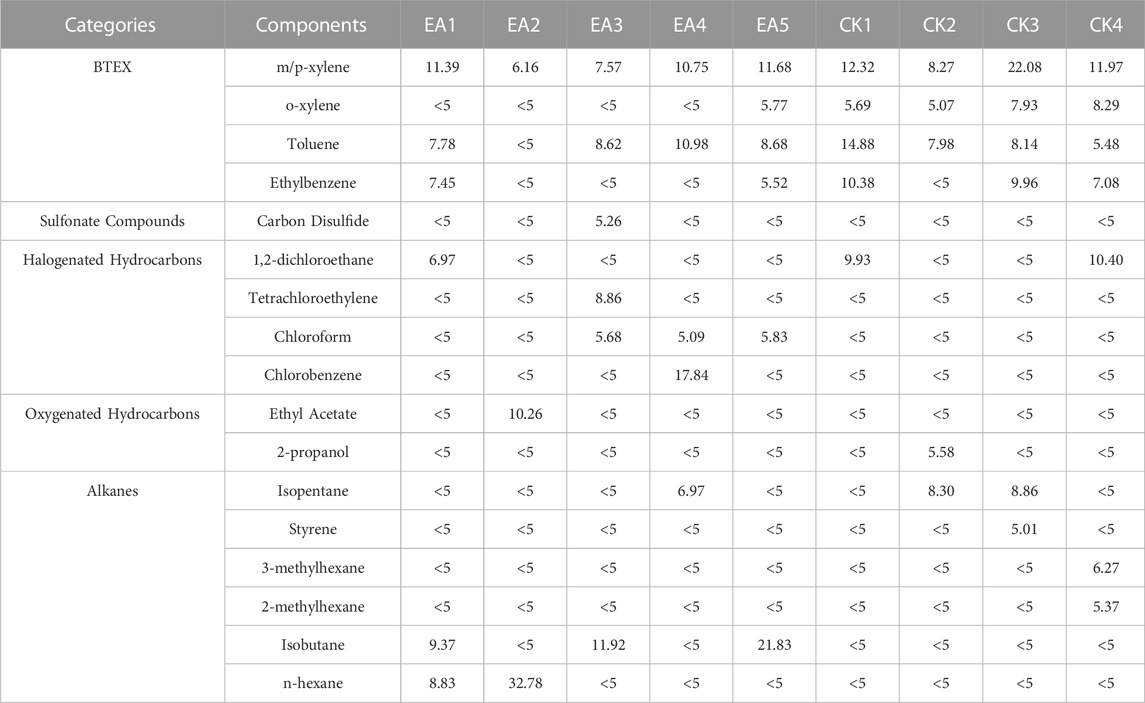
TABLE 1. The average concentration ratios of VOCs components in the environmental air (≥5%). unit of concentration ratios: %.
In this study, the high contribution rates of BTEX may be related to characteristic pollutants in the site, especially during the early monitoring stage (2016–2018). Excavation and remediation activities within the site led to an increase in the concentration of BTEX due to volatilization. Based on literature findings, the analysis of observation points proximal to the location between 2016 and 2018 revealed substantial contributions in terms of volume concentration from various substances. Specifically, propane, ethane, ethylene, toluene, acetylene, n-butane, and isopentane were identified as prominent constituents during the aforementioned period (Minna et al., 2021). In 2019, the top species by average volume fraction in Nantong City were propane, ethane, ethylene, acetylene, n-butane, toluene, isopentane, m/p-xylene, and isobutene (Minna, 2020). This indicates that the main pollutants contributing to this site are relatively stable in composition, which is similar to the characteristics of the VOCs composition in Nantong City (Rong et al., 2021), which mainly consists of alkanes and BTEX.
3.1.2 Concentration levels and variation characteristics of VOCs
As shown in Figure 4, in this study, the average mass concentrations of total VOC in EA1 to EA5 within the site were 1155.86 μg/m³, 1113.78 μg/m³, 810.71 μg/m³, 1437.24 μg/m³, and 1278.36 μg/m³, respectively. The concentration ranges were 8.90–6203.91 μg/m³, 15.80–9054.09 μg/m³, 6.70–4770.87 μg/m³, 8.80–8367.89 μg/m³, and 13.70–12487.39 μg/m³. The average mass concentrations of VOCs in CK1 to CK4 around the site were 872.80 μg/m³, 784.47 μg/m³, 801.96 μg/m³, and 1358.16 μg/m³, respectively. The concentration ranges were 5.10–6010.16 μg/m³, 11.0–3964.44 μg/m³, 27.90–5320.67 μg/m³, and 17.0–6720.21 μg/m³.
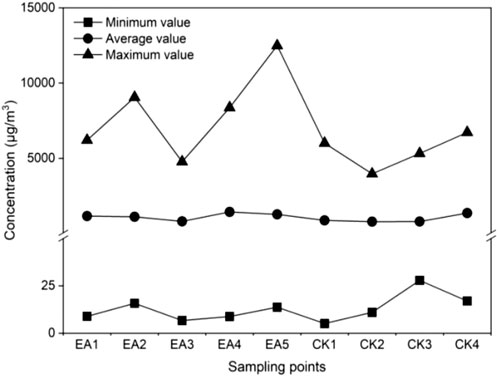
FIGURE 4. The statistical levels of VOCs concentration.
As shown in Figure 5, from the trend changes perspective, the atmospheric concentration was generally higher during the observation period in 2017, especially on January 17th and June 13th, 2017. On July 28th, 2017, oxygenated hydrocarbons measured at EA1, EA3, EA4, CK2, and CK4 were at their highest concentration levels during the study period. They decreased continuously over time until 2021, with the maximum concentration range of oxygenated hydrocarbons being only 0–6.7 μg/m³. The most significant changes in halogenated hydrocarbons were observed at EA1, EA4, CK2, and CK4 monitoring points. VOCs concentration presented significant “multi-peak” or “single peak” characteristics, with more intense fluctuations before 2018. The most pronounced changes occurred at EA1 and EA4 monitoring points where VOCs concentration increased repeatedly during a certain period and then sharply declined. The trend changes of alkanes were similar to those of halogenated hydrocarbons, but the peak fluctuations were more significant. EA1 had three peaks, while EA2, EA3, EA5, and CK4 had particularly prominent peak shapes. The concentration fluctuations of BTEX were particularly evident at EA1, EA4, CK1, and CK3 monitoring points. It is worth noting that all monitoring points recorded their highest values in 2017 or 2018, followed by a significant decline. In general, BTEX, halogenated hydrocarbons, and alkanes showed significant “peak” changes, with the most pronounced fluctuations taking place between January 17th, 2017 and March 22nd, 2018. The variation trend of oxygenated hydrocarbons was slightly different, showing lower overall concentrations, while sulfonate compounds remained stable.
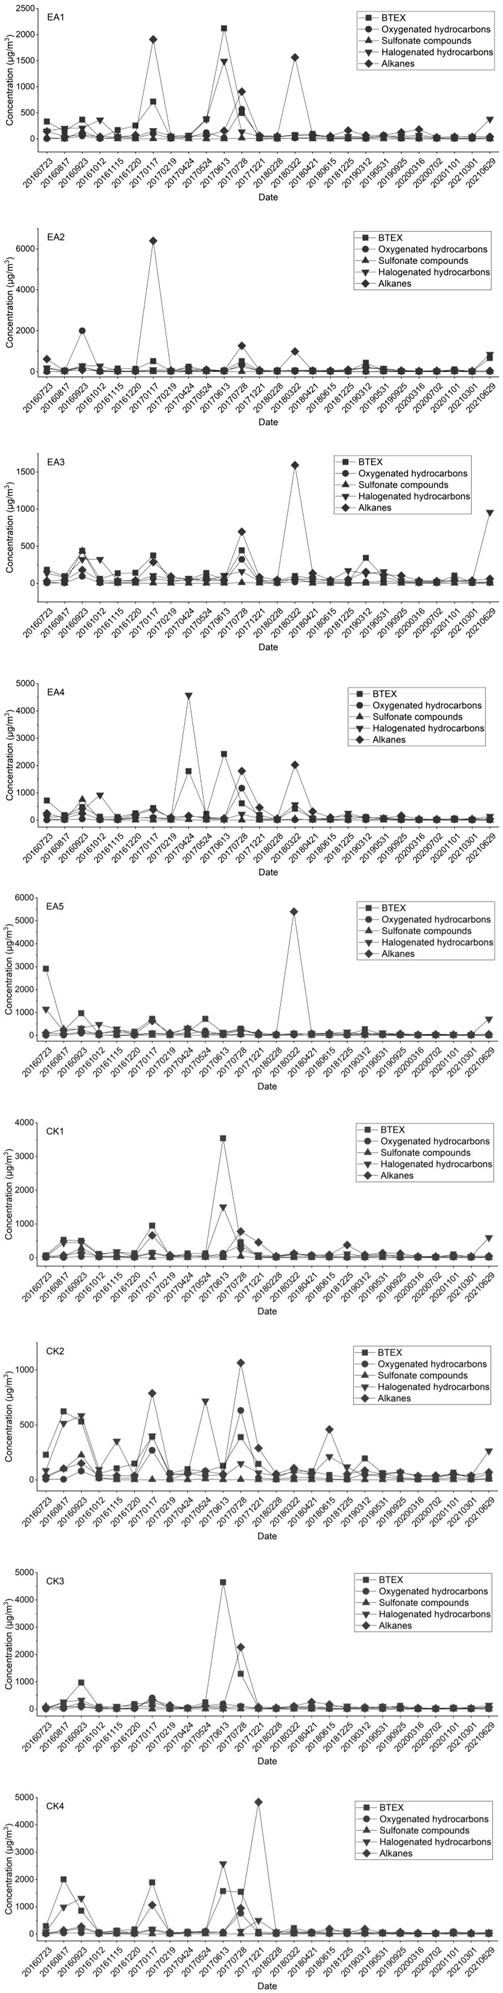
FIGURE 5. (Continued).
In this study, the variation trend of halogenated hydrocarbons was consistent with the concentration changes of groundwater pollutants in the study area reported by Mengjie et al. (2022). The concentrations of Halogenated aliphatic hydrocarbons in two heavily polluted monitoring wells showed a fluctuating downward trend over the four-year monitoring period, with sudden increases in 2016 and 2017, followed by rapid declines. Yan et al. (2022) found that BTEX had the highest concentration distribution in monitoring wells in 2017, which is similar to the pattern observed for VOCs in the air in this study. Due to the surface remediation and plantation completed at the study site between 2016 and 2018, there was no effective risk barrier layer yet formed. In addition, the aquifer of the study site is mainly composed of silt, with a relatively large vertical permeability coefficient (7.78 × 10⁻⁶–9.43 × 10⁻⁴ cm/s). VOCs vapor volatilized from groundwater caused an increase in air concentration. Subsequently, from 2019 to 2021, there was a significant decrease in VOCs, which could be due to the growth of vegetation roots and increase in biomass, promoting the absorption and transportation and degradation processes (Al-Nasir et al., 2022; Jiries et al., 2022; Xin et al., 2022). In addition, natural attenuation and restoration can suppress the volatile flux of VOCs in soil and groundwater (Kawabe and Komai, 2019; Mengjie et al., 2022). Furthermore, the cleanup and treatment of soil contamination at the adjacent abandoned pharmaceutical manufacturing site were successfully concluded in 2018. This endeavor had a crucial role in the notable reduction of TVOCs concentrations.
3.2 The spatiotemporal distribution characteristics of VOCs
This study used spatial interpolation and raster calculation to analyze the concentration changes and spatial distribution differences of four types of VOCs at nine monitoring points between 2016 and 2021, revealing the spatial distribution characteristics of VOCs in the air. As shown in Figure 6, the distribution of VOCs concentrations is closely related to the location of monitoring points. BTEX, oxygenated hydrocarbons, and halogenated hydrocarbons first appeared in the form of high-value “spots”, with central characteristics. As the year progresses, the concentration value decreased and the high coverage decreased significantly, showing a trend from high value “point” to low value “surface” or “block”. Alkanes began to exhibit a “spot” pattern in concentration values from 2017. In terms of the number of high-value “spots” (BTEX >750 μg/m³, oxygenated hydrocarbons >270 μg/m³, halogenated hydrocarbons >1200 μg/m³, alkanes >678 μg/m³), halogenated hydrocarbons and alkanes had more high-value “spots,” and their spatial distribution was relatively similar. The high-value “spots” for halogenated hydrocarbons and alkanes were located in the north of the contaminated site in 2017, while in 2018, they appeared in the southeastern part of the site. For BTEX, two high-value “spots” appeared in 2017, with high concentrations observed at monitoring point CK3 in the southwest direction of the site. Only one high-value “spot” for oxygenated hydrocarbons appeared in the middle of the site in 2016, which decreased to below 90 μg/m³ in 2017. From the perspective of spatial transfer changes, the spatial variation trend and distribution of halogenated hydrocarbons and alkanes were similar. The concentrations of these two types of VOCs were high in the middle of the site in 2017 and then shifted to the south in 2018, followed by a steep decline to a lower level in 2019. In 2016 and 2017, the spatial distribution patterns of BTEXs exhibited similarities, characterized by elevated concentrations in the vicinity of the site and lower concentrations within its boundaries. Conversely, for oxygenated hydrocarbons, the concentration spatial distribution displayed an inverse trend, characterized by lower concentrations in the vicinity of the site and higher concentrations within its confines. Both of them experienced a sharp decline in 2018. Although the distribution of the four types of VOCs showed different spatial distribution patterns, with some sites experiencing a significant increase or decrease in concentration levels during the three stages from 2016 to 2018, there were still some differences in their spatial changes.
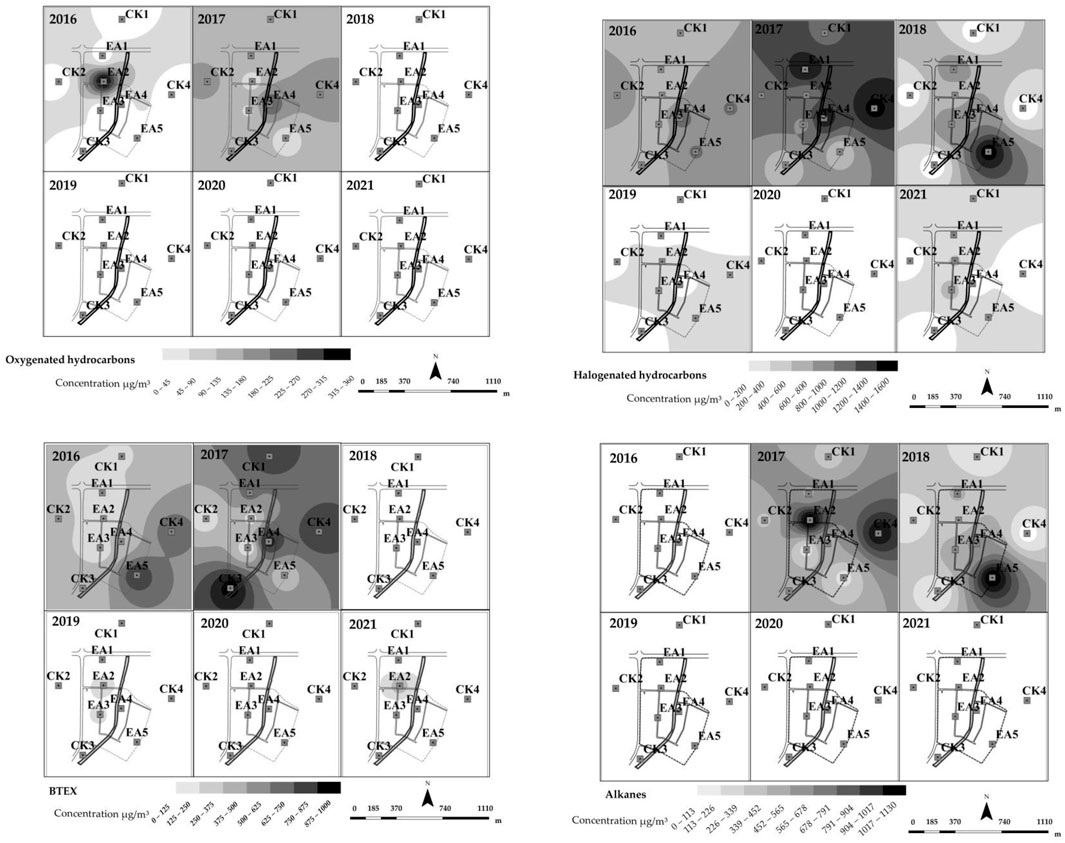
FIGURE 6. The spatial distribution of the annual average concentrations of VOCs in the study area from 2016 to 2021.
However, in the later monitoring stage (2019–2021), the concentration levels of VOCs generally decreased, and the spatial differences were not obvious. This could be related to the large-scale environmental effects of VOCs emissions under Covid-19 epidemic control measures, such as decreased crowd activity and restricted enterprise production, resulting in lower pollutant concentrations. The TVOCs concentration in Nantong City dropped by 35% in the first quarter of 2020 (Derong et al., 2022). BTEX, halogenated hydrocarbons, and alkanes, high concentrations were observed at some monitoring points near the boundary of the site and outside the site in the early monitoring stage, possibly due to their proximity to main roads and urban areas where exhaust fumes and vehicle emissions occurred. These pollutants were less influenced by the volatile flux of VOCs in soil and groundwater within the site.
3.3 PMF model source analysis
Due to the low number of VOCs detected and their stable trend at low concentrations in 2020 and 2021, source analysis had little meaning. Therefore, the years from 2016 to 2019, with higher and more variable concentrations, were chosen for source analysis using the PMF receptor model. We selected 17 representative and clearly indicative VOC components in the environmental air at monitoring points within and around the site. From the fitting results included in the model calculation, when the factor number was 3, the total concentration fitting correlation of 2016 and 2018 was good, with R2 values reaching 0.996 and 0.981, respectively. Robust Q equaled 68 and True Q equaled 71 in 2016, and Robust Q and True Q were both 44 in 2018. In addition, the proportion of residual component ratios between +3 and −3 in 2016 and 2018 was about 98%. This indicated that the results of the calculations for these 2 years could better explain the observed species in actual atmospheric conditions. The source analysis was also reliable to some extent, indicating that the data and models were well optimized. After multiple model runs, three main sources were identified.
As shown in Figure 7A, the source analysis data for 2016 indicated that Factor 1 had high concentrations and proportions of pollutants such as toluene, ethylbenzene, p/m-xylene, o-xylene, and 1,4-dichlorobenzene. BTEX are typical tracer substances for exhaust emissions from motor vehicles, solvent use, coal and biomass combustion emissions sources (Yixiang et al., 2019; Wu et al., 2020). 1,4-dichlorobenzene is a raw material and decomposition product of acidic herbicides (Dodson et al., 2007), BTEX are primarily determined by the ratio of toluene to benzene (T/B) for particular emission sources (Hsieh et al., 2006; Wenhao, 2021). The range of T/B values of the monitoring points in this factor is 3.45–9.41, which does not meet the characteristics of motor vehicle exhaust emissions and is less affected by motor vehicles. The study area is located in the center of the city with no nearby emission sources such as solvent use, coal and biomass combustion, indicating that BTEX and 1,4-dichlorobenzene were highly influenced by the volatile flux of characteristic pollutants within the site. Therefore, it can be concluded that Factor 1 is a volatile source of characteristic pollutants within the site.
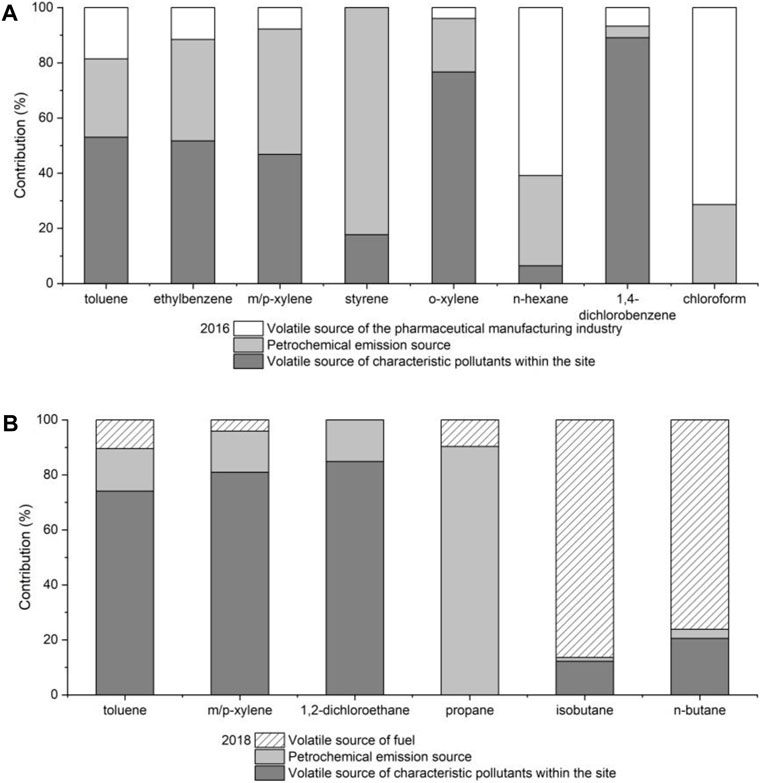
FIGURE 7. PMF model source analysis results. (A) PMF model source analysis results for 2016; (B) PMF model source analysis results for 2018.
In factor 2, the discernible contributors were identified as n-hexane and chloroform. These particular components are commonly encountered contaminants associated with emissions from the pharmaceutical manufacturing sector, wherein they find application as organic synthesis agents and extractants. Yang et al. (2018) discovered that the contribution of these two components in the VOC composition for key industries in Tianjin City was 32.45% for the pharmaceutical manufacturing industry. There is a pharmaceutical factory within a 1 km range on the southeast side of the study area, which was dismantled in 2014 and has not been developed or utilized since then. It can be assumed that no investigation, repair or risk control measures have been carried out after the dismantling of the factory, leading to the volatilization and migration of pollutants. Therefore, Factor 2 has been identified as a volatile source of the pharmaceutical manufacturing industry surrounding the site.
The only species of concern for factor 3 is styrene, which can be used to prepare resins, the main sources include petroleum combustion and petrochemical emissions (Guo et al., 2004), and Sinopec is in the southeast of the study area, which is close to the monitoring point CK3 and the contaminated site, so Factor 3 is characterized as a source of peripheral petrochemical emissions.
As shown in Figure 7B, the 2018 source analysis data showed that the species with high concentrations and proportions in Factor 1 were toluene, p-/m-xylene, and 1,2-dichloroethane (1,2-DCA). Toluene, p-/m-xylene and 1,2-DCA are characteristic pollutants in the site, and the calculated toluene and benzene (T/B) values range from 2.6 to 6.7, which does not meet the characteristics of automobile exhaust emission (Nelson and Quigley, 1984). Therefore, Factor 1 is the volatile source of characteristic pollutants within the site.
The main contributing species in Factor 2 is propane, which is the main component of liquefied petroleum gas (LPG) that is generally stored in fixed tanks (Wenhao, 2021), and the southeast side of the study area is Sinopec tank farm, so it can be considered that this factor is a source of petrochemical emissions.
The species with higher concentrations in Factor 3 are isobutane and n-butane. As China’s gasoline standards continue to improve, isobutane-butene alkylation is one of the gasoline upgrading technologies (Ke and Zezhong, 2017), and the content of normal and isomeric alkanes in MIP gasoline is relatively higher (Youhao et al., 2019). Considering that there is a gas station adjacent to the northeast side of the site, the concentration and contribution rate of isobutane and n-butane were also high. As typical tracer substances for gasoline fuel volatilization, Factor 3 can be identified as a volatile source of fuel.
During the monitoring period, this study identified three main VOCs emission sources in the study area, as shown in Figure 8. In 2016, they contributed to 45.6% of TVOCs emissions for volatile sources of characteristic pollutants within the site, 17.8% from the pharmaceutical manufacturing industry, and 36.6% from petrochemical emissions. In 2018, VOCs contribution rates were 70.6% from volatile sources of fuel, 20.8% from volatile sources of characteristic pollutants within the site, and 8.6% from petrochemical emissions. Volatile source of characteristic pollutants within the site and volatile source of fuel were the two main pathways for environmental air VOC pollution over the two-year period. As time passed, the main sources of contribution changed. The emission of pollution sources is primarily influenced by factors such as urban construction, industrial site remediation, and treatment in the vicinity of the contaminated site. These factors include the construction of new residential areas and roads near the site, the rise in vehicular traffic, and the substantial increase in gasoline consumption at gas stations. Furthermore, the soil contamination remediation carried out in 2018 at the abandoned pharmaceutical factory site has played a pivotal role in mitigating the volatilization of volatile VOCs. The TVOCs emissions for volatile sources of characteristic pollutants within the site has been diminished to 20.8%, suggesting that these pollutants no longer exert a dominant influence on the overall contribution of pollution sources to the surrounding air. This reduction can be attributed to a combination of 2 years of surface remediation and treatment, as well as natural attenuation.
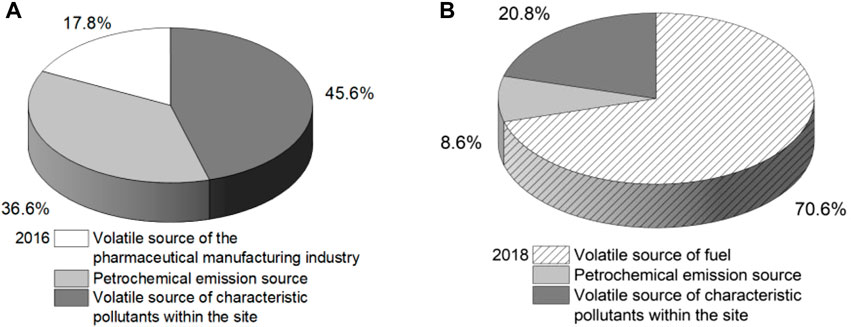
FIGURE 8. Emission source composition and contributions to VOCs. (A) Emission source composition and contributions to VOCs in 2016; (B) Emission source composition and contributions to VOCs in 2018.
4 Conclusions and recommendations
1) The average concentration proportions of the five types of VOCs during the research period were as follows: BTEX (29.73%) > alkanes (26.85%) > oxygenated hydrocarbons (21.96%) > halogenated hydrocarbons (19.12%) > sulfonate compounds (2.35%). P/m-xylene and toluene were the main contributors to BTEX and appeared frequently in the top three pollutant lists at each sampling point. They have a close relationship with the various characteristics of BTEX.
2) The spatial concentration distribution showed that EA4 had the highest VOC concentration and CK2 the lowest. The highest values appeared in 2017 or 2018 and then significantly decreased.
3) BTEX, oxygenated hydrocarbons and halogenated hydrocarbons initially appeared as high-value “spots” with central characteristics. The concentrations of VOCs and the area of high coverage both decreased over time. The spatial distribution of halogenated hydrocarbons and alkanes was similar, being high in the middle of the site in 2017, high in the south in 2018, and sharply falling to a lower level in 2019.
4) PMF model analysis showed that the main contribution sources varied over time. Under the synergistic effect of surface remediation and natural attenuation of pollutants in the site, there were mainly three types of VOCs emission sources in 2016 and 2018. Among them, the emission sources that contributed the most to TVOCs were volatile source of characteristic pollutants within the site (45.6%) and volatile source of fuel (70.6%).
In light of the air pollution characteristics of the study area and the major emission sources in different years, subsequent long-term monitoring should continue to focus on the pollution characteristics of BTEX, and additional monitoring points should be added in the vicinity of nearby pollution sources.
Data availability statement
The data analyzed in this study is subject to the following licenses/restrictions: Due to the need for confidentiality of the research data, it is not convenient to disclose it to the public. Requests to access these datasets should be directed to XwL, 1172770026@qq.com.
Author contributions
XwL: Data curation, Investigation, Writing–original draft. DD: Data curation, Investigation, Writing–original draft. WX: Investigation, Writing–original draft. XzL: Data curation, Investigation, Writing–original draft. MW: Data curation, Funding acquisition, Investigation, Writing–original draft. LK: Investigation, Writing–original draft. DJ: Data curation, Writing–original draft. SD: Supervision, Writing–review and editing. Writing–original draft.
Funding
The authors declare financial support was received for the research, authorship, and/or publication of this article. This work was supported by the Special Fund of Chinese Central Government for Basic Scientific Research Operations in Commonweal Research Institute (GYZX230305).
Acknowledgments
The authors thank the reviewers and editors.
Conflict of interest
The authors declare that the research was conducted in the absence of any commercial or financial relationships that could be construed as a potential conflict of interest.
Publisher’s note
All claims expressed in this article are solely those of the authors and do not necessarily represent those of their affiliated organizations, or those of the publisher, the editors and the reviewers. Any product that may be evaluated in this article, or claim that may be made by its manufacturer, is not guaranteed or endorsed by the publisher.
References
Al-Nasir, F., Tahani, J. H., Mutaz, M. A., Anwar, J., Osama, Y. A., Mayyas, A., et al. (2022). Accumulation, source identification, and cancer risk assessment of polycyclic aromatic hydrocarbons (PAHs) in different Jordanian vegetables. Toxic 10, 643. doi:10.3390/toxics10110643
Bari, M. A., and Kindzierski, W. B. (2018). Ambient volatile organic compounds (VOCs) in Calgary, Alberta: Sources and screening health risk assessment. Sci. Total Environ. 631, 627–640. doi:10.1016/j.scitotenv.2018.03.023
Cetin, B., Yurdakul, S., Gungormus, E., Ozturk, F., and Sofuoglu, S. C. (2018). Source apportionment and carcinogenic risk assessment of passive air sampler-derived PAHs and PCBs in a heavily industrialized region. Sci. Total Environ. 633, 30–41. doi:10.1016/j.scitotenv.2018.03.145
Chenxi, X. U., Junhui, C., Li, H., and Jiqin, W. (2019). Pollution characteristics and source apportionments of volatile organic compounds in yibin city in winter. Res. Environ. Sci. 32, 1020–1025. doi:10.13198/j.issn.1001-6929.2019.02.11
Cui, L., Wu, D., Wang, S., Xu, Q., Hu, R., and Hao, J. (2022). Measurement report: Ambient volatile organic compound (VOC) pollution in urban Beijing: characteristics, sources, and implications for pollution control. Atmos. Chem. Phys. 22, 11931–11944. doi:10.5194/acp-22-11931-2022
Dan, L., Qiang, X., Xin, Z., and Hai-lin, W. (2016). Source apportionment and health risk assessment of VOCs during the haze period in the winter in beijing. Environ. Sci. 9. doi:10.13227/j.hjkx.2016.10.003
Derong, Z., Lin, J., Lingrui, W., Jun, C., and Yuning, X. (2022). Variation characteristics and source analysis of atmospheric volatile organic-compounds in three cities of Jiangsu Province during COVID-19. Energy Environ. Prot. 36. Available at: https://xueshu.baidu.com/usercenter/paper/show?paperid=125b0810gs5m0et0cu3a0jy067060856.
Dodson, R. E., Houseman, E. A., Levy, J. I., Spengler, J. D., Shine, J. P., and Bennett, D. H. (2007). Measured and modeled personal exposures to and risks from volatile organic compounds. Environ. Sci. Technol. 41, 8498–8505. doi:10.1021/es071127s
EPA (1999). Compendium of methods for the determination of toxic organic compounds in ambient air. Center for Environmental Research Information Office of Research and Development.
EPA (2023). What is the definition of VOC? Available online: https://www.epa.gov/air-emissions-inventories/what-definition-voc.
Fending, C. (2011). Comparative study on PMF、CMB and FA modelsof sources apportionment of atmospheric particulates. Masters Type. Jilin University.
Guo, H., Ling, Z. H., Cheng, H. R., Simpson, I. J., Lyu, X. P., Wang, X., et al. (2017). Tropospheric volatile organic compounds in China. Sci. Total Environ. 574, 1021–1043. doi:10.1016/j.scitotenv.2016.09.116
Guo, H., Wang, T., and Louie, P. (2004). Source apportionment of ambient non-methane hydrocarbons in Hong Kong: Application of a principal component analysis/absolute principal component scores (PCA/APCS) receptor model. Environ. Pollut. 129, 489–498. doi:10.1016/j.envpol.2003.11.006
Honglu, M. (2021). Study on the release characteristics, dispersion pattern and health risk evaluation of VOCs during the remediation of a chemical contaminated site. Masters Type. Nanjing University of Information Science and Technology.
Hsieh, L., Yang, H., and Chen, H. (2006). Ambient BTEX and MTBE in the neighborhoods of different industrial parks in Southern Taiwan. J. Hazard Mater 128, 106–115. doi:10.1016/j.jhazmat.2005.08.001
Hu, R., Liu, G., Zhang, H., Xue, H., and Wang, X. (2018). Levels, characteristics and health risk assessment of VOCs in different functional zones of Hefei. Ecotox Environ. Safe 160, 301–307. doi:10.1016/j.ecoenv.2018.05.056
Jiries, A., Farh, A., Tahani, J. H., Mutaz, A., Fels, L. E., Amal, M., et al. (2022). Polycyclic aromatic hydrocarbons in citrus fruit irrigated with fresh water under arid conditions: Concentrations, sources, and risk assessment. Arab. J. Chem. 15, 104027. doi:10.1016/j.arabjc.2022.104027
Kawabe, Y., and Komai, T. (2019). A case study of natural attenuation of chlorinated solvents under unstable groundwater conditions in takahata, Japan. B Environ. Contam. Tox 102, 280–286. doi:10.1007/s00128-019-02546-9
Ke, Z., and Zezhong, Z. (2017). Progress in alkylation Technology and its key role in gasoline upgrading. Sino-Global Energy 22, 5.
Li, X. (2013). The concentration characteristics and source apportionment of VOCs in nanjing northern suburb. Masters Type. Nanjing University of Information Science & Technology.
Meng, G., Junlin, A., Yixian, H., and Yongyu, L. (2014). Comparison of PMF and PCA/APCS for VOCs source apportionment in north suburb of Nanjing. J. Meteorology Environ. 30, 43–50. doi:10.3969/j.issn.1673-503X.2014.01.007
Mengjie, W., Tingting, F., Xiang, W., Feiyang, X., Dengdeng, J., Lingya, K., et al. (2022). Study on natural attenuation of chlorinated aliphatic hydrocarbons in groundwater of typical pesticide contaminated sites. Acta Sci. Circumstantiae, 155–166. doi:10.13671/j.hjkxxb.2021.0505
Minna, L. (2020). Analysis on seasonal variation characteristics of atmospheric VOCs and ozone formation potential in Nantong city. Environ. Monit. Forewarning 13, 13–18. doi:10.3969/j.issn.1674-6732.2021.03.003
Minna, L., Zhen, Q., and Rong, J. (2021). Composition characteristics,concentrations and ozone generation potential changes of volatile organic compounds in Nantong during 2016–2018. Environ. Prot. Technol. 27, 27–33. doi:10.3969/j.issn.1674-0254.2021.04.005
Nelson, P. F., and Quigley, S. M. (1984). The hydrocarbon composition of exhaust emitted from gasoline fuelled vehicles. Atmos. Environ. 18, 79–87. doi:10.1016/0004-6981(84)90230-0
Paatero, P., and Tapper, U. (1993). Analysis of different modes of factor analysis as least squares fit problems. Chemom. Intell. Lab. 18, 183–194. doi:10.1016/0169-7439(93)80055-M
Peng, Z., Cunlin, X., Shi, Y., and Haiyan, Z. (2020). Spatial and temporal distribution of atmospheric pollutants and meteorological factors in the core district of Liuzhou City, a typical industrial city in Southwest China. Acta Sci. Circumstantiae 40, 13–26. doi:10.13671/j.hjkxxb.2019.0337
Ping, G., Yuewei, Y., Zengqiang, F., and Shuqian, G. (2013). Characteristics of gaseous pollutants distribution during remedial excavation at a volatile organic compound contaminated site. Environ. Sci. 34, 8. doi:10.13227/j.hjkx.2013.12.016
P. Ministry Of Ecology And Environment (2023). Ambient air—determination of 65 volatile organic compounds—collected in canisters and analyzed by gas chromatography/mass spectrometry. In HJ 759—2023.
P. Ministry Of Ecology And Environment (2017). Technical specifications on manual methods for ambient air quality monitoring. In (HJ 194–2017, replacing HJ/T 194-2005).
Rong, J., Zhen, Q., and Yuxiang, Z. (2021). Pollution characteristics and risk assessment of VOCs during an air pollution in Nantong in winter. Environ. Prot. Technol. 27, 1254–1674. doi:10.3969/j.issn.1674-0254.2021.01.007
Wenhao, F. (2021). Study on risk analysis, identification and hazard assessment of liquefied petroleum gas tank Masters Type. ANHUI JIANZHU UNIVERSITY.
Wu, K., Yang, X., Chen, D., Gu, S., Lu, Y., Jiang, Q., et al. (2020). Estimation of biogenic VOC emissions and their corresponding impact on ozone and secondary organic aerosol formation in China. Atmos. Res. 231, 104656. doi:10.1016/j.atmosres.2019.104656
Xiao, M. (2021). Source apportionment based on PMF model and pollution characteristics of atmospheric VOCs: A case study of hefei city. Masters Type. Hefei University of Technology.
Xiaofang, Y. (2019). The pollution characteristics and source apportionment of VOCs in Guangzhou city. Masters Type. JINAN UNIVERSITY.
Xin, W., Jiawen, H., Lei, S., Wenrui, L., Yanan, Z., and Ling, G. (2022). Research progress on plant-microbe remediation of soils contaminated by chemical pesticides. J. Biosaf. 31, 217–223. doi:10.3969/j.issn.2095-1787.2022.03.004
Yan, C. (2019). Comparative study of spatial interpolation method about sulfur dioxide in air pollutants in ArcGis. Shandong Chem. Ind. 48, 2.
Yan, Z., Dengdeng, J., Lingya, K., Da, D., Shaopo, D., and Feiyang, X. (2022). Research on monitored natural attenuation of BTEX in groundwater of a typical pesticide-contaminated site. Acta Sci. Circumstantiae 42. doi:10.13671/j.hjkxxb.2021.0547
Yang, Z., Liying, Y., Lina, Z., Tongmeng, W., Wenxiu, W., and Haoyun, H. (2018). Research on VOCs chemical species profile of major industries based on chemical mechanisms in Tianjin. China Environ. Sci. 38, 10.
Yixiang, Z., Shasha, Y., Minghao, Y., Ruiqin, Z., Meng, Z., ShiJie, Y, et al. (2019). Characteristics and source apportionment of ambient VOCs in spring in zhengzhou. Environ. Sci. 40, 4372–4381. doi:10.13227/j.hjkx.201902075
Yonglin, L., Mingyang, Z., Qimin, S., Buqing, Z., and Kunli, L. (2016). Temporal and spatial variations of atmospheric pollutants in Chongqing metropolitan area during autumn. Acta Sci. Circumstantiae 36, 2344–2354. doi:10.13671/j.hjkxxb.2015.0696
Youhao, X., Li, X., and Xin, W. (2019). Key technologies and development of China’s vehicle gasoline quality upgrading. Petroleum Process. Petrochem. 50.
Yunzhong, Y., Nandong, X., Ling-i, Z., Xin, C., and Fasheng, L. (2014). Distribution characteristics of HCHs and DDTs during excavation of a contaminated site. Res. Environ. Sci. 27, 642–648. doi:10.13198/j.issn.1001-6929.2014.06.12
Keywords: volatile organic compound, environmental air, contribution rates, source analysis, emission sources
Citation: Li X, Ding D, Xie W, Li X, Wang M, Kong L, Jiang D and Deng S (2023) Spatiotemporal variations and source analysis of VOCs in the environmental air of a typical pesticide remediation site. Front. Environ. Sci. 11:1272836. doi: 10.3389/fenvs.2023.1272836
Received: 04 August 2023; Accepted: 21 September 2023;
Published: 02 October 2023.
Edited by:
Naila Siddique, Pakistan Institute of Nuclear Science and Technology, PakistanReviewed by:
Xiaodong Ma, Hebei University of Technology, ChinaWei Du, Kunming University of Science and Technology, China
Copyright © 2023 Li, Ding, Xie, Li, Wang, Kong, Jiang and Deng. This is an open-access article distributed under the terms of the Creative Commons Attribution License (CC BY). The use, distribution or reproduction in other forums is permitted, provided the original author(s) and the copyright owner(s) are credited and that the original publication in this journal is cited, in accordance with accepted academic practice. No use, distribution or reproduction is permitted which does not comply with these terms.
*Correspondence: Shaopo Deng, dsp@nies.org