 Jingyi Zhang
 Kedong Yin
95% of researchers rate our articles as excellent or good
Learn more about the work of our research integrity team to safeguard the quality of each article we publish.
Find out more
ORIGINAL RESEARCH article
Front. Environ. Sci. , 16 October 2023
Sec. Environmental Policy and Governance
Volume 11 - 2023 | https://doi.org/10.3389/fenvs.2023.1252271
This article is part of the Research Topic Applied Quantitative Methods for Corporate Finance and Investments View all 5 articles
Corporate green innovation performance can serve as a critical tool for policymakers to identify the best practice and provide support to micro-entities in need. Accurate forecasting of corporate green innovation performance plays a vital role in innovation incentives by simulating the effects of regulations and strategies. Based on the data of China’s A-share listed companies during 2010–2020, this paper elaborates the gradient boosting algorithm to predict the corporate green innovation performance and compares the prediction results of the gradient boosting model with the linear model, the decision tree model, and the random forest model. Subsequently, it examines the effectiveness of the influencing factors related to the enterprise’s internal driving mechanism and external policy pressure in promoting corporate green innovation performance. It finds that: 1) The gradient boosting model outperforms other methods in its predictive effect. 2) An enterprise’s resource base is a critical factor influencing its green innovation activities, and in particular, the influence of financial indicators on corporate green innovation performance has a significant incentive effect, indicating that the impetus from enterprises’ internal driving mechanism is crucial for enterprises’ green transformation. 3) The effect of secondary indicators is heterogeneous. In the command-based environmental regulation tools, the administrative penalties can activate enterprises’ green innovation better than the approvals of Environmental Impact Assessment (EIA) documents for construction projects do; as for the incentive-based environmental regulation, investment in pollution control projects has an apparent inducing effect on the corporate green innovation performance, while the environmental tax presents an inverted U-shape, implying that overly stringent taxation crowds out the corporate green innovation performance. 4) Similarly, in the operating capacity indicators, the increasing operating income growth rate can trigger the improvement of green innovation performance; nevertheless, the total asset turnover ratio shows a suppressing effect. The key to promoting corporate green innovation performance lies in effectively regulating the enterprises’ internal driving mechanism and the rational choice of external policy tools. This study helps to prospectively identify how corporate green innovation performance changes and provides theoretical guidance and micro evidence for the policymakers on choosing environmental regulation tools and for enterprises on adjusting the resource bases.
The relationship between environmental protection and economic development has become a global concern, along with the rising global temperature and frequent extreme weather events. As the world’s second-largest economy and one of the largest carbon emitters, China is confronted with enormous environmental pressures. With the proposal of the new philosophy of innovative, coordinated, green, open, and shared development, the significance of greening and innovation has been formally established. In the meantime, the Chinese government has put forward the goals of achieving peak carbon emissions and carbon neutrality and pushed for the green transformation of economic and social development through innovation as the driving force of development, aiming at energy conservation and emission reduction and promoting high-quality economic development.
As the core carriers of social and economic wealth and simultaneously the claimants of natural resources, enterprises are the most critical factor in reconciling economic development and ecology (Li et al., 2019). Green innovation is an essential initiative for enterprises to reduce carbon emissions, decrease environmental vandalism, and establish a competitive advantage (Berrone et al., 2013). However, the measures adopted by the Chinese government to enhance environmental protection and pollution control, such as administrative means, taxation, and technological tools, have yet to induce green innovation among enterprises fully. In addition, studies on the economic impact of environmental policies are rarely conducted at the micro level, mostly based on the governmental and societal levels. However, the critical point of whether the green development concept proposed by the government can be transformed into policy dividends lies in the coping strategies of environmental pollution subjects (Zhang Q. et al., 2019). This study believes that activating corporate innovation performance relies not only on external regulation, such as technological tools, financial tools, or policy constraints and incentives but also on the driving force of the internal development demand of micro-enterprise. In fact, to substantially stimulate green innovation, we need to consider the internal driving mechanism to examine how enterprises promote green innovation activities to achieve a “win-win” situation regarding environmental protection and enterprise competitiveness.
Some scholars have systematically reviewed the factors influencing corporate green innovation capabilities (Triguero et al., 2013; Hojnik and Ruzzier, 2016), which, in summary, include both internal and external factors. Internal factors include corporate organizational structure, corporate culture, management systems, human resources, and so on. More studies have been conducted on corporate organizational structure involving corporate governance mechanisms, environmental quality management systems, and stakeholder pressure (Zhang Z. G. et al., 2019; Wang et al., 2021). Besides, Hart (1995) considered the organizational capability of enterprises as a fundamental guarantee for implementing green innovation. Recently, from the perspective of executives’ human resource characteristics, some scholars considered that executives’ green experience, academic experience, and military experience contribute to corporate green innovation (Cho et al., 2017; Liu and Wang, 2021; Lu and Jiang, 2022). External factors include policy background, market demand, financial support, and technological progress. Extensive studies have focused on the environmental regulation factor, namely command-based and incentive-based environmental regulation (Wang and Qi, 2016; Guo, 2019; Duan and Xu, 2021). Studies on the impact of influencing factors have not reached a consensus. For example, some scholars clarified that government subsidies have an enhancing effect on green innovation, while others argued that a “crowding out effect” may exist (Li and Xiao, 2020; Zhang and Zhao, 2022); Wang and Wang (2021) suggested that the effective combination of green finance and green innovation is an essential driving force to achieve green development, nevertheless, the implementation of the Green Credit Guidelines policy did not significantly improve the quality of green innovation.
Research on corporate green innovation performance prediction is still in the primary stage, with an incomplete theoretical framework and an unformed methodological system. In enterprise-level innovation prediction, Wang and Chien (2006) applied neural network models to forecast enterprises’ innovation performance. Chien et al. (2010) used an adaptive neuro-fuzzy inference system (ANFIS) based on a neural network modeling algorithm to predict innovation performance through technological information resources and innovation objectives. Ho and Tsai (2011) used structural equation modeling (SEM) and adaptive ANFIS to predict the effect of value innovation and new product development (NPD) quality on NPD performance. They believed that ANFIS models could predict better than the SEM. The accuracy of these methods outperforms traditional statistical forecasting models, portraying the non-linear characteristics of corporate innovation activities. Moreover, scholars have provided empirical evidence for this hypothesis at the regional (Hajek and Henriques, 2017) and national levels (De la Paz-Marin et al., 2012). Regarding innovation systems, Samara et al. (2012) developed an integrated system dynamics approach to analyze the impact of innovation policies on the performance of national innovation systems. Hajek et al. (2019) used a predictive model based on genetic programming variants to predict regional innovation performance, including the number of patents, technological and non-technological innovation activities, and the economic impact of innovation. Current research on innovation forecasting at the firm level is scarce. In addition, no study has yet used machine learning methods to forecast corporate green innovation performance and to examine the effects of corporate financial capability and environmental regulations on corporate green innovation performance. The main concern in measuring corporate green innovation performance lies in the complexity of corporate green innovation systems, characterized by non-linearity and high variance, and therefore, finding an accurate and reliable forecasting tool to support decision-making is a challenging task. To solve this problem, we adopt the gradient ascent model to predict the green innovation performance of Chinese enterprises. Compared with traditional statistical prediction methods and other machine learning approaches, the gradient ascent algorithm can eliminate the need for complex mathematical representations of the input-output relationship, and it is more advantageous in modeling datasets with high variance and intrinsic nonlinear characteristics.
From the perspective of financial development, the prediction of corporate green innovation performance helps to guide the flow of financial and social capital from the heavily polluting sector to the green transformation sector, which not only strengthens the efficiency of using green innovation resources but also reinforces the monitoring function of financial institutions and the community on the debtors, thus boosting their efficiency in environmental responsibility. For policymakers, the prediction helps them to pinpoint each enterprise’s green innovation capability level and to implement specific policies prospectively and pertinently. From the view of enterprise innovation, enterprises can, on the one hand, assess their innovation performance and competitive position in advance and thereby adjust their green strategy in time; on the other hand, identify the leading green innovation enterprises within and outside the industry, learn from their development experience and inspire their sense of social responsibility and motivation for green innovation. For investors, scientific forecasting can help improve corporate information transparency and anticipate corporate green development’s prospects and potential risks for better decision-making. In summary, this research focuses on building a scientific and practical prediction model of corporate green innovation performance, clarifying the effectiveness and heterogeneity of each influencing factor, and fully exploiting the synergy and complementary effects of each driving factor to enhance corporate green innovation performance.
Current research has limitations: 1. Most existing literature focuses on the relationship between a single policy shock and corporate green innovation. However, few integrate the intrinsic driving mechanism and external policy constraints into a unified research framework to compare the different induced outcomes of green innovation, and even fewer examine the implementation effects for developing countries, which may lead to bias in the study of the corporate green innovation incentives. 2. Heterogeneity characteristics may lead to differences in the sensitivity of environmental pollution subjects to specific tools under the same category of influence factors, while most studies applied a “one size fits all” type of indicator for analysis, failing to capture the effect of heterogeneous tools. 3. Most of the studies on financial performance and environmental protection have only discussed the unidirectional effect of enterprises’ environmental responsibility on financial performance, and the analysis of the financial performance factors on corporate green innovation performance is sparse, with only a tiny part of the literature (Zhang Q. et al., 2019; Sheng et al., 2019; Zhang Chi, 2020; Meng et al., 2023) discussing financial performance as a mediating variable in its effect on enterprises’ environmental responsibility. 4. Existing studies of this type are conducted through econometric models and rarely applied non-linear algorithms such as machine learning, ignoring the capture of non-linear relationships between relevant variables and green technology innovation and the excavation of the underlying mechanisms, in which case may result in biased economic consequences of environmental regulation and the exploration of driving factors of green innovation.
Using the historical data related to enterprises’ resource bases and the current environmental regulations, the models in this study accurately predict the green patents obtained by the enterprise in the current year, including green inventions independently obtained in the year, green utility models independently obtained in the year, green inventions jointly obtained in the year, and green utility models jointly obtained in the year. It clarifies the different driving effects of the influencing factors, aiming to provide a theoretical basis and empirical reference for enterprises, investors, and policymakers. The main contributions of this paper are as follows.
First, it provides new evidence for the debate on whether each influencing factor crowds out or triggers corporate green innovation capability. It suggests how to motivate enterprises to change their green development mindset and actively carry out green innovation activities. From the perspective of the heterogeneity of the enterprises’ internal driving mechanism and external environmental regulation tools, this paper finds that what plays an inducing role in the inspiration of corporate green innovation performance is the superior profitability and solvency, the growth rate of operating income, administrative penalties, and investment in pollution control projects, rather than the high total asset turnover rate, the approvals of EIA documents for construction projects and the overly stringent environmental protection tax.
Second, it breaks the current microscopic research based on a single environmental regulation policy shock and improves the influencing factors research of corporate green innovation performance based on the internal driving mechanism and external environmental regulations. It provides theoretical guidance for the current environmental regulation policy decision and the coping strategy of enterprises. This paper suggests that the government should accurately position enterprises, make full use of the “push-back” effect of administrative penalties, and strengthen the enforcement of command-based regulations; meanwhile, the government should strengthen incentives and support for enterprises’ green innovation activities by increasing investment in environmental governance. Enterprises should fully utilize their resources and actively take responsibility for environmental protection to achieve the “double dividend” of enterprise competitiveness and environmental protection.
Third, expanding the previous research methods, this study applies the machine learning algorithm to construct an effective prediction model, providing a more practical research method for predicting green innovation performance. Subsequently, based on the gradient ascent algorithm, the non-linear relationships between the influencing factors and the corporate green innovation performance are explored through relative importance analysis and partial dependence function, deconstructing the black box of green innovation incentive research and expanding the thinking and method of green innovation research in China.
This study is structured as follows. In the introduction, we review the relevant literature and list the main contributions of this study. In Section 2, we elaborate on the theoretical foundations and formulate the research hypotheses. Section 3 presents the research design. Section 4 discusses the empirical results and analyses. We empirically predict corporate green innovation performance and analyze the effect of corporate financial capability and environmental regulations on promoting corporate green innovation performance and heterogeneity. Section 5 summarizes the research conclusions and the implications for effectively incentivizing corporate green innovation.
Corporate financial capability refers to the ability of an enterprise to have controllable financial resources (Zhang, 2003). Based on the narrow definition, corporate financial capability refers to the ability of corporate financial performance (Beaver, 1996; Liu, 2016), including an enterprise’s profitability, solvency, development capability, and operating capacity. According to the research purpose, enterprise financial capability in this study refers to enterprise financial capability in the narrow sense.
Based on the theory of redundant resources, whether an enterprise engages in social responsibility, including environmental protection, depends mainly on its ability to deploy sufficient redundant resources (Preston and Obannon, 1997; Campbell, 2007). The corporate financial capacity directly determines the number of redundant resources available to the enterprise to meet its social responsibilities, such as environmental protection responsibilities. (Waddock and Graves, 1997), and affects the effectiveness of enterprises’ implementation of various environmental protection measures. In other words, corporate financial capability is the economic condition for enterprises to take environmental responsibility. Enterprises are more likely to engage in social responsibility by using their resources only when their development needs are met (Preston and Obannon, 1997). Under the financial constraint, investment in environmental governance is bound to have a crowding-out effect on productive investment in the short run (Wang and Wang, 2021), while enterprises with financial advantages will have more flexibility to invest in CSR-related activities and thus better take environmental responsibility (Cheng et al., 2014; Zhang, 2020). Hasan and Habib (2015) believed that in the long run, organizations with better financial capability have more redundant resources and are better able to absorb CSR-related investments and make cost adjustments, thus facilitating the assumption of social responsibility. The green innovation project is characterized by long cycles, significant investments, high risks, and considerable uncertainties regarding the transformation of innovation results and the generation of economic benefits. Therefore, the enthusiasm of enterprises to make green investments is vulnerable to their inherent resources. The willingness of enterprises with a weak resource base to engage in innovation activities is low (Li and Xiao, 2020). In summary, corporate financial performance can impact corporate green innovation performance.
(1) Profitability. Lu et al. (2014) pointed out that the business capacity of enterprises has a positive impact on the assumption of corporate social responsibility, including environmental responsibility. Strong and sustainable profitability can bring a steady flow of material resources to enterprises, and based on meeting their development needs, they can also have sufficient redundant resources for environmental responsibility.
H1-1: The profitability of enterprises positively affects corporate green innovation performance.
(2) Solvency. Enterprises with more robust solvency usually have more liquid assets and cash flow, more stable market shares, and a more vital ability to withstand risks (Hao, 2019). Enterprises with more robust solvency are more willing to assume social and environmental responsibilities (Ross, 1977). Due to the long payback period of environmental protection investment, as well as the high cost and investment risk, robust solvency can reduce the enterprise’s debt repayment pressure and the possibility of re-financing, with a solid ability to withstand risks, which helps to alleviate the risk-taking of environmental protection investors, so that the enterprise is more willing to participate in environmental protection, thus enhancing the corporate green innovation performance.
H1-2: The solvency of enterprises positively affects corporate green innovation performance.
(3) Operating capacity. A more robust operating capacity means enterprises have more resources to deploy and allocate to fulfill environmental protection responsibilities. On the one hand, enterprises with more substantial operating capacities can fully use existing resources and transform them into available resources and cash flow faster (Hao, 2019). On the other hand, a more robust operating capacity can ensure the reasonable allocation of environmental protection and green innovation resources.
H1-3: The enterprise’s operating capacity positively affects corporate green innovation performance.
(4) Development capacity. Compared with enterprises in the rapid growth stage, enterprises in the mature stage have a larger scale and higher profit margins and accumulate more redundant resources (Hasan et al., 2015). On the other hand, early-stage enterprises mainly use resources for production and sales, which will inevitably squeeze out a particular share of environmental protection investment. In addition, fast-growing enterprises tend to reduce their financial resources and willingness to invest in environmental protection due to their products or services’ good market prospects and rapidly increasing market competitiveness.
H1-4:The enterprise’s development capacity has a negative effect on the corporate green innovation performance.
Command-based environmental regulation, characterized by solid deterrence and distinct signaling effects, refers to the government’s setting of environmental protection standards and objectives through enacting laws or administrative rules and regulations. Incentive-based environmental regulation refers to the government’s efforts to guide enterprises on green transformation through subsidies or financial, tax, and fee, forming a long-term mechanism of environmental protection incentives and constraints. The above two regulatory tools deliver policy orientation signals of different intensities to enterprises, affecting their perceptions of environmental pressures with different expected effects, thus influencing their green innovation decisions.
(1) Incentive-based environmental regulation and corporate green innovation performance.
Based on organizational legitimacy and resource base, compliance with environmental regulations is the foundation of enterprises, and scarce innovation resources and government policy support tend to flow to enterprises with a solid sense of social responsibility and active response to policy guidance (Li et al., 2018; Deng et al., 2021). The resource effect theory clarifies that the heterogeneity of scarce innovation resources and government support policies enterprises possess creates differences in their green innovation capabilities. It has been illustrated that policy support such as government subsidies provides a resource base for corporate green innovation, alleviates the financing dilemma of corporate green innovation, and reduces the cost of corporate green transformation (Montmarin and Herrera, 2015). Resource constraints and insufficient incentives limit corporate green innovation (Manso, 2011). Incentive-based environmental regulatory tools, such as investment in pollution control projects, can effectively help to overcome these difficulties and promote corporate investment in green innovation.
However, the neoclassical school argues that environmental regulations, such as pollution charges fees (environmental taxes since the year 2018), increase compliance costs and exacerbate the financial constraints of enterprises, crowding out green innovation resources (Petroni et al., 2019). Whereas green innovation requires long-term and substantial resource investments, decision-makers will reduce their green innovation investments due to enterprises’ short-term business performance and cash flow pressure.
(2) Command-based environmental regulation and corporate green innovation performance
According to Porter’s hypothesis, appropriate environmental regulation has a push effect on corporate green innovation (Porter and Van der Linde, 1995). Confronting rigid command-based environmental regulation, firms tend to create more green innovations, thereby reducing environmental pollution, enhancing green competitiveness, and effectively circumventing environmental regulatory costs (Berrone et al., 2013).
However, suppose the cost of complying with government regulation is much lower than that of green innovation. In that case, enterprises may make environmental investments to meet government requirements rather than committing to green innovation. Namely, since the green innovation investment has a more extended payback period and more uncertainty, the incentive for enterprises to engage in green innovation will be suppressed if they can meet the government regulatory standards through environmental investment or direct environmental restoration (Li et al., 2019). For example, enterprises can obtain environmental impact assessment (EIA) document approvals for construction projects through other means, thus avoiding the pressure and cost of green innovation, which may crowd out some resources and incentives to engage in green innovation.
H2: Environmental regulation tools have heterogeneous effects on corporate green innovation performance.
Drawing on the study of Qi et al. (2018), we manually searched the patents according to the IPC classification number based on the “Green List of International Patent Classification” published by the World Intellectual Property Organization (WIPO) in 2010, obtaining the statistics of green inventions independently acquired in the current year, green utility models independently acquired in the current year, green inventions jointly acquired in the current year, and green utility models jointly acquired in the current year. The sum of the above four indicators, minus the fixed effects, is the green patents indicator to measure the corporate green innovation performance.
Based on the studies of scholars such as Fan and Lang (2007) and Zhang (2020) and referring to the provisions of the “Enterprise Economic Efficiency Evaluation Index System (Implementation)” and the “Rules for Evaluating the Performance of State-owned Capital Funds”, we categorize the enterprise financial data into two categories: financial indicators and operating capacity and select ten representative secondary indicators to characterize. Financial indicators include total assets, net fixed assets, total liabilities, paid-in capital or equity, total profit, and net profit, reflecting the enterprise’s financial status and operating benefit and are used to assess the enterprise’s profitability, solvency, and financial soundness. Operating capacity includes net cash flow from operating activities, the total annual market value of individual shares, the total asset turnover ratio, and the operating income growth rate, reflecting the enterprise’s operating capacity and development potential. These indicators are used to assess operating efficiency and growth.
The environmental regulation policy is not only an arrangement for the government to restrict and regulate the behavior of enterprises but also a vital factor affecting corporate green innovation. Based on Bo et al.’s (2018) and Tan and Xu’s (2022) studies, we classify environmental regulation tools into command-based and incentive-based environmental regulation. Second, considering data availability and representativeness, we divided the primary indicators into heterogeneous secondary variables. Command-based environmental regulation includes the number of penalty decisions, the number of EIA document approvals for construction projects in the year, the number of the National People’s Congress (NPC) proposals, and the number of Chinese People’s Political Consultative Conference (CPPCC) proposals, reflecting the government’s mandatory supervision and punishment measures. Incentive-based environmental regulation includes the investment in pollution control projects completed this year (Renminbi (RMB) million), the investment in industrial pollution control (RMB million), and pollution charges fees (environmental taxes since the year 2018), reflecting the support and incentives provided by environmental protection departments to enterprises. Subsequently, we concretely constructed heterogeneous environmental regulation research variables in the framework of command-based and incentive-based regulation tools with reference to the generally applicable composite index method. Secondary indicators with unit differences were standardized to obtain dimensionless variables.
Considering that the green development of enterprises is significantly influenced by market competition, business conditions, environmental strategies, technology base, and policy background, we include industry attributes in the category of influencing factors. One-hot coding is a standard method for converting categorical variables into a binary vector representation. Specifically, for a categorical variable with n different values, One-hot coding creates a binary vector of length n. In this vector, only the positions corresponding to the values are 1, and all other positions are 0. In the data processing of this study, the machine learning algorithms and statistical models we apply cannot deal directly with the categorical variables (nominal variables) but require the inputs to be numerical data. Therefore, to transform the text data of industry codes into numerical data, we convert the categorical variables into binary vector representations using One-hot coding to facilitate algorithm processing and analysis.
The explanatory variables are listed in Table 1.

TABLE 1. Explanatory variables.
This paper selects all A-share listed companies in China during 2010–2020 (the data after 2020 has yet to be published by China Environmental Yearbook) as the research object, and the sample contains 25,579 data. The data sources are as follows: (1) Financial capacity data were obtained from the China Stock Market and Accounting Research Database (CSMAR), with reference to the provisions of the “Enterprise Economic Efficiency Evaluation Index System (Implementation)” and the “Rules for Evaluating the Performance of State-owned Capital Funds”. (2) The environmental regulation indicators are derived from China Statistical Yearbook, China Environmental Yearbook, China Environmental Statistical Yearbook, and China Taxation Yearbook and compiled by manual calculation. As the measure of corporate green innovation performance, data on corporate green patents, including green inventions independently obtained in the year, green utility models independently obtained in the year, green inventions jointly obtained in the year, and green utility models jointly obtained in the year, are obtained from the Chinese Research Data Service (CNRDS) database. The classification follows the standard of the World Intellectual Property Office, which classifies according to the patent classification number. The remaining indicators are obtained from the China Stock Market and Accounting Research (CSMAE) database. The above raw data were screened as follows: (1) The samples of listed companies in the ST, PT, and financial categories were excluded; (2) The sample data of the Tibetan region were excluded due to the deficiency of fundamental indicators of environmental regulation; (3) Dealing with outliers. Outliers may harm the modeling. We use the deletion of extreme values of 1% and consider the fixed effects of individual enterprises to avoid the influence of outliers on the model; (4) Scaling of features. The independent variables in this paper have different characteristics, and their values have different ranges of variation, so they must be processed in a certain way. We use normalization to process the ranges of variation and distributions of the different characteristics to ensure that the variables have the same scaling.
Tables 2–4 show the descriptive statistics of financial data, environmental regulation data, and the number of corporate green patents by industry.
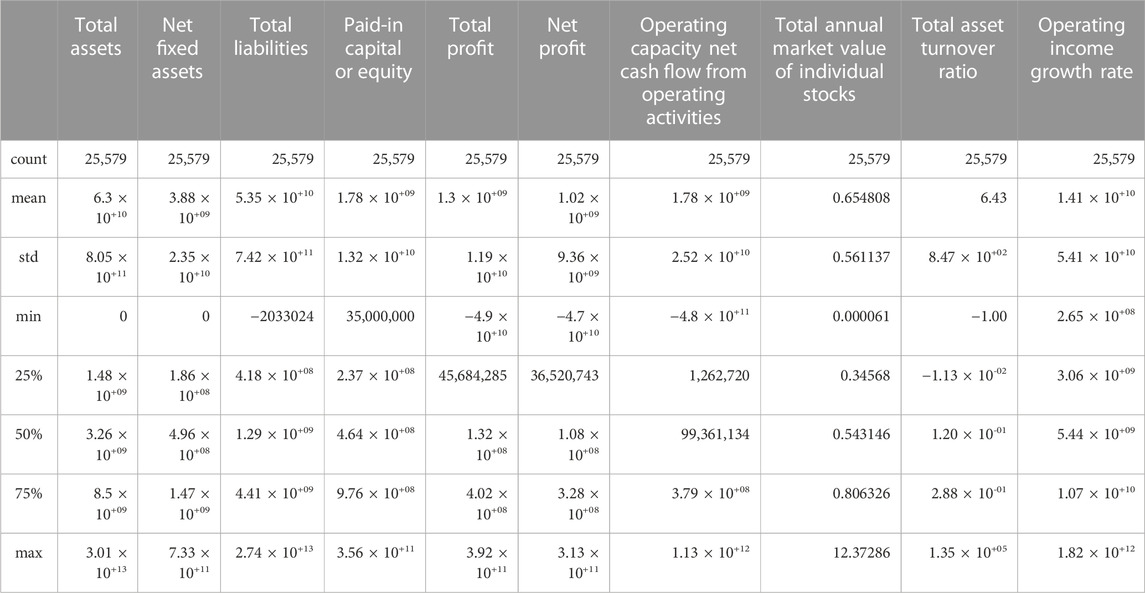
TABLE 2. Descriptive statistics of financial data of listed companies.
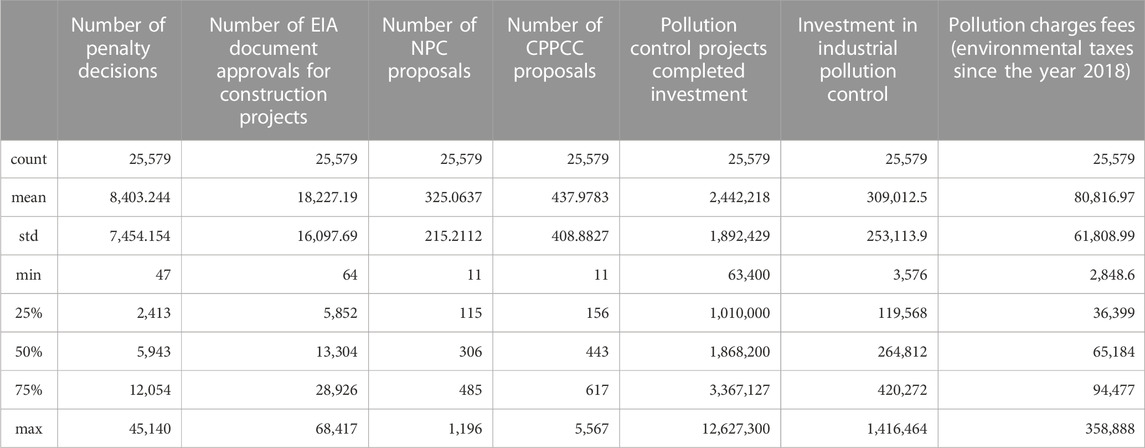
TABLE 3. Descriptive statistics of environmental regulations of listed companies.
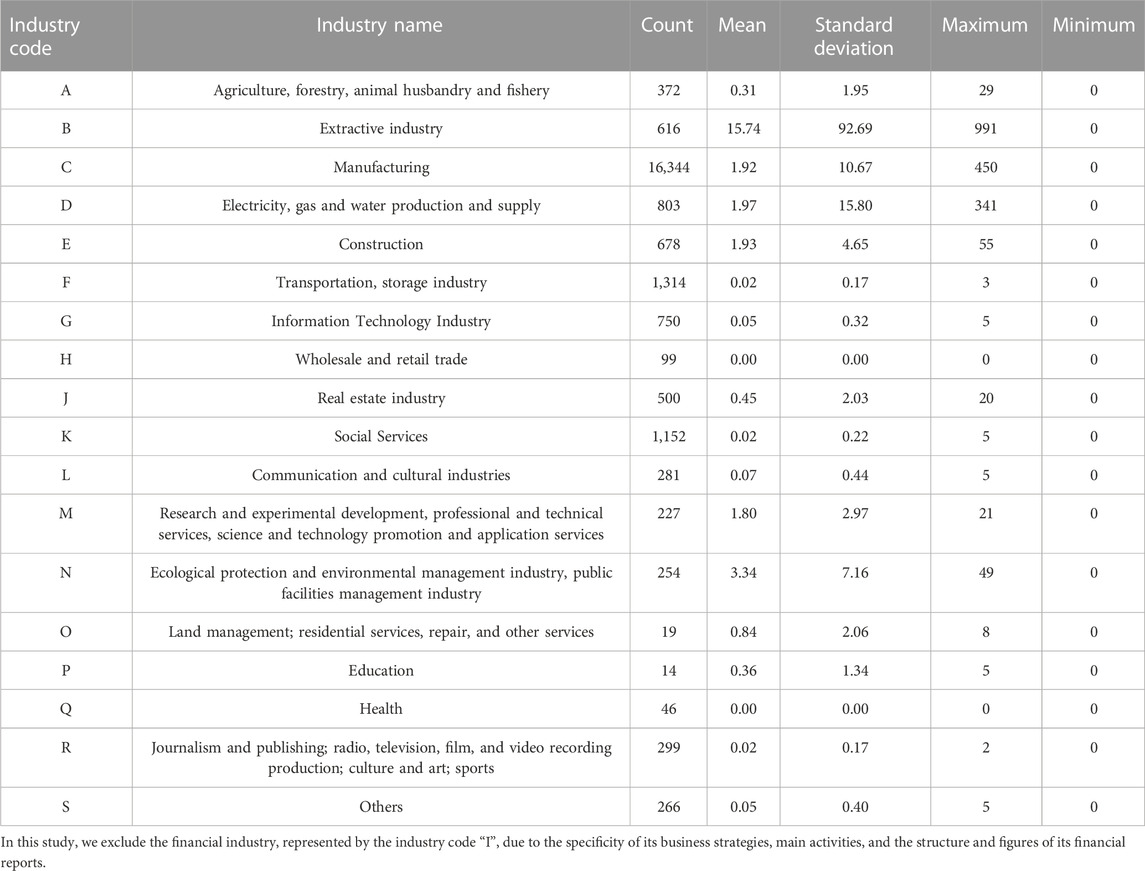
TABLE 4. The number of green patents obtained by listed companies by industries.
From Table 4, the mean value of green patents is 1.85, the minimum is 0, and the maximum is 991, manifesting that the overall corporate green innovation performance is deficient and highly differentiated. The first quartile (Q1), the median (Q2), and the third quartile (Q3) are all 0, indicating that the dataset is unbalanced. The number of green patents in the ecological protection and environmental management industry and public facilities management industry is relatively evenly distributed, with the highest average of 3.34. The green innovation ability of the secondary industry, comprised of the extractive, manufacturing, energy, and construction industries, is remarkable, and the number of green patents obtained by a single firm in the extractive industry has reached as high as 991. The reason is that resource-intensive industries, confronted with burdensome social responsibilities and environmental pressures, have a greater sense of responsibility, technical support, and preferential policies for green transformation and industrial restructuring. Nevertheless, the development of green innovation performance in this industry is also uneven, as there are still enterprises with no patents obtained. The number of green patents in tertiary industries, such as the information technology industry, cultural communication, and social service industry, is relatively scarce, indicating that measures should be taken to optimize the industrial structure, provide green financial support, incubate green projects, improve the technical capacity of enterprises, and introduce high-precision enterprises into the tertiary industry to push forward the green transformation.
Due to the apparent long-tailed distribution of the target variable in the data set, we use the category quantile loss function to balance the weights of different categories in the data set to effectively alleviate the sample imbalance problem and improve the prediction performance for minority categories. The loss function is defined as:
Based on the data distribution, this paper shows that the top 20% with less green innovation performance possesses 80% of the total sample, hence the q value is 0.2.
A linear regression model predicts and explains by establishing a linear relationship between the independent variable (or explanatory variable) and the dependent variable. This model assumes a linear relationship between the independent and dependent variables, and the parameters are estimated using known sample data. The linear regression model can be used to predict new unknown sample data by obtaining the parameter values. The primary purpose of using the linear model in this paper is to help determine if there is a non-linear relationship between the independent and dependent variables by comparing the predicted results of the linear and non-linear models.
Where Y denotes the dependent variable,
In the decision tree to deal with the process of regression problems, its node splitting criterion and the generation of child nodes are similar, but the prediction of the leaf nodes is based on the sample point in the node on the average or other statistics to determine, rather than through the “voting method” decision.
Constructing a decision tree consists mainly of feature selection and the determination of splitting criteria. The decision tree can effectively divide the data set into different predictions by selecting the best feature attributes and appropriate splitting criteria. The decision tree structure consists of root nodes, internal nodes, and leaf nodes, where the root nodes contain the complete set of samples, the internal nodes represent the decision conditions, and the leaf nodes represent the final prediction results (Breiman et al., 1984).
Assuming that the input space is divided into
where
The nodes’ splitting criterion is to find the optimal cut-off point by minimizing the squared error.
The optimal cut nodes are then found by minimizing the squared error:
where
The Random Forest model is based on the idea of bagging, where multiple weak learners are trained by randomly dividing the subsamples and eventually integrated into one strong learner. Specifically, first, a certain number of samples are randomly selected from the training set to form a new training set, and different decision trees are built in parallel by randomly selecting feature subsets. Afterward, the above process is repeated with the same number of samples and features to create multiple decision trees, forming a random forest. Finally, their results are averaged or voted to conduct classification or regression prediction (Chen, 2021). Due to the high degree of randomness in the sub-sample extraction and feature space selection, the random forest better compensates for the deficiency of the inferior generalization ability of a single decision tree and, to some extent, solves the overfitting problem of the decision tree.
The functional equation of a random forest can be described as:
Where
Based on the idea of boosting, the gradient boosting tree is an iterative integration algorithm consisting of multiple decision trees constructed from the original training set. The model works through numerous iterations, each of which produces a result in a decision tree, and each tree is trained on the residuals of the previous tree so that the new residuals are reduced in the gradient direction, making the predictions closer to the actual values (Jerome, 2001). In other words, the model achieves better prediction performance by iteratively creating weak learners (usually decision trees), training on the residuals of the previous one each time, and finally combining all the weak learners into one strong regressor.
Assume that the gradient boosting model attempts to estimate the objective function
where
Then, the initial function is defined as:
where
Refer to the idea of quantile loss functions to mitigate sample imbalance. The loss function is defined as:
Based on the data distribution, this paper shows that the top 20% with less green innovation performance possesses 80% of the total sample, hence the q value of 0.2.
Then, the negative gradient
After deriving the negative gradient of the loss function, the model is refitted with a new regression tree
Finally, the newly generated regression tree is introduced into the objective function as follows:
where
Drawing on Friedman’s (2001) study, we further construct partial dependence graphs based on the gradient boosting model to characterize the marginal effects of certain input variables, including corporate financial capability, environmental regulation, and industry attributes, on the output variables, namely corporate green innovation performance, in the gradient boosting model. Specifically, suppose that we predict the corporate green innovation performance based on the information set
In decision-tree-based estimation algorithms such as random forest and gradient boosting models, for different values of variable
We use MAE, MSE, RMSE, and R-squared metrics to measure the accuracy and reliability of the prediction results. MAE (Mean Absolute Error) is the average of the absolute values of the differences between the predicted and actual values. It measures the average error size of the model, and a smaller MAE indicates that the model’s prediction result is more accurate.
where
MSE (Mean Squared Error) is the average of the squares of the differences between the predicted and actual values. It also measures the magnitude of the model error but is more concerned with the effect of significant errors than the MAE. Therefore, the MSE is more sensitive than the MAE, and a smaller MSE indicates a more accurate prediction result from the model.
RMSE (Root Mean Squared Error) is the square root of the MSE. It retains the magnitude of the error and has the same units as the target variable, making it easier to understand. A smaller RMSE indicates a more accurate prediction by the model.
R-squared is used to measure the ability of a model to explain the variation in the data. Its value ranges from 0 to 1, and the closer it is to 1, the better the model fits the data. R-squared can help us determine whether the model is over- or under-fitted, as well as the reliability and stability of the model.
We conduct repeated experiments within the range of specific parameter values and compare experimental results to select the optimal results to obtain the model’s parameter values. The adjusted model parameters mainly include the following:
(1) Learning rate: The learning rate controls how much each weak learner (base learner) contributes to the overall model. A lower learning rate makes the model more stable but may require more weak learners to perform better. Typically, the learning rate takes values between 0 and 1. For example, in a gradient boosting model, a new regression tree
is introduced into the objective function as follows:
where
(2) The number of weak learners (n_estimators): The number of weak learners is an essential parameter in the gradient boosting model, which controls the number of decision trees, namely, the complexity of the model, and affects the training time of the model. Increasing the number of weak learners can make the model more complex and better fit the training data. Weak learners can provide more decision bounds or function approximation capabilities, improving the model’s predictive performance. By iteratively adding more weak learners, the gradient boosting model can continuously improve and further reduce the training error. However, increasing the number of weak learners may also lead to overfitting problems and, thus, poor performance on new data. Therefore, a trade-off between model complexity and generalization performance is needed when choosing the number of weak learners.
(3) Maximum depth of trees (max_depth): The maximum depth of trees is another important parameter in the gradient boosting model, which controls the decision tree’s growth depth and significantly impacts the model’s complexity and generalization ability. A more considerable maximum depth of trees allows the decision tree algorithm to have more complex feature relationships, which can improve the model’s ability to fit the training data. However, too large a maximum depth of trees can make the model too sensitive to noise and random variation, reducing the model’s generalization ability.
Parameter selection is crucial. Taking the random forest and gradient boosting model as examples, we exhaustively search all possible parameter combinations within a given range and use cross-validation to evaluate the model’s performance to select the best parameter combination that performs well on the test set. These parameters include the “number of decision trees” and the “maximum depth of decision trees”, ranging from 1 to 100. By analyzing the experimental results, we find that different numbers of decision trees and maximum depths significantly affect the model’s performance. The results of the experimental images indicate that the performance of the gradient boosting model is optimal and stable when the number of decision trees and the maximum depth of decision trees reach about 20 (as shown in Figures 1C, D). In the random forest model, the number of decision trees and the maximum depth of the decision trees reach approximately 30 before reaching the optimal performance and starting to stabilize (Figures 1A, B).
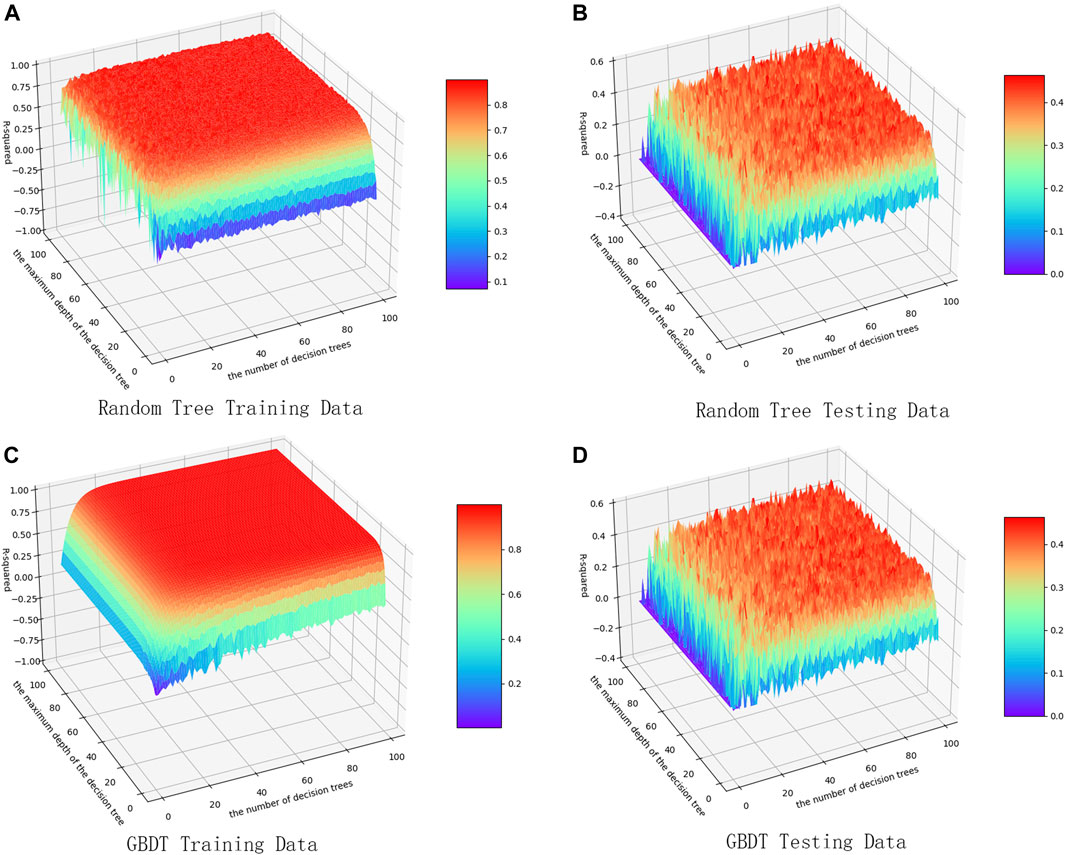
FIGURE 1. The number and the maximum depth of the decision trees in the random forest and gradient boosting models. (A) Random tree training data. (B) Random tree testing data. (C) Gradient boosting decision tree training data. (D) Gradient boosting decision tree testing data.
In this study, multiple linear regression, decision tree, random forest, and gradient boosting models are used to predict the changes in corporate green innovation performance, and the prediction results are compared. Figures 2A–H shows the fitting effectiveness of the actual and predicted corporate green innovation performance values under four modeling algorithms. Compared with the previous three methods, the gradient ascent algorithm further improves the prediction accuracy of enterprise green innovation performance, and the trend of the predicted value coincides with that of the actual value. Table 5 lists the relevant evaluation indexes of each prediction model’s fitting effectiveness to the test set, including the R-squared and three error evaluation indexes of MAE, MSE, and RMSE. The smaller the value of the error evaluation indexes, the closer the R-squared is to 1, indicating that the smaller the deviation of the predicted value of the model from the actual value, the higher the accuracy of the prediction model. The comparison of the evaluation indexes of the fitting effect reveals that the values of all the error evaluation indexes of the gradient ascent model are significantly lower than those of the previous three models, and the R-squared value is closer to 1. Taking the MSE (Mean Squared Error) as an example, the value of the index of the test set of the gradient ascent model is 10.51, which is much lower than that of the multivariate linear regression (48.28), decision tree (59.67) and random forest (12.13).
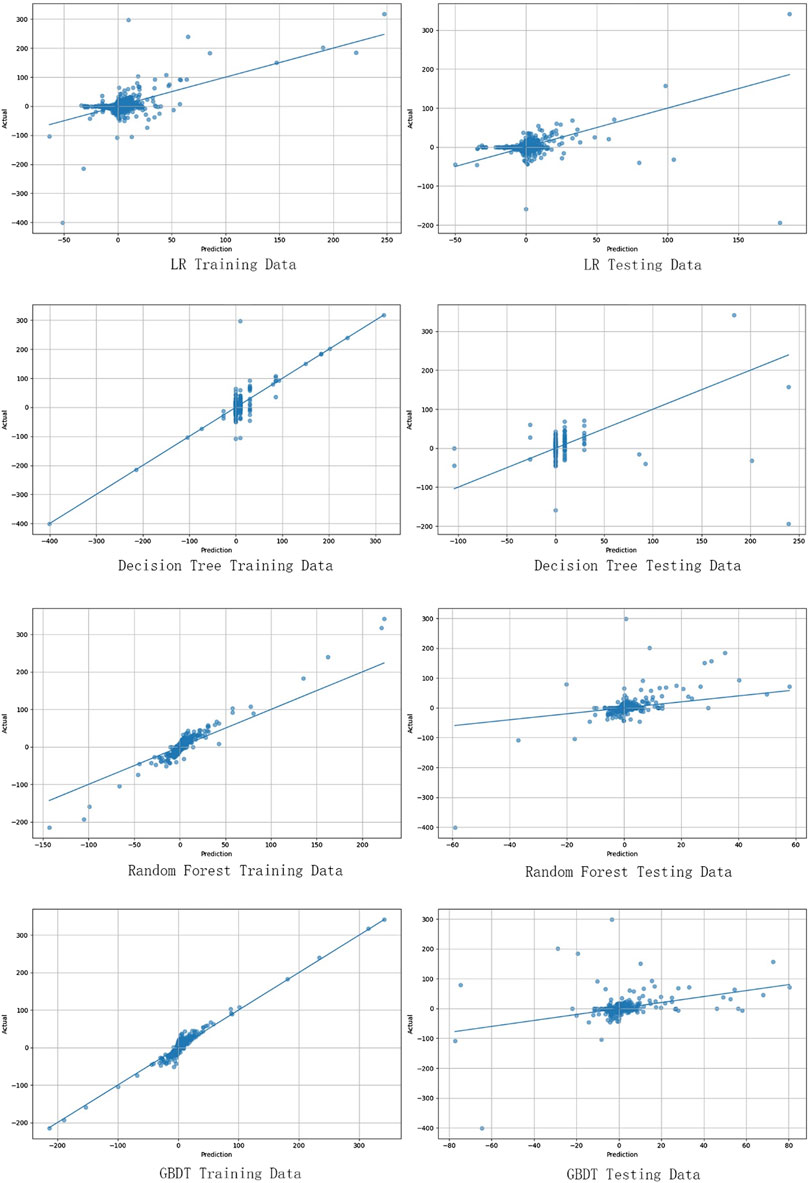
FIGURE 2. The fitting effectiveness of the actual and predicted corporate green innovation performance values under four modeling algorithms. (A) Linear regression training data. (B) Linear regression testing data. (C) Decision tree training data. (D) Decision tree testing data. (E) Random forest training data. (F) Random forest testing data. (G) Gradient boosting decision tree training data. (H) Gradient boosting decision tree testing data.

TABLE 5. Evaluation metrics of the models.
As shown in Figures 2C–F, the prediction performance of the random forest algorithm is superior to that of the decision tree algorithm. A decision tree divides and predicts the data by constructing a tree structure as a primary classification and regression method. However, the decision tree model tends to focus excessively on noise and outliers in the training data, resulting in deficiencies in model generalization and, thus, inevitable overfitting problems. Random forest, as an integrated learning method, randomly selects a portion of features and samples for training when constructing each decision tree, thus avoiding overfitting and improving the accuracy and stability of the model. Therefore, compared to the individual decision tree, the random forest model has better generalization performance and stability to deal with complex classification and regression problems (Hastie et al., 2009; Kotsiantis, 2013).
The gradient boosting algorithm outperforms the former three algorithms. The reasons for this can be categorized into two aspects: 1. In statistical data applications, random forests are usually over-fitted for noisy data in classification or regression studies. The method may result in multiple similar decision trees for data sets with different characteristics, which may bias the research results. The gradient ascent model, based on gradient optimization, has high prediction accuracy and strong generalization ability, which can better adapt to the characteristics of the data and flexibly deal with both continuous and discrete data, especially when dealing with data sets with non-linear relationships. In addition, the gradient ascent model is more suitable for solving the non-linear regression problem, while the random forest is more suitable for solving the classification problem (Chen, 2021). 2. Unlike random forests, which generate decision trees in parallel, the gradient boosting model is an iterative integration algorithm where each tree is formed sequentially and trained on the residuals of the previous tree. In addition, while random forests take an undifferentiated approach to the training set, the gradient boosting model assigns weights to different decision trees according to their importance (Jerome, 2001). This iterative approach makes gradient-boosting trees usually outperform random forests regarding predictive performance.
The relative importance analysis of the predictor variables (Table 6) indicates that the relative importance of financial indicators, operational capacity, command-based environmental regulation, incentive-based environmental regulation, and industry attributes is 40.76%, 24.61%, 14.69%, 12.72%, 7.23%, respectively. Specifically, operating income growth rate, paid-in capital or equity, total profit, industry attributes, and completed investment in pollution control projects in the current year occupy the top five positions. Overall, first, the relative importance of financial indicators and operational capacity for corporate green innovation performance is remarkable. Second, the relative importance of command-based environmental regulation on corporate green innovation performance is more pronounced than that of incentive-based environmental regulation. Third, there is heterogeneity in the impact of the secondary indicators of each influencing factor. Fourth, there is industry heterogeneity in corporate green innovation performance.
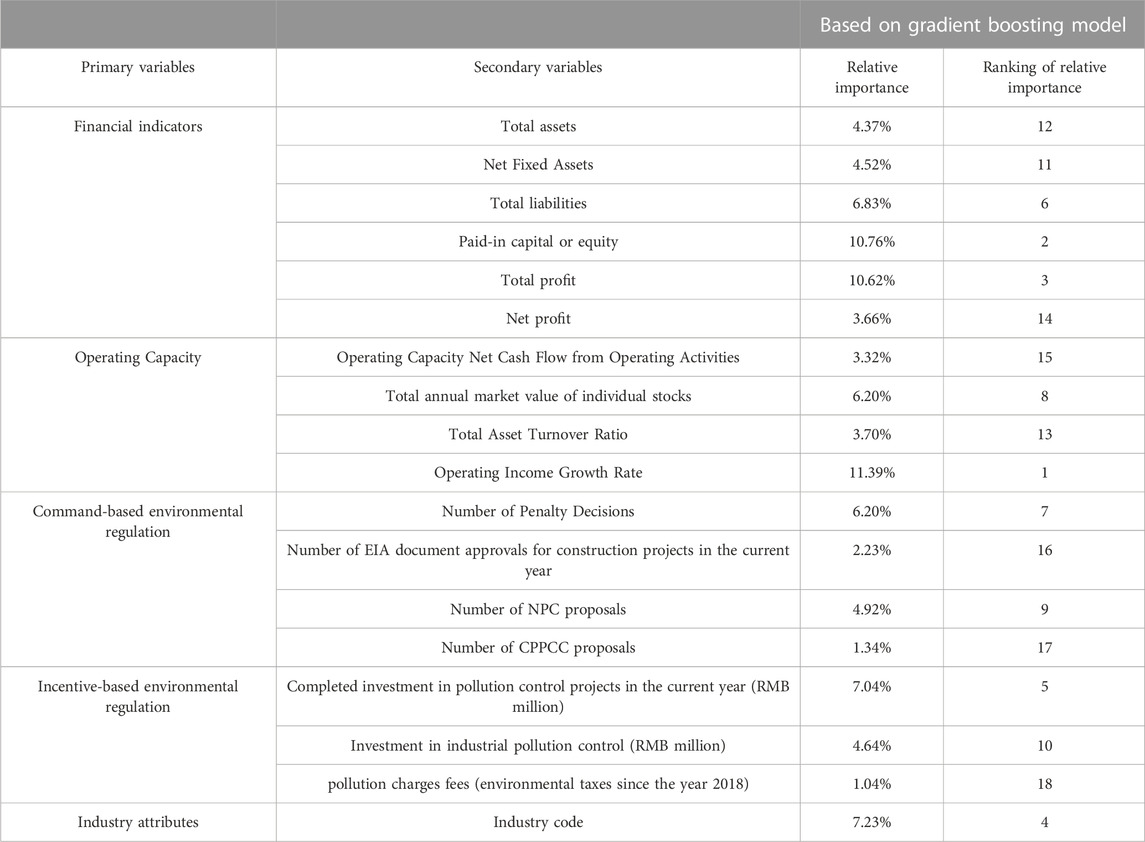
TABLE 6. Relative importance analysis of the predictor variables.
Based on the gradient boosting prediction model, we derive the partial dependency diagrams (Figure 3), which reflect the non-linear relationship between each influencing factor and corporate green innovation performance.
(1) corporate green innovation performance is enhanced with the rise of enterprises’ financial indicator variables, whose secondary indicators, especially paid-in capital or equity and total profit, are at the top of the relative importance ranking. On the one hand, sound and sustainable profitability is the material basis and fundamental guarantee for enterprises to increase capital accumulation, expand cash flow, and increase enterprise value. Companies with higher profits tend to have more financial reserves that can be converted into high-quality innovation resources and can better invest human, material, and financial resources. On the other hand, solvency adequacy helps companies alleviate the pressure of debt repayment and refinancing caused by environmental investments. As environmental investments are enormous and have a long payback period, companies with adequate solvency are more resilient to risk and uncertainty and, therefore, more willing to fulfill their social responsibilities. In addition, according to the financial accelerator theory, companies with solid balance sheets can avoid financing constraints, expand financing channels, and thus obtain more financial support to promote green innovation.
(2) The impact of operating capacity indicators on corporate green innovation performance is heterogeneous, among which the positive driving effect of the operating income growth rate is the most prominent, and this indicator also ranks first in the relative importance ranking. First, enterprises with solid operating capacities usually perform well in coordination and optimization, thus ensuring the rational allocation and effective use of green innovation resources. Second, higher cash flow means more realizable assets and redundant resources to invest in environmental protection. Third, a high operating income growth rate means good business prospects, which raises market expectations and attracts high-quality green innovation resources, such as capital, talent, technology, and policy preference, for green innovation R&D.
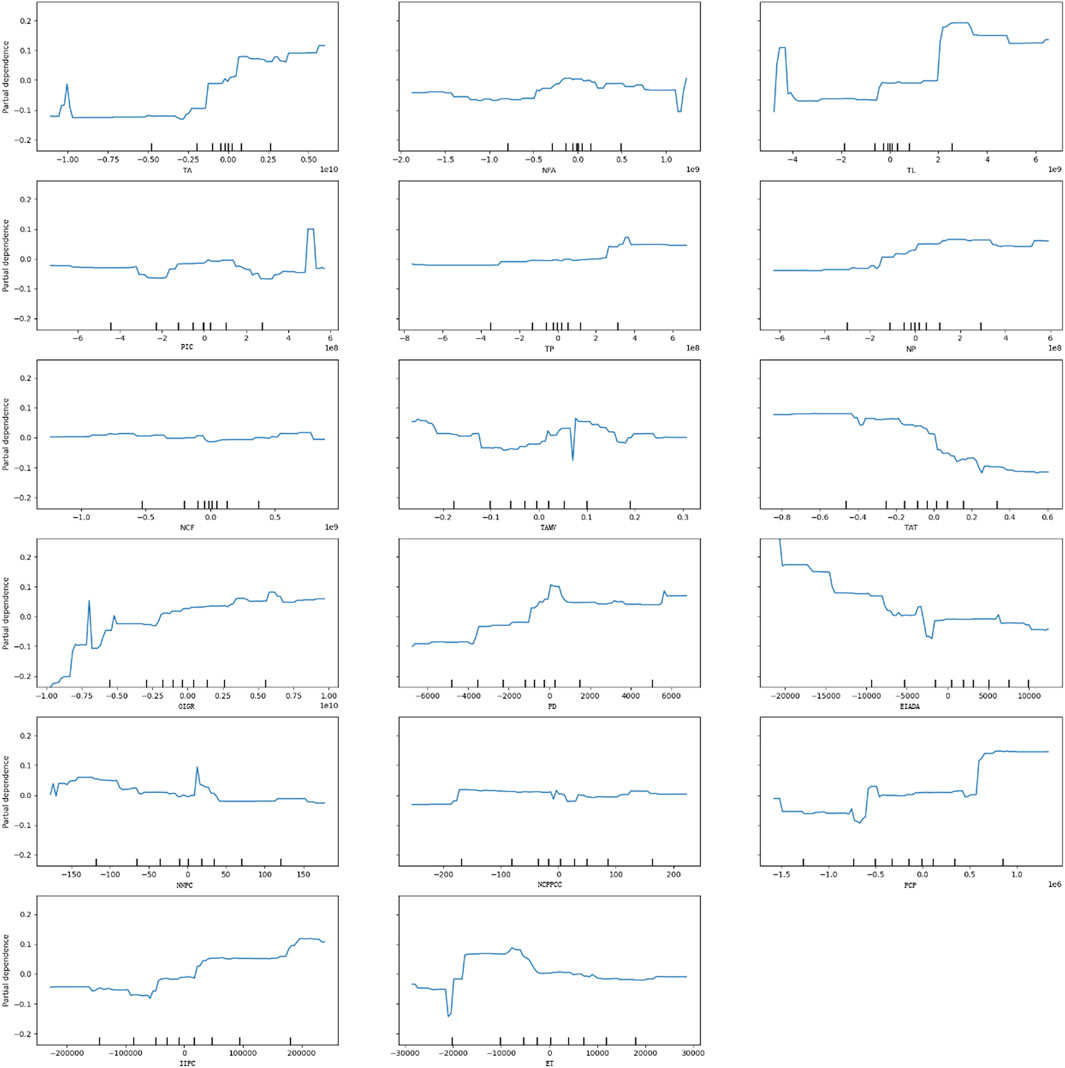
FIGURE 3. Partial dependency graph based on the gradient boosting prediction model.
However, as one of the manifestations of the development capacity of enterprises, the total asset turnover ratio has a negative driving effect. Enterprises with a high total asset turnover ratio have a pronounced growth capacity. They are in a period of rapid growth, focus more on their growth and expansion, and cannot devote sufficient resources to social responsibilities, including environmental protection (Cambell, 2007). Conversely, enterprises with a relatively low total asset turnover ratio may be mature and have greater flexibility to engage in environmental protection; Furthermore, due to their limited development capacity and the profit motive, they are more inclined to engage in green innovation reforms to reduce their dependence on the environment, improve the efficiency of resource use, and thus enhance their competitiveness.
(3) There is either an increase or a decrease in the corporate green innovation performance with the constraints of the command-based environmental regulation. The positive driving effect of environmental penalty decisions is the most pronounced. The reason is that, on the one hand, external stakeholders’ negative expectations and evaluations of the penalized enterprises lead to corporate financial losses, prompting managers to adopt green innovation strategies and rebuild their social image; on the other hand, the corporate economic losses resulting from the penalties force enterprises to compensate for their deficiencies, to improve the defects of corporate governance mechanisms and to produce more competitive green differentiated products.
The number of EIA document approvals for construction projects in the current year shows the opposite. To some extent, substitutability exists between the approval of EIA documents and the green patents obtained: By relying on the approval of environmental compliance by authorities, enterprises are bound to lose part of their innovation initiative. First, the cost of obtaining approvals may crowd out the green innovation inputs. Second, when the cost and the payback period of green investment are much higher than those of the EIA document approvals, the enterprise will need more incentive to improve its green innovation performance.
(4) The completed investment in pollution control projects in the current year and investment in industrial pollution control positively regulate corporate green innovation performance. On the one hand, pollution control investment stimulates enterprises to accelerate structural adjustment and promotes technological innovation and industrial upgrading; on the other hand, it guides the optimistic expectations of the market, attracts financial and private capital to flow into the green field, increases the accessibility of green financing for enterprises, and invigorates the development of green innovation.
The impact of the environmental tax shows an “inverted U″ shape, which implies that rational intensity is the key to effectively carrying out the environmental tax. If the cost of environmental protection is much higher than that of the environmental tax, the tax will be ineffective in preventing the enterprises from environmental vandalism; on the other hand, overly stringent taxation may cause a deterioration in the enterprise’s financial situation, resulting in a crowding-out effect on environmental investment behavior. In addition, it may trigger numerous enterprises’ relocation to avoid environmental pressures, thereby hindering regional economic development.
In this study, the above empirical results are significant for predicting and managing corporate green innovation performance in research and practice. Consistent with previous studies (Guo, 2019; Li and Xiao, 2020; Zhang, 2020), we found that the key to promoting corporate green innovation performance lies in effectively regulating the enterprises’ internal driving mechanism and rationally selecting external policy tools. Furthermore, this study not only offers a practical and effective corporate green innovation performance prediction model but also relies on a more diverse set of corporate financial indicators and environmental regulation tools to provide innovative empirical evidence for the debate on whether corporate financial capability and environmental regulation have a “conflict” or “coordination” effect on corporate green innovation performance and clarifies effective ways to incentivize corporate green innovation. Concretely, 1. Predict corporate green innovation performance. The gradient boosting model can help stakeholders accurately predict corporate green innovation performance through output indicators that reflect the green innovation performance of different enterprises. 2. Identify best practices. By comparing the green innovation performance of different enterprises and examining the relative importance and non-linear relationship of various influencing factors on corporate green innovation performance, decision makers such as governments and micro-entities can identify the best practices to optimize the top-level policy design and the resource base of enterprises and enhance the corporate green innovation performance. 3. Guide policy formulation. Accurate corporate green innovation performance prediction can provide an essential reference for policymakers to formulate targeted policies and interventions, thus realizing a “win-win” situation for environmental protection and enterprises’ competitiveness enhancement.4. Simulate the effect. The prediction model can simulate the effects of various influencing factors on corporate green innovation performance. By simulating the impact of different policies and strategies, we can better understand the results of each influencing factor on the green innovation performance of enterprises and provide a reference for decision-making by all parties.
We have attempted to introduce deep learning models, such as neural network models, for prediction and comparison in this study; however, as deep learning models are prone to overfitting problems, their predictions are not as effective as gradient boosting models and random forest models, and we initially speculate the reason is that the parameters have not been set optimally. In future studies, we will continue to refine our research on this issue and introduce deep learning models and other models into related research areas.
This study uses machine learning algorithms to predict the green innovation performance of micro-entities, examines the effectiveness of internal driving mechanisms and external environmental regulation tools, and differentially empirically analyses the effects of heterogeneous corporate financial capabilities and environmental regulation tools on corporate green innovation performance in the Chinese context, providing valuable insights for the government to optimize the top-level design of policies and for enterprises to enhance their green competitiveness. The conclusions are as follows.
First, the gradient ascent algorithm can best predict corporate green innovation performance. Second, the relative importance of financial indicators and operating capacity is more prominent, and the non-linear influence of financial indicators on corporate green innovation performance has a significant positive incentive effect, indicating that the impetus from enterprises’ internal driving mechanism is crucial for enterprises’ green transformation. The relative importance of the industry attributes is noteworthy, implying that significant industry heterogeneity exists in the enterprises’ environmental strategy choices. Third, the effects of the operating capacity indicators in the internal driving mechanisms on the corporate green innovation performance show non-linearity and heterogeneity. The operating income growth rate presents a positive correlation trend, while the total asset turnover ratio has an inhibiting effect on the enhancement of green innovation performance, illustrating that enterprises in the rapid development period are prone to neglect the enhancement of green competitiveness. Fourth, similarly, regarding the command-based environmental regulation, the administrative penalty has an apparent inducing effect on the corporate green innovation performance, while the approvals of EIA documents for construction projects in the current year exhibit a crowding-out effect. In the incentive-based environmental regulation, the driving effect of the completed investment in pollution control projects and the investment in industrial pollution control is positive; nevertheless, the environmental tax indicator presents an inverted U-shape, implying that overly stringent environmental tax regulation may impede the development of corporate green innovation. Based on the research, we propose the following suggestions.
(1) To achieve incentives for corporate green innovation performance, the government should accurately position and formulate policies for each micro-entity according to the corporate green innovation performance prediction model and reasonably allocate innovation resources. First, reinforce the command-based policy control carried by laws and regulations, complemented by stringent enforcement, to achieve a fundamental transformation in the green development concept of enterprises. Second, increase investment in pollution control projects to incentivize enterprises to engage in green production and innovation. In addition to the subsidies provided by the central government, the government should improve the financing mechanism for the green transformation of enterprises and provide green credit support to alleviate the cost and the financing constraints of enterprises; furthermore, the government should promote the diversification of the investors and accelerate the marketization of environmental operation and management by establishing a sound market mechanism for environmental investment. Third, regulate the intensity of environmental regulation enforcement. For example, adjust the structure of the environmental tax system, improve the design of tax rates and taxation management, and enhance the elasticity of the tax system to avoid the adverse effects of excessive tax intervention.
(2) Enterprises should fully apply the green innovation performance prediction model to adjust their development plan and resource bases to achieve their innovation goals. First, they should improve the internal driving mechanism of green innovation and focus on financial and operational optimization. Specifically, they should accumulate redundant resources and enhance their operating capacity to fulfill their environmental responsibilities better and to build green competitive advantages; besides, they should comply with the environmental regulatory constraints, enhance their social responsibility image, and improve investor evaluation to obtain more green innovation resources and preferential policies. Second, improve the transparency of corporate information by applying prediction models of corporate green innovation performance, effectively alleviating the degree of information asymmetry of internal and external investors and invigorating their enthusiasm for environmental protection investment. Third, industries or enterprises with outstanding green innovation capabilities should fully play their demonstration and leading roles in energy, emission reduction, and green transformation to motivate the green development momentum of the whole market and achieve high-quality social and economic development.
The original contributions presented in the study are included in the article/Supplementary Material, further inquiries can be directed to the corresponding author.
JZ contributes to manuscript writing, data collection and compiling, experimental design, data analysis, and the revision. KY contributes to the paper’s idea, including the theme and method, the framework construction, and the revision. All authors contributed to the article and approved the submitted version.
The authors declare that the research was conducted in the absence of any commercial or financial relationships that could be construed as a potential conflict of interest.
All claims expressed in this article are solely those of the authors and do not necessarily represent those of their affiliated organizations, or those of the publisher, the editors and the reviewers. Any product that may be evaluated in this article, or claim that may be made by its manufacturer, is not guaranteed or endorsed by the publisher.
The Supplementary Material for this article can be found online at: https://www.frontiersin.org/articles/10.3389/fenvs.2023.1252271/full#supplementary-material
Beaver, W. H. (1966). Financial ratios as predictors of failure. J. J. Account. Res. 4, 71–111. doi:10.2307/2490171
Berrone, P., Fosfuri, A., Gelabert, L., and Gomez-Mejia, L. R. (2013). Necessity as the mother of green inventions: institutional pressures and environmental innovations. J. Strategic Manag. J. 34 (8), 891–909. doi:10.1002/smj.2041
Bo, W. G., Xu, W., and Wang, J. F. (2018). Local government competition and environmental regulation heterogeneity: race to the bottom or race to the top? J. Soft Sci. 11, 76–93. doi:10.3969/j.issn.1002-9753.2018.11.009
Breiman, L., Friedman, J. H., Olshen, R. A., and Stone, C. J. (1984). Classification and regression trees (CART). J. Biom. 40 (3), 358. doi:10.2307/2530946
Campbell, J. L. (2007). Why would corporations behave in socially responsible ways? An institutional theory of corporate social responsibility. J. Acad. Manag. Rev. 32 (3), 946–967. doi:10.5465/amr.2007.25275684
Chen, Y. T. (2021). Analytical comparison of random forest and gradient boosting decision trees for integrated learning algorithms. J. Comput. Knowl. Technol. 17 (15), 32–34. doi:10.14004/j.cnki.ckt.2021.1441
Cheng, B., Ioannou, I., and Serafeim, G. (2014). Corporate social responsibility and access to finance. J. Strategic Manag. J. 35 (1), 1–23. doi:10.1002/smj.2131
Chien, S. C., Wang, T. Y., and Lin, S. L. (2010). Application of neuro-fuzzy networks to forecast innovation performance - the example of Taiwanese manufacturing industry. J. Expert Syst. Appl. 37 (2), 1086–1095. doi:10.1016/j.eswa.2009.06.107
Cho, C. H., Jung, J. H., Kwak, B., Lee, J., and Yoo, C. Y. (2017). Professors on the board: do they contribute to society outside the classroom? J. J. Bus. Ethics 141 (2), 393–409. doi:10.1007/s10551-015-2718-x
De la Paz-Marin, M., Campoy-Munoz, P., and Hervas-Martinez, C. (2012). Non-linear multiclassifier model based on Artificial Intelligence to predict research and development performance in European Countries. J. Technol. Forecast Soc. Change 79, 1731–1745. doi:10.1016/j.techfore.2012.06.001
Deng, Y. P., Wang, L., and Zhou, W. J. (2021). Does environmental regulation promote green innovation capability? –Evidence from China. J. Stat. Res. 38 (7), 76–86. doi:10.19343/j.cnki.11-1302/c.2021.07.006
Duan, Y. Q., and Xu, S. L. (2021). Command-based environmental regulation and heavy polluters’ investment: inventive or disincentive? J. J. Financial Dev. Res. (07), 54–61. doi:10.19647/j.cnki.37-1462/f.2021.07.008
Fan, J. Z., and Lang, Q. (2007). Empirical analysis on financial ability of the listed companies in Shanxi Province. J. J. Shanxi Univ. (Philosophy Soc. Sci.) 30 (4), 68–71. doi:10.13451/j.cnki.shanxi.univ(phil.soc.).2007.04.014
Friedman, J. (2001). Greedy function approximation: a gradient boosting machine. J. Ann. Statistics 29, 1189–1232. doi:10.1214/aos/1013203451
Guo, J. (2019). The effects of environmental regulation on green technology innovation-Evidence of Porter effect in China. J. Finance Trade Econ. 40 (3), 147–160.
Hart, S. L. (1995). A natural-resource-based view of the firm. J. Acad. Manag. Rev. 20 (4), 986–1014. doi:10.2307/258963
Hajek, P., Henriques, R., Castelli, M., and Vanneschi, L. (2019). Forecasting performance of regional innovation systems using semantic-based genetic programming with local search optimizer. J. Comput. Operations Res. 106 (6), 179–190. doi:10.1016/j.cor.2018.02.001
Hajek, P., and Henriques, R. (2017). Modelling innovation performance of European regions using multi-output neural networks. J. PLoS One 12, e0185755. doi:10.1371/journal.pone.0185755
Hao, J. L. (2019). Research on the moderating role of financial performance on enterprises' R&D investment and innovation performance--taking high-tech enterprises as an example. J. Commer. Account. 21, 43–46.
Hasan, L. M., Zgair, L. A., Ngotoye, A. A., Hussain, H. N., and Najmuldeen, C. (2015). A review of the factors that influence the adoption of cloud computing by small and medium enterprises. J. Scholars J. Econ. Bus. Manag. 2, 842–848.
Hastie, T., Tibshirani, R., and Friedman, J. H. (2009). The elements of statistical learning: data mining, inference, and prediction. M. New York: Springer.
Ho, Y. C., and Tsai, C. T. (2011). Comparing ANFIS and SEM in linear and nonlinear forecasting of new product development performance. J. Expert Syst. Appl. 38 (6), 6498–6507. doi:10.1016/j.eswa.2010.11.095
Hojnik, J., and Ruzzier, M. (2016). What drives eco-innovation? A review of emerging literature. J. Environ. Innovation Soc. Transitions 19, 31–41. doi:10.1016/j.eist.2015.09.006
Jerome, H. F. (2001). Greedy function approximation: a gradient boosting machine. J. Ann. Statistics 11 (10), 877–884.
Kotsiantis, S. B. (2013). Decision trees: a recent overview. J. Artif. Intell. Rev. 39 (4), 261–283. doi:10.1007/s10462-011-9272-4
Li, D. Y., Huang, M., Ren, S. G., Chen, X. H., and Ning, L. T. (2018). Environmental legitimacy, green innovation, and corporate carbon disclosure: evidence from CDP China 100. J. J. Bus. Ethics 150 (4), 1089–1104. doi:10.1007/s10551-016-3187-6
Li, Q. Y., and Xiao, Z. H. (2020). Heterogeneous environmental regulation tools and green innovation incentives: evidence from green patents of listed companies. J. Econ. Res. J. (9), 192–208.
Li, W. A., Zhang, Y. W., Zheng, M. N., Li, X. L., Cui, G. Y., Li, H., et al. (2019). Research on green governance of Chinese listed companies and its evaluation. J. Manag. World (05), 126–133+160. doi:10.19744/j.cnki.11-1235/f.2019.0070
Liu, Z. K., and Wang, H. Y. (2021). The influence of top managers’ military experience on enterprise green innovation. J. Soft Sci. 12, 74–80. doi:10.13956/j.ss.1001-8409.2021.12.12
Liu, Z., Zhang, Y., Cai, X., Xia, Q., Chen, J., Liao, Y., et al. (2016). All-trans-retinal dimer formation alleviates the cytotoxicity of all-trans-retinal in human retinal pigment epithelial cells. J. Commun. Finance Account. 4, 41–48. doi:10.1016/j.tox.2016.10.005
Lu, J. C., and Jiang, G. S. (2022). Can CEO green experience promote the green innovation? J. Bus. Manag. J. (2), 106–121. doi:10.19616/j.cnki.bmj.2022.02.007
Lu, W., Chau, K. W., Wang, H., and Pan, W. (2014). A decade’s debate on the nexus between corporate social and corporate financial performance: a critical review of empirical studies 2002-2011. J. J. Clean. Prod. 79, 195–206. doi:10.1016/j.jclepro.2014.04.072
Manso, G. (2011). Motivating innovation. J. J. Finance 66 (5), 1823–1860. doi:10.1111/j.1540-6261.2011.01688.x
Meng, L. P., Han, C. F., and Liu, P. J. (2023). An empirical study on intertemporal interaction between corporate environmental responsibility and corporate financial performance. J. J. Tongji Univ. Soc. Sci. Ed. 34 (2), 107–117.
Montmartin, B., and Herrera, M. (2015). Internal and external effects of R&D subsidies and fiscal incentives: empirical Evidence using spatial dynamic panel models. J. Res. Policy 44 (5), 1065–1079. doi:10.1016/j.respol.2014.11.013
Petroni, G., Bigliardi, B., and Galati, F. (2019). Rethinking the Porter Hypothesis: the underappreciated importance of value appropriation and pollution intensity. J. Rev. Policy Res. 36 (1), 121–140. doi:10.1111/ropr.12317
Porter, M. E., and Van der Linde, C. (1995). Toward a new conception of the environment-competitiveness relationship. J. J. Econ. Perspect. 9 (4), 97–118. doi:10.1257/jep.9.4.97
Preston, L. E., and Obannao, D. P. (1997). The corporate social-financial performance relationship: a Typology and Analysis. J. Bus. Soc. 36 (4), 419–429. doi:10.1177/000765039703600406
Qi, S. Z., Lin, S., and Cui, J. B. (2018). Do environmental rights trading schemes induce green innovation? Evidence from listed firms in China. J. Econ. Res. J. 12, 129–143.
Ross, S. A. (1977). The determination of financial structure: the incentive-signalling approach. J. Bell J. Econ. 8 (1), 23–40. doi:10.2307/3003485
Samara, E., Georgiadis, P., and Bakouros, I. (2012). The impact of innovation policies on the performance of national innovation systems: a system dynamics analysis. J. Technovation 32, 624–638. doi:10.1016/j.technovation.2012.06.002
Sheng, Y. M., Liu, Y. Y., and Xiao, Y. L. (2019). An empirical study on the interaction between environmental responsibility and corporate financial performance of listed companies. J. Statistics Decis. 35 (19), 172–176. doi:10.13546/j.cnki.tjyjc.2019.19.039
Tan, J., and Xu, G. W. (2022). Differences in environmental regulation and green innovation of enterprises driven by “Two wheels”—based on signal transmission theory. J. Soft Sci.
Tibshirani, R. (1996). Regression shrinkage and selection via the Lasso. J. J. R. Stat. Soc. Ser. B(Methodological) 73, 267–288. doi:10.1111/j.2517-6161.1996.tb02080.x
Triguero, A., Moreno, L., and Davia, M. A. (2013). Drivers of different types of eco-innovation in European SMEs. J. Log. Econ. 92, 25–33. doi:10.1016/j.ecolecon.2013.04.009
Waddock, S. A., and Graves, S. B. (1997). The corporate social performance-financial performance link. J. Strategic Manag. J. 18 (4), 303–319. doi:10.1002/(sici)1097-0266(199704)18:4<303::aid-smj869>3.0.co;2-g
Wang, B. B., and Qi, S. Z. (2016). The effect of market-oriented and command-and-control policy tools on emissions reduction innovation—an empirical analysis based on China’s industrial patent data. J. Chin. Ind. Econ. (6), 91–108. doi:10.19581/j.cnki.ciejournal.2016.06.008
Wang, J. R., Cui, R. X., and Zhang, Y. (2021). Stakeholder environmental pressure, external knowledge adoption, green innovation—moderation effects of market uncertainty and slack resource. J. Res. Dev. Manag. 33 (4), 15–27.
Wang, T. Y., and Chien, S. C. (2006). Forecasting innovation performance via neural networks—a case of Taiwanese manufacturing industry. J. Technovation 26, 635–643. doi:10.1016/j.technovation.2004.11.001
Wang, X., and Wang, Y. (2021). Research on the green innovation promoted by green credit policies. J. J. Manag. World (06), 173–188+11. doi:10.19744/j.cnki.11-1235/f.2021.0085
Zhang, B. C., and Zhao, S. K. (2022). Research on the impact of government subsidies on green innovation of enterprises—the moderating effect of political connection and environmental regulation. J. Sci. Res. Manag.
Zhang, C. (2020). Research on the effectiveness of environmental management system certification from the perspective of corporate finance and institutional environment [dissertation]. [Wuhan, Hubei]: Huazhong University of Science and Technology.
Zhang, C., Zhang, Z. G., and Bao, L. L. (2020). A study on interactive and intertemporal influence and mechanism of corporate environmental responsibility and financial performance. J. Manag. Rev. 32 (2), 76–89. doi:10.14120/j.cnki.cn11-5057/f.2020.02.007
Zhang, Q., Zheng, Y., Kong, D. M., Huang, H., Tang, Y., Qin, L., et al. (2019a). Local environmental governance pressure, executive’s working experience and enterprise investment in environmental protection: a quasi-natural experiment based on China’s “Ambient air quality standards 2012”. J. Econ. J. Res. 18 (6), 183–198. doi:10.1186/s12944-019-1126-0
Zhang, X. W. (2003). The construction of a corporate financial capability diagnostic index system. J. Finance Account. Mon. (23), 12–13. doi:10.19641/j.cnki.42-1290/f.2003.23.007
Keywords: green innovation performance, forecast, green patents, environmental regulation, gradient boosting model
Citation: Zhang J and Yin K (2023) Application of gradient boosting model to forecast corporate green innovation performance. Front. Environ. Sci. 11:1252271. doi: 10.3389/fenvs.2023.1252271
Received: 03 July 2023; Accepted: 02 October 2023;
Published: 16 October 2023.
Edited by:
Stefan Cristian Gherghina, Bucharest Academy of Economic Studies, RomaniaReviewed by:
Ali Shehadeh, Yarmouk University, JordanCopyright © 2023 Zhang and Yin. This is an open-access article distributed under the terms of the Creative Commons Attribution License (CC BY). The use, distribution or reproduction in other forums is permitted, provided the original author(s) and the copyright owner(s) are credited and that the original publication in this journal is cited, in accordance with accepted academic practice. No use, distribution or reproduction is permitted which does not comply with these terms.
*Correspondence: Jingyi Zhang, amluZ3lpLnpoYW5nQHN0dS5vdWMuZWR1LmNu
Disclaimer: All claims expressed in this article are solely those of the authors and do not necessarily represent those of their affiliated organizations, or those of the publisher, the editors and the reviewers. Any product that may be evaluated in this article or claim that may be made by its manufacturer is not guaranteed or endorsed by the publisher.
Research integrity at Frontiers
Learn more about the work of our research integrity team to safeguard the quality of each article we publish.