 Mahir Yazar
 Irem Daloglu Cetinkaya
 Muzaffer Can Iban
 Suleyman Sefa Bilgilioglu
- 1Centre for Climate and Energy Transformation, Department of Geography, University of Bergen, Bergen, Norway
- 2Institute of Environmental Sciences, Boğaziçi University, Istanbul, Türkiye
- 3Department of Geomatics Engineering, Mersin University, Mersin, Türkiye
- 4Department of Geomatics Engineering, Aksaray University, Aksaray, Türkiye
Extreme heat events are happening more frequently and with greater severity, causing significant negative consequences, especially for vulnerable urban populations around the globe. Heat stress is even more common in cities with dense and irregular planning and lacking urban blue-green infrastructures. This study investigates the greening and cooling effects of five selected urban transformation projects and their surrounding areas (within a 10-min walking distance) in Istanbul from 2013 to 2021, with a focus on environmental justice and climate adaptation planning perspectives. By employing temporal analysis of Normalized Difference Vegetation Index (NDVI) and Land Surface Temperature (LST) values derived from Landsat data sets to detect changes in these five selected urban transformation projects in the megacity of Türkiye, Istanbul, this study finds that the distribution of green infrastructures (e.g., tree canopy) is only limited to project sites of long-running and state-supported urban transformation projects in Istanbul. Consequently, the unequal distribution of green infrastructures creates cooling effects only for the locals residing in the new residential projects. However, the surrounding areas have less urban green infrastructure and are exposed more to the urban heat over time. Urban development policies and planning highly contribute to increasing the climate vulnerabilities among those who do not benefit from the recently developed residential units in Istanbul. Such a trend can affect adaptive capacity of vulnerable communities and redress environmental injustices in urban planning in the megacity of Istanbul.
1 Introduction
Cities and urban communities are considered the nexus for transforming into a sustainable and climate-resilient society. This transformation typically involves changes in the built urban environment, such as urban refurbishment and densification, from small-scale (e.g., parcel) to large-scale (e.g., neighborhood or district) levels of urban transformation (UT) projects. Such projects in the built urban environment have the opportunity to adapt cities and urban communities to the increasing impacts of climate change (e.g., extreme heat and flash floods). Nevertheless, they also have the risk of increasing existing disadvantages for socio-economically vulnerable urban groups. UT projects may occur in a shared spatial and temporal context, but their outcomes affect different residential populations living in the same neighborhoods, triggering social exclusion, environmental injustices for socio-economically disadvantaged groups, and green gentrification (Anguelovski, 2016; Maia et al., 2020; Yazar et al., 2020; Mital, 2023). Urban transformations for sustainable buildings and green public spaces, for instance, may decrease heating costs and ease the impacts of urban heat through green infrastructures (e.g., tree canopy) (Gill et al., 2007). Still, they may drive up property values and consequently push out socio-economically vulnerable renters into the city outskirts with worse housing and less green infrastructure access (Chow et al., 2012; Dialesandro et al., 2021). A comprehensive planning approach is necessary to ensure equal distribution of cooling and greening effects throughout the city (Rakoto et al., 2021); otherwise, green benefits will only be experienced by high-income residents who can afford to live in the transformed areas.
This study investigates the effects of five selected UT projects on green infrastructure and land surface temperature within their respective project sites and surrounding neighborhoods (within a 10-min walking distance) in the megacity of Türkiye, Istanbul. While UT projects are expected to create more green spaces and to reduce urban heat vulnerability within project sites (Smith et al., 2017; Mabon and Shih, 2018), it is unclear if these benefits extend to nearby communities. Moreover, surrounding neighborhoods may still lack open green spaces or experience similar greenery changes despite project sites becoming greener.
Thus, this study aims to analyze 1) shifts in green infrastructure within the five UT projects and their surrounding neighborhoods from 2013 (after Law 6306, Transformation of Areas under Disaster Risk entered into force) to 2021, and 2) whether such shifts in green infrastructure have an impact on land surface temperature within these five UT projects and their surrounding neighborhoods within a 10-min distance. The study is limited to a 10-min distance approach, in which the authors aim to determine whether there is a differentiation in the distribution of urban green infrastructure within such a short proximity between the selected newly developed areas and their surrounding areas.
Istanbul was selected for this study because UT projects have been implemented in different parts of the metropolitan area, particularly after the Turkish parliament enacted Law 6306 (Law on the Transformation of Areas under Disaster Risk) in 2012. Law 6306 aimed to transform settlements in disaster-prone areas. However, the central government, municipalities, and private developers have orchestrated numerous UT projects to transform old housing units or industrial areas into lucrative residential complexes (Iban, 2020). The central government has delineated and announced some risky areas across the city and provided support for UT projects through economic stimulus packages (Ünsal, 2023). Even though these UTs have brought about short-term economic growth based on construction, they have led to tensions and conflicts between those in charge of the projects and the residents of affected neighborhoods, particularly when the “disaster” law is invoked (Durmaz, 2015; Kuokkanen and Yazar, 2018). Nevertheless, the term “risky areas” is not clearly defined in the legislation, and private construction companies aim to gentrify inner-city neighborhoods, mainly historical places or squatter settlements, to develop high-income office and housing sites under the guise of transforming the risky areas (Güzey, 2016).
Previous studies have utilized parameters such as the Normalized Difference Vegetation Index (NDVI) and Land Surface Temperature (LST) for monitoring the environment in urban areas (Goward et al., 2002; Guha and Govil, 2022). Many researchers have documented the importance of the multi-scalar and GIS-based aspects of green infrastructure and its planning in urban contexts (Langemeyer et al., 2020; Depietri, 2022; Cong et al., 2023; Pan et al., 2023; Venter et al., 2023), and its disproportionate impact on urban communities (Dooling, 2009; Pearsall, 2010). This study employs similar methods, using both NDVI and LST, and links them to perspectives on environmental justice and urban planning through the examination of five selected cases and their surroundings within a 10-min distance in the megacity of Istanbul. The wider implications of this study are that it advances our understanding of the challenges posed by urban transformation projects, in which green infrastructure solutions can exacerbate existing spatial injustices in a megacity from the Global South.
The paper is structured as follows: Section 2 establishes the link between UT projects and their potential pitfalls, which can increase risks posed by climate change impacts and lead to environmental injustices; Section 3 introduces the case selection and methodology employed in the study; Section 4 outlines the results; and Section 5 discusses the five case studies and their 10-min walking distance neighborhoods. Finally, the paper concludes and suggests further avenues of research.
2 Environmental injustices in urban planning amid climate change
Cities fail to mitigate the social and economic impacts of climate change rapidly (Dodman et al., 2022). The impacts of climate change in cities, especially extreme heat events, are already increasing significantly unequal results (Hsu et al., 2021; Dodman et al., 2022). Heat stress becomes more prevalent in both the cities of Global North and South, with extreme heat leading to illness and death, increasing pollutant levels, and demands for energy for cooling purposes (Harlan and Ruddell, 2011; Lundgren et al., 2013). Researchers show that socio-economically vulnerable communities are disproportionately exposed to urban heat and heat-related sickness due to urban thermal inequalities (Harlan and Ruddell, 2011; Dialesandro et al., 2021). Cities also incorporate policies, such as green infrastructures or use cooling technologies for buildings, to enhance the microclimate of urban areas to achieve climate-resilience (Langemeyer et al., 2020; Cong et al., 2023). Against this backdrop, successful urban planning and policies with interactive GIS-based multi-criteria applications are required for the allocation of urban green infrastructures (Depietri, 2022; Venter et al., 2023), especially to alleviate rising heat stress for vulnerable communities. Although there is an advancement in climate change adaptation policies, plans and actions, scholars show that political elites and developers often in favor of boosting property values by investing in green infrastructures, excluding public access for vulnerable urban communities (Dooling, 2009; Pearsall, 2010).
The political environment and the surrounding governance structures of a given urban context can also affect the likelihood of the effective policies and actions to respond to climate change-related challenges (Lee and Hughes, 2017; Yazar, 2023). Technocratic-oriented governance decision-making embraces green infrastructure as a technological solution to secure local investments and foster growth in response to the impacts of climate change within existing regulations (Horwood, 2011). Such an engineering and technology-oriented understanding of green infrastructure leaves little room for an inclusive political process, which is highly valuable in facilitating dialogue to determine urban climate adaptation priorities. Environmental justice scholars, for instance, have historically been vocal about the inclusion of lived experiences and diverse knowledge systems in decision-making processes. Yet, such epistemological plurality in urban decision making often diverges from dominant plans and policies (Bahadur and Tanner, 2014; Leach, 2015).
The environmental justice literature aims to comprehensively analyze how socio-economically vulnerable communities, especially marginalized communities with specific racial and ethnic backgrounds, are disproportionately exposed to environmental externalities due to development projects, land-use policies, and plans (Boone et al., 2009; Pearsall, 2010; Locke et al., 2021). This literature is broadened with three main dimensions of justice: distributional, recognitional, and procedural justices, each of which tackles overcoming inequalities triggered by environmental risks (Schlosberg, 2004; Low, 2013; Yazar and York, 2022). Specifically, individuals’ adaptive capacity amid changing climatic conditions are highly related to hard and soft infrastructure (e.g., urban planning and governance structure), socio-demographic structure (e.g., income level, race, gender), and agency that depends on how people mobilize the highlighted conditions within existing structures (Lemos et al., 2016; Waters and Adger, 2017). Urban planning and urban transformation actions directly affect the increase (or decrease) of people´s adaptative capacities to mitigate extreme hazards. For instance, economic growth priorities can overshadow building climate-resilient buildings and neighborhoods for all society, and such priorities have direct impacts on socio-economically disadvantaged populations, as they can either hinder or increase risks from hazards (Fainstein, 2018).
At the urban scale, transformation and development projects with sustainability and climate-resilient efforts can also potentially lead to green gentrification. These projects generally distribute green infrastructure only to affluent citizens in gated communities or wealthy neighborhoods (Dooling, 2009; Curran and Hamilton, 2012). Environmental injustices are perpetuated primarily due to the unequal distribution of environmental benefits, favoring only wealthy citizens, which forces evictions of marginalized communities from urban transformation areas. The socially excluded urban transformation projects may cause green divides between wealthy and low-income neighborhoods, exacerbating exposure to urban-related climate impacts, such as extreme heat, especially for marginalized communities (Bolin et al., 2013; Hsu et al., 2021). Scholars focused on urban climate adaptation and planning have documented that exclusionary land use policies spurred by urban regime coalitions, including political elites and private developers, can worsen spatial inequalities (Bolin et al., 2013; Fainstein, 2018; Yazar and York, 2021; Kearl and Voger, 2023). As a result, exclusionary zoning and land use policies coupled with the threats posed by climate change increase displacements and higher exposures to urban climate impacts among vulnerable urban communities (Bolitho and Miller, 2017; Fainstein, 2018).
3 Case study and methods
3.1 Case study selection
Istanbul’s uncontrolled and fragmented urbanization has resulted in a complex structure incorporating diverse land use types. This structure has evolved into a mosaic of morphologically distinct neighborhoods encompassing various forms, geometries, and architectural typologies (Erdem Okumus and Terzi, 2021). Furthermore, the complex structure with a multi-layered identity puts the concept of urban transformation (UT) on the decision-makers’ agenda to improve the city’s physical appearance (Turgut, 2021). Against this backdrop, this study identifies five UT projects, namely, Cendere a), Sarıgöl b), Tarlabaşı c), Fikirtepe d), and Kartal e) (see Figure 1), that have distinct typologies mentioned above. Following the enactment of Law no.6306 in 2012, demolition and construction activities commenced promptly at these sites. Consequently, we chose a study period that spans from 2013 to 2021, aiming to comprehend the environmental changes occurring within and around the project sites during this time frame.
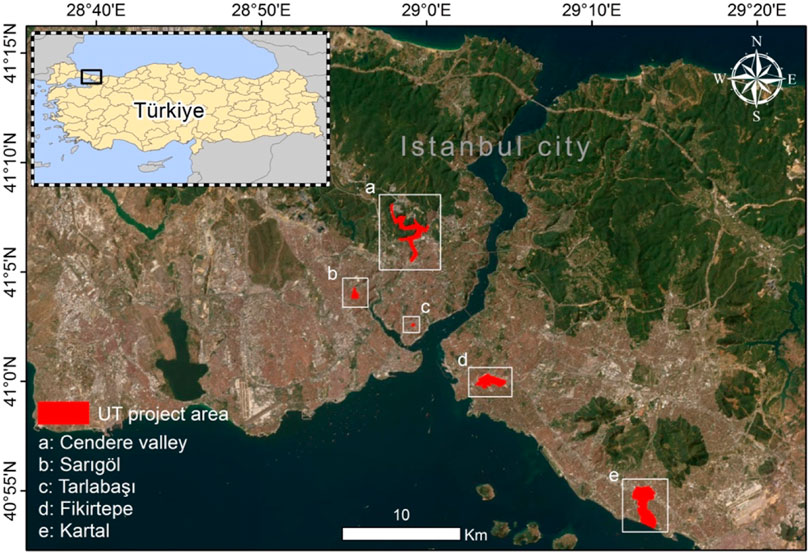
FIGURE 1. The selected neighborhoods for this study.
The rationale behind the selection of these five UT projects in Istanbul is multifaceted. Firstly, their strategic location in the city center or immediate environs implies their significant potential impact on the city’s overall climate and environment. Secondly, they are among the largest and most extensive UT projects in Istanbul, encompassing substantial land areas and involving significant changes in land use, infrastructure, and building development. Thirdly, their diverse features regarding location, size, and objectives render them suitable for comparative analysis of the effects of green infrastructure on urban heat. Lastly, these projects have been widely discussed in the literature on urban transformation in Istanbul, which provides a rich source of information.
1) The Cendere Valley is located adjacent to the Büyükdere-Maslak axis, which is the central business district of the city, and the secondary highway network. Industrialization effects became apparent in the valley in the 1960s, the need for cheap and large spaces required for industrial activities led to the proliferation of industrial activities in the city’s outskirts. However, since the 2010s, industrial activities and informal settlements have gradually moved out of the area and have been replaced by fragmented mass housing, shopping malls, and residential and luxury office structures without a comprehensive plan. As a result, the high-income group has started to establish itself in the valley with the increase in mixed-use, new and luxury buildings (Aybar and Dokmeci, 2022; Kırtaş and Tomruk, 2022).
2) The Sarıgöl neighborhood is located in Istanbul’s Gaziosmanpaşa District, where several UT projects have been ongoing for years to enhance living conditions and infrastructure. The projects aim to improve the district’s residents’ quality of by creating a more livable, sustainable, and modern urban environment. However, as with other UT projects in Istanbul, the Sarıgöl project has faced some criticism. Some people believe that the projects are unfair and lack transparent, leading to displacement and green gentrification (Yazar et al., 2020)
3) The Tarlabaşı neighborhood, located near the city’s heart Taksim Square, has undergone substantial UT in recent years. Once a diverse working-class neighborhood with a significant number of immigrants and refugees, the area has been targeted for redevelopment by the government. Unfortunately, this has resulted in the displacement of many residents and the destruction of historic buildings. The project aims to gentrify the area by constructing new luxury housing, hotels, and shopping centers, attracting upper-income residents. This has led to significant controversy and protests from residents and activists, who argue that the redevelopment displaces long-time residents and erases the neighborhood’s cultural heritage (Arıcan, 2020; Tsavdaroglou, 2020).
4) Fikirtepe is a neighborhood in the Kadıköy district of Istanbul, which is predominantly inhabited by lower-income groups. In 2005, the Istanbul Metropolitan Municipality adopted a land use plan aimed at improving the area’s physical and living conditions. However, in 2011, the courts cancelled the detailed local plan of Fikirtepe, stating that it was not in line with the principles of regulatory planning systems, upper-level plans, and the reconstruction law. As a result, in 2013, the Ministry of Environment and Urbanization declared Fikirtepe a “risky area” and approved a new detailed local plan. Subsequently, developers have been constructing high-rise luxury buildings in the neighborhood (Tarakci and Turk, 2022).
5) Kartal is a district located on the Asian side of Istanbul. One of the significant projects in the area is the construction of the Kartal-Pendik Master Plan, a large-scale urban development project that aims to create a new city center in Kartal. The project involves the construction of new residential, commercial, and recreational areas, as well as the creation of new transportation infrastructure. The project is also designed to address the housing shortage in Istanbul by creating new housing units for over one million people. However, it has also had negative impacts such as the displacement of residents, destruction of green spaces and cultural heritage, and rising property values, making the area unaffordable for many locals (Çalışkan, 2017).
3.2 Data sets
3.2.1 Vector data
This study investigates the cooling and greening effects of selected UT projects within their project sites and surrounding areas. It aims to determine whether the benefits of these projects are limited to the project sites or extend to nearby communities. To achieve this, we implemented a GIS operation that considers project sites and their surrounding areas separately. The boundaries of the five UT projects were obtained from the website megaprojeleristanbul.com, which features a map of ongoing mega projects in Istanbul created by the Istanbul Association of Architects in Private Practice (MEGAISTANBUL, 2023). These digital boundary data are stored in the form of vector shapefiles. To calculate the surrounding areas, this study uses a 10-min walking distance (1000 meters) from the project sites based on Istanbul’s road network obtained from OpenStreetMap (Open Data Commons, 2023) data. Figure 2 shows the selected UT project areas and their 10-min walking surrounding areas (shown in red lines). This approach enables us to measure the cooling or warming effect of these projects on surrounding neighborhoods. Moreover, it enables a comparison of the greenness of surrounding neighborhoods with that created within the project sites throughout the study.
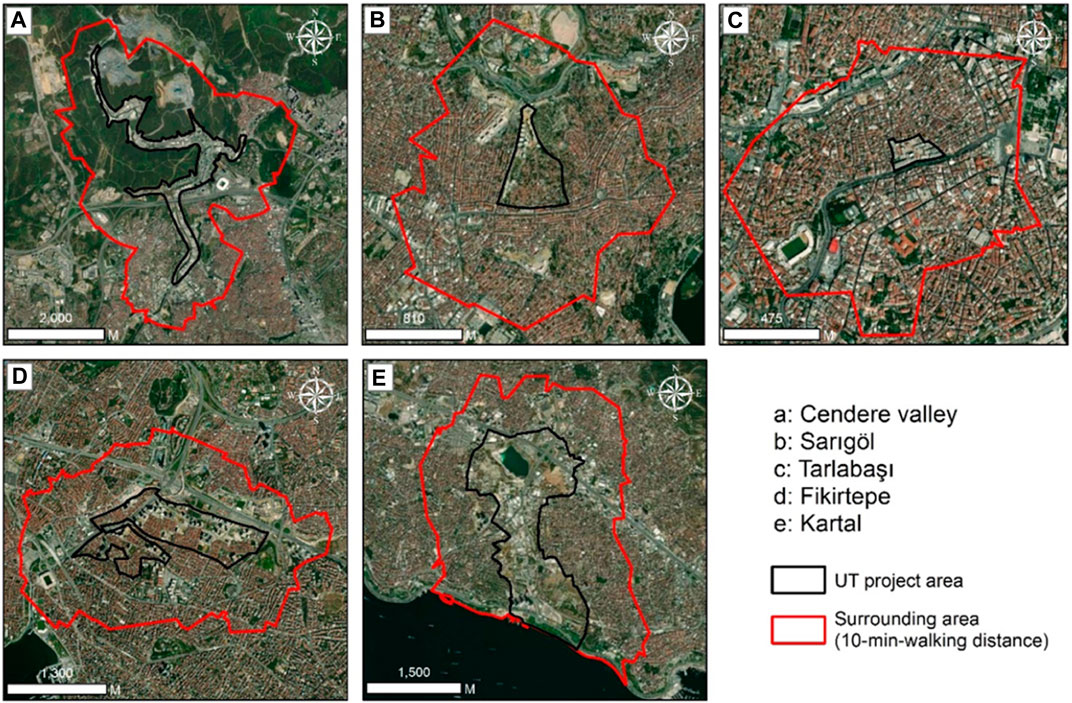
FIGURE 2. The selected UT project areas (shown in black lines) and their 10-min walking surrounding areas (shown in red lines).
3.2.2 Raster data
In recent years, the utilization of Remote Sensing (RS) technologies has become crucial in examining urban green spaces and surface urban heat islands (SUHIs) due to their capacity to furnish historical time series data. Programs such as Copernicus and Landsat have made it possible for many researchers and managers to access medium spatial resolution satellite imagery for their research. Since 2009, all archived Landsat images have been made available to all users at no cost. However, these data sets are not suitable for mapping green spaces and SUHIs at a detailed level, but they can be used to evaluate the overall pattern of SUHIs and green spaces within cities (Shahtahmassebi et al., 2021). In other words, a vast number of published studies has used medium resolution satellite images (e.g., Landsat, Sentinel-2) for mapping green spaces (Xu et al., 2022; Ju et al., 2022) and SUHIs (Carrillo-Niquete et al., 2022; Halder et al., 2022).
3.2.2.1 Land surface temperature (LST)
Land Surface Temperature (LST) is a measure of the temperature of the Earth’s surface, including urban areas. It is often used in studies of SUHIs to examine the relationship between surface temperature and urbanization in cities (Sekertekin and Bonafoni, 2020a). LST can be measured using thermal infrared RS, which detects the infrared radiation emitted by the Earth’s surface and converts it into a temperature value (Sobrino et al., 2008). LST can be used to map the distribution of surface temperature in an urban area and to identify areas with higher or lower temperatures. In urban areas, the LST is often higher than in rural areas due to the concentration of buildings, roads, and other man-made surfaces that retain and radiate heat. The LST can also be influenced by factors such as vegetation, water bodies, and the presence of heat sources such as air conditioning units (Zaitunah et al., 2022). In SUHIs studies, LST can be used to identify areas with high surface temperatures, which are often associated with urbanization (Xu et al., 2022). It can also be used to monitor the changes in surface temperature over time and to evaluate the effectiveness of heat mitigation strategies (Lemoine-Rodríguez et al., 2022).
3.2.2.2 Normalized Difference Vegetation Index (NDVI)
Normalized Difference Vegetation Index (NDVI) is a method used to measure the amount of green vegetation in a given area (Pettorelli et al., 2005). It is commonly used in studies of SUHIs and green gentrification to investigate the relationship between vegetation and temperature in urban areas (Li and Grant, 2022; Stuhlmacher et al., 2022; Wu and Rowe, 2022). NDVI is calculated by using the red and near-infrared bands of an RS image, and the values range from −1 to 1. A higher NDVI value indicates a greater amount of green vegetation, while a lower NDVI value indicates less vegetation or bare soil. NDVI can be used to map the distribution of vegetation in an urban area and to locate areas with high or low levels of vegetation cover. NDVI values can also serve as an indicator of the cooling effect of vegetation since increased vegetation can lower surface temperature by shading and evaporative cooling (Venter et al., 2023). This data can be used to identify areas where vegetation can be added to reduce the SUHI effect and to evaluate the effectiveness of vegetation management strategies.
3.2.3 Preparation of LST and NDVI time series
The Google Earth Engine (GEE) was used to select images and perform LST and NDVI computations. GEE is a web platform that utilizes cloud-based technology for geospatial tasks and takes advantage of Google’s powerful computational resources for various Earth monitoring activities. GEE also helps to manage many of the challenges related to data storage, cataloging, and projection, and has incorporated many commonly used RS data sources (Gorelick et al., 2017). The UT project sites, and their surrounding areas were delineated by importing the digital vector files into the GEE platform. Scenes of atmospherically corrected surface reflectance (SR) taken by Landsat 8 (L8) satellite (USGS, 2013) for the period of 2013–2021 were selected from GEE platform to study the changes in LST and NDVI during the study period. All images cover a nice weather period between April 1 and October 30, as this time of year allows for fewer cloudy and snow-covered scenes. Pixels that were cloudy or invalid were identified using the CFmask band from the SR collection to produce an output with a cloud mask. This study set a maximum cloud cover of 10% for images to guarantee that the data acquisition date had optimal atmospheric conditions. The scenes were already rectified to WGS84 datum in the GEE platform, and they were downloaded in GEOTIFF format. In the end, the final data set consists of 37 L8 scenes within the study period. All selected and filtered images (Rows/Paths: 180–181/33–34) were clipped to five selected UT project sites and their surrounding areas. Band 10 (TIR1) values from L8 Thermal Infrared Sensor (TIRS) were used to compute LST values which were retrieved with the help of NDVI-based emissivity method (Sobrino et al., 2008). NDVI values were computed using Band 4 (Red) and Band 5 (Near-Infrared NIR) SR digital number (
Furthermore, LST values were computed with the help of the Landsat 8 Data Users Handbook.
where
where
Different components of land, such as composition, roughness, and structure, influence land surface emissivity, thus, spectral emissivity (
Where
Where
where
Finally, the mean LST and mean NDVI values were calculated separately for each UT project site and its surrounding area based on the pixels in each scene. The mean values provide a general idea of the LST and NDVI values of each pixel within our study areas. As a result, time series data were obtained for mean LST and mean NDVI values. Both data sets contain five different polygons for each project site and five polygons for the surrounding areas of each project site.
3.2.4 Trend analysis
Employing trend analysis on time series data of LST and NDVI values derived from L8 imagery is rooted in the need to systematically assess and quantify long-term environmental changes. In the context of urban transformation projects, this approach becomes particularly valuable and it enables to discern meaningful patterns and trends in LST and NDVI over time. For instance, increasing LST trends may indicate urban warming effects due to changes in land use and infrastructure, while rising NDVI trends may suggest a greening effect, possibly related to vegetation growth or restoration efforts. The systematic analysis of these trends enables scientists, policymakers, and urban planners to better understand the consequences of urban development on local climate and ecosystem dynamics, providing a robust foundation for evidence-based decision-making and sustainable urban planning.
We used linear regression to model the trend of our time series data by fitting a straight line. Our aim was to fit a trend line for a long-term data set without considering seasonality and meteorological anomalies (de Jong et al., 2011). The line is represented by the equation
where
On the other hand, RMSE is another metric to measure the difference between the predicted and actual values. Unlike MAE, RMSE is sensitive to outliers because it squares the differences between predicted and actual values. Large errors have a more significant impact on RMSE, making it useful when one wants to penalize large errors heavily. The formula for the RMSE is:
4 Results
Analyses comprising NDVI and LST measurements from 2013 to 2021 to evaluate the five selected UTs in Istanbul Metro Area and their surroundings (10-min walking distance) are explained in detail below.
4.1 Increase in green infrastructures is only limited to urban transformation areas and excludes surrounding neighborhoods
Figure 3 displays scatter plots representing the time series data of NDVI values extracted from L8 imagery for selected project sites and their respective surroundings. In these plots, individual NDVI values from each image are denoted by green dots, while red lines represent the regression lines fitted to visualize the trends. Accordingly, Table 1 below reveals the NDVI results for the selected UT projects and their surrounding areas (within 10-min walking distance). The table presents the initial and final NDVI values obtained from L8 imagery for each project site and its adjacent areas. Additionally, it showcases the NDVI fluctuations over the course of the study period, along with the RMSE and MAE scores associated with the regression lines fitted to the data. The analyses reveal that the distribution of urban green infrastructure is not uniform across the selected UT areas when compared to their respective surroundings. Generally, an upward trend in the green canopy is observed within the UT areas, whereas a decrease or minor fluctuations are noted in the surrounding urban areas. Notably, Tarlabaşı UT stands out as an exception, experiencing a sharp decline in urban green over the 9- year study period (2013–2021), while the surrounding areas have witnessed an increase in green cover. The rest of the UT projects exhibit similar trends of increasing NDVI values over the study period. The highest increase in the green canopy was observed in Kartal UT with 23.11%, followed by Cendere UT (21.18%) and Sarıgöl UT (15.68%), whereas the lowest change in NDVI was observed in Fikirtepe UT with 8.97%.
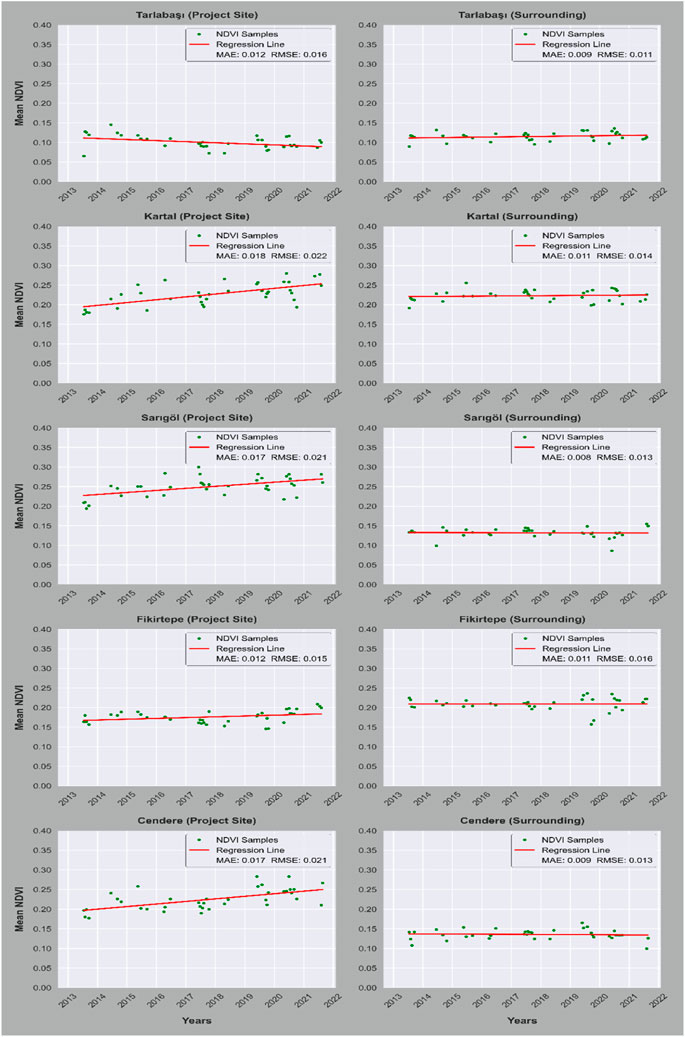
FIGURE 3. Scatter plots representing the time series data of NDVI values extracted from L8 imagery for selected project sites and their respective surroundings.
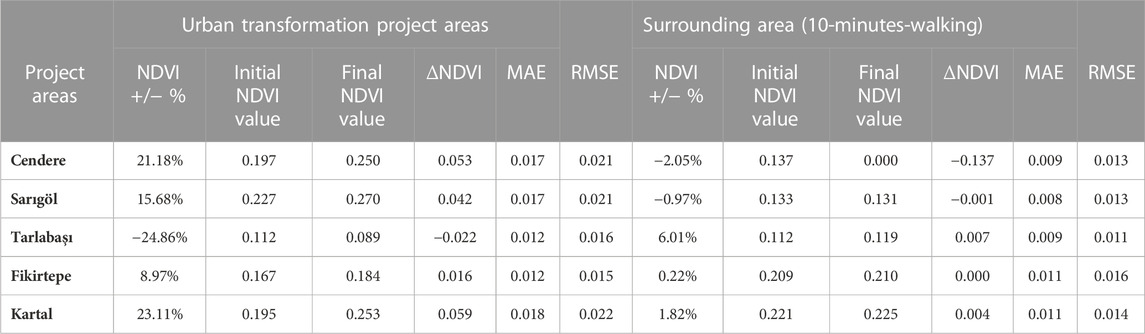
TABLE 1. NDVI results for the selected UT projects and their surrounding areas.
The comparison of the NDVI values for the UT areas and their surrounding areas reveals that the increase in green canopy is unfortunately limited only to the project areas but does not have a spillover effect. The highest NDVI values were observed in the Kartal UT project; however, their surrounding area has a meager 1.82% increase in the green canopy. Similarly, the surrounding areas of Fikirtepe UT have a minimal increase in NDVI values (0.22%), whereas in the surrounding areas of Sarıgöl and Cendere UT projects, we observe a reduction in NDVI values, −0.97% and −2.05% respectively. Conversely, in Tarlabaşı UT, an unanticipated increase in the green canopy (6.01%) is observed in the surrounding areas (see Figure 2 for the urban transformation projects and their surrounding areas).
4.2 The correlation between urban green infrastructure and LST
Figure 4 exhibits scatter plots illustrating the time series data of LST values derived from L8 imagery for selected project sites and their surrounding areas. Within these plots, individual LST values from each image depicted as blue dots can be observed, while the red lines represent the regression lines fitted to elucidate the underlying trends. The LST results reveal a strong correlation between urban green cover. This analysis shows a decrease in LST between 2013 and 2021 in areas where urban green infrastructure has increased, as presented in Table 2. The highest decrease in LST (−3.99%) was observed in Fikirtepe UT and Kartal UT (−3.53%), where NDVI has significantly increased. A similar trend in LST was observed in Cendere UT (−3.16%) and Sarıgöl UT (−1.63%). On the other hand, Tarlabaşı, where the areal extent of urban green cover has reduced, has experienced a considerable rise in LST (4.14%) with a comparatively minor increase (1.27%) in the surrounding areas. These findings suggest a direct association between the expansion of urban green infrastructure and its positive impact on LST.
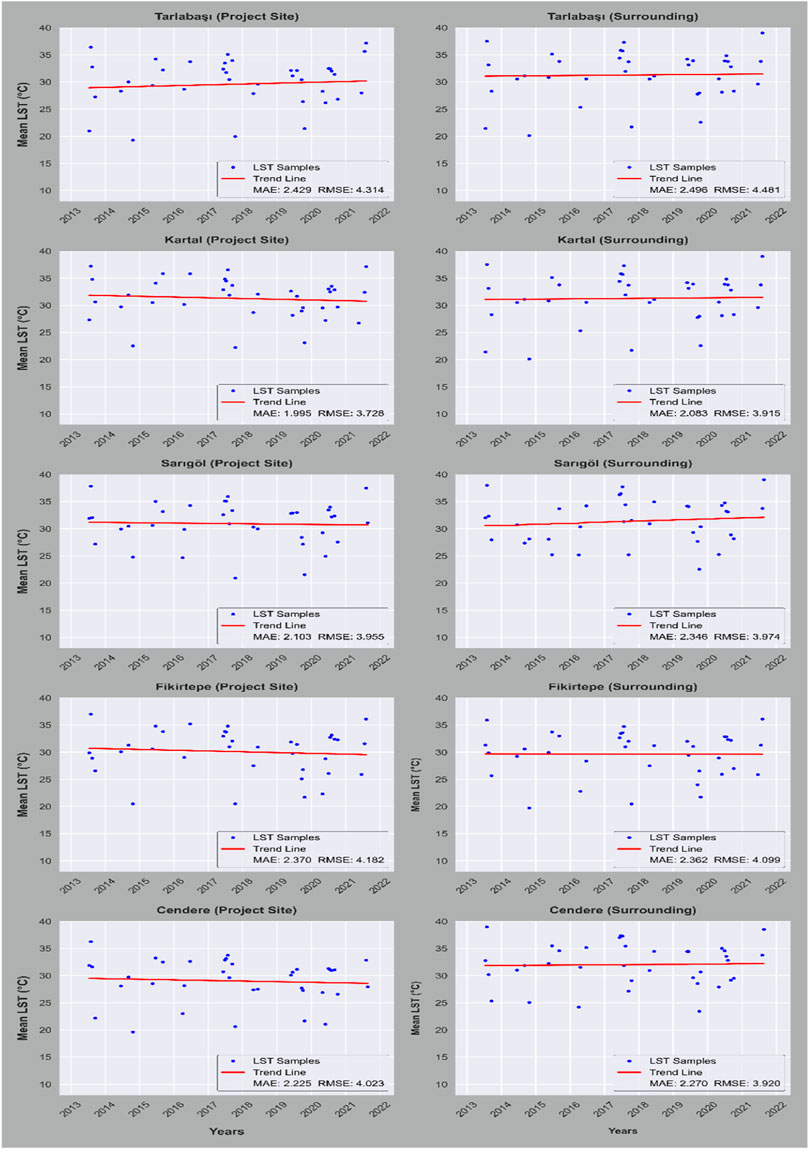
FIGURE 4. Scatter plots representing the time series data of LST values extracted from L8 imagery for selected project sites and their respective surroundings.
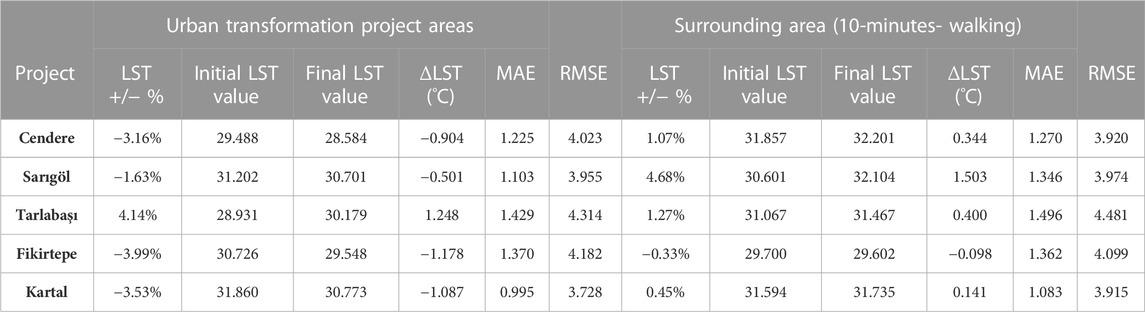
TABLE 2. LST results for the selected UT projects and their surrounding area.
The relationship between NDVI and LST is not uniform for the surrounding areas of the UT projects. The increase in green canopy through UT projects is limited only to the transformation project areas and does not extend to their surrounding areas. Thus, LST values displayed a slight increase, except for Fikirtepe UT, where due to increasing NDVI values, LST values have reduced by 0.33%.
5 Discussion
Spatially varied urban transformation projects can contribute to uneven distribution of green infrastructure, reproducing unequal patterns of climate change-related impacts (Brand and Baxter, 2020; Yazar and York, 2023). This is especially important as the location and distribution of tree canopy can be affected by the legacies of growth-oriented urban zoning and planning. This study observes that green infrastructure has generally increased in the five selected UT areas in Istanbul over the last 9 years. This increase in green spaces has had positive effect on reducing land-surface temperature within the UT areas. However, results for the surrounding areas within a 10-min distance of the five selected UT areas show that urban green infrastructure generally decreased, with a few instances of slight increases, while there was a noticeable rise in land-use temperatures. The findings and observed green patterns and their potential impacts on urban heat are discussed below for each project site and surrounding area.
Specifically, the Tarlabaşı UT c) project resulted in an increase in impervious areas as the construction base area was reduced, leading to vertical construction. The Tarlabaşı neighborhood is situated in the city center, a popular tourist destination with high property values, motivating the project developers to increase the construction area and jeopardize the main impetus of UT projects (Arıcan, 2020; Tsavdaroglou, 2020). Thus, the UT project in this area is the only one with decreased green infrastructure. Moreover, as seen in Figure 2, due to the proximity of the surrounding neighborhoods to the urban green areas (e.g., Taksim Gezi Park and other green amenities developed by private owners and the Istanbul Metropolitan Municipality), we observe an increase in green infrastructure in the surrounding neighborhoods. However, the positive change in green infrastructure did not affect land heat temperatures. Although an increase in green infrastructure often helps mitigate the SUHI effect, as in the cases of Cendere a), Sarıgöl b), Fikirtepe d), and Kartal e) UT projects, the relationship between green infrastructure and land-surface heat temperatures also depends on various other factors, including urban forms and soil types. The absorption of heat due to old and dense urban infrastructure, such as buildings and highways (Connors et al., 2013), in the Tarlabaşı neighborhood may explain the positive correlation between the increase in green infrastructure and land surface heat.
Although the increase in green infrastructure is an observable trend among most of the UT projects in Istanbul, the locations of these UTs and the distribution of green amenities require closer attention. Specifically, the literature highlights that the Cendere a) and Kartal e) UTs are located on old industrial lands (Çalışkan, 2017; Aybar and Dokmeci, 2022; Kırtaş and Tomruk, 2022). As seen in Figure 2, Cendere UT is located near urban forestry, and more than half of the UT areas are divided from the surrounding neighborhoods by a large highway. Therefore, the benefits of the green infrastructures are limited to those who can afford to live within the gated communities of Cendere UT areas. The Kartal UT project is also a large-scale comprehensive UT project aiming to transform old industrial sites into alternative economic and service centers for the metropolitan area with a special emphasis on open green spaces (Çalışkan, 2017). This objective is reflected in high NDVI values throughout the analysis. Yet, unlike the Cendere case, the Kartal UT project is located in the middle of existing and old residential areas in the district, potentially exacerbating the heat impacts among the urban population living outside the UT areas.
Finally, the Sarıgöl b) and Fikirtepe d) UT projects are the most studied and cited cases in the literature as both cases resulted in the forced evictions of socio-economically vulnerable groups due to complex land tenure system and state-driven planned gentrification. The two cases are located closer to the city center, major transportation, and trade hubs in the metropolitan areas that attract wealthy locals and international investors (Ceker and Belge, 2015). Researchers also documented green gentrification, especially in the Sarıgöl neighborhood, where buildings with sustainability aims and energy efficiency certifications are created for gated communities that exclude locals who could benefit from these ambitious green visions (Yazar et al., 2020). This study cannot conduct further temporal analyses, changes over time, due to limited socio-demographic and real-estate data for the five selected cases. Nevertheless, future studies must pay more attention to the pitfalls of urban transformation projects that may lead to green and climate gentrification in Istanbul.
6 Limitation of the study
The existing power disparities in land-use policy decision-making and urban climate governance structures prioritize the policy agenda of powerful local and national elites. Policymakers must recognize the unequal outcomes of their land-use planning and implementations. In this context, it becomes crucial to identify and acknowledge the diverse needs of vulnerable individuals and groups in cities. However, the authors acknowledge that this study heavily relies on the observation of NDVI and LST-based variables due to the unavailability of socio-demographic data in the selected districts of Istanbul from 2013 to 2021. Therefore, the authors recommend further studies to leverage NDVI and LST-based data, along with a dynamic analysis (including time dimension aspects) to assess population exposure and vulnerability concerning green divide and heat exposures at the level of the UT and surrounding areas in various urban contexts.
7 Conclusion
Cities that are taking steps towards climate adaptation and mitigation should take into account the significant variation in urban transformation, zoning, and planning that directly affect urban populations’ adaptive capacity. Urban transformation projects and planning can either hinder or foster people`s adaptation to withstand and recover from the climate exposures, such as extreme heat. By utilizing NDVI and LST analyses for the five selected urban transformation areas and their surrounding neighborhoods in Istanbul, it is possible to explicitly explore the effects of green infrastructure on urban heat and connect risk potentials to communities living outside of increased green amenities. Environmental and climate-change-driven risks must be critical considerations in urban zoning, planning, and policies. The goals of curbing urban growth can be separate from preserving and developing green infrastructure, which is an essential coping strategy for dealing with extreme weather impacts triggered by changing climate conditions.
In cities with high populations and building structures, such as Istanbul, targeted actions for recognizing and reducing urban infrastructure-related vulnerabilities may need to focus on larger geographical scales centred on green development interventions and their distributions. This study illustrates the importance of GIS-based analyses encompassing multi-scalar aspects of green infrastructures and their impacts on vulnerable urban communities. Nature-based solutions are still not mainstreamed in planning and governing practices of global cities. In this special issue, we argue that nature-based practices, such as increasing green infrastructure, require inclusive planning and governance to identify potential spatial injustices that may be perpetuated by these nature-based practices. Against this backdrop, green infrastructures must be accessible and beneficial to urban residents without becoming an exclusive concept for the affluent. Further studies must pay more attention to the pitfalls of urban transformation projects that lead to green and climate gentrification in different cities exposed similarly to climate change.
Data availability statement
The raw data supporting the conclusion of this article will be made available by the authors, without undue reservation.
Author contributions
MY: Conceptualization, Formal Analysis, Investigation, Methodology, Supervision, Writing–original draft, Writing–review and editing. ID: Methodology, Validation, Writing–original draft, Writing–review and editing. MI: Data curation, Methodology, Software, Writing–review and editing. SB: Methodology, Software, Visualization, Writing–review and editing.
Funding
The author(s) declare that no financial support was received for the research, authorship, and/or publication of this article.
Conflict of interest
The authors declare that the research was conducted in the absence of any commercial or financial relationships that could be construed as a potential conflict of interest.
Publisher’s note
All claims expressed in this article are solely those of the authors and do not necessarily represent those of their affiliated organizations, or those of the publisher, the editors and the reviewers. Any product that may be evaluated in this article, or claim that may be made by its manufacturer, is not guaranteed or endorsed by the publisher.
References
Anguelovski, I. (2016). From toxic sites to parks as (green) LULUs? New challenges of inequity, privilege, gentrification, and exclusion for urban environmental justice. J. Plan. literature 31 (1), 23–36. doi:10.1177/0885412215610491
Arıcan, A. (2020). Behind the scaffolding: manipulations of time, delays, and power in Tarlabaşı, Istanbul. City and Soc. 32 (3), 482–507. doi:10.1111/ciso.12348
Aybar, N., and Dokmeci, V. (2022). Dynamic analysis of Istanbul office markets with highest demand and office rent. J. Des. Resil. Archit. Plan. 3 (2), 171–182. doi:10.47818/DRArch.2022.v3i2051
Bahadur, A. V., and Tanner, T. (2014). Policy climates and climate policies: analysing the politics of building urban climate change resilience. Urban Clim. 7, 20–32. doi:10.1016/j.uclim.2013.08.004
Bolin, B., Barreto, J. D., Hegmon, M., Meierotto, L., and York, A. (2013). Double exposure in the sunbelt: the sociospatial distribution of vulnerability in Phoenix, Arizona. Environ. justice Glob. Environ. change 2013, 159–178. doi:10.1007/978-94-007-5666-3_10
Bolitho, A., and Miller, F. (2017). Heat as emergency, heat as chronic stress: policy and institutional responses to vulnerability to extreme heat. Local Environ. 22 (6), 682–698. doi:10.1080/13549839.2016.1254169
Boone, C. G., Buckley, G. L., Grove, J. M., and Sister, C. (2009). Parks and people: an environmental justice inquiry in Baltimore, Maryland. Ann. Assoc. Am. Geogr. 99 (4), 767–787. doi:10.1080/00045600903102949
Brand, A. L., and Baxter, V. (2020). “Post-disaster development dilemmas: advancing landscapes of social justice in a neoliberal post-disaster landscape,” in Louisiana’s Response to Extreme Weather: A Coastal State’s Adaptation Challenges and Successes, 217–240.
Çalışkan, O. (2017). Parametric design in urbanism: a critical reflection. Plan. Pract. Res. 32 (4), 417–443. doi:10.1080/02697459.2017.1378862
Carlson, T. N., and Ripley, D. A. (1997). On the relation between NDVI, fractional vegetation cover, and leaf area index. Remote Sens. Environ. 62 (3), 241–252. doi:10.1016/S0034-4257(97)00104-1
Carrillo-Niquete, G. A., Andrade, J. L., Valdez-Lazalde, J. R., Reyes-García, C., and Hernández-Stefanoni, J. L. (2022). Characterizing spatial and temporal deforestation and its effects on surface urban heat islands in a tropical city using Landsat time series. Landsc. Urban Plan. 217, 104280. doi:10.1016/j.landurbplan.2021.104280
Çeker, A., and Belge, R. (2015). İstanbul’da kentsel dönüşüm kapsamında gerçekleşen bir olgu: soylulaştırma. Türk Coğrafya Derg. 0 (65), 77–86. doi:10.17211/tcd.30494
Chow, W. T., Chuang, W. C., and Gober, P. (2012). Vulnerability to extreme heat in metropolitan Phoenix: spatial, temporal, and demographic dimensions. Prof. Geogr. 64 (2), 286–302. doi:10.1080/00330124.2011.600225
Cong, C., Pan, H., Page, J., Barthel, S., and Kalantari, Z. (2023). Modeling place-based nature-based solutions to promote urban carbon neutrality. Ambio 52 (8), 1297–1313. doi:10.1007/s13280-023-01872-x
Connors, J. P., Galletti, C. S., and Chow, W. T. (2013). Landscape configuration and urban heat island effects: assessing the relationship between landscape characteristics and land surface temperature in Phoenix, Arizona. Landsc. Ecol. 28, 271–283. doi:10.1007/s10980-012-9833-1
Curran, W., and Hamilton, T. (2012). Just green enough: contesting environmental gentrification in Greenpoint, Brooklyn. Local Environ. 17 (9), 1027–1042. doi:10.1080/13549839.2012.729569
de Jong, R., de Bruin, S., de Wit, A., Schaepman, M. E., and Dent, D. L. (2011). Analysis of monotonic greening and browning trends from global NDVI time-series. Remote Sens. Environ. 115 (2), 692–702. doi:10.1016/j.rse.2010.10.011
Depietri, Y. (2022). Planning for urban green infrastructure: addressing tradeoffs and synergies. Curr. Opin. Environ. Sustain. 54, 101148. doi:10.1016/j.cosust.2021.12.001
Dialesandro, J., Brazil, N., Wheeler, S., and Abunnasr, Y. (2021). Dimensions of thermal inequity: neighborhood social demographics and urban heat in the Southwestern US. Int. J. Environ. Res. public health 18 (3), 941. doi:10.3390/ijerph18030941
Dodman, D., Hayward, B., Pelling, M., Castan Broto, V., Chow, W., Chu, E., et al. (2022). “Cities, settlements and key infrastructure,” in Climate change 2022: impacts, Adaptation and vulnerability. Contribution of working group II to the sixth assessment report of the intergovernmental panel on climate change. Editors H. O. Portner, D. C. Roberts, M. Tignor, E. S. Poloczanska, K. Mintenbeck, A. Alegríaet al. (Cambridge, UK and New York, NY, USA: Cambridge University Press), 907–1040. doi:10.1017/9781009325844.008
Dooling, S. (2009). Ecological gentrification: a research agenda exploring justice in the city. Int. J. urban regional Res. 33 (3), 621–639. doi:10.1111/j.1468-2427.2009.00860.x
Durmaz, N. (2015). Urban transformation by the disaster law and reactions of inhabitants in Tozkoparan and Sarıgöl (Istanbul). Les. Cah. d’EMAM 27. doi:10.4000/emam.1170
Erdem Okumus, D., and Terzi, F. (2021). Evaluating the role of urban fabric on surface urban heat island: the case of Istanbul. Sustain. Cities Soc. 73, 103128. doi:10.1016/J.SCS.2021.103128
Fainstein, S. S. (2018). “Resilience and justice: planning for New York City,” in The resilience machine (Routledge), 159–176.
Gill, S. E., Handley, J. F., Ennos, A. R., and Pauleit, S. (2007). Adapting cities for climate change: the role of the green infrastructure. Built Environ. 33 (1), 115–133. doi:10.2148/benv.33.1.115
Gorelick, N., Hancher, M., Dixon, M., Ilyushchenko, S., Thau, D., and Moore, R. (2017). Google Earth engine: planetary-scale geospatial analysis for everyone. Remote Sens. Environ. 202, 18–27. doi:10.1016/j.rse.2017.06.031
Goward, S. N., Xue, Y., and Czajkowski, K. P. (2002). Evaluating land surface moisture conditions from the remotely sensed temperature/vegetation index measurements: an exploration with the simplified simple biosphere model. Remote Sens. Environ. 79 (2-3), 225–242. doi:10.1016/s0034-4257(01)00275-9
Guha, S., and Govil, H. (2022). Annual assessment on the relationship between land surface temperature and six remote sensing indices using Landsat data from 1988 to 2019. Geocarto Int. 37 (15), 4292–4311. doi:10.1080/10106049.2021.1886339
Güzey, Ö. (2016). The last round in restructuring the city: urban regeneration becomes a state policy of disaster prevention in Turkey. Cities 50, 40–53. doi:10.1016/j.cities.2015.08.010
Halder, B., Karimi, A., Mohammad, P., Bandyopadhyay, J., Brown, R. D., and Yaseen, Z. M. (2022). Investigating the relationship between land alteration and the urban heat island of Seville city using multi-temporal Landsat data. Theor. Appl. Climatol. 150 (1–2), 613–635. doi:10.1007/s00704-022-04180-8
Harlan, S. L., and Ruddell, D. M. (2011). Climate change and health in cities: impacts of heat and air pollution and potential co-benefits from mitigation and adaptation. Curr. Opin. Environ. Sustain. 3 (3), 126–134. doi:10.1016/j.cosust.2011.01.001
Horwood, K. (2011). Green infrastructure: reconciling urban green space and regional economic development: lessons learnt from experience in England's north-west region. Local Environ. 16 (10), 963–975. doi:10.1080/13549839.2011.607157
Hsu, A., Sheriff, G., Chakraborty, T., and Manya, D. (2021). Disproportionate exposure to urban heat island intensity across major US cities. Nat. Commun. 12 (1), 2721. doi:10.1038/s41467-021-22799-5
Iban, M. C. (2020). Lessons from approaches to informal housing and non-compliant development in Turkey: an in-depth policy analysis with a historical framework. Land Use Policy 99, 105104. doi:10.1016/j.landusepol.2020.105104
Ju, Y., Dronova, I., and Delclòs-Alió, X. (2022). A 10 m resolution urban green space map for major Latin American cities from Sentinel-2 remote sensing images and OpenStreetMap. Sci. Data 9 (1), 586. doi:10.1038/s41597-022-01701-y
Kearl, Z., and Vogel, J. (2023). Urban extreme heat, climate change, and saving lives: lessons from Washington state. Urban Clim. 47, 101392. doi:10.1016/j.uclim.2022.101392
Kırtaş, E. E., and Tomruk, B. (2022). Kentsel mekanın değişimi: ayazağa mahallesi örneği. III. Kentsel Morfoloji Sempozyumu Bildiriler Kitabı, 875–894.
Kuokkanen, A., and Yazar, M. (2018). Cities in sustainability transitions: comparing Helsinki and Istanbul. Sustainability 10 (5), 1421. doi:10.3390/su10051421
Langemeyer, J., Wedgwood, D., McPhearson, T., Baró, F., Madsen, A. L., and Barton, D. N. (2020). Creating urban green infrastructure where it is needed–A spatial ecosystem service-based decision analysis of green roofs in Barcelona. Sci. total Environ. 707, 135487. doi:10.1016/j.scitotenv.2019.135487
Leach, M. (2015). “What Is Green? transformation imperatives and knowledge politics,” in The politics of green transformations (Routledge), 25–38.
Lee, T., and Hughes, S. (2017). Perceptions of urban climate hazards and their effects on adaptation agendas. Mitig. Adapt. Strategies Glob. Change 22, 761–776. doi:10.1007/s11027-015-9697-1
Lemoine-Rodríguez, R., Inostroza, L., and Zepp, H. (2022). Intraurban heterogeneity of space-time land surface temperature trends in six climate-diverse cities. Sci. Total Environ. 804, 150037. doi:10.1016/j.scitotenv.2021.150037
Lemos, M. C., Lo, Y. J., Nelson, D. R., Eakin, H., and Bedran-Martins, A. M. (2016). Linking development to climate adaptation: leveraging generic and specific capacities to reduce vulnerability to drought in NE Brazil. Glob. Environ. Change 39, 170–179. doi:10.1016/j.gloenvcha.2016.05.001
Li, H., and Grant, R. J. (2022). Climate gentrification in Miami: A real climate change-minded investment practice? Cities 131, 104025. doi:10.1016/j.cities.2022.104025
Locke, D. H., Hall, B., Grove, J. M., Pickett, S. T., Ogden, L. A., Aoki, C., et al. (2021). Residential housing segregation and urban tree canopy in 37 US Cities. npj urban Sustain. 1 (1), 15. doi:10.1038/s42949-021-00022-0
Low, S. (2013). Public space and diversity: distributive, procedural and interactional justice for parks. Ashgate Res. companion Plan. Cult. 2013, 295–310.
Lundgren, K., Kuklane, K., Gao, C., and Holmer, I. (2013). Effects of heat stress on working populations when facing climate change. Ind. health 51 (1), 3–15. doi:10.2486/indhealth.2012-0089
Mabon, L., and Shih, W. Y. (2018). What might ‘just green enough’ urban development mean in the context of climate change adaptation? The case of urban greenspace planning in Taipei Metropolis, Taiwan. World Dev. 107, 224–238. doi:10.1016/j.worlddev.2018.02.035
Maia, A. T. A., Calcagni, F., Connolly, J. J. T., Anguelovski, I., and Langemeyer, J. (2020). Hidden drivers of social injustice: uncovering unequal cultural ecosystem services behind green gentrification. Environ. Sci. Policy 112, 254–263. doi:10.1016/j.envsci.2020.05.021
MEGAISTANBUL (2023). Megaprojeleristanbul. Retrieved from: http://en.megaprojeleristanbul.com/(Accessed on April 3, 2023).
Mital, A. (2023). Change in environmental justice scores in historically redlined communities compared to non-redlined communities: a case study of Richmond, Virginia. Urban Clim. 49, 101505. doi:10.1016/j.uclim.2023.101505
Open Data Commons (2023). Opendatacommons. Retrieved from: http://opendatacommons.org/licenses/odbl/1.0/(Accessed on April 3, 2023).
Pan, H., Page, J., Shi, R., Cong, C., Cai, Z., Barthel, S., et al. (2023). Contribution of prioritized urban nature-based solutions allocation to carbon neutrality. Nat. Clim. Change 13 (8), 862–870. doi:10.1038/s41558-023-01737-x
Pearsall, H. (2010). From brown to green? Assessing social vulnerability to environmental gentrification in New York City. Environ. Plan. C Gov. Policy 28 (5), 872–886. doi:10.1068/c08126
Pettorelli, N., Vik, J. O., Mysterud, A., Gaillard, J. M., Tucker, C. J., and Stenseth, N. C. (2005). Using the satellite-derived NDVI to assess ecological responses to environmental change. Trends Ecol. Evol. 20 (9), 503–510. doi:10.1016/j.tree.2005.05.011
Rakoto, P. Y., Deilami, K., Hurley, J., Amati, M., and Sun, Q. (2021). Revisiting the cooling effects of urban greening: planning implications of vegetation types and spatial configuration. Urban For. Urban Green. 64, 127266. doi:10.1016/j.ufug.2021.127266
Schlosberg, D. (2004). Reconceiving environmental justice: global movements and political theories. Environ. Polit. 13 (3), 517–540. doi:10.1080/0964401042000229025
Sekertekin, A., and Bonafoni, S. (2020a). Sensitivity analysis and validation of daytime and nighttime land surface temperature retrievals from Landsat 8 using different algorithms and emissivity models. Remote Sens. 12 (17), 2776. doi:10.3390/rs12172776
Sekertekin, A., and Bonafoni, S. (2020b). Land surface temperature retrieval from Landsat 5, 7, and 8 over rural areas: assessment of different retrieval algorithms and emissivity models and toolbox implementation. Remote Sens. 12 (2), 294. doi:10.3390/rs12020294
Shahtahmassebi, A. R., Li, C., Fan, Y., Wu, Y., lin, Y., Gan, M., et al. (2021). Remote sensing of urban green spaces: a review. Urban For. Urban Green. 57, 126946. doi:10.1016/j.ufug.2020.126946
Smith, J. P., Li, X., and Turner, B. L. (2017). Lots for greening: identification of metropolitan vacant land and its potential use for cooling and agriculture in Phoenix, AZ, USA. Appl. Geogr. 85, 139–151. doi:10.1016/j.apgeog.2017.06.005
Sobrino, J. A., Jimenez-Munoz, J. C., Soria, G., Romaguera, M., Guanter, L., Moreno, J., et al. (2008). Land surface emissivity retrieval from different VNIR and TIR sensors. IEEE Trans. Geoscience Remote Sens. 46 (2), 316–327. doi:10.1109/TGRS.2007.904834
Song, D. X., Wang, Z., He, T., Wang, H., and Liang, S. (2022). Estimation and validation of 30 m fractional vegetation cover over China through integrated use of Landsat 8 and Gaofen 2 data. Sci. Remote Sens. 6, 100058. doi:10.1016/j.srs.2022.100058
Stuhlmacher, M., Kim, Y., and Kim, J. E. (2022). The role of green space in Chicago’s gentrification. Urban For. Urban Green. 71, 127569. doi:10.1016/j.ufug.2022.127569
Tarakci, S., and Turk, S. S. (2022). Public value capturing in urban renewal: the fikirtepe case (Istanbul, Turkey). J. Hous. Built Environ. 37 (1), 125–155. doi:10.1007/s10901-021-09849-6
Tsavdaroglou, C. (2020). The refugees’ right to the center of the city and spatial justice: gentrification vs commoning practices in tarlabaşı-istanbul. Urban Plan. 5 (3), 230–240. doi:10.17645/up.v5i3.3098
Turgut, H. (2021). Istanbul: the city as an urban palimpsest. Cities 112, 103131. doi:10.1016/J.CITIES.2021.103131
Ünsal, T. (2023). The regressive planning practice of private sector planners under the pressure of political and market forces in Turkey. Eur. Plan. Stud. 31 (2), 287–305. doi:10.1080/09654313.2022.2049217
USGS (2013). Landsat missions: Landsat collection 2 level 2 science products. Available at: https://www.usgs.gov/landsat-missions/landsat-collection-2-level-2-science-products.
Venter, Z. S., Figari, H., Krange, O., and Gundersen, V. (2023). Environmental justice in a very green city: spatial inequality in exposure to urban nature, air pollution and heat in Oslo, Norway. Sci. Total Environ. 858, 160193. doi:10.1016/j.scitotenv.2022.160193
Waters, J., and Adger, W. N. (2017). Spatial, network and temporal dimensions of the determinants of adaptive capacity in poor urban areas. Glob. Environ. Change 46, 42–49. doi:10.1016/j.gloenvcha.2017.06.011
Wu, L., and Rowe, P. G. (2022). Green space progress or paradox: identifying green space associated gentrification in Beijing. Landsc. Urban Plan. 219, 104321. doi:10.1016/j.landurbplan.2021.104321
Xu, C., Chen, G., Huang, Q., Su, M., Rong, Q., Yue, W., et al. (2022a). Can improving the spatial equity of urban green space mitigate the effect of urban heat islands? An empirical study. Sci. Total Environ. 841, 156687. doi:10.1016/j.scitotenv.2022.156687
Xu, F., Yan, J., Heremans, S., and Somers, B. (2022b). Pan-European urban green space dynamics: a view from space between 1990 and 2015. Landsc. Urban Plan. 226, 104477. doi:10.1016/j.landurbplan.2022.104477
Yazar, M. (2023). Norm domestication challenges for local climate actions: a lesson from Arizona, USA. Environ. Policy Gov. 33 (4), 386–397. doi:10.1002/eet.2038
Yazar, M., Hestad, D., Mangalagiu, D., Saysel, A. K., Ma, Y., and Thornton, T. F. (2020). From urban sustainability transformations to green gentrification: urban renewal in Gaziosmanpaşa, Istanbul. Clim. Change 160, 637–653. doi:10.1007/s10584-019-02509-3
Yazar, M., and York, A. (2021). Urban climate governance under the national government shadow: evidence from Istanbul. J. Urban Aff. 45, 1265–1281. doi:10.1080/07352166.2021.1915151
Yazar, M., and York, A. (2022). Disentangling justice as recognition through public support for local climate adaptation policies: insights from the Southwest US. Urban Clim. 41, 101079. doi:10.1016/j.uclim.2021.101079
Yazar, M., and York, A. (2023). Nature-based solutions through collective actions for spatial justice in urban green commons. Environ. Sci. Policy 145, 228–237. doi:10.1016/j.envsci.2023.04.016
Keywords: urban transformation, green infrastructure, urban heat, environmental justice, istanbul
Citation: Yazar M, Daloglu Cetinkaya I, Iban MC and Bilgilioglu SS (2023) The green divide and heat exposure: urban transformation projects in istanbul. Front. Environ. Sci. 11:1265332. doi: 10.3389/fenvs.2023.1265332
Received: 22 July 2023; Accepted: 13 November 2023;
Published: 23 November 2023.
Edited by:
Danlu Cai, Chinese Academy of Sciences (CAS), ChinaReviewed by:
Haozhi Pan, Shanghai Jiao Tong University, ChinaAliihsan Sekertekin, Iğdır Üniversitesi, Türkiye
Copyright © 2023 Yazar, Daloglu Cetinkaya, Iban and Bilgilioglu. This is an open-access article distributed under the terms of the Creative Commons Attribution License (CC BY). The use, distribution or reproduction in other forums is permitted, provided the original author(s) and the copyright owner(s) are credited and that the original publication in this journal is cited, in accordance with accepted academic practice. No use, distribution or reproduction is permitted which does not comply with these terms.
*Correspondence: Mahir Yazar, TWFoaXIuWWF6YXJAdWliLm5v