 Roy E. Petrakis
95% of researchers rate our articles as excellent or good
Learn more about the work of our research integrity team to safeguard the quality of each article we publish.
Find out more
ORIGINAL RESEARCH article
Front. Environ. Sci. , 04 July 2023
Sec. Environmental Informatics and Remote Sensing
Volume 11 - 2023 | https://doi.org/10.3389/fenvs.2023.1179328
This article is part of the Research Topic Advances in Characterizing and Monitoring Land Cover/Use and Associated Ecosystem Changes Using Remote Sensing Data View all 13 articles
Riparian systems across the Southwest United States are extremely valuable for the human and ecological communities that engage with them. However, they have experienced substantial changes and stresses over the past century, including non-native vegetation expansion, vegetation die-offs, and increased fire activity. Vegetation management approaches, such as ecological restoration, may address some of these stressors as well as reduce the risk of future impacts. We apply remote sensing to inform restoration priorities along the upper Gila River within the San Carlos Apache Reservation and Upper Gila River watershed. First, we develop a spatially and temporally explicit trend analysis across three observed climate periods (1985–1993, 1993–2014, 2014–2021) using the Landsat-derived indices to quantify changes in riparian vegetation conditions. These maps can be used to identify areas potentially more at risk for degradation. Second, we analyze changes in riparian vegetation within a climate framework to better understand trends and the potential effect of climate change. Vegetation greenness has largely increased throughout the watershed despite intensifying drought conditions across our study period, though areas within the lower watershed have shown increased stress and higher rates of wildfire and other disturbances over the past 5-years. Nevertheless, small-scale restoration activities appear to show improving vegetation conditions, suggesting efficacy of these restoration activities. Results from this study may be integrated with restoration objectives to develop a restoration plan that will help riparian vegetation communities adapt to change.
The Upper Gila River watershed is an ecologically important riverine system in the Southwest United States (US) that is being impacted by natural and anthropogenic stressors, including invasion by non-native plants, flooding, wildfire, urban encroachment, and various land- and water-use activities (Banister et al., 2014; Orr et al., 2014). Draining from western New Mexico into eastern Arizona, the Gila River and its primary tributaries flow nearly unobstructed from the headwaters to the San Carlos Reservoir at the western edge of the watershed (Huckleberry, 1996). The watershed provides numerous ecosystem services including water for human and agricultural uses, habitat for endangered species such as the southwestern willow flycatcher (Empidonax traillii extimus), and recreational opportunities (Banister et al., 2014; Eppehimer et al., 2021).
The riparian vegetation is highly complex and dynamic throughout the Upper Gila River watershed and is comprised of numerous native and non-native tree, shrub, and grass species (Orr et al., 2014). Primarily, non-native and invasive tamarisk (Tamarix) serves as the dominant vegetation type across much of the lower portion of the Upper Gila River watershed and outcompetes native vegetation (Orr et al., 2014). Tamarisk is widely viewed as a principal restoration objective because of its threat to the biodiversity of riparian systems (Harms and Hiebert, 2006). However, many native species such as Fremont cottonwood (Populus fremontii), Goodding’s willow (Salix gooddingii), and mesquite (Prosopis), among others are also present. In the upper portion of the watershed, native species primarily dominate (Kindscher, 2011).
The Southwest US experiences a bi-modal precipitation regime, consisting of a cold winter precipitation season running from December through March and a hot summer monsoon season from July through September (Adams and Comrie, 1997; Jacobs et al., 2005). Winter storms originating in the Pacific Ocean typically provide longer-term, light rainfall events while summer storms during the monsoon season generally provide short-term, isolated, high-intensity precipitation events (Orr et al., 2014). The spring and fall are typically warm and dry (Eppehimer et al., 2021). Numerous wet and dry periods have occurred across the Southwest US and the Upper Gila Watershed over the past century. However, the Southwest US has experienced extended and intensifying drought conditions over the past 2 decades resulting in reductions in both areal surface water and groundwater resources (MacDonald et al., 2008; Seager et al., 2013; Cook et al., 2015; Williams et al., 2020; Petrakis et al., 2022).
Land within the Upper Gila River Watershed is owned and managed by numerous organizations and private landowners, including federal organizations such as the U.S. Forest Service (USFS) and Bureau of Land Management (BLM), the state land offices of Arizona and New Mexico, the San Carlos Apache Tribe, and private owners, among others (BLM, 2020). This has resulted in numerous approaches to land management over time throughout the watershed, though several mandates across federal, state, and local jurisdictions including the Clean Water Act, the National Environmental Policy Act, and the Endangered Species Act, govern both water and environmental uses (UArizona WRRC, 2022). Local Non-Governmental Organizations (NGOs) are also engaged in restoration within the watershed with the purpose of either re-establishing and planting of native species, controlling the impacts of invasive plant species, improving water quality, or addressing ecosystem water stress (Stillwater Sciences and UArizona WRRC, 2018; Eppehimer et al., 2021).
Sitting within a scrub-grassland basin with headwaters located in the forested uplands of the Gila Mountains, agriculture is, and has been since the mid-20th century, a primary land use across large portions of the Gila River floodplain (Orr et al., 2014), including near the urban centers of San Carlos (AZ), Safford (AZ), Duncan (AZ), and Gila (NM) (NLCD, 2016).
Remote sensing can support analyses of long-term changes on the landscape at a broad scale and advance our knowledge of the direct relationship between climate conditions and the ecosystem (Kerr and Ostrovsky, 2003; Pettorelli et al., 2014; AghaKouchak et al., 2015). For instance, riparian vegetation has been effectively monitored using satellite imagery and other remotely sensed data analyses and sources (Macfarlane et al., 2017; Petrakis et al., 2017; Hartfield et al., 2020; Huylenbroeck et al., 2020; Norman et al., 2006). Recent developments in cloud computing environments have allowed for broadened studies to assess land changes across large areas over extended time periods (Gorelick et al., 2017; Wang et al., 2020). The full suite of Landsat satellite imagery, for instance, is available through Google Earth Engine (GEE) (Google Earth Engine, 2022b). These data can be analyzed to provide an overview of multitemporal conditions across numerous disciplines (Tamiminia et al., 2020).
On the San Carlos Apache Reservation, riparian areas provide significant cultural and natural value but are at risk of degradation resulting from changes in climate and land use. We collaborate with the San Carlos Apache Tribe (hereafter Tribe or Tribal) to apply a research approach that can inform riparian restoration planning by developing products that show: i) recent trends (i.e., 1985 through 2021): in vegetation conditions identifying areas potentially more at risk for degradation and ii) the associated relationship between riparian vegetation dynamics and climate conditions. Additionally, based on discussions with employees of the Tribe, we identified three resource management and disturbance-themed case studies that directly associate vegetation dynamics with climate. Once the effects of varied climatic events are correlated with riparian response over time, adjustments in the management of the riparian corridor can be developed in response to expected future climatic stimuli. Informing riparian vegetation response based on historical data, tribal insight, and climate adaptation could serve as an early-warning system to benefit the management of the natural and cultural resources they provide and help the landscape become more resilient.
Our analysis is focused on a suite of riparian zones within the Upper Gila River level-4 Hydrologic Unit Code (HUC-4) watershed (Seaber et al., 1987; USGS NHD, 2020) (Figure 1; Table 1). Specifically, our primary study site is the riparian zones located along both the San Carlos River and Gila River within the San Carlos Apache Reservation (hereafter San Carlos and Bylas Reach, respectively) (Figure 1). In addition, we include select riparian zones along the Gila River and main tributaries within the Upper Gila River watershed for comparison of broad conditions (Figure 1). Each primary and comparison riparian zone (n = 8) is described in Table 1.
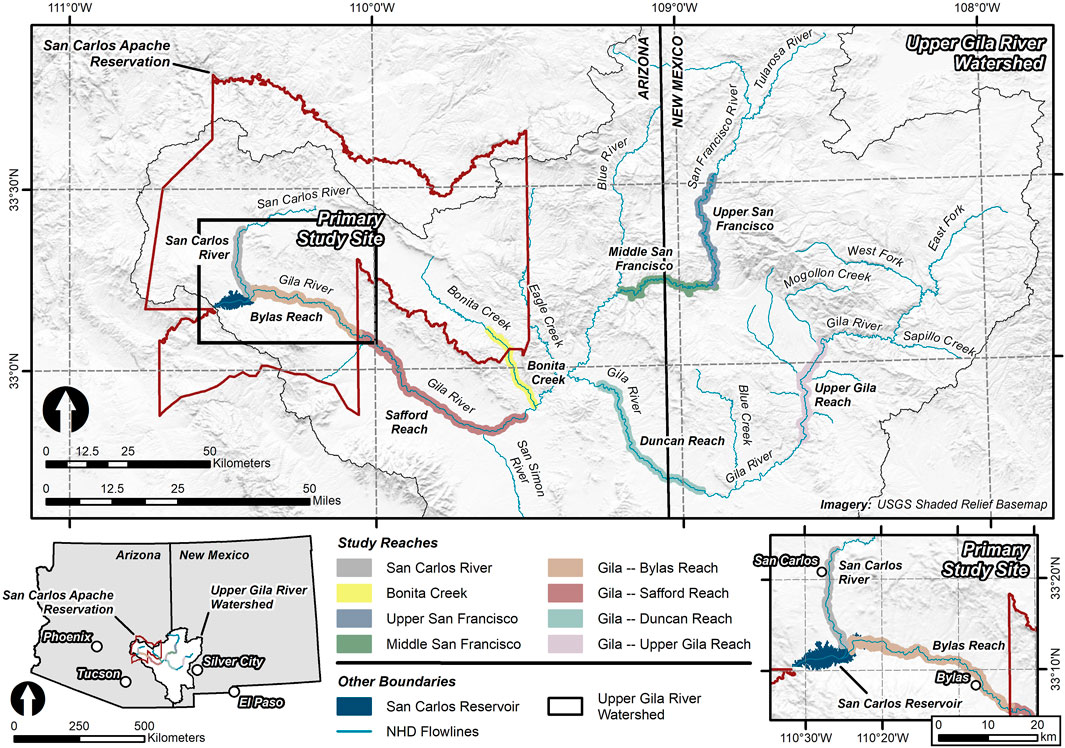
FIGURE 1. A map showing the primary study site, including the San Carlos River and Bylas Reach of the Gila River. Other study reaches along the Upper Gila River, the San Francisco River, and Bonita Creek within the Upper Gila River watershed were also addressed in this study. Flowlines and the boundary for the Upper Gila River watershed were produced by the National Hydrography Dataset (NHD) (USGS NHD, 2020).
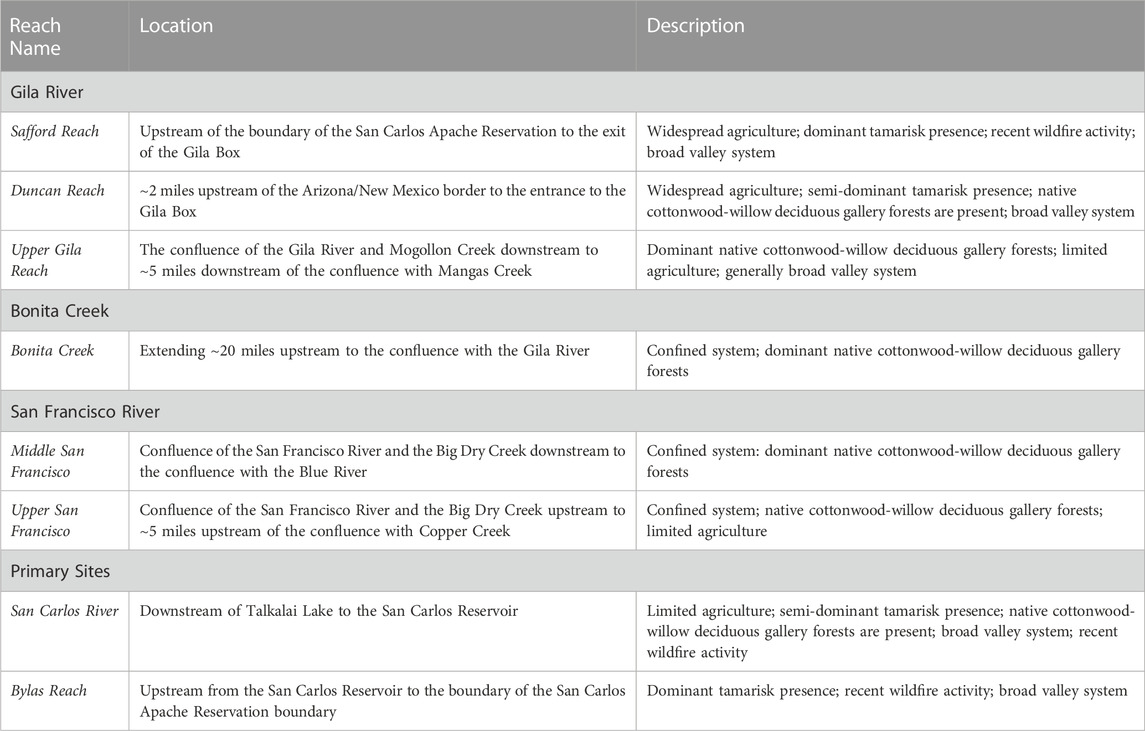
TABLE 1. Names, locations, and descriptions of the comparison and primary riparian zones considered in this study.
Similarities can be drawn between the collection of study reaches based on their vegetative and geographic properties. For instance, agricultural activity surrounds a large portion of the riparian zone along the Safford and Duncan reaches; agriculture can also be found, though less prevalent, across portions of the San Carlos, Upper Gila, and Upper San Francisco reaches (Dewitz and USGS, 2021).
Non-native tamarisk is also present throughout many of the reaches and is the dominant species across the Bylas and Safford reaches (Orr et al., 2014). We found tamarisk to be dominant across portions of the San Carlos and Duncan reaches, though not universally, via a visual analysis of high-resolution U.S. Department of Agricultural National Agriculture Imagery Program (NAIP; ∼0.6 m resolution) imagery (USDA, 2021). In addition, native cottonwood-willow deciduous gallery forests are identified across many of the reaches, including the San Carlos and Duncan reaches. Similarly, both San Francisco reaches, Bonita Creek, and the Upper Gila Reach are characterized as having dominant native gallery forests within the riparian zone.
Transverse geographic profiles, based on a 30-m Digital Elevation Model (DEM) layer (USGS, 2017), were used to define these reaches, where some reaches have wide floodplains with generally low slopes (i.e., broad valley systems) (Green, 2007). This includes the Safford, Bylas, Duncan, and San Carlos reaches, where mean slope within 1 km extending from the edge of the riparian zone is 2°, 4.2°, 5°, and 5.1°, respectively (USGS, 2017). Other reaches are characterized as being surround by canyon-like structures with narrow floodplains (i.e., confined systems) (Green, 2007), including the Middle San Francisco (mean slope = 24.9°), Bonita Creek (16.3°), and the Upper San Francisco River (13°) reaches (USGS, 2017). We identified the Upper Gila Reach has having moderate mean slope (10.4°), though much of the riparian zone consists of lower slope landscapes using the DEM (USGS, 2017). This contrast in geographic profile can have implications on vegetation traits, hydrologic flows, and surrounding land use such as agriculture and urban development (Naiman and Décamps, 1997; Green, 2007).
Lastly, wildfire has become a prominent disturbance across the San Carlos, Bylas, and Safford reaches over the past several years (San Carlos Apache Tribe, personal communication, January 2022). In addition, the tamarisk beetle (Diorhabda), which defoliates the non-native tamarisk vegetation (Kennard et al., 2016), has been identified throughout portions of the Upper Gila River watershed (RiversEdge West, 2021), though there is no formal documentation of the beetle within the Reservation during our study period (San Carlos Apache Tribe, personal communication, January 2023). Wildfire and beetle disturbances could impact the results of this remote sensing study by directly affecting vegetation conditions (Dennison et al., 2009; Fairfax and Whittle, 2020).
Input from San Carlos Apache Tribe members and employees of Tribal departments, including the Forest Resources Program, the Department of Environmental Protection, and the Range Program, was used to structure research objectives and restoration priorities. Specifically, we held multiple virtual and in-person meetings with Tribal members that were structured to meet the following two objectives: i) provide an update on the status of this project and ii) identify and discuss issues and/or concerns voiced by employees and leaders of the Tribal programs related to the study thus far, the landscape, and/or the management. Following the update, an open discussion was held focusing on issues related to Tribal concerns. Based on feedback from Tribal natural resource employees and leaders, we structured site-specific analyses on potential restoration and management applications as well as previous degradation of the San Carlos and Gila River riparian vegetation. We present these as the case studies within this analysis.
We use the Standardized Precipitation Evapotranspiration Index (SPEI) to quantify climate variability across the study period. The SPEI is a water balance index which calculates evaporative demand through precipitation and reference evapotranspiration—using the Penman-Monteith method by applying temperature, dewpoint temperature, windspeed, and surface radiation (Abatzoglou, 2013)—to develop a robust drought severity metric (Vicente-Serrano et al., 2010; Beguería et al., 2014). Conditions from the cumulative prior n months, generally ranging from 1 to 60, are compared to the same respective period, applying a standardization, over the prior years to identify the index value (Vicente-Serrano et al., 2010; Beguería et al., 2014). Values less than 0 denote drought conditions while values greater than 0 signify wetter than normal conditions. For this study, we are using a 12-month, or 1-year, timeframe to compare annual conditions.
The Gridded Surface Meteorological (GRIDMET) Drought dataset provides a spatially explicit SPEI product in GEE at a 5-day interval and a spatial resolution of 4-km (Abatzoglou, 2013; Google Earth Engine, 2022a). Using the 1-year SPEI product from GRIDMET Drought available in GEE (Google Earth Engine, 2022a), we produce mean values across the watershed for each 5-day period from January 1980 to December 2021. Using R Software (R Core Team, 2022), we reduced the 5-day values to represent monthly mean values and constrained the analysis to water year 1981 (i.e., October 1980) through water year 2021 (i.e., October 2021).
Using the monthly timeseries, we completed the breakpoint analysis using the R Software breakpoint package (Priyadarshana and Sofronov, 2015) to identify breaks within the SPEI timeseries. Detecting a shift within a climate timeseries at a point in time, also referred to as changepoint detection, is widely used across climate research (Reeves et al., 2007; Strong et al., 2020), including with SPEI timeseries data (Wang et al., 2019). The breakpoint algorithm identifies a seasonal pattern within the timeseries. When the seasonal pattern deviates, a breakpoint is then detected. These multiple breaks can be used to frame unique climate periods in the timeseries.
All remote sensing products use the Landsat satellite imagery catalog in GEE (Cohen and Goward, 2004; NASA, 2021; Google Earth Engine, 2022b). Landsat has a spatial resolution of 30-m and data available from 1985 to present-day with a repetition rate of 16-day for each sensor (NASA, 2021), with fewer days between repeat images when multiple sensors are functioning simultaneously. We use imagery acquired by the following Landsat sensors in this analysis: i) Landsat 4 Thematic Mapper (TM) (1985 through 1993), ii) Landsat 5 TM (1985 through 2011), iii) Landsat 7 Enhanced Thematic Mapper Plus (ETM+) (1999 through 2003), and iv) Landsat 8 Optical Land Imager (OLI) (2013 through 2021). Results from 2012 were not considered due to Landsat 5 being decommissioned. All Landsat sensors collect data across the 6 bands used in this analysis: i) Blue, ii) Green, iii) Red, iv) Near Infrared (NIR), v) Shortwave Infrared-1 (SWIR-1), and vi) SWIR-2 bands. Additionally, a pixel quality attributes band (i.e., pixel-qa) produced across all Landsat images was used to identify and mask cloud cover (Foga et al., 2017).
We complete the remote sensing analysis using the GEE online cloud computing platform, which allows for complex calculations and processing (Gorelick et al., 2017). The Landsat imagery series is available within GEE (Google Earth Engine, 2022b). All images were from Landsat Collection-2/Level-2/Tier-1, which required a scaling factor applied to all bands using the following equation to obtain surface reflectance (USGS, 2022):
We apply two primary indices to monitor the characteristics of the vegetation. First, the Normalized Difference Vegetation Index (NDVI) is a commonly used vegetation index that quantifies relative greenness of the vegetation based on the plant’s photosynthetic activity, measured as a ratio between the NIR and Red bands (Tucker, 1979). The NDVI has a range of −1 to 1, where dense green vegetation is represented with values closer to 1 while barren soil, rock, and less-dense surface vegetation has values closer to 0. Values below 0 often represent water due to its unique reflective characteristics.
Second, the Tasseled Cap (TC) transformation is used to transform satellite imagery into a collection of spectral metrics that can quantify various aspects of the vegetation and soil surfaces (Kauth and Thomas, 1976). Specifically, the TC transformation develops 6 separate metrics, though we only consider the three primary metrics: i) brightness (transformation 1), ii) greenness (transformation 2), and iii) wetness (transformation 3). The metrics are calculated using a series of coefficients multiplied across reflectance values for the suite of Landsat bands, then summed across each metric. Because bandwidths differ slightly between Landsat 4, 5, 7 and Landsat 8 (Google Earth Engine, 2022b), we use two sets of coefficients (Table 2) and complete the calculation separately before combining the collections into a single series of images (DeVries et al., 2016; Zhai et al., 2022).
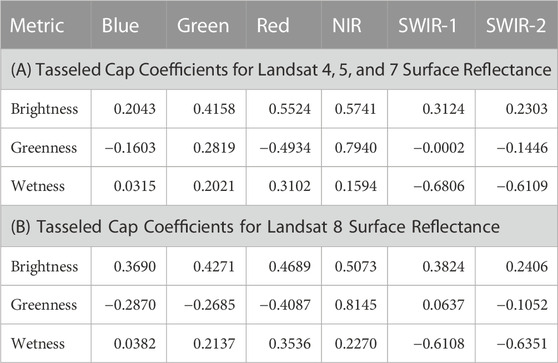
TABLE 2. The Tasseled Cap (Kauth and Thomas, 1976) coefficient values are multiplied against the surface reflectance value for each band for each metric. Coefficients for Landsat 4, 5, and 7 are provided in A) (DeVries et al., 2016), while coefficients for Landsat 8 are provided in B) (Zhai et al., 2022).
To reduce the effects of cloud cover and outlier values on our results that could occur when using a single cloud-affected image and to supplement our analysis by addressing seasonal vegetation dynamics (Adams et al., 2020), we combine multiple Landsat images into seasonal mean composites for NDVI and TC metrics from 1985 to 2021. This reduces cloud-based artifacts and outlier values and simplifies measurements for analysis and presentation of results. The following “seasons” were constrained by 2-month intervals across each year: i) spring (March/April), ii) late-spring (May/June), iii) summer (July/August), and iv) fall (September/October) and represent the effects from climate variation throughout the year. Each season is also characterized by unique temperature and precipitation regimes. For instance, the spring is generally cooler and wetter, while the late-spring is characteristically hot and dry across the watershed. The summer is generally hot and overlaps with the North American Monsoon, in which there is an enhancement in the presence of short-term high-precipitation events, with increased intensity in the higher elevations (Adams and Comrie, 1997). The fall remains warm, but typically begins to dry out.
All four indices (i.e., NDVI and TC brightness, greenness, wetness) were produced using three temporal resolutions: i) seasonal products from spring 1985 to fall 2021 (i.e., one image per year for each season), ii) Sen’s slope trends across the climate periods for each season (i.e., one image per season for each climate period), and iii) monthly images across various timelines to address both phenology and case studies, discussed below, as needed. For the Sen’s slope analysis, we modified the approach established by the Google Earth Engine Developers Community (Google Earth Engine Community, 2021). The seasonal products can be applied to review conditions at a single point in time, while Sen’s slope trends provide a quantification of the linear rate of change across each climate period. All products are spatially and temporally explicit (Petrakis et al., 2023).
Phenology is the natural shift in the timing of plant life in response to changing seasonality (Cleland et al., 2007; USA NPN, 2022). Establishing the remote sensing analysis within a phenological framework supports observations of plant dynamics which can help differentiate between various riparian plant types present within the study site (Diao and Wang, 2016). Furthermore, when considering these seasonal dynamics within the phenological framework, we will be able to relate shifts in the seasonal timing of vegetation response within the riparian floodplain to vegetation dynamics. For instance, deciduous gallery forest vegetation, typically consisting of a collection of native species, including cottonwood, willow (Salix), Arizona black walnut (Juglans major), mesquite (Prosopis), sycamore (Platanus occidentalis), desert willow (Chilopsis linearis), and others (Kindscher, 2011; Orr et al., 2014; Smith and Finch, 2014), experiences a transition from leaf-off to leaf-on between the winter (i.e., January/February) and spring (i.e., March/April), respectively, resulting in a relative increase in NDVI in the spring (Braatne et al., 1996). This vegetation type often reaches peak greenness in April or May. Hereafter we refer to this group of vegetation as cottonwood-willow, or deciduous, gallery forest. In contrast, saltcedar (e.g., Tamarisk; Tamarix), an invasive species commonly found throughout riparian ecosystems across the southern and western US (Glenn and Nagler, 2005), typically begins blooming and greening-up in late-spring (April/May) through early-summer (June/July) and reaches a peak greenness in June and July (Stevens and Siemion, 2012; Diao and Wang, 2016). Hereafter, we refer to this vegetation type as non-native tamarisk. This seasonal contrast can supplement the identification and separation of native deciduous forest and non-native tamarisk over time. Similarly, grassland composition (i.e., primarily C4 species—produces 4-carbon molecules), which comprises a large portion of the understory vegetation, characteristically responds to moisture and heating, and experiences both a slight increase in greenness during the early-spring (March/April) and an elevated increase in greenness following monsoon-season precipitation during the summer (August/September) (Edwards et al., 2010; Gremer et al., 2015). The increase in greenness during the spring is usually followed by a decline in the late-spring (May/June).
To develop a multi-temporal phenological signature for the different vegetation types within the primary study site, we completed a sampling analysis. We placed sample points (n = 246), virtually in ArcMap 10.8.1 (ESRI, 2020), at reference locations that subjectively represented pure visual samples, using NAIP imagery (USDA, 2021), of three unique plant types within the San Carlos and Bylas Reach riparian zones, including: i) cottonwood-willow gallery forest, ii) tamarisk, and iii) understory vegetation (i.e., primarily grassland). We then collected values for each month across the third climate period (i.e., 2014 through 2020; 2021 was not considered because of widespread wildfire) for NDVI and TC greenness at each point, and averaged across years. This produced an average monthly value for each vegetation type. The monthly images are available at Petrakis et al. (2023).
Vegetation and surface characteristics of the riparian floodplain are analyzed using a combination of the vegetation indices (i.e., NDVI and TC brightness, greenness, wetness) across the phenological framework and structured within the climate period approach. Each index records unique properties of the vegetation. For example, NDVI provides a general overview of vegetation condition and can be used to inform on changes related to disturbances, vegetation growth, productivity, or even slight changes in surface and ground hydrology (Chen et al., 2004; Fu and Burgher, 2015; Vicente-Serrano et al., 2016; Shammi and Meng, 2021). The TC is a multi-dimensional transformation of the Landsat imagery, where each metric is interrelated and can provide distinctive information on conditions within a vegetation ecosystem. Brightness primarily measures soil reflectance or changes in overall surface reflectance. Greenness is highly correlated with NDVI and similarly measures the vegetation greenness and health. Finally, wetness informs on both plant and soil moisture. A combination of the three TC metrics provides a robust assessment of various aspects of the vegetation, including the canopy coverage, overall condition, and general density, and can be used to supplement NDVI.
Vegetation stress or degradation can be characterized numerous ways based on our multi-temporal analysis of the vegetation indices. For instance, stress can be qualified as declines in vegetation greenness or wetness over time (Cohen, 1991; Jin and Sader, 2005). Specifically, we would observe either decreasing or increasing greenness and wetness within the year-to-year seasonal images or though the climate period Sen’s slope trend. However, declining trends may also represent transitions between vegetation types, such as from one vegetation type that is greener to one that is less green. Therefore, we must also consider the phenological traits which can inform on seasonal shifts over time. Examples of this may include leaf transitions (i.e., leaf-on and leaf-off) in cottonwood-willow gallery forest or understory vegetation seasonality, particularly whether greening primarily occurs in the spring (as with C3 grasses—produces 3-carbon molecules) or after the onset of monsoonal rains in the summer (as with C4 grasses) (Munson et al., 2022). Analogously, vegetation degradation or disturbance may present similarly as a decline in greenness and wetness, yet also as an increase in brightness (Healey et al., 2005). This combination of metrics would suggest more open soil or loss of vegetation canopy cover. Wildfire is a prime example of a disturbance that could result in an increase in brightness due to loss of canopy cover. Finally, an important consideration with this study is the transition of native cottonwood-willow gallery forests to non-native tamarisk. This transition would likely characterize as an increase in NDVI, greenness, and wetness in the late-spring.
Monitoring the spectral properties and multi-temporal signatures of the vegetation is inherently challenging due to the complexity of riparian systems. However, the indices that we include, within a seasonal framework, can inform on numerous aspects of the vegetation.
We develop three case studies based on conversations with San Carlos Apache Tribal program employees that are structured to directly relate the vegetation response to changes in both climate and management. Each case study was specifically requested and is designed to address either resource and management objectives or known disturbances that have occurred both during and prior to the study period.
The first case study addresses a prior restoration application that was applied on the San Carlos River. We are not revealing the location of this restoration work to protect Tribal cultural and ecological values. Much of the restoration is believed to have taken place between 2006 and 2009, with the objectives to both remove non-native vegetation and plant native cottonwood. These objectives were designed to establish native cottonwood vegetation and reduce the presence of non-native tamarisk. Tamarisk was cleared while cottonwoods were planted using pole planting throughout the restoration area (San Carlos Apache Tribe, personal communication, May 2022).
We test the efficacy of these restoration approaches using monthly NDVI products that we produced in GEE for the restoration area from January 1985 through December 2021. Our hypotheses are: i) that native vegetation would increase in overall canopy cover following the restoration application, evidenced by an increase in the rate of positive change in early-spring NDVI (i.e., the respective leaf-on period—February through April) and ii) that non-native tamarisk cover would decrease immediately following the restoration application as a result of the targeted removal of the vegetation type, evidenced by a decrease in the rate of positive change in NDVI during the late-spring and early-summer (i.e., April through June).
To compare conditions from before restoration to after restoration, we assess NDVI across the four following periods: i) historic—1992 through 1995, ii) pre-restoration—2003 through 2006, iii) restoration (during)—2008 through 2010, and iv) post-restoration—2018 through 2021. To account for naturally occurring yearly variability in vegetation conditions, we average monthly NDVI values across multiple years for each month. Additionally, the multi-year periods were selected to include mostly continuous data, while years with missing data because of cloud cover or issues with the Landsat sensor, were largely removed from the analysis (i.e., 1988 through 1992, 2007, 2011 through 2013).
Between 1967 and 1971, the Bureau of Indian Affairs (BIA) cleared phreatophyte vegetation, defined as deep rooted plants that draw a large amount of the water they require from groundwater sources when precipitation is deficient (Naumburg et al., 2005), throughout the riparian floodplain along a 9-mile stretch of the San Carlos River and a 26-mile stretch (i.e., 15,800 acres) of the Gila River within the San Carlos Apache Reservation (Park et al., 1978). This project was referred to, shorthand, as the “Gila River Channel Improvements” project (Park et al., 1978). Clearing of the vegetation was completed using both mechanical-eradication methods (i.e., root plowing using a bulldozer, uprooting, mowing) and chemical-eradication (i.e., Silvex—a dioxin-based biological agent related to “Agent Orange”) (Park et al., 1978). The clearing treatments primarily targeted phreatophyte species including tamarisk (Tamarix pentandra), which was the dominant vegetation species across the area, as well as mesquite (Prosopis) and cottonwood, which was also present in the floodplain (Park et al., 1978). In addition to the BIA clearing the vegetation, the USGS initiated the Gila River Phreatophyte Project (hereafter “Phreatophyte Project”) to study the impacts of the clearing on hydrologic properties along the Gila River, including evapotranspiration and surface water flow (Culler et al., 1970; 1982; Park et al., 1978). Specific details were published within a set of USGS scientific reports published between 1970 and 1982 (see USGS Scientific Report 665, series A through P) (Culler et al., 1982).
To assess the long-term response of the vegetation, we mirror aspects of the Phreatophyte Project by defining the spatial extent of our analysis using boundaries of areas included in the initial project. For the Phreatophyte Project, the floodplain was divided into four subreaches: 1, 2a, 2, and 3 (Figure 2) (Culler et al., 1982). Furthermore, we included two additional subreaches to supplement our assessment of the vegetation response. Subreach 0, extending east from subreach 1 to the reservation boundary, was cleared during the Gila River Channel Improvements project. Subreach 4, located outside and upstream of the Reservation boundary, serves as a control subreach to monitor untreated vegetation conditions.
FIGURE 2. (A) shows the location of the four subreach groups, based on boundaries originally identified by (Culler et al., 1970), ranging from the furthest upstream subreach group on the San Carlos Apache Reservation, 1 (red/white stripes), to the furthest downstream subreach group, 4, which is just outside of the Reservation and serves as a control (blue/white stripes). Each subreach group consists of subreaches (n = 6), identified by their ID number (black text with white outline). Panel (B) shows the locations of the four wildfires (San Carlos Apache Tribe, personal communication, January 2022) that burned along this portion of the Gila River between 2019 and 2021.
The subreaches are defined by the amount of surface flooding and other geologic, hydrologic, and vegetative properties (Culler et al., 1982). Subreaches 2 and 3 were affected by sediment deposited during maximum storage of the San Carlos Reservoir and have gradual slopes. These subreaches also consist of dense tamarisk-dominant vegetation. Subreaches 0, 1, and 2a, are above the maximum water level of the reservoir and did not experience reservoir-induced surface water flooding during either the Phreatophyte Project or during our study (Culler et al., 1982). These subreaches may be subject to short-term surface flooding from large hydrologic flows along the Gila River, though such flows were not considered in this study. Subreach 2a does not experience reservoir-induced flooding, and consists of more dense tamarisk vegetation. Subreaches 0, 1, and the control subreach (i.e., 4) have generally lower density vegetation, in addition to a greater presence of native mesquite (Park et al., 1978). Lastly, it was noted that there is high salinity concentration in an area that largely extends throughout subreach 0 (San Carlos Apache Tribe, personal communication, May 2022). High salinity, in general, limits cottonwood pole planting (Shafroth et al., 1995) and may have killed young cottonwoods within the Gila River system (San Carlos Apache Tribe, personal communication, May 2022).
To monitor the vegetation response following the Phreatophyte Project timeline, we group the subreaches into four generalized classes defined by surface flooding and vegetation properties, including: i) group 1—reservoir-induced surface flooding/high-density vegetation (i.e., subreaches 2 and 3), ii) group 2—no surface flooding/high-density vegetation (i.e., subreach 2a), iii) group 3—no surface flooding/low-density vegetation (i.e., subreaches 0 and 1), and iv) group 4—untreated with no surface flooding/low-density vegetation (i.e., subreach 4) (Figure 2A).
For each subreach group, we assess both Sen’s slope across climate periods as well as the yearly timeseries for the TC metrics. We average Sen’s slope trends across each subreach for the three climate periods (i.e., 1985 to 1993, 1993 to 2014, 2014 to 2021) for each season. Vegetation was significantly affected by a series of wildfires that burned during the third climate period across all subreach groups, including the i) Bottom Fire (June 28—18 August 2021; ∼5,998 acres), ii) the Salt Fire (April 8—11 May 2021; ∼4,423 acres), iii) the Light Fire (August 28—11 September 2020; ∼971 acres), and iv) the Bylas Fire (June 8—10 July 2019; ∼636 acres) (San Carlos Apache Tribe, personal communication, January 2022) (Figure 2B). Therefore, results across all subreach groups within the third climate period will be driven by these fire disturbances. Additionally, we average the yearly TC metrics seasonally for each subreach to identify the temporal response of the vegetation and identify differences between locations on the river and time from clearing disturbance.
Numerous fires have recently burned along the Gila River. For this case study, we focus on two fires, i) the Bottom Fire and ii) the Bylas Fire, that burned along the Gila River within the San Carlos Apache Reservation (Figure 2B). The Bottom Fire (2021) aligns with the current end of the third climate period and allows us to quantify pre-fire conditions. The Bylas Fire (2019) allows us to quantify short-term post-fire response (i.e., 2019 through 2022).
To assess pre-fire conditions, we consider both the Sen’s slope products as well as the multi-year NDVI and TC metric images. In addition, we include a post-fire burn severity product developed by the Burned Area Emergency Response (BAER) program (USGS BAER, 2022a). BAER has developed a collection of burn severity products that quantify relative rates of burn severity of large-scale wildfires, called the differenced Normalized Burn Ratio (dNBR) (USGS BAER, 2022b). We collect pixel values for each raster product using a collection of sample points (n = 1,335). The points were randomly selected to represent 5% of Bottom Fire area and were tested for autocorrelation using R software (R Core Team, 2022). First, we assess the seasonal timeseries for each vegetation metric across the second and third climate periods to identify both short- and long-term transitions in response to the climate conditions. Second, we correlate remotely sensed burn severity to both Sen’s slope trends for the third climate period and the 2021 pre-fire values for each of the vegetation metrics for the spring and late-spring. We produce Pearson correlations and scatter plots in R Software (R Core Team, 2022) to assess these relationships.
To assess post-fire response within the Bylas Fire boundary, we develop a timeseries of NDVI across the third climate period, including temporarily extending our study period to June 2022 within the Bylas Fire boundary, to collect supplementary information on the temporal response of the vegetation. We also assessed a nearby control site over the same time period, which notably consists of generally less dense tamarisk vegetation based a review of high-resolution NAIP imagery (USDA, 2021), to allow for comparison to an unburned site. We averaged NDVI values across the fire and control site boundaries. Image products for January 2014 through June 2022 were developed using GEE, and are included in the data release (Petrakis et al., 2023). This NDVI timeseries can provide information on trends leading up to the fire, as well as a summary of general vegetation response following the fire.
Fluctuating wet (i.e., above 0) and dry (i.e., below 0) periods were observed within the 1-year SPEI timeseries (Figure 3). Despite year-to-year variability, the breakpoint algorithm identifies two breaks. The first break occurs in December 1993, in which there is a transition between predominantly wet and dry conditions. A second break occurs in September 2014, where there is a short-term transition between dry and wet conditions (∼3-year). This length deviates from the seasonal pattern that was established in 1993, thus resulting in a break in the timeseries. This 2014 break also separates an earlier extended dry period with a subsequent period of intensifying drought conditions.
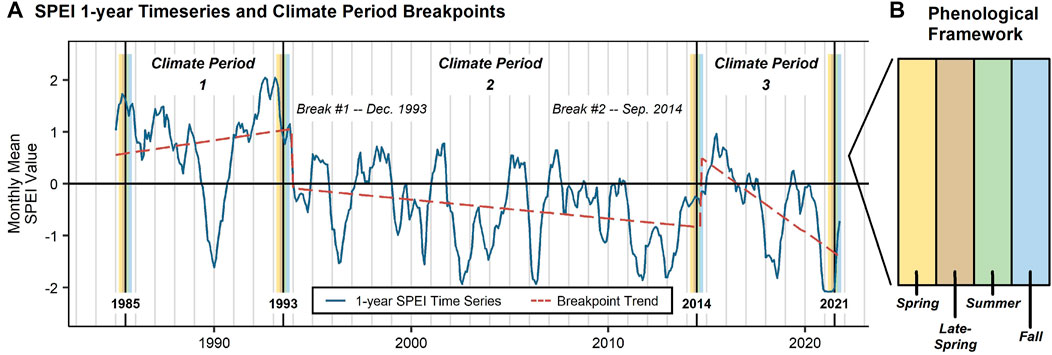
FIGURE 3. Showing the (A) 1-year Standardized Precipitation Evapotranspiration Index (SPEI) timeseries (Google Earth Engine, 2022a), the breakpoint trend (Priyadarshana and Sofronov, 2015), the four climate breaks, and the three climate periods that represent our study period. Each climate break is assessed using a (B) phenological framework, which includes the following four 2-month seasons: i) spring (March/April), ii) late-spring (May/June), iii) summer (July/August), and iv) fall (September/October). The structure of the (B) phenological framework, which is applied at each climate breakpoint, is shown on the right.
Using the breakpoint breaks, in addition to the beginning (1985) and ending (2021) years of our study period, we identify three climate periods: i) 1985 through 1993, ii) 1993 through 2014, and iii) 2014 through 2021 (Figure 3A). We use the breakpoint linear trendline to characterize the long-term climate trends. The first climate period is characterized by generally wet conditions (i.e., SPEI >0). There was a period of short-term drought conditions (i.e., SPEI <0) between 1989 and 1990, however, wet conditions soon returned. Following the break in 1993, a long-term period of drier conditions was present within the watershed. Though the trendline implies intensifying drought conditions, driven by a significant and extended dry period between 2011 and 2013, a series of short-term above-average SPEI periods were present, including from 1997 to 1999, 2001 to 2002, and 2005 to 2006 (Gregg Garfin, Director—UArizona AIR Science Translation and Outreach; Professor and Extension Specialist—UArizona School of Natural Resources and the Environment, personal communication, August 2021). Nevertheless, we characterize the second climate period as having largely consistent drought conditions. Following this break, conditions have become even more dry, allowing us to characterize the third climate period as having intensifying drought conditions (Williams et al., 2020), with the 2021 being measured as the hottest summer on record across much of the Southwest—including the area of the Upper Gila River watershed (Osman et al., 2022).
At each climate period break, we assess the vegetation conditions using a phenological framework as discussed in Section 2.3.3 Phenology. The phenological framework breakdown is portrayed in Figure 3B.
We identified important seasonal contrasts in the phenological timeseries in NDVI and greenness for each of the primary vegetation types (Figure 4). Specifically, deciduous cottonwood-willow gallery forests and tamarisk have unique seasonal patterns. Deciduous gallery forests typically increase in NDVI and greenness at a greater rate during the spring (i.e., February through April). Additionally, the vegetation type experiences a secondary green-up during the late-summer and early-fall (i.e., August and September) due to increased moisture from the monsoon season. On the other hand, tamarisk greens-up at a greater rate, when compared to the gallery forests, during the late-spring and into the early-summer (i.e., April through June). Understory vegetation has much lower values across most of the year, particularly from the late-spring through the fall.
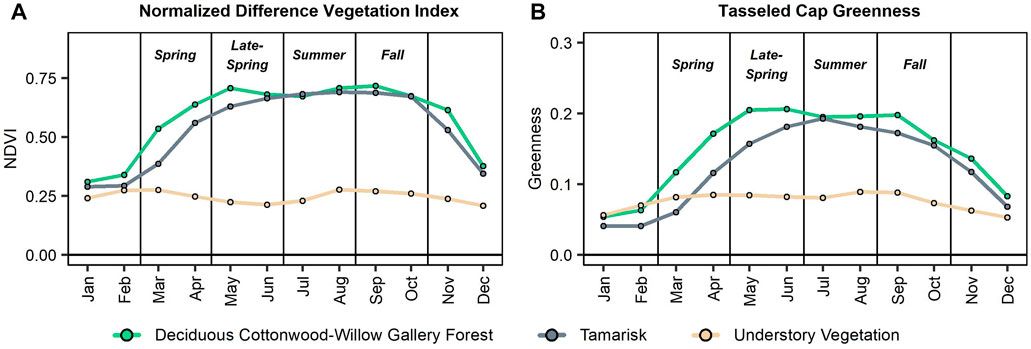
FIGURE 4. Showing the phenological patterns of three vegetation types, i) deciduous cottonwood-willow gallery forest, ii) tamarisk, and iii) understory vegetation, for (A) Normalized Difference Vegetation Index (NDVI) (Tucker, 1979) and (B) Tasseled Cap (TC) greenness (Kauth and Thomas, 1976). Values represent monthly means across the vegetation sample points.
Across the primary and comparison study reaches, the directionality of change in NDVI did not always mirror the SPEI timeseries trend for each climate period (Figure 5). For instance, though the first climate period is characterized as a wet period, NDVI values were relatively lower, compared to conditions across the second and third climate periods, and remained generally stable across most reaches. Both increasing and decreasing NDVI trends were identified but were locationally and seasonally specific. During the second climate period, which is characterized as having largely consistent drought conditions, NDVI increased across all reaches for all four seasons. This period saw widespread vegetation growth throughout the watershed. Finally, during the third climate period, characterized as having intensifying drought conditions, NDVI timeseries were largely variable based on season and location. Some areas (i.e., San Carlos River, Bylas Reach, Safford Reach) had generally decreasing NDVI values, while other reaches (i.e., Upper Gila Reach, Middle and Upper San Francisco Reaches) had seasonally specific increasing NDVI values.
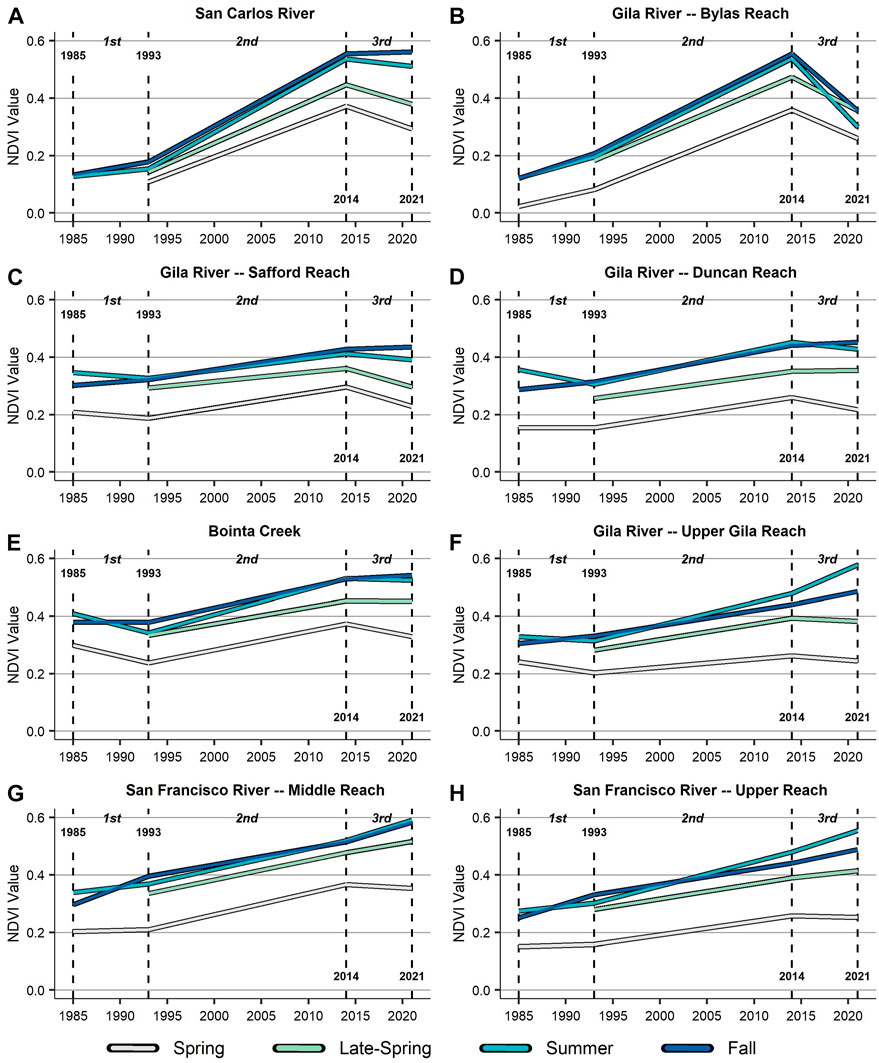
FIGURE 5. Showing snapshots of average annual Normalized Difference Vegetation Index (NDVI) (Tucker, 1979) values at each climate period break (i.e., 1985, 1993, 2014, 2021) for each season (i.e., spring, late-spring, summer, fall) across the eight primary and comparison subreaches ((A) through (H)). Imagery was unavailable in 1985 during the late-spring for all reaches as well as during the spring for the San Carlos River.
We also identified subreach groups based on similarities in the vegetation signatures. First, the primary subreaches, the San Carlos River (Figure 5A) and Bylas Reach (5B), experienced significant green-ups during the second climate period, particularly for the late-spring, summer, and fall. During this period, reservoir-induced surface flooding from the San Carlos Reservoir had ended, resulting in significant growth of vegetation within areas that had been previously flooded (Park et al., 1978). The Bylas Reach then experienced a widespread decline in NDVI during the third climate period. This was primarily due to large-scale wildfires, which we present as a case study. However, declining NDVI was observed for the spring and late-spring during the third climate period for both reaches, as well, despite no impacts from wildfire.
Second, NDVI across the Gila River Safford Reach (5C), Gila River Duncan Reach (5D), and Bonita Creek (5E) had analogous patterns. Specifically, this pattern was defined by relatively consistent NDVI values across the first climate period, increasing NDVI across the second climate period, and relatively stable values across the third climate period. In all 3 reaches, NDVI declined slightly in the spring, late-spring, and summer and increased during the fall for the first and third climate periods. It is notable that the Safford and Duncan reaches have widespread agriculture surrounding the riparian zone (NLCD, 2016), while Bonita Creek is primarily a gallery forest with mixed native (i.e., cottonwood-willow gallery forest) and non-native (i.e., tamarisk) species and surrounding open areas and grasslands.
Finally, the Gila River Upper Gila Reach (5F) and both reaches along the San Francisco River—the Middle Reach (5G) and Upper Reach (5H)—had similar temporal signatures in NDVI. This pattern can be characterized as having seasonally unique trends during the first climate period, slightly increasing NDVI during the second climate period, and larger increasing NDVI during the late-spring, summer, and fall for the third climate period. All three of these reaches have widespread riparian forest vegetation, both native and non-native, as well as open areas and grasslands. The Upper Gila Reach also has minimal agriculture surrounding the riparian zone. Most notable of these trends is that NDVI increased the greatest amount across the second and third climate periods during the summer, with the most significant rate of increase occurring during the third climate period. Based on the phenological timeseries assessment, this aligns with a green-up for deciduous gallery forest class in the summer season, though it occurred despite intensifying drought conditions.
In short, the main riparian zones along the San Carlos River and Bylas Reach of the Gila River, within the San Carlos Apache Reservation, are experiencing different relative changes in NDVI compared to upstream reaches of the Gila River and other Gila River tributaries. Bonita Creek, with the headwaters and upstream portion of the riparian zone located in the Reservation, is generally more stable (as measured via NDVI) across the full study period.
Various patterns can be identified within the timeseries of NDVI within the restoration area based on metrics before, during, and after the restoration activities. First, this region experienced a consistent and large increase in NDVI across the study period (Figure 6A), pointing to an overall increase in vegetation canopy cover across the second and third climate periods. Additionally, the minimum NDVI increased during and following the restoration activities, signaling that more widespread or dense understory and perennial riparian forested vegetation may be present.
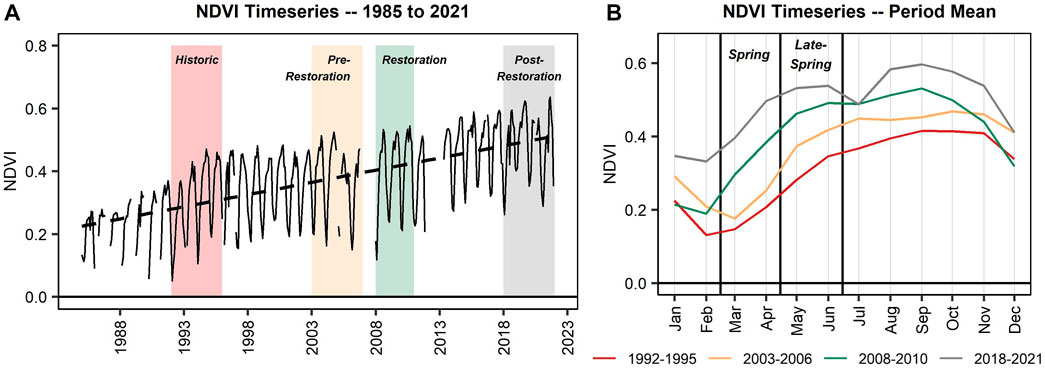
FIGURE 6. Showing (A) the full timeseries of the Normalized Difference Vegetation Index (NDVI) (Tucker, 1979) for the restoration area from 1985 to 2021 and (B) the monthly timeseries averaged across each multi-year period, representing historic conditions (1992–1995), conditions prior to the restoration activities (2003–2006), conditions during the restoration period (2008–2010), and post-restoration conditions (2018–2021). The spring (March/April) and late-spring (May/June) seasons are boxed.
The post-restoration period (i.e., 2018 through 2021) had the highest monthly NDVI values, while the historic period (i.e., 1992 through 1995) had the lowest NDVI values (Figure 6B), matching results from Figure 6A. Notably, NDVI had a larger increase from February to March and March to April, during the spring, for the post-restoration period when compared to the historic period (February to March ∆: historic = 0.016, post-restoration = 0.063; March to April ∆: historic = 0.06, post-restoration = 0.101). A large increase in NDVI is also present during the restoration period. Conversely, NDVI change nearly stabilized for the post-restoration period when compared to the historic period for the late-spring (April to May ∆: historic = 0.074, post-restoration = 0.035; May to June ∆: historic = 0.065, post-restoration = 0.007). Though tamarisk has somewhat returned since the restoration activities ended, as noted by Tribal employees, less non-native tamarisk is present currently than prior to the restoration, whereas numerous native riparian vegetation species (i.e., willow, Arizona black walnut, mesquite, sycamore, desert willow) have been documented to have returned. Overall, this system is described as a “healthier system” (San Carlos Apache Tribe, personal communication, May 2022) and the remote sensing metrics support this observation.
Results from the multi-temporal analysis show differences across the subreach groups for the climate period Sen’s slope and timeseries metrics from 1985 through 2021 (Figure 7). Across the timeseries, subreach groups 1 and 2 (e.g., higher-density non-native vegetation; history of reservoir-induced surface water flooding) had similar temporal signatures, as did subreach groups 3 and 4 (e.g., lower-density vegetation; no reservoir-induced flooding). Subreach groups 1 and 2 generally have higher NDVI, greenness, and wetness values compared to subreach groups 3 and 4. This contrast largely began in the late-spring, while signatures were more similar between all subreach groups during the spring.
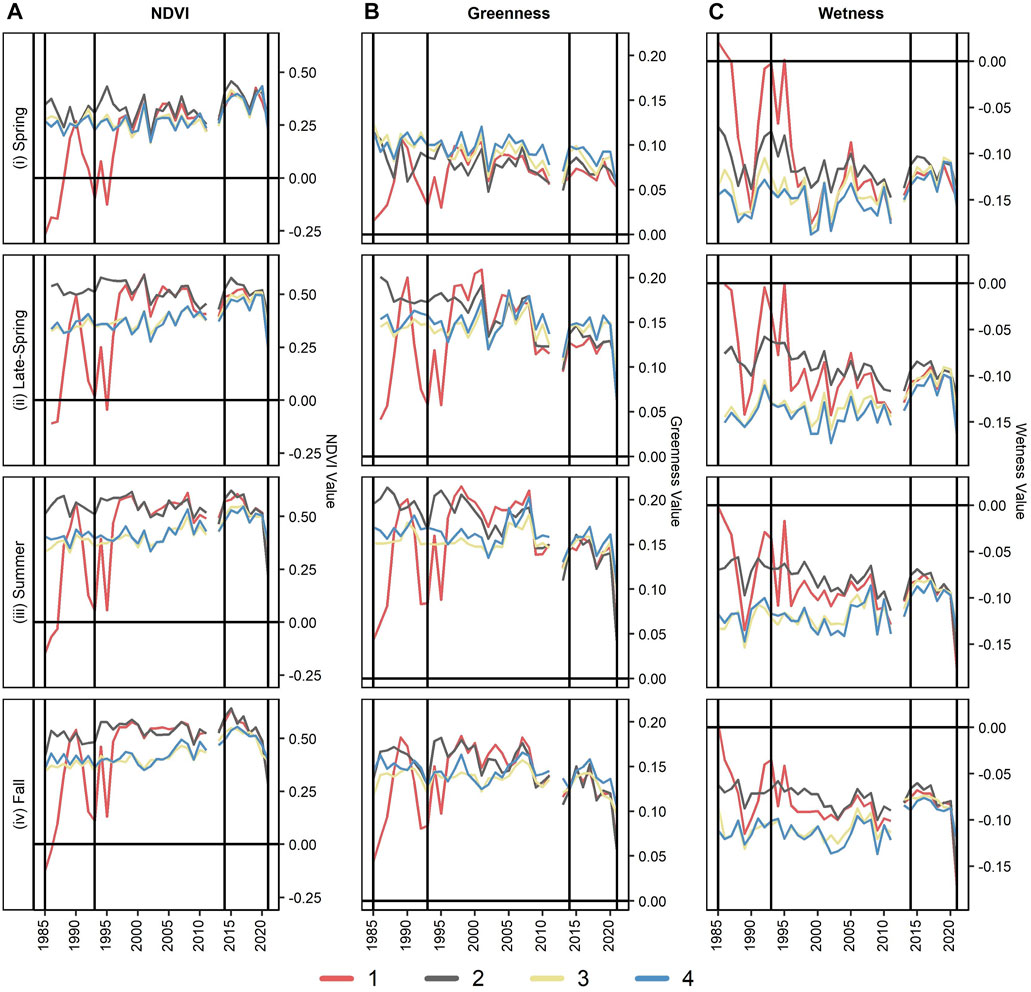
FIGURE 7. Showing the timeseries of (A) Normalized Difference Vegetation Index (NDVI) (Tucker, 1979), (B) Tasseled Cap (TC) greenness, and (C) TC wetness (Kauth and Thomas, 1976) for each of subreach groups of the Phreatophyte Project (i.e., 1 through 4) from 1985 through 2021. Vertical black lines in 1993 and 2014 show the breaks between the climate periods.
The contrast in timeseries trends between subreach groups 1 and 2 and subreach groups 3 and 4 are generally mirrored by changes (i.e., ∆) for the Sen’s slope products across the climate periods (Figure 8). Notably, for NDVI (Figures 8A, D, G, J) there is variability between subreach groups 1 and 2 as well as groups 3 and 4 for the second and third climate periods. However, a large increase in NDVI is noted for group 1 during the first climate period for all four seasons (i.e., ∆NDVI >0; spring = 0.019; late-spring = 0.023; summer = 0.017; fall = 0.014), driven by the increase of vegetation in formerly flooded locations. For the second climate period, groups 3 and 4 increase (i.e., ∆NDVI >0; Group 3: spring = 0.001; late-spring = 0.003; summer = 0.004; fall = 0.004; Group 4: spring = 0.001; late-spring = 0.004; summer = 0.004; fall = 0.005) while groups 1 and 2 remain relatively stable or even decrease, not including the spring (∆NDVI≤0; Group 1: late-spring = 0; summer = 0; fall = 0.001; Group 2: late-spring = −0.006; summer = −0.004; fall = −0.002). For the third climate period, groups 1 and 2 have higher decreasing ∆NDVI values (Figure 8) compared to groups 3 and 4. This is partially a result of fire activity (Section 3.3. Vegetation Timeseries Across Climate Periods), where fire impacts appear to be more significant in the downstream groups (i.e., 1 and 2).
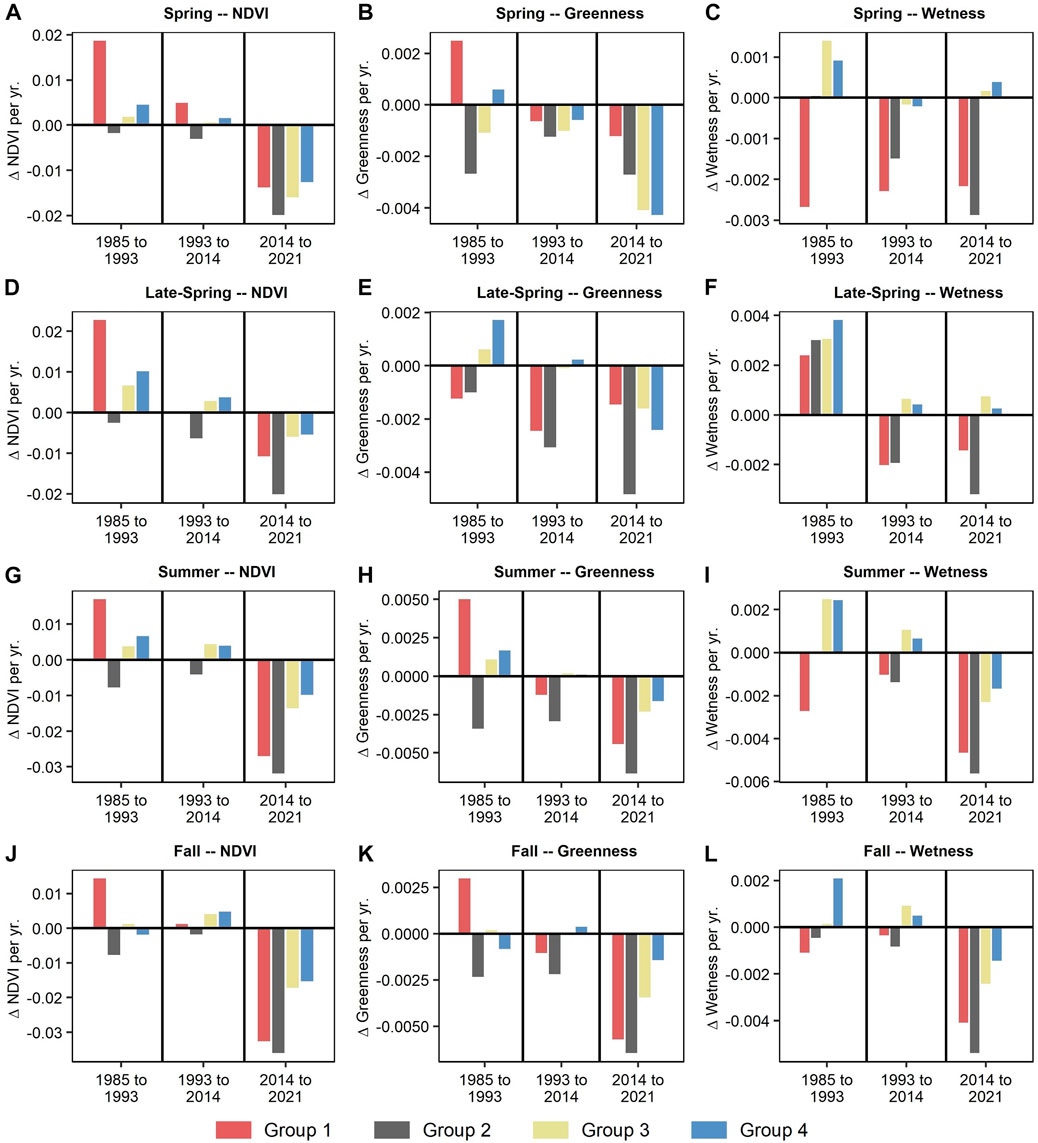
FIGURE 8. Showing the mean Sen’s slope across the four subreach groups for the Normalized Difference Vegetation Index (NDVI) (Tucker, 1979) and the Tasseled Cap (TC) metrics greenness and wetness (Kauth and Thomas, 1976) for each of the four seasons: first row (A–C) = spring; second row (D–F) = late-spring; third row (G–I) = summer; fourth row (J–L) = fall. Values represent change in value per year (i.e., ∆).
Greenness (Figures 8B, E, H, K) and wetness (Figures 8C, F, I, L) generally follow similar patterns. Specifically, groups 1 and 2 decrease for all seasons during the second climate period for both greenness and wetness, while groups 3 and 4 largely increase or remain relatively stable, except for spring greenness (8B, 8E, 8H, 8K). During the third climate period, groups 1 and 2 experience large declines in wetness for all seasons, while groups 3 and 4 increase or remain stable during the spring and late-spring and decrease at a comparatively lower rate during the summer and fall (8C, 8F, 8I, 8L).
Timeseries of NDVI and the TC metrics averaged across the Bottom Fire for the second and third climate periods show a combination of both short- and long-term changes occurring prior to the fire (Figure 9). Direct impacts of the Bottom Fire are visualized through notable short-term declines for the summer and fall from 2020 through 2021 for (9A) NDVI (∆NDVI from 2020 to 2021: summer = −0.28; fall = −0.19) (9C) greenness (∆Greenness from 2020 to 2021: summer = −0.1; fall = −0.06), and (9D) wetness (∆Wetness from 2020 to 2021: summer = −0.08; fall = −0.08), in addition to a slight increase in (9B) brightness in 2021 (∆Brightness from 2020 to 2021: summer = 0.001; fall = 0.05). Though not as large of changes when compared to the summer and fall, additional declines are documented for NDVI (∆NDVI from 2020 to 2021: spring = −0.11; late-spring = −0.11), greenness (∆Greenness from 2020 to 2021: spring = −0.02; late-spring = −0.03), and wetness (∆Wetness from 2020 to 2021: spring = −0.02; late-spring = −0.03) for the spring and late-spring seasons of 2021, indicative of short-term vegetation degradation prior to the fire.
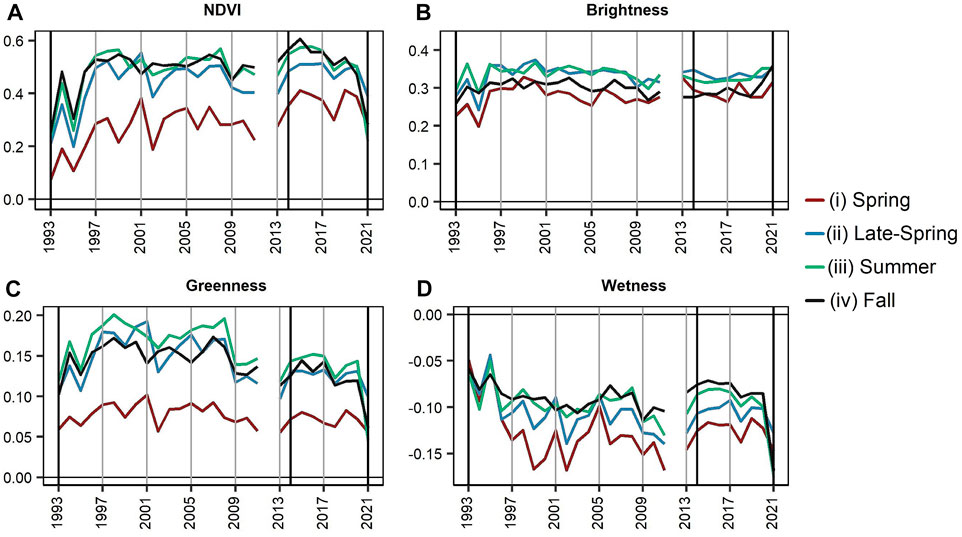
FIGURE 9. Graphs showing the yearly timeseries of (A) Normalized Difference Vegetation Index (NDVI) (Tucker, 1979) (B) Tasseled Cap (TC) brightness (C) TC greenness, and (D) TC wetness (Kauth and Thomas, 1976) for the area within the Bottom Fire boundary from 1993 through 2021 for each season—i) spring, ii) late-spring, iii) summer, and iv) fall. There are no data available for 2012.
One notable long-term change is a decrease in greenness between 2008 and 2009 for the late-spring, summer, and fall (9C). This drop in greenness is not directly aligned in the NDVI (9A) timeseries. Rather, NDVI shows a slight increase compared to prior years beginning in 2013, particularly in the spring. However, both summer and fall NDVI values decrease from roughly 2015 through 2020. Similar to the NDVI timeseries, a slight increase occurs in wetness (9D) for the spring, summer, and fall. Wetness also had higher values in 1993 and 1995 from surface flooding from the San Carlos Reservoir. Following the surface flooding of 1995, values across all metrics began to stabilize in 1997.
Correlations show a direct and statistically significant (p-value <0.05) relationship between burn severity and Sen’s slope trends across the third climate period for many of the pre-fire (i.e., spring and late-spring) vegetation metrics (i.e., NDVI, TC brightness, TC greenness, TC wetness) (Figure 10A, a–h). The strongest correlations, through generally moderate in strength, were between dNBR and spring NDVI (10a), greenness (10e), and wetness (10g) (correlations: NDVI = −0.37; greenness = −0.38; wetness = −0.33), which denotes that higher fire severity occurred within areas that have higher decreasing rates of NDVI, greenness, and wetness in the spring (i.e., increasing severity and declining metrics). However, correlations were weaker for late-spring greenness and wetness, −0.19 and −0.08, respectively (10f, 10h). A positive correlation (correlation value = 0.14) for spring brightness (10c) implies areas with increasing brightness experienced higher fire severity. Late-spring NDVI and brightness (10b, 10d) were not significant.
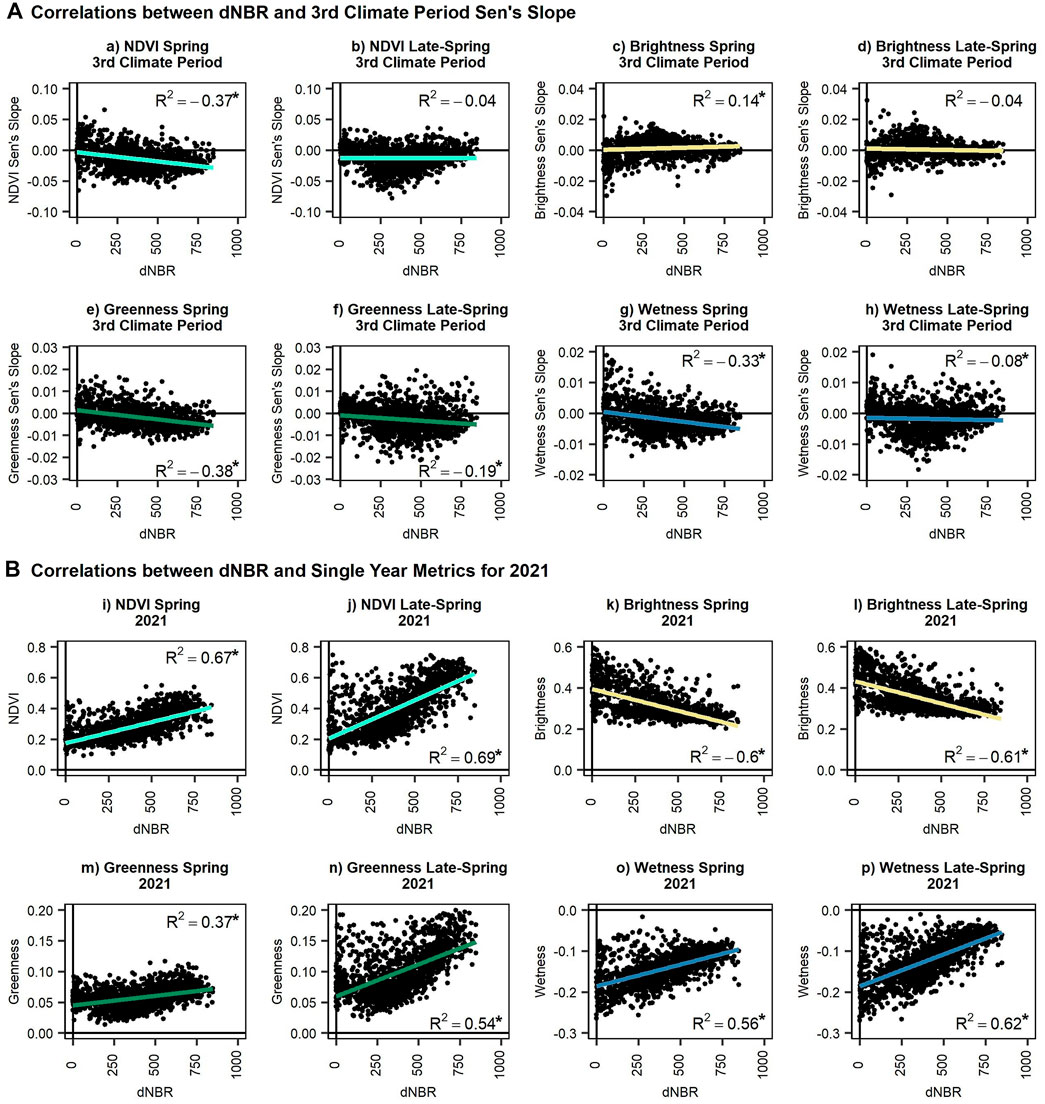
FIGURE 10. Scatter plots between the differenced Normalized Burn Ratio (dNBR) (USGS BAER, 2022b) and the vegetation metrics for the spring and late-spring for the (A) third climate period slope and (B) the single year metrics for 2021. The metrics include (a/b/i/j) Normalized Difference Vegetation Index (NDVI) (Tucker, 1979) (c/d/k/l) Tasseled Cap (TC) brightness (e/f/m/n) TC greenness, and (g/h/o/p) TC wetness (Kauth and Thomas, 1976) for points within the Bottom Fire boundary. Correlation values are provided in either the upper or lower right corners of the graphs. Significant correlations (p-value <0.05) are identified using “*”.
Correlations between fire severity and 2021 pre-fire conditions reveal significant (p-value <0.05) relationships (Figure 10B; i-p). NDVI had the strongest relationship between pre-fire conditions and fire severity, with correlation values of 0.67 and 0.69 for the spring and late-spring, respectively (10i, 10j). Brightness had significant negative correlations with fire severity (10k, 10l). For the spring and late-spring, strong negative correlations indicate that areas with lower brightness, likely comprised of more dense vegetation canopies, burned more severely while brighter areas that likely consist of greater open soil or grassland coverage burned less severely. Greenness results were similar to NDVI, as expected (10m, 10n). Strong positive correlations between pre-fire greenness and burn severity imply that higher fire severity occurred within greener areas, particularly measured as late-spring greenness. Wetness had a positive correlation with burn severity for both the spring and late-spring (10o, 10p). However, because wetness is measured with negative values, this correlation implies that wetter areas burned more severely than drier areas; this aligns with the assumption that greener areas are wetter due to higher vegetation and moisture.
In short, areas that were experiencing a greater negative Sen’s slope rate in NDVI, greenness, and wetness in the spring and late-spring prior to the Bottom Fire burned at a higher severity (i.e., higher dNBR values) (Figure 10). Furthermore, greener and wetter areas in the spring and late-spring for 2021 also burned at a higher severity. However, it is notable that some areas (i.e., Bottom Fire sample points) had higher late-spring NDVI (10j), greenness (10n), and wetness (10p) and burned with lower severity than the liner relationship would suggest. Corresponding evidence of this was identified in the high-resolution 2021 post-fire NAIP imagery (USDA, 2021), where an area immediately surrounding the active flow channel within the Bottom Fire boundary was not severely impacted by the wildfire. This vegetation was wetter and greener prior to the fire activity. This implies there is a threshold of moisture in which the vegetation is protected from wildfire.
The 2019 Bylas Fire provides an opportunity to review short-term response following a wildfire within a tamarisk dominant system. The timeseries of NDVI (Figure 11) displays a relatively consistent pattern from 2014 through May 2019 for the Bylas Fire area, though the peak value is declining moderately year-to-year (0.63 in September 2014 to 0.55 in September 2018; ∆NDVI = 0.08). A similar decline is documented in the nearby control site (0.53 in September 2014 to 0.47 in September 2018; ∆NDVI = 0.06). For the Bylas Fire timeseries, an immediate and substantial drop in NDVI is observed following the fire in June (i.e., May NDVI = 0.55; June NDVI = 0.30; ∆NDVI = −0.25), followed by a minimal increase in summer 2020. However, in July through September 2021, following a relatively wet monsoon season, a moderate recovery in NDVI is documented. This aligns with discussions with Tribal employees and members, in which it was noted that tamarisk immediately recovers following fire activity on the Reservation (San Carlos Apache Tribe, personal communication, May 2022). Yet despite increases in 2021, NDVI has not shown a large increase by June 2022, which was the most recent data Landsat imagery available.
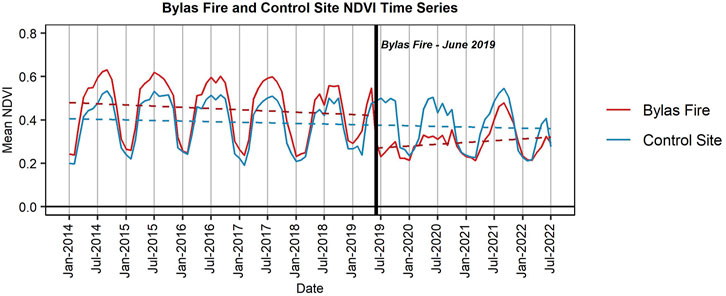
FIGURE 11. The graph shows the Normalized Difference Vegetation Index (NDVI) (Tucker, 1979) timeseries within the Bylas Fire boundary (red) and a nearby control site (blue) from January 2014 through July 2022. The Bylas Fire burned in June 2019, indicated by the black vertical line. Linear trend lines show the trend before and after the fire for the Bylas fire, while the trend line for the control site is not divided at the time of the fire.
Based on the full suite of analyses, including i) a comparison of vegetation conditions in response to climate trends within the primary study site and at the comparison watershed study reaches and ii) three case studies addressing environmental- and management-based themes including prior restoration efforts, prior vegetation removal, wildfire, as well as climate- and disturbance-based vegetation change, we have developed a summary of vegetation change along the San Carlos River and Bylas Reach of the Gila River that could be used to identify restoration potential for future planning. Specifically, we focus on areas that have been effectively restored as well as areas that show degradation tied to an increase in wildfire presence and scale, post-fire restoration, and restoration of the native gallery forests in the watershed.
Our analysis shows that the restoration approach applied within the restoration area was largely effective at both removing non-native tamarisk as well as developing native deciduous gallery forest vegetation. The remote sensing metrics show that early-spring greenness has increased likely because of an increase in the presence and overall coverage of native vegetation species, such as the cottonwood trees were planted during the restoration application (San Carlos Apache Tribe, personal communication, May 2022). NDVI shows a declining rate in the amount of positive increase between the months of April, May, and June, in addition to a near stabilization of NDVI values during the averaged post-restoration period. This suggests that non-native vegetation may have less areal extent and reduced growth within the restoration area when compared to historic conditions. Additionally, Tribal employees and members described a healthier native riparian system with many important native riparian vegetation species (i.e., willow, Arizona black walnut, mesquite, sycamore, desert willow) known to be present in this location likely became more prevalent following the restoration activities. Overall, the restoration application appeared to have met the primary objectives determined by the Tribe.
In upper reaches of the watershed (i.e., San Francisco Reaches and Upper Gila Reach), which is known to have a lower prevalence of tamarisk vegetation (Carolyn Koury, Hydrologist—U.S. Forest Service Gila National Forest, personal communication, October 2022), native deciduous gallery forests have widely increased in NDVI, greenness, and wetness despite recent climate conditions (i.e., second and third climate periods). Similar conditions are observed, though not as widespread, throughout the full watershed, including on subreaches not addressed in this study though mapped in the spatially explicit products (i.e., Eagle Creek, the Bule River, the Gila Box, and others) (Petrakis et al., 2023). It is possible that a warm and wet summer monsoon season in 2021 may be influencing this response. However, Davis et al. (2022) suggests that increases in atmospheric carbon stocks may be tied to increasing wood volume, including for cottonwood forests in the western US.
Providing an assessment of the requirements needed to establish native vegetation is beyond the scope of this study. However, prior studies suggest that overbanking flows support the establishment of native cottonwood-willow trees (Poff et al., 1997; Stromberg et al., 2007). Natural Infrastructure in Dryland Streams (NIDS) (Norman et al., 2022), such as rock detention structures (i.e., one rock dams, trincheras, etc.), beaver dams, and their analogs, have been shown to be effective at increasing baseflows and overall flow volume (Norman et al., 2015), vegetation greenness and moisture both upstream and downstream (Norman et al., 2014; Wilson and Norman, 2018), surface water and riparian wetland habitat (Gibson and Olden, 2014; Norman et al., 2014; 2022; Wilson and Norman, 2018; Norman, 2020) and fire resistance within riparian systems by retaining water and increasing greenness and moisture in the riparian vegetation (Fairfax and Whittle, 2020; Norman et al., 2022). It is plausible that greater use of these structures could help establish native riparian species.
We identified sizable contrast between subreach groups structured in the Phreatophyte Project, which was likely a derivative of the vegetation and the historic presence of reservoir-induced surface-water flooding. For instance, densely vegetated stands that have greater declining rates in NDVI, greenness, and wetness across the second and third climate periods (i.e., drought and intensifying drought conditions) potentially represent widespread declines in vegetation health, and potentially even limited mortality of tamarisk (Nagler et al., 2018). Pre-existing conditions prior to the Phreatophyte Project treatments portray cycles of tamarisk invasion, where previous vegetation was killed by reservoir-induced surface flooding from the San Carlos Reservoir. After the surface flooding receded, high rates of vegetation growth incurred (Section 3.3 and 3.4.2). The greater decline in overall condition of vegetation in these subreaches could be resulting from drought intensification and reduced reservoir levels.
Additionally, we concluded in our post-fire analysis of the 2019 Bylas Fire that, i) the NDVI response in 2020, 2021, and 2022 was lower than pre-fire conditions and ii) the post-fire vegetation temporal signature did not follow a typical non-native tamarisk signature and increased in NDVI at a much slower rate, particularly from July through August. A very wet 2021 monsoon (CLIMAS, 2021) likely contributed to the increase in NDVI during the summer, while winter and spring droughts for 2021 and 2022 (NOAA and NIDIS, 2022; Seager et al., 2022) may have contributed to minimal growth during the spring and early-summer. In short, it is likely that only limited re-vegetation occurred within 1 year (i.e., 2020), though the rate of re-vegetation appeared to increase following summer rain in 2021. Nevertheless, this implies that non-native tamarisk has not fully re-vegetated up to 3-year following the Bylas Fire. Several studies suggest that the plant specific growth rate is dependent on various factors such as the amount and type of surrounding vegetation, structure of the plant, climate conditions, and tamarisk beetle impacts (Lesica and Miles, 2001; Snyder and Scott, 2020); therefore it is possible that full recovery of the tamarisk stand following a wildfire would take several years. However, Smith et al. (2006) observed tamarisk sprouts reflowering following a wildfire in as little as 3-month. This response has also been documented elsewhere following wildfire (Busch, 1995; Smith et al., 2009), in addition to defoliation events caused by the tamarisk beetle, though not universally (Snyder and Scott, 2020). Despite an initial response, this may allow for a period of restoration following wildfire events, such as the 2021 Bottom Fire, before tamarisk returns as the dominant vegetation species within the system. We hypothesize that climate conditions during this period, specifically below average rainfall, were not conducive to vegetation recovery, and that years with average or above-average rainfall would result in faster recovery of the vegetation. Continued monitoring of the vegetation response may help inform post-fire recovery within this ecosystem as more imagery becomes available.
For the Bottom Fire, declining trends in pre-fire vegetation condition, identified in our Sen’s slope analysis, may have led to increased fire risk. Similar relationships aligning drier climate and vegetation conditions with intensifying wildfire patterns have been documented elsewhere (Leblon et al., 2007; Halofsky et al., 2020). However, immediate pre-fire vegetation conditions also showed that greener and wetter areas were burning with higher fire severity. Combined, this suggests that stressed vegetated areas may be at greater risk of fire, however, greener areas, which likely provide higher fuel loads, may burn more severely (Drus, 2013). We can only speculate as to intensifying drought conditions driving this decline, though there is a possibility that the tamarisk beetle may have arrived in the Reservation, without formal documentation, by 2021 (San Carlos Apache Tribe, personal communication, January 2023). Nevertheless, we hypothesize that riparian vegetation conditions, due to effects from historic surface flooding from the San Carlos Reservoir coupled with observations of declining vegetation metrics during the third climate period, may lead to higher fire risk within the lower San Carlos River. If surface water levels within the San Carlos Reservoir remain low because of extended drought conditions, areas that would historically be considered portions of the San Carlos Reservoir may experience widespread non-native tamarisk growth in those drying floodplains and be subject to similar wildfire-inducing conditions in the future.
In short, it may be both appropriate and logical to draw parallel conclusions in areas throughout the watershed to conditions from the Phreatophyte Project along the Gila River to inform restoration priorities. Specifically, locations along the lower San Carlos River north of the San Carlos Reservoir, are experiencing widespread decline in NDVI and TC greenness across the third climate period. Both hydrologic and vegetation properties of this region are likely very similar to conditions observed within lower portions of the Phreatophyte Project, where numerous occasions of reservoir-induced surface water flooding occurred leading to high amounts of sediment, low slopes, and likely high salinization in the soil. Though not widespread and driven by localized factors, it is plausible that other locations throughout the larger watershed could be experiencing similar conditions. This may include the Safford and Duncan reaches of the Gila River, as well as portions of Bonita Creek. Even though generalized trends show increasing metrics (i.e., NDVI, greenness, wetness) along other reaches, the spatially explicit products can identify localized areas experiencing declines in overall vegetation metrics (Petrakis et al., 2023).
Applications of remote sensing using both satellite- and aerial-based imagery sources have been widely used for the semi-continuous monitoring of the vegetation at a broad-scale on the San Carlos Apache Reservation (Petrakis et al., 2016; 2018; Wu et al., 2016; Norman et al., 2018; Middleton and Norman, 2021). However, riparian zones are extremely dynamic and complex systems structurally, and cover only a small portion of the landscape (Naiman and Décamps, 1997). Site-specific conditions are more likely driven by micro-scale factors that could vary across (i.e., transverse) and along (i.e., longitudinal) the riparian floodplain, such as distance to groundwater, fire history, vegetation type, elevation and orientation, as well as human activities and disturbances (Bendix, 1994; Wilson and Norman, 2022). We hypothesize that other micro-scale factors may also be impacting changes, such as climate variability (i.e., temperature and precipitation regimes), proximity to agriculture, and geomorphic-based shading effects we observed in the spatially explicit raster products. These detailed changes can be challenging when analyzing satellite imagery (Middleton and Norman, 2021). We largely generalized conditions across various reaches of the San Carlos and Gila Rivers. We also averaged Landsat data into seasonal means to monitor changes occurring more consistently at different periods across the 37-year study period, which could result in loss of data that would be available if we were using single-date Landsat imagery. In general, it is possible this approach could result in the loss of spatially explicit, small-scale changes occurring within the vegetation.
However, remote sensing allows for a wide-scale assessment for an extended period. It has a capacity to measure vegetation dynamics using spectral response. Because of this, we were able to quantify general trends across subreaches within the larger riparian system, with some additional analyses related to pixel-scale conditions. Our multi-scaled approach primarily addressed conditions across the larger watershed by comparing reaches, addressing restoration impacts, and reviewing historic management impacts, but also included highly detailed pixel-based analyses when addressing pre- and post-fire impacts. This variability in scale helps identify unique properties of the vegetation response to climate conditions. Additionally, we monitor long-term changes scaled across multiple climate periods to focus on generalized patterns in climate rather than short-term weather driven events. As a result, the changes that we document using the vegetation indices can be directly tied to long-term climate patterns and future trend predictions (Yang et al., 2016).
Lastly, we applied a phenological framework to gain more information on generalized plant types that are important when considering riparian restoration efforts—specifically, native deciduous (i.e., cottonwood-willow dominant) gallery forests and non-native tamarisk. This four-season approach allows us to monitor changes more directly across plant types based on the differences in seasonality of the vegetation types. Spatially explicit products derived seasonally can show where and when changes occur across the landscape. Using these products, we can conduct analyses that may help inform restoration and management decisions in the future.
Though we hypothesize that trends in the vegetation metrics would mirror the directionality of the trends in the climate conditions, that was not the case for all climate periods. Vegetation conditions (i.e., NDVI) during the first climate period remained relatively stable. Though we can characterize the climate period as being relatively wet, we chose to use SPEI because it expands on other metrics, such as the Standardized Precipitation Index (SPI), by including sensitivity to temperature-driven evaporative demand to estimate drought conditions (Vicente-Serrano et al., 2010; Stagge et al., 2014). A slight transition to drier, and possibly warmer, conditions appears to have occurred during this period; vegetation conditions largely aligned with that characterization. During the third climate period, in which intensifying drought conditions were present, NDVI largely declined. This appears to be a result of both drought conditions, identified using the SPEI timeseries (Section 3.1 Climate Breakdown), and an increasing presence of wildfire in the riparian zone (Section 2.4.3 Pre- and Post-Wildfire Analysis). However, climate and vegetation conditions largely diverged during the second climate period. Despite dry conditions occurring during this time, as measured by SPEI, much of the riparian zone experienced increasing NDVI, greenness, and wetness, aligning with vegetation filling into formally flooded areas. This was the most apparent in areas upstream of the San Carlos Reservoir that had experienced reservoir-induced surface water flooding during the first climate period. Furthermore, it is possible that either intra-period or intra-annual variability between wet and dry conditions that supersede the breakpoint trend could also be driving vegetation response throughout the watershed.
Despite our generalization of these climate periods, localized variability was present in the spatially explicit raster images (Petrakis et al., 2023). For instance, many of the native gallery forested locations in the upper comparison subreaches of the watershed appear to increase in NDVI during the third climate period despite drought conditions. Similarly, the restoration area also increased in greenness and wetness during this time. This pattern could be representative of increasing greenness within the native cottonwood-willow gallery forests, which is known to respond positively to summer rain and hydrologic flows. Conversely, during the second climate period which we generalize as having an increase in overall greenness, declines in the vegetation metrics were noted in understory vegetation plots along the San Carlos River. These localized vegetation dynamics can directly impact restoration priorities and objectives though they may not be identified using generalizations across riparian zones and climate periods.
We also observed a large increase in fire presence and scale, particularly beginning in 2019. Fire severity for the Bottom Fire, in particular, was relatively high compared to other riparian wildfires across the southwestern US over the past 2 decades (USGS BAER, 2022b), likely driven by a combination of extremely dense tamarisk, drought, and a lack of prior fire activity within this region. The high severity burns within the Bottom Fire had direct impacts on local infrastructure, including damaging a railroad bridge and a USGS stream gaging system (Kurt Ehrenberg, Supervisory Hydrologic Technician—U.S. Geological Survey Arizona Water Science Center, personal communication, February 2023). The extent and impact of these wildfires was largely unanticipated because of the expectation that riparian zones are not historically prone to wildfire, though riparian fire dynamics, such as frequency and severity, are believed to be tied to changes in vegetation composition, geomorphology, and climate and streamflow, among other factors (Busch, 1995; Dwire and Kauffman, 2003; Webb et al., 2019). We hypothesize that this increase in wildfire in the Upper Gila River watershed riparian areas, which occurred almost entirely during the third climate period, was fundamentally climate driven. For instance, a significant portion of the Gila River riparian zone within the reservation boundary burned during this time. Our remote sensing metrics identified both long- and short-term declines in the vegetation prior to the Bottom Fire, particularly within the densely vegetated non-native tamarisk. Similar conditions were also likely present within the Salt Fire boundary, which also burned in 2021, though we did not assess pre-fire conditions for this fire.
Along the San Carlos River, recent fires have burned into the native gallery forest, though we did not investigate whether these fires started in the stressed tamarisk communities or in the native gallery forest vegetation. Nevertheless, this could have ramifications regarding the extent of native gallery forests in the future depending on how the forests recover after the fires. Recent studies suggest that some cottonwood species (i.e., Populus deltoides, Populus wislizenii) regenerated well following wildfire in Kansas and New Mexico, though many local factors, such as stand conditions, fire intensity, timing, and climate, may have been determinants in the response (Smith et al., 2009; Wonkka et al., 2018). Likewise, restoration treatments using NIDS can reverse post-fire degradation and promote riparian climate resilience (Long and Davis, 2016; Fairfax and Whittle, 2020; Norman et al., 2022).
We streamline our climate analysis using the robust SPEI drought metric. However, additional metrics could be considered in future analysis. For example, hydrology, specifically measurements of river discharge, can provide an assessment of direct water availability for the riparian vegetation. Cottonwood-willow vegetation, for instance, is dependent on occasional overbank flooding, especially during periods of establishment (Poff et al., 1997; Rood et al., 2007; Stromberg et al., 2007). Tamarisk, on the other hand, can establish without overbanking of floodwaters (Stromberg et al., 2007). Understanding the dynamics of seasonal overbanking flows and overall baseflow availability could help supplement the climate framework.
The rise in both the presence and severity of riparian wildfire has also become a developing resource management challenge, necessitating consideration in future research. For instance, with many of the fires occurring primarily during the later years of this study, we were unable to address long-term fire response tied to applications of restoration. We hope to assess long-term impacts tied to fire severity and seasonal post-fire riparian vegetation response in future research. Additionally, we observed areas directly along the active flow channel that experienced lower fire severity coupled with greener and wetter conditions, identified using the vegetation metrics. Though determining thresholds of either greenness or wetness that protect a particular riparian zone from wildfire was beyond the scope of this study, quantifying these thresholds may provide a reference for possible restoration applications that support reaching these thresholds of moisture within the overall system to increase resilience to wildfire.
Further enhancements of the remote sensing techniques could better inform our results. For example, improvements in the identification of tamarisk extent by using other imagery sources and image dates could benefit management of the species. Studies show that tamarisk identification is more accurate when identifying a period of senescence in the fall when the rest of the native riparian vegetation is in leaf-off condition (Diao and Wang, 2018). Additionally, higher spatial resolution sources, such as imagery from the European Space Agency (ESA) Sentinel satellite series (i.e., 10-m resolution) (ESA, 2023) and the NAIP aerial imagery are becoming more useful (i.e., NAIP imagery’s NIR band, etc.) (USDA, 2021) and more frequently available, and are actively used to map vegetation dynamics (Wu et al., 2019; Misra et al., 2020; Segarra et al., 2020). Similarly, Moderate Resolution Imaging Spectroradiometer (MODIS) satellites, though with lower spatial resolution (i.e., 250 m for MODIS) which limits the ability to precisely measuring smaller riparian zone vegetation dynamics, has twice-daily overpasses (NASA, 2023). These satellite and aerial sources can be used to monitor non-native vegetation with greater spatial and even temporal (i.e., Sentinel with combined 5-day revisit period) accuracy (Huylenbroeck et al., 2020).
The datasets presented in this study can be found in online repositories. The names of the repository/repositories and accession number(s) can be found below: RP, LN, BM, 2023. Mapping Riparian Vegetation Response to Climate Change on the San Carlos Apache Reservation and Upper Gila River Watershed to Inform Restoration Priorities: 1935 to Present—Database of Trends in Vegetation Properties and Climate Adaptation Variables. https://doi.org/10.5066/P9HL0N5T.
Conceptualization of idea—RP, LN, and BM; Formal analysis and investigation—RP; Resources and outreach—RP, LN, and BM; Writing and preparation of the original draft—RP; Review and editing of manuscript—LN, and BM; Visualizations and figures—RP; Supervision and project administration—LN; Funding acquisition and proposal development—RP, LN, and BM. All authors contributed to the article and approved the submitted version.
This research was supported through funding from the Land Change Science (LCS) Program of the U.S. Geological Survey (USGS) and the USGS Southwest Climate Adaptation Science Center (Southwest CASC). The article processing charges were funded by the USGS.
We would like to thank employees of program and departments of the San Carlos Apache Tribe, including the San Carlos Tribal Forest Resources Program, the Department of Environmental Protection, the Range Program, and the Archaeology Department, for providing input, time, and expertise pertaining to the history, condition, and concerns of the riparian vegetation. We would like to thank Michael Crimmins (Professor and Climate Science Extension Specialist—UArizona Department of Soil, Water and Environmental Science) and Seth Munson (Research Ecologist—U.S. Geological Survey Southwest Biological Science Center) for their detailed and thoughtful reviews of the manuscript. Lastly, we would also like to thank the U.S. Geological Survey (USGS) Land Change Science Program and the USGS Southwest Climate Adaptation Science Center for their financial support and assistance in this research.
The authors declare that the research was conducted in the absence of any commercial or financial relationships that could be construed as a potential conflict of interest.
All claims expressed in this article are solely those of the authors and do not necessarily represent those of their affiliated organizations, or those of the publisher, the editors and the reviewers. Any product that may be evaluated in this article, or claim that may be made by its manufacturer, is not guaranteed or endorsed by the publisher.
Any use of trade, firm, or product names is for descriptive purposes only and does not imply endorsement by the U.S. Government.
Abatzoglou, J. T. (2013). Development of gridded surface meteorological data for ecological applications and modelling. Int. J. Climatol. 33, 121–131. doi:10.1002/joc.3413
Adams, B., Iverson, L., Matthews, S., Peters, M., Prasad, A., and Hix, D. M. (2020). Mapping forest composition with Landsat time series: An evaluation of seasonal composites and harmonic regression. Remote Sens. 12, 610. doi:10.3390/rs12040610
Adams, D. K., and Comrie, A. C. (1997). The North American monsoon. Bull. Am. Meteorological Soc. 78, 2197–2213. doi:10.1175/1520-0477(1997)078<2197:TNAM>2.0.CO;2
AghaKouchak, A., Farahmand, A., Melton, F. S., Teixeira, J., Anderson, M. C., Wardlow, B. D., et al. (2015). Remote sensing of drought: Progress, challenges and opportunities: Remote sensing of drought. Rev. Geophys. 53, 452–480. doi:10.1002/2014RG000456
Banister, K., Chan, D., Driscoll, J. M., Fullerton, C., Lien, A., and Mott Lacriox, K. (2014). Atlas of the upper Gila River Watershed. Arizona Water Resources Research Center.
Beguería, S., Vicente-Serrano, S. M., Reig, F., and Latorre, B. (2014). Standardized precipitation evapotranspiration index (SPEI) revisited: Parameter fitting, evapotranspiration models, tools, datasets and drought monitoring. Int. J. Climatol. 34, 3001–3023. doi:10.1002/joc.3887
Bendix, J. (1994). Scale, direction, and pattern in riparian vegetation-environment relationships. Ann. Assoc. Am. Geogr. 84, 652–665. doi:10.1111/j.1467-8306.1994.tb01881.x
BLM (2020). BLM national surface management agency area polygons - national geospatial data asset (NGDA). Bureau of land management geospatial business platform. Available at: https://gbp-blm-egis.hub.arcgis.com/datasets/blm-national-surface-management-agency-area-polygons-national-geospatial-data-asset-ngda/about.
Braatne, J. H., Rood, S. B., and Heilman, P. E. (1996). “Chapter 3: Life history, ecology, and conservation of riparian cottonwoods in North America,” in Biology of Populus and its implications for management and conservation (NRC Press).
Busch, D. E. (1995). Effects of fire on southwestern riparian plan community structure. Southwest. Nat. 40, 259–267. doi:10.1007/s10021-007-9048-5
Chen, Z. M., Babiker, I. S., Chen, Z. X., Komaki, K., Mohamed, M. A. A., and Kato, K. (2004). Estimation of interannual variation in productivity of global vegetation using NDVI data. Int. J. Remote Sens. 25, 3139–3159. doi:10.1080/0143116032000160435
Cleland, E., Chuine, I., Menzel, A., Mooney, H., and Schwartz, M. (2007). Shifting plant phenology in response to global change. Trends Ecol. Evol. 22, 357–365. doi:10.1016/j.tree.2007.04.003
CLIMAS (2021). 2021 SW monsoon recap. CLIMAS: Climate assessment for the Southwest. Available at: https://climas.arizona.edu/swco/southwest-climate-outlook-october-2021/sw-monsoon-tracker-oct-2021.
Cohen, W. B., and Goward, S. N. (2004). Landsat’s role in ecological applications of remote sensing. BioScience 54, 535. doi:10.1641/0006-3568(2004)054[0535:LRIEAO]2.0.CO;2
Cohen, W. B. (1991). Response of vegetation indices to changes in three measures of leaf water stress. Photogrammetric Engineering and Remote Sensing.
Cook, B. I., Ault, T. R., and Smerdon, J. E. (2015). Unprecedented 21st century drought risk in the American southwest and central plains. Sci. Adv. 1, e1400082. doi:10.1126/sciadv.1400082
Culler, R. C., Burkham, D. E., Collings, M. R., Davidson, E. S., Laney, R. L., Leppanen, O. E., et al. (1970). Objectives, methods, and environment Gila River Phreatophyte project, graham county, Arizona. United states department of the interior. Available at: https://pubs.usgs.gov/pp/0655a/report.pdf.
Culler, R. C., Hanson, R. L., Myrick, R. M., Turner, R. M., and Kipple, F. P. (1982). Evapotranspiration before and after clearing phreatophytes, Gila River flood plain, graham county, Arizona. United states department of the interior. Available at: https://pubs.usgs.gov/pp/0655p/report.pdf.
Davis, E. C., Sohngen, B., and Lewis, D. J. (2022). The effect of carbon fertilization on naturally regenerated and planted US forests. Nat. Commun. 13, 5490. doi:10.1038/s41467-022-33196-x
Dennison, P. E., Nagler, P. L., Hultine, K. R., Glenn, E. P., and Ehleringer, J. R. (2009). Remote monitoring of tamarisk defoliation and evapotranspiration following saltcedar leaf beetle attack. Remote Sens. Environ. 113, 1462–1472. doi:10.1016/j.rse.2008.05.022
DeVries, B., Pratihast, A. K., Verbesselt, J., Kooistra, L., and Herold, M. (2016). Characterizing forest change using community-based monitoring data and Landsat time series. PLoS ONE 11, e0147121. doi:10.1371/journal.pone.0147121
Dewitz, J.USGS (2021). National land cover Database (NLCD) 2019 products (ver. 2.0, June 2021). ScienceBase data repository: U.S. Geological Survey. Available at. doi:10.5066/P9KZCM54
Diao, C., and Wang, L. (2016). Incorporating plant phenological trajectory in exotic saltcedar detection with monthly time series of Landsat imagery. Remote Sens. Environ. 182, 60–71. doi:10.1016/j.rse.2016.04.029
Diao, C., and Wang, L. (2018). Landsat time series-based multiyear spectral angle clustering (MSAC) model to monitor the inter-annual leaf senescence of exotic saltcedar. Remote Sens. Environ. 209, 581–593. doi:10.1016/j.rse.2018.02.036
Drus, G. M. (2013). “Fire ecology of Tamarix,” in Tamarix: A case study of ecological change in the American west (Oxford University Press). Available at. doi:10.1093/acprof:osobl/9780199898206.001.0001
Dwire, K. A., and Kauffman, J. B. (2003). Fire and riparian ecosystems in landscapes of the Western USA. For. Ecol. Manag. 178, 61–74. doi:10.1016/S0378-1127(03)00053-7
Edwards, E. J., Osborne, C. P., Strömberg, C. A. E., Smith, S. A., Grasses Consortium, C., Bond, W. J., et al. (2010). The origins of C4 grasslands: Integrating evolutionary and ecosystem science. Science 328, 587–591. doi:10.1126/science.1177216
Eppehimer, D., Fard, E., Kemper, J., Sierks, M., Morrisett, C., Sturtevant, J., et al. (2021). Climate adaptation planning to support ecosystems and people in the Gila River Watershed. Arizona.
ESA (2023). Sentinel-2 MSI user guide. Available at: https://sentinel.esa.int/web/sentinel/user-guides/sentinel-2-msi.
ESRI (2020). ArcMap desktop. Available at: https://www.esri.com/en-us/arcgis/products/arcgis-desktop/resources.
Fairfax, E., and Whittle, A. (2020). Smokey the beaver: Beaver dammed riparian corridors stay green during wildfire throughout the Western United States. Ecol. Appl. 30, e02225. doi:10.1002/eap.2225
Foga, S., Scaramuzza, P. L., Guo, S., Zhu, Z., Dilley, R. D., Beckmann, T., et al. (2017). Cloud detection algorithm comparison and validation for operational Landsat data products. Remote Sens. Environ. 194, 379–390. doi:10.1016/j.rse.2017.03.026
Fu, B., and Burgher, I. (2015). Riparian vegetation NDVI dynamics and its relationship with climate, surface water and groundwater. J. Arid Environ. 113, 59–68. doi:10.1016/j.jaridenv.2014.09.010
Gibson, P. P., and Olden, J. D. (2014). Ecology, management, and conservation implications of North American beaver (Castor canadensis) in dryland streams. Aquat. Conserv. Mar. Freshw. Ecosyst. 24, 391–409. doi:10.1002/aqc.2432
Glenn, E. P., and Nagler, P. L. (2005). Comparative ecophysiology of Tamarix ramosissima and native trees in Western U.S. riparian zones. J. Arid Environ. 61, 419–446. doi:10.1016/j.jaridenv.2004.09.025
Google Earth Engine Community (2021). Non-parametric trend analysis. Available at: https://developers.google.com/earth-engine/tutorials/community/nonparametric-trends.
Google Earth Engine (2022a). Gridmet drought: CONUS drought indices. Earth engine data catalog. Available at: https://developers.google.com/earth-engine/datasets/catalog/GRIDMET_DROUGHT#description.
Google Earth Engine (2022b). Landsat collections. Earth engine data catalog. Available at: https://developers.google.com/earth-engine/datasets/catalog/landsat/.
Gorelick, N., Hancher, M., Dixon, M., Ilyushchenko, S., Thau, D., and Moore, R. (2017). Google earth engine: Planetary-scale geospatial analysis for everyone. Remote Sens. Environ. 202, 18–27. doi:10.1016/j.rse.2017.06.031
Green, D. (2007). “Chapter 5: Biological processes in riparian areas,” in Arizona’s riparian areas (University of Arizona College of Agricluture and Life Sciences: UArizona CALS). Available at: https://cals.arizona.edu/extension/riparian/pub/UARA_07-17-07_chapter5.pdf.
Gremer, J. R., Bradford, J. B., Munson, S. M., and Duniway, M. C. (2015). Desert grassland responses to climate and soil moisture suggest divergent vulnerabilities across the southwestern United States. Glob. Change Biol. 21, 4049–4062. doi:10.1111/gcb.13043
Halofsky, J. E., Peterson, D. L., and Harvey, B. J. (2020). Changing wildfire, changing forests: The effects of climate change on fire regimes and vegetation in the pacific northwest, USA. fire Ecol. 16, 4. doi:10.1186/s42408-019-0062-8
Harms, R. S., and Hiebert, R. D. (2006). Vegetation response following invasive tamarisk (Tamarix spp) removal and implications for riparian restoration. Restor. Ecol. 14, 461–472. doi:10.1111/j.1526-100X.2006.00154.x
Hartfield, K., Leeuwen, W. J. D. V., and Gillan, J. K. (2020). Remotely sensed changes in vegetation cover distribution and groundwater along the lower Gila River. Land 9, 326. doi:10.3390/land9090326
Healey, S., Cohen, W., Zhiqiang, Y., and Krankina, O. (2005). Comparison of Tasseled Cap-based Landsat data structures for use in forest disturbance detection. Remote Sens. Environ. 97, 301–310. doi:10.1016/j.rse.2005.05.009
Huckleberry, G. (1996). Historical geomorphology of the Gila River. Arizona geological Survey. Available at: https://repository.arizona.edu/handle/10150/629787.
Huylenbroeck, L., Laslier, M., Dufour, S., Georges, B., Lejeune, P., and Michez, A. (2020). Using remote sensing to characterize riparian vegetation: A review of available tools and perspectives for managers. J. Environ. Manag. 267, 110652. doi:10.1016/j.jenvman.2020.110652
Jacobs, K. L., Garfin, G. M., and Morehouse, B. J. (2005). Climate science and drought planning: The Arizona experience. J. Am. Water Resour. Assoc. 41, 437–446. doi:10.1111/j.1752-1688.2005.tb03747.x
Jin, S., and Sader, S. A. (2005). Comparison of time series tasseled cap wetness and the normalized difference moisture index in detecting forest disturbances. Remote Sens. Environ. 94, 364–372. doi:10.1016/j.rse.2004.10.012
Kauth, R. J., and Thomas, G. S. (1976). The tasselled cap -- A graphic description of the spectral-temporal development of agricultural crops as seen by landsat. Symposium Mach. Process. Remote. Sensed Data - Conf. Proc. 13. Available at: https://ntrs.nasa.gov/citations/19770032233
Kennard, D., Louden, N., Gemoets, D., Ortega, S., González, E., Bean, D., et al. (2016). Tamarix dieback and vegetation patterns following release of the northern tamarisk beetle (Diorhabda carinulata) in Western Colorado. Biol. Control 101, 114–122. doi:10.1016/j.biocontrol.2016.07.004
Kerr, J. T., and Ostrovsky, M. (2003). From space to species: Ecological applications for remote sensing. Trends Ecol. Evol. 18, 299–305. doi:10.1016/S0169-5347(03)00071-5
Leblon, B., García, P. A. F., Oldford, S., Maclean, D. A., and Flannigan, M. (2007). Using cumulative NOAA-AVHRR spectral indices for estimating fire danger codes in northern boreal forests. Int. J. Appl. Earth Observation Geoinformation 9, 335–342. doi:10.1016/j.jag.2006.11.001
Lesica, P., and Miles, S. (2001). Tamarisk growth at the northern margin of its naturalized range in Montana, USA. U. S. A. Wetl. 21, 240–246. doi:10.1672/0277-5212(2001)021[0240:TGATNM]2.0.CO;2
Long, J. W., and Davis, J. (2016). Erosion and restoration of two headwater wetlands following a severe wildfire. Ecol. Rest. 34, 317–332. doi:10.3368/er.34.4.317
MacDonald, G. M., Stahle, D. W., Diaz, J. V., Beer, N., Busby, S. J., Cerano-Paredes, J., et al. (2008). Climate warming and 21st-century drought in southwestern north America. Eos Trans. AGU 89, 82. doi:10.1029/2008EO090003
Macfarlane, W. W., McGinty, C. M., Laub, B. G., and Gifford, S. J. (2017). High-resolution riparian vegetation mapping to prioritize conservation and restoration in an impaired desert river: Conservation and restoration site prioritization. Restor. Ecol. 25, 333–341. doi:10.1111/rec.12425
Middleton, B. R., and Norman, L. M. (2021). Remote sensing analysis to quantify change in woodland canopy cover on the san Carlos Apache reservation, Arizona, USA (1935 vs. 2017). Land 10, 393. doi:10.3390/land10040393
Misra, G., Cawkwell, F., and Wingler, A. (2020). Status of phenological research using sentinel-2 data: A review. Remote Sens. 12, 2760. doi:10.3390/rs12172760
Munson, S. M., Bradford, J. B., Butterfield, B. J., and Gremer, J. R. (2022). Primary production responses to extreme changes in North American Monsoon precipitation vary by elevation and plant functional composition through time. J. Ecol. 110, 2232–2245. doi:10.1111/1365-2745.13947
Nagler, P. L., Nguyen, U., Bateman, H. L., Jarchow, C. J., Glenn, E. P., Waugh, W. J., et al. (2018). Northern tamarisk beetle (Diorhabda carinulata) and tamarisk (Tamarix spp) interactions in the Colorado River basin: Northern tamarisk beetle and tamarisk interactions. Restor. Ecol. 26, 348–359. doi:10.1111/rec.12575
Naiman, R. J., and Décamps, H. (1997). The ecology of interfaces: Riparian zones. Annu. Rev. Ecol. Syst. 28, 621–658. doi:10.1146/annurev.ecolsys.28.1.621
NASA (2021). Landsat science. The Landsat program. Available at: https://landsat.gsfc.nasa.gov/(Accessed January 26, 2021).
NASA (2023). MODIS moderate resolution imaging spectroradiometer. Available at: https://modis.gsfc.nasa.gov/.
Naumburg, E., Mata-gonzalez, R., Hunter, R. G., Mclendon, T., and Martin, D. W. (2005). Phreatophytic vegetation and groundwater fluctuations: A review of current research and application of ecosystem response modeling with an emphasis on great basin vegetation. Environ. Manag. 35, 726–740. doi:10.1007/s00267-004-0194-7
NLCD (2016). Multi-resolution land characteristics (MRLC) consortium national land cover Database. Available at: https://www.mrlc.gov/.
NOAANIDIS (2022). Southwest drought briefing – a focus on snowpack: April 5, 2022. Drought.gov. Available at: https://www.drought.gov/webinars/southwest-drought-briefing-focus-snowpack-april-5-2022.
Norman, L. M., Brinkerhoff, F., Gwilliam, E., Guertin, D. P., Callegary, J., Goodrich, D. C., et al. (2015). Hydrologic response of streams restored with check dams in the chiricahua Mountains, Arizona. River Res. Appl. 32, 519–527. doi:10.1002/rra.2895
Norman, L. M. (2020). Ecosystem services of riparian restoration: A review of rock detention structures in the madrean archipelago ecoregion. Air, Soil Water Res. 13, 117862212094633. doi:10.1177/1178622120946337
Norman, L. M., Gishey, M., Gass, L., Yanites, B., Pfeifer, E., and Simms, R. (2006). Processed 1938 Aerial Photography for Selected Areas of the Lower Colorado River, Southwestern United States. U.S. Department of the Interior: U.S. Geological Survey. Available at: https://pubs.usgs.gov/of/2006/1141/
Norman, L. M., Lal, R., Wohl, E., Fairfax, E., Gellis, A. C., and Pollock, M. M. (2022). Natural infrastructure in dryland streams (NIDS) can establish regenerative wetland sinks that reverse desertification and strengthen climate resilience. Sci. Total Environ. 849, 157738. doi:10.1016/j.scitotenv.2022.157738
Norman, L. M., Middleton, B. R., and Wilson, N. R. (2018). Remote sensing analysis of vegetation at the San Carlos Apache Reservation, Arizona and surrounding area. J. Appl. Rem. Sens. 12, 1. doi:10.1117/1.JRS.12.026017
Norman, L. M., Villarreal, M., Pulliam, H. R., Minckley, R., Gass, L., Tolle, C., et al. (2014). Remote sensing analysis of riparian vegetation response to desert marsh restoration in the Mexican Highlands. Ecol. Eng. 70, 241–254. doi:10.1016/j.ecoleng.2014.05.012
Orr, B. K., Leverich, G. T., Diggory, Z. E., Dudley, T. L., Hatten, J. R., Hultine, K. R., et al. (2014). Riparian restoration framework for the upper Gila River, Arizona. Safford, AZ: Gila Watershed Partnership of Arizona.
Osman, M., Zaitchik, B. F., and Winstead, N. S. (2022). Cascading drought-heat dynamics during the 2021 southwest United States heatwave. Geophys. Res. Lett. 49. doi:10.1029/2022GL099265
Park, D. M., Culler, R. C., and Turner, R. M. (1978). Management of flood-plain vegetation, 1967 to 1972, san Carlos Indian reservation, Arizona. U.S. Geological Survey. Available at. doi:10.3133/ofr78412
Petrakis, R. E., Norman, L. M., and Middleton, B. R. (2023). Mapping riparian vegetation response to climate change on the san Carlos Apache reservation and upper Gila River Watershed to inform restoration priorities: 1935 to present - Database of trends in vegetation properties and climate adaptation variables. USGS ScienceBase Data Repository. Available at. doi:10.5066/P9HL0N5T
Petrakis, R. E., Soulard, C. E., Waller, E. K., and Walker, J. J. (2022). Analysis of surface water trends for the conterminous United States using MODIS satellite data. Water Resour. Res. 58, 2003–2019. doi:10.1029/2021WR031399
Petrakis, R. E., van Leeuwen, W., Villarreal, M. L., Tashjian, P., Dello Russo, R., and Scott, C. (2017). Historical analysis of riparian vegetation change in response to shifting management objectives on the Middle rio grande. Land 6, 29. doi:10.3390/land6020029
Petrakis, R. E., Villarreal, M. L., Wu, Z., Hetzler, R., Middleton, B. R., and Norman, L. M. (2018). Evaluating and monitoring forest fuel treatments using remote sensing applications in Arizona, U.S.A. For. Ecol. Manag. 413, 48–61. doi:10.1016/j.foreco.2018.01.036
Petrakis, R. E., Wu, Z., McVay, J., Middleton, B., Dye, D., and Vogel, J. (2016). Vegetative response to water availability on the San Carlos Apache Reservation. For. Ecol. Manag. 378, 14–23. doi:10.1016/j.foreco.2016.07.012
Pettorelli, N., Laurance, W. F., O’Brien, T. G., Wegmann, M., Nagendra, H., and Turner, W. (2014). Satellite remote sensing for applied ecologists: opportunities and challenges. J. Appl. Ecol. 51, 839–848. doi:10.1111/1365-2664.12261
Poff, N. L., Allan, J. D., Bain, M. B., Karr, J. R., Prestegaard, K. L., Richter, B. D., et al. (1997). The Natural Flow Regime. BioScience 47, 769–784. doi:10.2307/1313099
Priyadarshana, W. J. R. M., and Sofronov, G. (2015). R Package breakpoint. Available at: https://cran.r-project.org/web/packages/breakpoint/index.html.
R Core Team (2022). R Software. Available at: https://www.r-project.org/.
Reeves, J., Chen, J., Wang, X. L., Lund, R., and Lu, Q. Q. (2007). A Review and Comparison of Changepoint Detection Techniques for Climate Data. J. Appl. Meteorology Climatol. 46, 900–915. doi:10.1175/JAM2493.1
RiversEdge West (2021). What is the Tamarisk Beetle? RiversEdge West Tamarisk Beetle. Available at: https://riversedgewest.org/services/tamariskbeetle (Accessed February 4, 2021).
Rood, S. B., Goater, L. A., Mahoney, J. M., Pearce, C. M., and Smith, D. G. (2007). Floods, fire, and ice: disturbance ecology of riparian cottonwoodsThe review is one of a selection of papers published in the Special Issue on Poplar Research in Canada. Can. J. Bot. 85, 1019–1032. doi:10.1139/B07-073
Seaber, P. R., Kapinos, F. P., and Knapp, G. L. (1987). Hydrologic unit maps. U.S. Geological Survey. Water-Supply Paper 2294.
Seager, R., Ting, M., Alexander, P., Nakamura, J., Liu, H., Li, C., et al. (2022). Mechanisms of a Meteorological Drought Onset: Summer 2020 to Spring 2021 in Southwestern North America. J. Clim. 35, 7367–7385. doi:10.1175/JCLI-D-22-0314.1
Seager, R., Ting, M., Li, C., Naik, N., Cook, B., Nakamura, J., et al. (2013). Projections of declining surface-water availability for the southwestern United States. Nat. Clim. Change 3, 482–486. doi:10.1038/nclimate1787
Segarra, J., Buchaillot, M. L., Araus, J. L., and Kefauver, S. C. (2020). Remote Sensing for Precision Agriculture: Sentinel-2 Improved Features and Applications. Agronomy 10, 641. doi:10.3390/agronomy10050641
Shafroth, P. B., Friedman, J. M., and Ischinger, L. S. (1995). Effects of Salinity on Establishment of Populus Fremontii (Cottonwood) and Tamarix Ramosissima (Saltcedar) in Southwestern United States. Gt. Basin Nat. 55, 58–65. doi:10.2307/41712864
Shammi, S. A., and Meng, Q. (2021). Use time series NDVI and EVI to develop dynamic crop growth metrics for yield modeling. Ecol. Indic. 121, 107124. doi:10.1016/j.ecolind.2020.107124
Smith, D. M., Finch, D. M., Gunning, C., Jemison, R., and Kelly, J. F. (2009). Post-Wildfire Recovery of Riparian Vegetation during a Period of Water Scarcity in the Southwestern USA. fire Ecol. 5, 38–55. doi:10.4996/fireecology.0501038
Smith, D. M., and Finch, D. M. (2014). Use of Native and Nonnative Nest Plants by Riparian-Nesting Birds along Two Streams in New Mexico. River Res. Applic 30, 1134–1145. doi:10.1002/rra.2713
Smith, D. M., Kelly, J. F., and Finch, D. M. (2006). Wildfire, Exotic Vegetation, and Breeding Bird Habitat in.
Snyder, K. A., and Scott, R. L. (2020). Longer term effects of biological control on tamarisk evapotranspiration and carbon dioxide exchange. Hydrol. Process. 34, 223–236. doi:10.1002/hyp.13639
Stagge, J. H., Tallaksen, L. M., and Xu, C.-Y. (2014). “Standardized precipitation-evapotranspiration index (SPEI): Sensitivity to potential evapotranspiration model and parameters,” in Hydrology in a changing world: Environmental and human dimensions proceedings of FRIEND-water 2014.
Stevens, L. E., and Siemion, G. (2012). Tamarisk Reproductive Phenology and Colorado River Hydrography, Southwestern USA. J. Arizona-Nevada Acad. Sci. 44, 46–58. doi:10.2181/036.044.0106
Stillwater Sciences, and UArizona WRRC (2018). Upper Gila River Watershed Assessment Draft Report. Available at: https://www.gwpaz.org/uploads/b/9d52ff60-b669-11ea-86c9-437433cc9a75/Watershed-Assessment-GWP_WFF-FINAL.pdf.
Stromberg, J. C., Beauchamp, V. B., Dixon, M. D., Lite, S. J., and Paradzick, C. (2007). Importance of low-flow and high-flow characteristics to restoration of riparian vegetation along rivers in arid south-Western United States. Freshw. Biol. 52, 651–679. doi:10.1111/j.1365-2427.2006.01713.x
Strong, C., McCabe, G. J., and Weech, A. (2020). Step Increase in Eastern U.S. Precipitation Linked to Indian Ocean Warming. Geophys. Res. Lett. 47. doi:10.1029/2020GL088911
Tamiminia, H., Salehi, B., Mahdianpari, M., Quackenbush, L., Adeli, S., and Brisco, B. (2020). Google Earth Engine for geo-big data applications: A meta-analysis and systematic review. ISPRS J. Photogrammetry Remote Sens. 164, 152–170. doi:10.1016/j.isprsjprs.2020.04.001
Tucker, C. J. (1979). Red and Photographic Infrared Linear Combinations for Monitoring Vegetation. Remote Sens. Environ. 8, 127–150. doi:10.1016/0034-4257(79)90013-0
UArizona WRRC (2022). Key Regulations Impacting Land and Water Use. The University of Arizona Water Resources Research Center. Available at: https://wrrc.cals.arizona.edu/programs/water-rapids/projects/watershed-planning-upper-gila-watershed/guide-landowners-upper-30.
USA NPN (2022). Why Phenology? USA National Phenology Network. Available at: https://www.usanpn.org/about/why-phenology.
USDA (2021). NAIP Imagery. National Agriculture Imagery Program (NAIP). Available at: https://naip-usdaonline.hub.arcgis.com/(Accessed January 26, 2021).
USGS (2017). 1 Arc-second Digital Elevation Models (DEMs) - USGS National Map 3DEP Downloadable Data Collection. USGS ScienceBase Data Repository: U.S. Geological Survey. Available at: https://www.sciencebase.gov/catalog/item/4f70aa71e4b058caae3f8de1.
USGS BAER (2022a). Burned Area Emergency Response (BAER). Available at: https://burnseverity.cr.usgs.gov/baer/.
USGS BAER (2022b). Mapping Burn Severity for Burned Area Emergency Response (BAER) and Monitoring Trends in Burn Severity (MTBS). Available at: https://www.mtbs.gov/baer.
USGS (2022). How do I use a scale factor with Landsat Level-2 science products? Available at: https://www.usgs.gov/faqs/how-do-i-use-scale-factor-landsat-level-2-science-products#:∼:text=Surface%20Temperature%20Landsat%20Collection%202%20surface%20temperature%20has,302.6%20Kelvin%20after%20the%20scale%20factor%20is%20applied.
USGS NHD (2020). National Hydrography Dataset. Available at: https://www.usgs.gov/national-hydrography/national-hydrography-dataset.
Vicente-Serrano, S. M., Beguería, S., and López-Moreno, J. I. (2010). A Multiscalar Drought Index Sensitive to Global Warming: The Standardized Precipitation Evapotranspiration Index. J. Clim. 23, 1696–1718. doi:10.1175/2009JCLI2909.1
Vicente-Serrano, S. M., Camarero, J. J., Olano, J. M., Martín-Hernández, N., Peña-Gallardo, M., Tomás-Burguera, M., et al. (2016). Diverse relationships between forest growth and the Normalized Difference Vegetation Index at a global scale. Remote Sens. Environ. 187, 14–29. doi:10.1016/j.rse.2016.10.001
Wang, L., Diao, C., Xian, G., Yin, D., Lu, Y., Zou, S., et al. (2020). A summary of the special issue on remote sensing of land change science with Google Earth engine. Remote Sens. Environ. 248, 112002. doi:10.1016/j.rse.2020.112002
Wang, Y., Liu, G., and Guo, E. (2019). Spatial distribution and temporal variation of drought in Inner Mongolia during 1901–2014 using Standardized Precipitation Evapotranspiration Index. Sci. Total Environ. 654, 850–862. doi:10.1016/j.scitotenv.2018.10.425
Webb, A. D., Falk, D. A., and Finch, D. M. (2019). Fire ecology and management in lowland riparian ecosystems of the southwestern United States and northern Mexico, 140.
Williams, A. P., Cook, E. R., Smerdon, J. E., Cook, B. I., Abatzoglou, J. T., Bolles, K., et al. (2020). Large contribution from anthropogenic warming to an emerging North American megadrought. Science 368, 314–318. doi:10.1126/science.aaz9600
Wilson, N. R., and Norman, L. M. (2018). Analysis of vegetation recovery surrounding a restored wetland using the normalized difference infrared index (NDII) and normalized difference vegetation index (NDVI). Int. J. Remote Sens. 39, 3243–3274. doi:10.1080/01431161.2018.1437297
Wilson, N. R., and Norman, L. M. (2022). Five Year Analyses of Vegetation Response to Restoration using Rock Detention Structures in Southeastern Arizona, United States. Environ. Manag. 71, 921–939. doi:10.1007/s00267-022-01762-0
Wonkka, C. L., Twidwell, D., Bielski, C. H., Allen, C. R., and Stambaugh, M. C. (2018). Regeneration and invasion of cottonwood riparian forest following wildfire: Cottonwood restoration following wildfire. Restor. Ecol. 26, 456–465. doi:10.1111/rec.12577
Wu, Q., Lane, C. R., Li, X., Zhao, K., Zhou, Y., Clinton, N., et al. (2019). Integrating LiDAR data and multi-temporal aerial imagery to map wetland inundation dynamics using Google Earth Engine. Remote Sens. Environ. 228, 1–13. doi:10.1016/j.rse.2019.04.015
Wu, Z., Velasco, M., McVay, J., Middleton, B. R., Vogel, J., and Dye, D. (2016). MODIS Derived Vegetation Index for Drought Detection on the San Carlos Apache Reservation. Int. J. Adv. Remote Sens. GIS 5, 1524–1538. doi:10.23953/cloud.ijarsg.44
Yang, Z., Dominguez, F., Gupta, H., Zeng, X., and Norman, L. (2016). Urban Effects on Regional Climate: A Case Study in the Phoenix and Tucson Sun Corridor. Earth Interact. 20, 1–25. doi:10.1175/EI-D-15-0027.1
Keywords: riparian vegetation, remote sensing, Sen’s slope, climate periods, indigenous science, riparian restoration, riparian wildfire
Citation: Petrakis RE, Norman LM and Middleton BR (2023) Riparian vegetation response amid variable climate conditions across the Upper Gila River watershed: informing Tribal restoration priorities. Front. Environ. Sci. 11:1179328. doi: 10.3389/fenvs.2023.1179328
Received: 03 March 2023; Accepted: 21 June 2023;
Published: 04 July 2023.
Edited by:
George Xian, United States Department of the Interior, United StatesReviewed by:
José Maria Santos, University of Lisbon, PortugalCopyright © 2023 Petrakis, Norman and Middleton. This is an open-access article distributed under the terms of the Creative Commons Attribution License (CC BY). The use, distribution or reproduction in other forums is permitted, provided the original author(s) and the copyright owner(s) are credited and that the original publication in this journal is cited, in accordance with accepted academic practice. No use, distribution or reproduction is permitted which does not comply with these terms.
*Correspondence: Roy E. Petrakis, rpetrakis@usgs.gov
Disclaimer: All claims expressed in this article are solely those of the authors and do not necessarily represent those of their affiliated organizations, or those of the publisher, the editors and the reviewers. Any product that may be evaluated in this article or claim that may be made by its manufacturer is not guaranteed or endorsed by the publisher.
Research integrity at Frontiers
Learn more about the work of our research integrity team to safeguard the quality of each article we publish.