 Nathan J. Wood
 Daniel H. Doctor
 Jay Alder3†
94% of researchers rate our articles as excellent or good
Learn more about the work of our research integrity team to safeguard the quality of each article we publish.
Find out more
ORIGINAL RESEARCH article
Front. Earth Sci., 18 July 2023
Sec. Solid Earth Geophysics
Volume 11 - 2023 | https://doi.org/10.3389/feart.2023.1207689
This article is part of the Research TopicSinkholes: State of the Art Research and Land MonitoringView all articles
Sinkholes in karst and pseudokarst regions threaten infrastructure, property, and lives. We mapped closed depressions in karst and pseudokarst regions of the conterminous United States (U.S.) from 10-m-resolution elevation data using high-performance computing, and then created a heuristic additive model of sinkhole susceptibility that also included nationally consistent data for factors related to geology, soils, precipitation extremes, and development. Maps identify potential sinkhole hotspots based on current conditions and projections for 50 years into the future (the years 2070–2079) based on climate change and urban development scenarios. Areas characterized as having either high or very high sinkhole susceptibility contain 94%–99% of known or probable sinkhole locations from three U.S. state databases. States and counties with the highest amounts and percentages of land in zones of highest sinkhole susceptibility are identified. Projected changes in extreme precipitation and development did not substantially change current hotspots of highest sinkhole susceptibility. Results provide a uniform index of sinkhole potential that can support national planning, instead of existing assessments produced through various methods within individual states or smaller areas.
Sinkholes are ground depressions that form from the gradual subsidence or sudden collapse of land above natural or anthropogenic underground voids in the subsurface. These voids are produced naturally in karst landscapes, which develop in areas where soluble bedrock has been dissolved over time by groundwater. Natural land surface depressions and collapses also can occur in pseudokarst areas where voids are created by other processes, such as volcanic lava flows and sediment piping. Almost all fifty states in the United States (U.S.) have some amount of land that is underlain by soluble rocks having karst or the potential for karst features such as sinkholes, caves, and large springs (Weary and Doctor, 2014).
Sinkholes in karst and pseudokarst landscapes of the U.S. threaten human lives, property, critical facilities, infrastructure, and natural and cultural resources (Newton, 1987; Gutiérrez, 2016), yet currently there is no national database of sinkhole occurrences and related losses. Estimates of U.S. sinkhole-related costs based on incomplete data range from $125 million to $300 million per year (Federal Emergency Management Agency, 1997; Weary, 2015). These estimates are likely to be low since the State of Florida alone reported sinkhole claims of approximate $1.4 billion between 2006 and 2010 (Florida Office of Insurance Regulation, 2010). Developing strategies to minimize losses from future sinkholes is challenging because of the complex and often hidden interplay of hydrologic, geochemical, and mechanical factors that create them (Galve et al., 2009; Gutiérrez, 2016), as well as the historic lack of nationally consistent data to better understand sinkhole-formation processes.
Davies et al. (1984) provided the first national map to document U.S. areas that were prone to karst development based on bedrock geology and historic sinkhole occurrence. A revised national karst map was published by Veni (2002), followed by a series of regional and state-scale maps to identify karst features (Kuniansky et al., 2016). Weary and Doctor (2014) provided a national map and digital database of potential karst areas that improved upon resolution and data accessibility (Figure 1); however, these data did not depict the relative degree of karst features. Doing so would have required geospatial data on sinkhole occurrence at the national level that were unavailable at that time. There have been several case studies in recent years focused on determining the influence of landscape characteristics on sinkhole formation to move from mapping karst features to predicting sinkhole occurrence (Hyland et al., 2006; Galve et al., 2009; Doctor and Doctor, 2012; Al-Kouri et al., 2013; Green, 2015; Ivey-Burden and Todd, 2015; Kromhout and Baker, 2015; Kidanu et al., 2018; Subedi et al., 2019; Kelner, 2020; Kim et al., 2020; Qui et al., 2020). Although fruitful for local application, the national applicability of several factors used in these studies is unclear and the lack of nationally consistent sinkhole data has made it challenging to determine their significance in different regions of varying geology, soils, hydrogeology, and urban development. For example, hydrogeological conditions have been shown to be important factors in local to regional sinkhole-susceptibility studies (Dong et al., 2020; Nam et al., 2020; Jia et al., 2021), but the highly dynamic, spatial and temporal variability of groundwater flow makes it challenging to recognize this factor in national-mapping efforts (Kim et al., 2020).
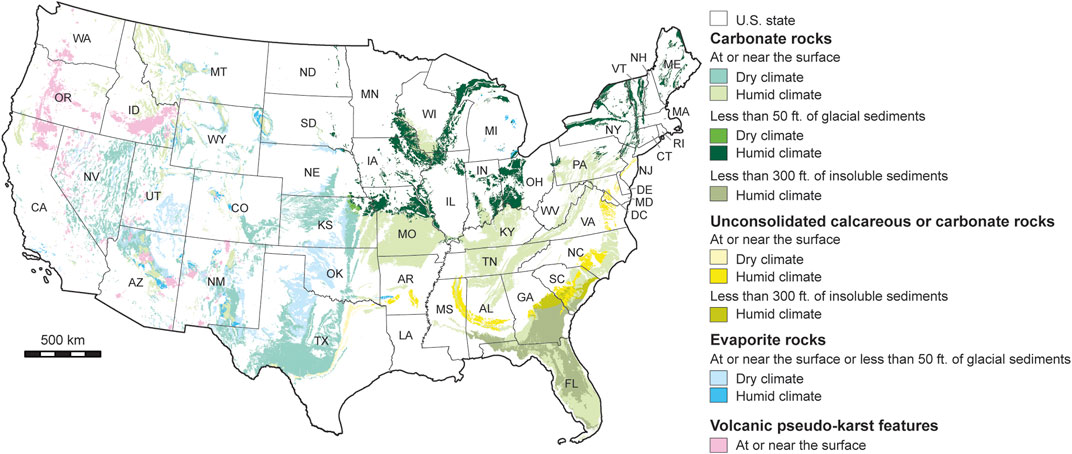
FIGURE 1. Types of karst geology in the conterminous United States, including carbonates, evaporites, and volcanic pseudokarst features, based on a national karst database (Weary and Doctor, 2014). State abbreviations are included and described in Figure 7.
To address these shortcomings, we developed a uniform analytical approach for characterizing and mapping sinkhole susceptibility in karst and pseudokarst regions across the conterminous United States. First, we used high-performance computing, digital elevation models, and various geospatial layers to develop a national map of closed depressions that reflects previous sinkhole development in karst and pseudokarst areas. We use closed-depression data in regions with potential for karst as the basis for our sinkhole-susceptibility mapping because previous work asserts that existing sinkhole density is the most reliable predictor of future sinkholes rather than other landscape-based modeling projections (Galve et al., 2009). Second, we created a Sinkhole Susceptibility Index (SSI) map by integrating closed-depression data with other nationally consistent geospatial data characterizing landscape attributes that are commonly associated with sinkhole development, including geology type, soil texture, anthropogenic development, and hydrologic forcing. Third, we compared our SSI map to state level databases of known and probable sinkholes to determine whether or not the SSI map accurately reflects the existing distribution of sinkholes. Fourth, we summarized current hotspots of sinkhole susceptibility within U.S. state and county boundaries for use in national scale, risk-reduction planning. Finally, we characterized and mapped future hotspots of sinkhole susceptibility for 2070–2079 based on projections of future urban development and climate variables. Our goal was to characterize relative sinkhole susceptibility and not to hindcast the importance of individual factors to understand sinkhole processes at a particular location. This information provides insight on where site-specific studies could be beneficial and for understanding long-term threats to development and infrastructure that may be in the initial planning stages.
We estimate and map Sinkhole Susceptibility Index (SSI) values across the conterminous U.S. by creating a heuristic additive model based on nationally consistent geospatial data for five factors: closed depressions in the land surface, type of karst or pseudokarst geology, soil textures, precipitation extremes, and urban development. We limit SSI mapping to areas of karst or pseudokarst geology with delineated closed depressions, as sinkholes are more expected in areas where existing features are clustered (Hyland et al., 2006; Galve et al., 2009; Doctor and Doctor, 2012; Kromhout and Baker, 2015; Kim et al., 2020). Sinkholes are possible, just less likely, in areas of karst or pseudokarst geology that currently lack any closed depressions in the land surface; therefore, we retain these areas in final SSI maps but classify them as having very low susceptibility.
In addition to closed-depression data, the other four SSI factors (geology, soil texture, precipitation extremes, and human development) are included because they consistently have been shown to influence sinkhole susceptibility in various settings (Galve et al., 2009; Al-Kouri et al., 2013; Kromhout and Baker, 2015; Gutiérrez, 2016; Kidanu et al., 2018; Subedi et al., 2019; Kim et al., 2020; Qui et al., 2020). Types of karst geology and soil texture are characterized relative to closed-depression frequency, as the general physical processes demonstrating sinkhole dependence on these factors have been established (Galve et al., 2009; Al-Kouri et al., 2013; Subedi et al., 2019; Kim et al., 2020). Such relationships have yet to be established for the influence of human development and precipitation extremes on sinkhole development; therefore, we used the presence of developed land and historic or predicted hydrologic extremes to recognize their influence on sinkhole susceptibility. The following sub-sections summarize the various data and methods used to (1) delineate closed depressions, (2) characterize and map SSI values based on current conditions and for 50 years into the future (i.e., 2070–2079), (3) compare SSI estimates with sinkhole-occurrence databases from several states to demonstrate the robustness of our approach, and (4) quantify variations in sinkhole susceptibility using U.S. state and county boundaries.
Closed depressions were delineated across the conterminous U.S. first by the automated processing of 3D Elevation Program (3DEP) digital elevation models (DEMs) at 1/3 arc-second (approximately 10 m) resolution (United States Geological Survey, 2017), National Transportation Dataset (NTD) road line vector data (United States Geological Survey, 2019), and National Hydrography Dataset (NHD) streamline vector data (United States Geological Survey, 2016) using a modified version of the Level Set tools summarized in Wu et al. (2019). An initial set of closed-surface depressions in each DEM was identified using a hydrologic routing algorithm in which hypothetical stream flow is forced to flow out across all edges of the elevation surface. If flow is obstructed by a cell in the DEM of lower elevation than all surrounding cells, then that cell’s elevation is raised to the elevation of the next lowest cell until flow can continue to flow from the depression. The potential for artificial closed-surface depressions that are created when streams pass beneath roads, bridges, culverts and other surface obstructions (Doctor and Young, 2013) was minimized by first conditioning DEMs to breach these “digital dams” using the HydroCutter custom ArcGIS toolbox (Wall et al., 2015) that was optimized to operate on large datasets. A minimum depth threshold of 2 m and a slicing interval of 2 m were applied to the Level Set tools (Wu et al., 2019) to capture only those depressions with a maximum depth greater than 2.0 m given the estimated root mean squared vertical error (RMSE) of 1.55 m of the 1/3 arc-second DEMs as of 2013 (Gesch et al., 2014). Current 3DEP 1/3 arc-second DEM products have an approximately 0.82 m RMSE (Stoker and Miller, 2022); therefore, future implementations of the SSI workflow using more accurate DEMs could reduce the minimum depth threshold and slicing interval.
A median filter smoothing function was applied with a kernel radius of 30 m to facilitate extraction of depressions with a minimum size threshold of 600 sq m. To condition and extract depressions from 927 DEMs of 1° × 1° area, we used the United States Geological Survey (USGS) Yeti Supercomputer (United States Geological Survey, 2021) to process approximately 5.1 TB of data, allowing us to allocate cores with 50–150 GB of RAM, customize each core with specific geospatial tools, and process multiple jobs in parallel over 12,000 core-hours on more than 6,600 cores. Technical documentation of geospatial workflows is fully described in Doctor et al. (2020) and Jones et al. (2021).
The initial closed-surface depression surface was then filtered using the following geospatial data.
• Geology: Areas with karst or pseudokarst geology were identified using a national karst database for the conterminous United States (Weary and Doctor, 2014) that was buffered 100 m to recognize the database’s 1:500,000 or smaller scale. The buffered karst or pseudokarst layer was used to retain only closed depressions occurring within karst-related geology. Depression polygons located in glacial till deposits greater than 50 feet (∼15 m) in thickness were removed based on Soller et al. (2012). Depression polygons located in river floodplains presumed to have alluvial deposits were removed using the gridded Soil Survey Geographic (gSSURGO) database (Soil Survey Staff, 2020) which identifies soil polygons susceptible to flooding of any frequency. Depressions located within 50 m of streams were removed to avoid anomalies in the elevation models due to locational inaccuracies for incised stream channels.
• Shape geometry: Depression polygons less than 600 sq m were removed to avoid artificial depressions that may have occurred near the minimum size threshold. Polygons of purely rectangular shape and of 1-pixel (10 m) width were removed to eliminate likely digital processing artifacts.
• Land cover: Closed depressions in areas classified as Open Water, Woody Wetlands, and Emergent Herbaceous Wetlands in the 2019 30-m, National Land Cover Database (NLCD) (Yang et al., 2018; Multi-Resolution Land Characteristics Consortium, 2019) data were removed to avoid the inclusion of permanently flooded closed depressions. These features are generally unlikely to be of concern for sinkhole collapse. Depressions in NLCD cells classified as Low Intensity Developed, Medium Intensity Developed, and High Intensity Developed were removed because identified depressions in these areas could be intentionally created and maintained.
• Anthropogenic depression: Depressions located within 50 m of roads (United States Geological Survey, 2019) were removed to minimize the inclusion of ditches and retention basins created for stormwater management along roads.
Polygons of closed-depressions generated by this process were then converted to centroid points to provide an overall inventory and to recognize the inherent uncertainty of capturing all possible features and delineating exact boundaries given the use of 10-m elevation data. Improved accuracy and precision of closed-depression mapping using higher-resolution, lidar-derived elevation data could support an areal approach in future work. The Point Statistics tool in the ArcGIS Pro toolbox (ESRI, 2023) with a neighborhood setting of “1” was used to create a grid of ∼6-km cells that identifies cells that contain at least one closed depression point. The snap raster for this operation was a historical extreme precipitation raster (see Section 2.2.5), which contains the largest grid cell size (∼6 km) in the analysis. The ∼6-km grid characterizing the presence of closed depressions was used as a mask and subsequent snap raster when processing input data and the final composite SSI maps.
Sinkhole Susceptibility Index (SSI) values are the sum of five parameters mapped using 6 km grid cells across the conterminous United States. We focus on the conterminous U.S. due to data availability. Two SSI maps are created: (a) current conditions, and (b) 2079 projections to provide insight on long-term planning of critical facilities and infrastructure. For each 6 km grid cell, the SSI value is defined as:
where d = the density of closed depressions centroid points per 6 km grid cell normalized to the maximum value; s = the percent frequency of closed depression centroid points within certain soil texture classes of an 800 m grid (Walkinshaw et al., 2021), aggregated to 6 km cell size by majority texture class, and normalized to the maximum frequency value; k = the percent frequency of closed depression centroid points within each class of karst type (Weary and Doctor, 2014), aggregated to 6 km cell size by majority karst type, and normalized to the maximum value; l = an aggregated value of known (2019) and projected (2079) amount of developed land per 6 km grid cell, normalized by the maximum value; and p = median values of the historic (1980–2009) or predicted (2070–2079) number of days exceeding the 95th percentile of precipitation in 6 km grid cells across the conterminous U.S., normalized to the maximum value.
For each parameter, grid-cell values are normalized to maximum values (Figure 2) to create relative assessments across the study area and not absolute estimates of sinkhole susceptibility based on a set of parameter thresholds. To retain non-integer values in our raster-data processing, the sum of the five parameters was multiplied by 106, and then converted to an integer value with a possible range of 0–5 million. The integers were then reclassified into 4 bins using manually-adjusted natural breaks in ArcGIS and divided by 106 for ease of reporting. The bins are referred to as having low, moderate, high, or very high sinkhole susceptibility. Value ranges for the natural-break bins in the two SSI maps were consistent and based on natural breaks in the current-conditions map. Grid cells were converted to polygons and then clipped using the buffered karst geology layer to only retain areas that reflect karst or pseudokarst geology. Areas containing karst geology (Figure 1) but lacking computed SSI values (i.e., NoData grid cells because they lacked modeled closed depressions) were retained in the final map and classified as having very low sinkhole susceptibility. The following sub-sections provide detail on each of the five SSI parameters. More-detailed descriptions of geospatial workflows are documented in Wood et al. (2023).
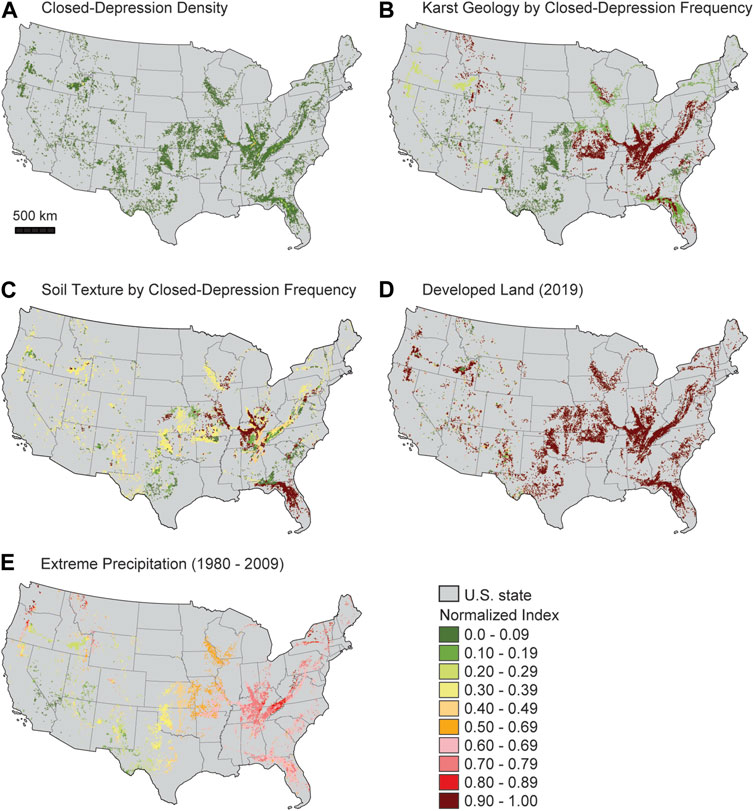
FIGURE 2. Maps of normalized values for SSI parameters, including (A) closed-depression density, (B) karst geology by closed-depression frequency, (C) soil texture by closed-depression frequency, (D) developed land (2019 data) and (E) median values of extreme precipitation between 1980–2009. SSI maps that estimate sinkhole susceptibility in the years 2070–2079 involve different maps of projected developed land and extreme precipitation. Additional information on data sources and analysis can be found in Wood et al. (2023).
Points identifying closed depressions were used to create a point density grid as one of the five input data of the SSI maps. Point densities were generated from the closed-surface-depression centroids discussed earlier based on a circular moving window with a radius of 6 km, which was chosen to align with the grid-cell size used for our SSI maps. Doctor et al. (2020) demonstrates a high level of agreement in closed-depression point densities within 1-km grid cells based on independent sinkhole point data in six states compared to densities of points identified with our automated workflow. Values were normalized to the maximum value (Figure 2A).
The type of karst and pseudokarst geology is an important factor in determining sinkhole susceptibility (Hyland et al., 2006; Kromhout and Baker, 2015; Gutiérrez, 2016; Subedi et al., 2019). Therefore, the karst and pseudokarst geology layer (Figure 1) was reclassified based on the percentages of closed-depression occurrence. Percentages were calculated by creating a frequency table of closed-depression points relative to the national karst database summarized in Weary and Doctor (2014) (Figure 3). This empirical approach to recognize the potential influence of karst and pseudokarst geology on sinkhole creation was done because there is insufficient research to generalize failure criteria for specific geology types. The polygonal, vector data were transformed to a 100-m-cell raster, transformed to centroid points, and then 6-km grid cells were developed based on the majority geology type. Values were normalized to the maximum value (Figure 2B).
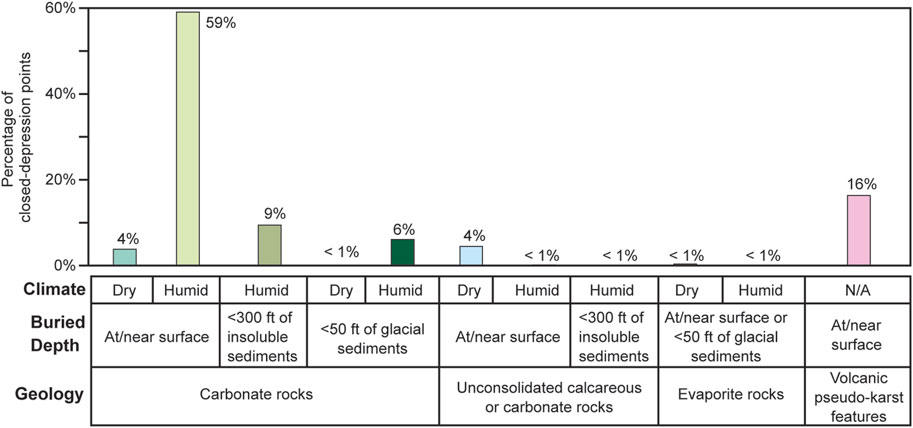
FIGURE 3. Percentage of closed-depression points based on underlying karst or pseudo-karst geology. Colors for types of karst geology correspond to those used in Figure 1. Percentages were calculated by creating a frequency table of closed-depression points relative to the buffered national karst database of Weary and Doctor (2014).
Soil texture influences sinkhole susceptibility because it influences the angle of internal friction, the effective cohesion, and the capacity of rainfall infiltration (Al-Kouri et al., 2013; Subedi et al., 2019; Kim et al., 2020). Grid cells of soil texture classes in 800-m-cell aggregated soil maps (Walkinshaw et al., 2021) were reclassified based on the percentage of closed-depression occurrences. Percentages were calculated by creating a frequency table of closed-depression points relative to 144 possible combinations of soil texture data based on soil depths of 0–25 cm and 25–50 cm (Figure 4). The 100-m karst-geology grid was used to only retain soil-texture cells that are in areas with karst or pseudokarst geology. The relevant grid cells were transformed to centroid points and then 6-km grid cells were developed based on the majority soil-texture type. Values were normalized to the maximum value (Figure 2C).
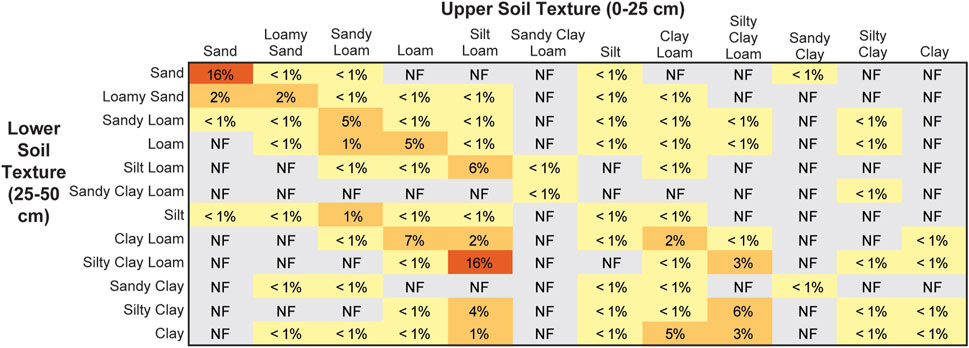
FIGURE 4. Percentage of closed-depression points based on combinations of surficial soil textures. Percentages were calculated by creating a frequency table of closed-depression points relative to 144 possible combinations of soil texture data (Walkinshaw et al., 2021) based on soil depths of 0–25 cm and 25–50 cm. “NF” denotes “not found,” noting that no closed depression points are on a specific soil-texture combination.
This empirical approach using only the first 50 cm of soil-depth data was done because of limited data and insufficient research at the national scale to generalize failure criteria for specific soil-texture types. We recognize that failure criteria could vary greatly due to other soil attributes for the same soil texture (e.g., cemented sand versus loose sand). In general, various geotechnical features of the entire soil sequence above a void can influence sinkhole susceptibility; however, our focus on the first 50 cm of soil depth likely highlights soil capacity for rainfall infiltration. Therefore, we provide results only to demonstrate the broad spatial coincidence of certain soil texture combinations and closed depressions and not to imply specific failure criteria or other geotechnical controls.
Mechanical disturbance of the landscape contributes to sinkhole development (Al-Kouri et al., 2013; Kromhout and Baker, 2015; Gutiérrez, 2016; Kidanu et al., 2018; Qui et al., 2020); however, we simply identified the presence of developed land since a generalizable cause-and-effect relationship has yet to be established between land development and sinkhole occurrence. Current developed land was characterized by the 2019 National Land Cover Database (NLCD) (Yang et al., 2018; Multi-Resolution Land Characteristics Consortium, 2019). Projections of developed land in 2079 were characterized by FOREcasting SCEnarios of Land-use Change (FORE-SCE) modeling products, specifically value “2” for developed land (Sohl et al., 2018). NLCD grid cells classified as Low Intensity Developed, Medium Intensity Developed, and High Intensity Developed were aggregated to a single “developed” class and resampled from original 30-m cell size to 250-m size to align with the FORE-SCE products. FORE-SCE products relate to Scenario A1B, which is relative to a 1992 baseline year, describes a balance across areas of technological change, and assumes very rapid economic growth, a global population that peaks in mid-century, and the rapid introduction of new technologies (Nakicenovic et al., 2000). The 2019 NLCD data were merged with the 2079 projections because FORE-SCE products exclude development associated with roads and other localized disturbances. The closed-depression grid was used to extract relevant developed-land cell values. Relevant grid cells were transformed to centroid points and then 6-km grid cells were developed with values noting the number of developed points. Two 6-km grids were developed: (a) current developed land based on the 2019 NLCD and (b) 2070–2079 projections based on FORE-SC projections. Values were normalized to the maximum value found in the 2019 NLCD grid to best quantify changes in development (Figure 2D).
High intensity but short duration storms can overwhelm the drainage capacity of soils and contribute to sinkholes (Tihansky, 1999; Gutiérrez, 2016). A generalizable cause-and-effect relationship between closed depressions and extreme precipitation has yet to be established; therefore, we simply mapped the number of days of extreme precipitation and did not relate to closed-depression density data like we did with other SSI inputs. Historic and future extreme precipitation potential was estimated using climate projections for the conterminous United States from Localized Constructed Analogs (LOCA, Pierce et al., 2014). LOCA are based on an ensemble of 32 global climate models forced by a high-emissions scenario identified as “Representative Concentration Pathway scenario 8.5” of the fifth phase of the Coupled Model Intercomparison Project (CMIP5) and statistically downscaled to 1/16° × 1/16° (∼6-km × ∼6-km). We calculated the annual number of days where precipitation exceeded the historical 95th percentile (referred to as R95pDAYS), which is a modification of the “R95pTOT” variable (University of New South Wales, 2021). R95pDAYS was calculated for two periods: 1980–2009 (i.e., historic conditions) and 2070–2079. We summarized the ensemble by pooling all models and all years within the time periods and used the median value (Figures 5A, B). Values were normalized to the maximum value found in the 1980–2009 grid that reflects historic conditions (Figure 2E).
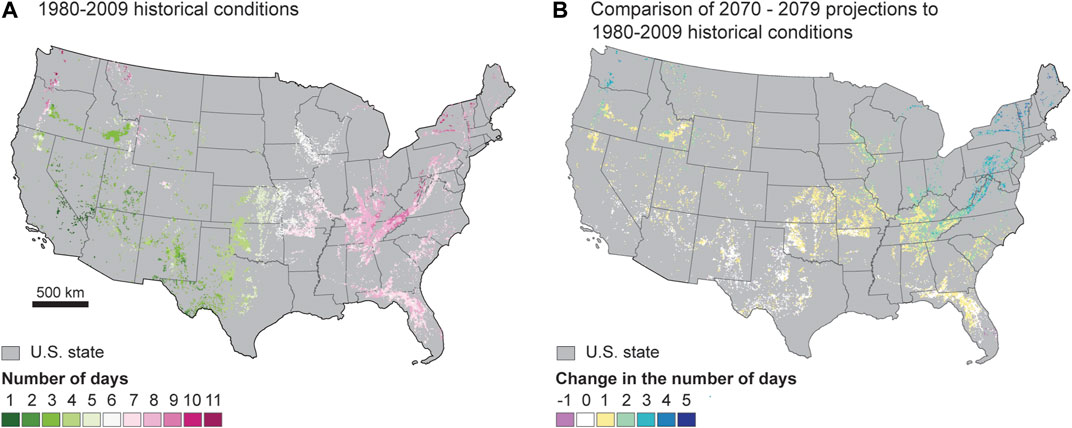
FIGURE 5. Maps of extreme-precipitation values for areas of karst and pseudokarst geology. Maps include (A) the number of days in a year where precipitation was projected to exceed the historical 95th percentile between 1980–2009 and (B) the change in the number of days by subtracting 1980–2009 values from 2070–2079 projected values. Additional information on data sources and analysis can be found in Wood et al. (2023).
The SSI map that assumes current precipitation and land development conditions was compared to individual state sinkhole-occurrence databases to determine whether or not the SSI map accurately reflects the existing distribution of sinkholes. We focused on states with the highest amount of land in SSI zones and that had available geospatial databases for known and probable sinkholes. For states with sinkhole point data, we identified the SSI values for each point. For states with sinkholes reported as areal polygons, we created polygon centroids and then identified SSI values for each point. SSI values were created for each state using the same analytical steps that were used for the national SSI processing and the same geospatial data but clipped to each state’s boundary (i.e., input variables were normalized to maximum values found within a specific state). Therefore, SSI values in each state are comparative values relevant to an individual state and not across the three states or for the conterminous United States.
Societal exposure to sinkhole hazards was described by summarizing the amount of land in U.S. states and counties based on SSI zones for current conditions and for the years 2070–2079. Boundaries for U.S. states and counties are based on delineations by the U.S. Census Bureau for 2020 (United States Census Bureau, 2021).
Karst and pseudokarst regions visualized in Figure 1 and summarized in Weary and Doctor (2014) comprise approximately 20% by area of the conterminous United States. Closed depressions were identified and subsequent SSI values were calculated in approximately 31% of these areas. Results provided in this section include (1) a map of SSI values based on current conditions, (2) a comparison of SSI values to state databases of known and probable sinkholes, (3) a summary of the spatial distribution of SSI values among U.S. states, (4) the identification of U.S. counties with the largest amounts and percentages of land with high and very high SSI values, and (5) estimates of where changes in SSI values may occur in the next 50 years.
Relative SSI maps were created based on current conditions for five parameters with cell values that can theoretically range from 0 to 5. Natural breaks in calculated SSI values were manually adjusted into bins of low (0.001–1.239), medium (1.240–2.549), high (2.550–3.499), and very high (3.500–4.500) sinkhole susceptibility (Figure 6). Land with mapped karst or pseudokarst geology but lacking modeled closed depressions are classified as having very low sinkhole susceptibility; these areas without mapped closed depressions represent 68% by area of the total land in the conterminous U.S. that is mapped as having karst or pseudokarst geology. The breakdown of area by SSI values of the remaining 32% of land with karst or pseudokarst geology that also includes mapped closed depressions is 2% for low, 13% for moderate, 12% for high and 5% for very high. The largest amounts of land with higher SSI values are primarily located in the south-central U.S. (e.g., Kentucky, Tennessee, Virginia, Missouri, Indiana) and in Florida (Figure 6). Areas elsewhere are susceptible to sinkholes, but SSI values are lower.
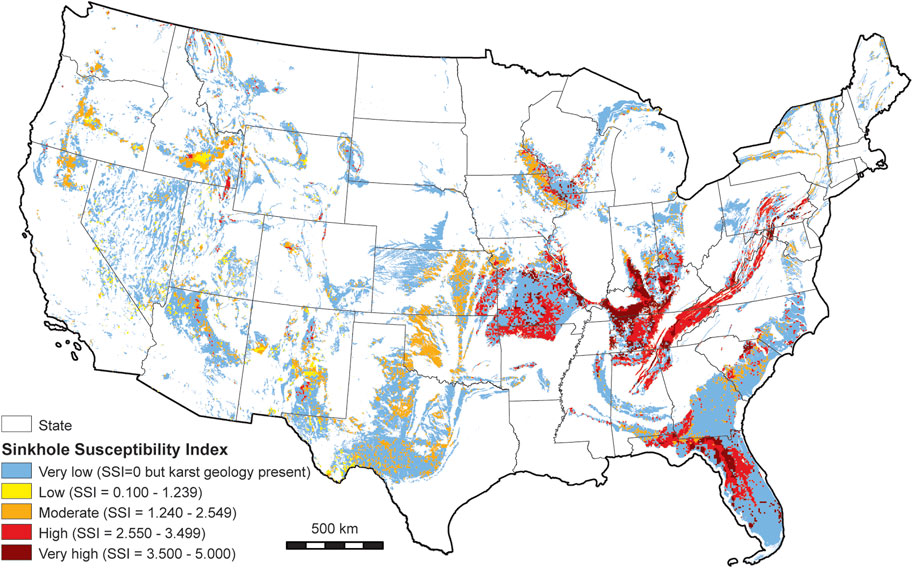
FIGURE 6. Map of Sinkhole Susceptibility Index (SSI) values based on current conditions. Additional information on data sources and analysis can be found in Wood et al. (2023).
Our comparison of calculated SSI values developed for individual states to state sinkhole-occurrence databases focused on known and probable sinkholes in Tennessee (Dunigan, 2013), Missouri (Missouri Spatial Data Information Service, 2019), and Kentucky (Kentucky Geological Survey, 2003). Florida and Texas have larger amounts of land in SSI zones than in these three states (Figure 7A) but they currently lack complete state-level sinkhole databases. Known and probable sinkholes are reported as points in the Tennessee (n = 18,081) and Missouri (n = 15,918) databases and as areal polygons in the Kentucky database that were converted to centroid points (n = 101,165).
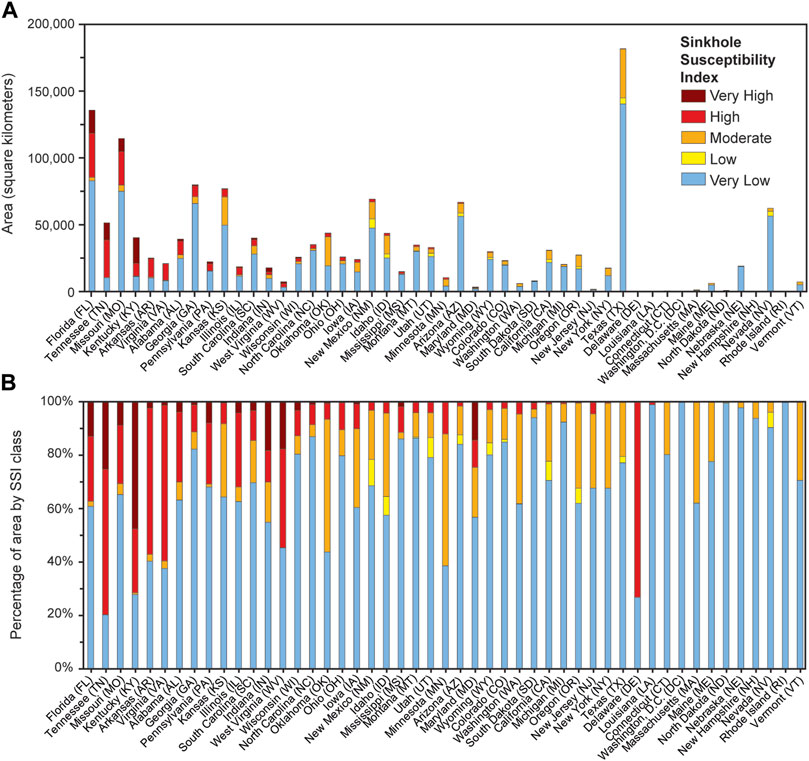
FIGURE 7. (A) Amount of land (in square kilometers) by U.S. state in areas characterized by Sinkhole Susceptibility Index (SSI) values assuming current conditions. (B) Percentage of land area mapped with karst or pseudokarst geology by SSI values. States with abbreviations in parentheses are ordered on the x-axis from left to right by the total amount of land with SSI values of either high or very high.
A geospatial overlay of known or probable sinkhole locations in each of these states with SSI mapped values indicate that they are located primarily in areas with high or very high SSI values (Table 1). Areas identified as having either high or very high SSI values account for 94%, 96%, and 99% of sinkholes in Kentucky, Missouri, and Tennessee, respectively. Few of the known or probable sinkholes are located in areas with low or moderate SSI values in Kentucky (6%), Missouri (4%), and Tennessee (1%). Even fewer identified sinkholes are in locations that lack closed depressions (0.005% in Kentucky, none in Missouri, and 0.14% in Tennessee). Of the low number of sinkholes in areas that lack closed depressions, most are in areas not mapped as having karst or pseudokarst geology, therefore they are outside of the scope of our focus on differentiating sinkhole susceptibility in karst regions. Although sinkholes are conceptually possible in any karst region, our results suggest that sinkhole-susceptibility mapping based on closed-depression delineations derived from DEMs as a foundation for analysis is an effective approach for identifying areas more likely to have sinkholes.
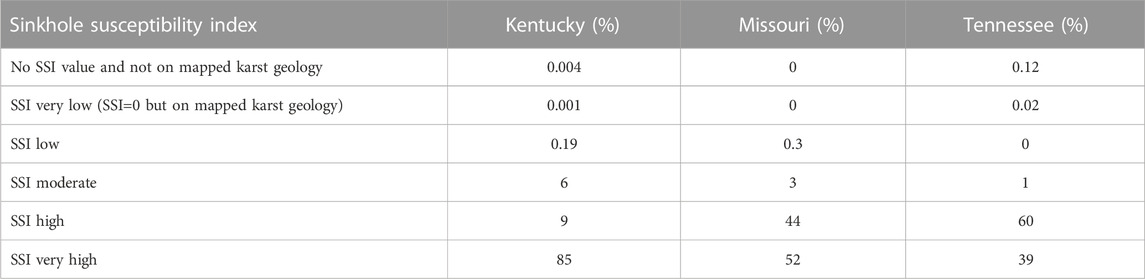
TABLE 1. Percentage of state-provided sinkhole occurrence points assigned to Sinkhole Susceptibility Index (SSI) values assuming current conditions. SSI values are calculated for each state individually at 6 km cell size. More information on data sources and the analysis can be found in Wood et al. (2023).
All 48 states in the conterminous United States and Washington, D.C., have land with some level of sinkhole susceptibility based on SSI values (Figure 7A). Based on results in Table 1, states are ordered from left to right in Figure 7 by the total amount of land characterized with SSI values of high or very high. Florida, Tennessee, Missouri, and Kentucky have the largest amounts of land characterized by high or very-high SSI values (Figure 7A). Although Texas has the largest amount of land susceptible to sinkholes based on mapped karst geology (181,634 sq km), it is further to the right in Figure 7 because little of this land is characterized with SSI values of high (23 sq km) or very high (0 sq km). Instead, areas with karst geology in Texas have SSI values characterized as very low (77% of total area that has mapped karst geology), low (2%), or moderate (20%) (Figure 7B).
Florida has the largest amount of land characterized as either high or very high SSI values (50,349 sq km), followed by Tennessee, Missouri, and Kentucky (Figure 7A). Kentucky has the highest amount of land characterized by very-high SSI values (19,077 sq km) followed by Florida (17,252 sq km), Tennessee (12,867 sq km) and Missouri (9,732), but less total land characterized as susceptible to sinkholes. For example, Florida and Missouri are similar to Texas by having large amounts of land that have mapped karst geology but no mapped closed depressions (i.e., SSI values of very low). Although the total amount of sinkhole-susceptible land is lower than in these states, several other states contain considerable amounts of land characterized by very-high SSI values (Indiana, Pennsylvania, Alabama, West Virginia, and South Carolina) and by high SSI values (Arkansas, Virginia, Alabama, Georgia, Kansas, and Illinois).
The percentage of land mapped with karst or pseudokarst geology that has high or very high SSI values provides additional insight on the relative threat posed by sinkhole hazards. Although Florida and Missouri have large amounts of land characterized by high and very high SSI values (Figure 7A), these lands only represent 37% and 30%, respectively, of their land with mapped karst geology (Figure 7B). In contrast, other states have smaller amounts of land with high or very high SSI values but these lands represent much larger percentages, such as in Tennessee (80%), Kentucky (71%), Virginia (60%), Arkansas (57%), and West Virginia (55%). In Delaware, there are only 7 sq km of land with mapped karst geology, yet 73% of this relatively small amount is classified by SSI high values. Therefore, there may be less land mapped as karst geology, but the relative sinkhole threat within each of these states may be larger and potentially overlooked if one simply looked at the amount of land with high or very high SSI values.
Conversely, there are states with small amounts of mapped karst or pseudokarst geology where the percentages of SSI values by area for these lands are primarily very low, low, or moderate (i.e., states with longer blue bars in Figure 7B). These areas are primarily in the U.S. New England region (e.g., Connecticut, Massachusetts, Maine, New Hampshire, Rhode Island, and Vermont), Washington, D.C., north-central U.S. (North Dakota and Nebraska), and Nevada. Therefore, while there are areas mapped with karst or pseudokarst geology in these states, results from Table 1 suggest that the threat of sinkholes is far lower in these states than elsewhere in the country.
State-based assessments of the spatial distribution of SSI values (Figure 7) provide broad insight into societal exposure to sinkhole susceptibility but an incomplete treatment since much of the land use and capital-improvement planning in the U.S. occurs at county or sub-county scales. Therefore, to provide additional insight into sinkhole susceptibility in the U.S., we provide exposure metrics at the U.S. county scale. Results demonstrate that 67% of counties in the conterminous U.S. have land with mapped karst or pseudokarst geology (i.e., any SSI class). However, only 49% of counties have mapped karst or pseudokarst geology and mapped closed depressions (i.e., SSI classes of low, moderate, high, or very high) and 27% of counties are classified as having high or very high SSI values.
The largest amounts of land characterized by either high or very high SSI values (demonstrated in Table 1 to have the greatest likelihood of documented sinkholes) are estimated for counties in Florida, including Marion, Polk, Lake, Jackson, and Alachua (Figure 8). County size however varies considerably in the U.S.; therefore, solely focusing on the amount of lands with high or very high SSI values could skew sinkhole discussions to larger counties. To provide a more equitable perspective on sinkhole threats to U.S. counties, we also calculated the percentage of total land in each U.S. county that is classified with high or very high SSI values. For the five Florida counties previously identified, the large amounts of land classified with high or very high SSI values also represent relatively high percentages of total land in these counties, ranging from 60% in Polk County up to 96% in Marion County. There are several other counties or county equivalents that have substantially lower amounts of land with similar SSI classification but these lands represent larger percentages of the total county land. These higher percentages of total county land are found for an independent city in Virginia and several counties in Kentucky and Tennessee (Figure 8). Therefore, these smaller counties and county equivalents may have relatively smaller footprints of land that are highly susceptible to sinkholes, but these footprints represent 99%–100% of a county’s available land. In all, there are 23 counties where 90% or more of the total county land is classified with high or very high SSI values.
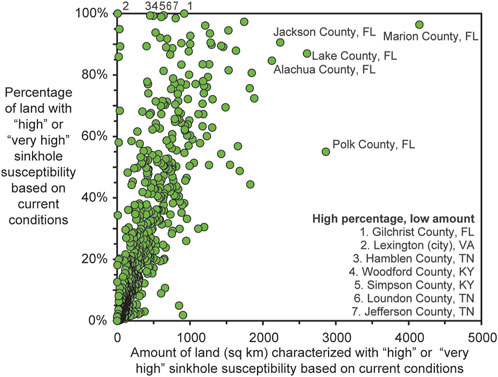
FIGURE 8. Comparison of SSI values for U.S. counties in the conterminous United States in terms of the amount (sq km) of land with high or very-high Sinkhole Susceptibility Index (SSI) values based on current conditions compared to the percentage of total land in a county that has high or very-high SSI values.
To further comment on county level variations in sinkhole susceptibility, we provide maps of the percentage of total county land for four of the five SSI classes (low, moderate, high, and very high) (Figure 9). Counties with high percentages of their land characterized as having very high SSI values are concentrated in Kentucky, Tennessee, and north-central Florida (Figure 9). Counties with high percentages of land characterized as high SSI values include these same areas, but also counties in southern Missouri, northern Arkansas, and eastern Virginia. Counties with high percentages of land characterized by moderate SSI values shift to the central-Midwest U.S., including counties in Texas, Oklahoma, Kansas, Iowa, and Minnesota. No counties in the conterminous U.S. have high percentages of land characterized by low SSI values; however, counties that do have some percentage of land with low SSI values are in western states.
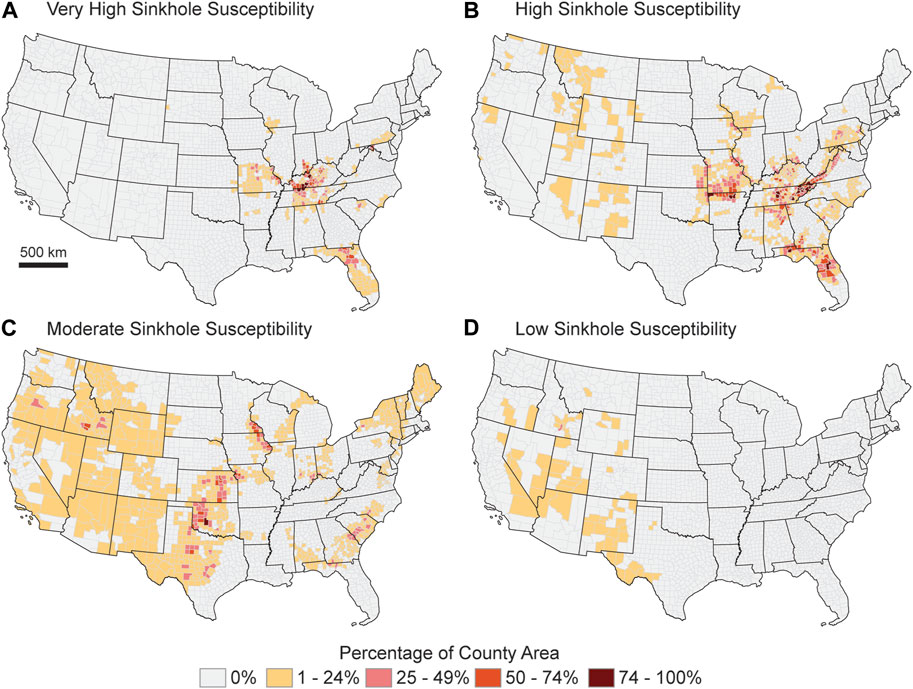
FIGURE 9. Maps of SSI values by U.S. county. Values represent the percentage of total land in U.S. counties that have Sinkhole Susceptibility Index (SSI) values considered to be (A) very high, (B) high, (C) moderate, and (D) low assuming current conditions.
Comparisons of SSI class values based on current conditions and 2079 projections suggest minor differences (Figure 10). SSI class values do not change for approximately 98% of 6-km grid cells in the study area. SSI class values are estimated to decrease by one class in two grid cells (one in Florida and the other in Arizona). An increase of one SSI class value is estimated for 321 grid cells (approximately 2% of total cells) in several places of the northeastern and northwestern portions of the study area where current SSI values are primarily very low to moderate (Figure 6), as well as in portions of central and eastern Tennessee and in southwestern Virginia. Increases in SSI class values are primarily in areas where extreme precipitation is predicted to increase in the future (Figure 5B).
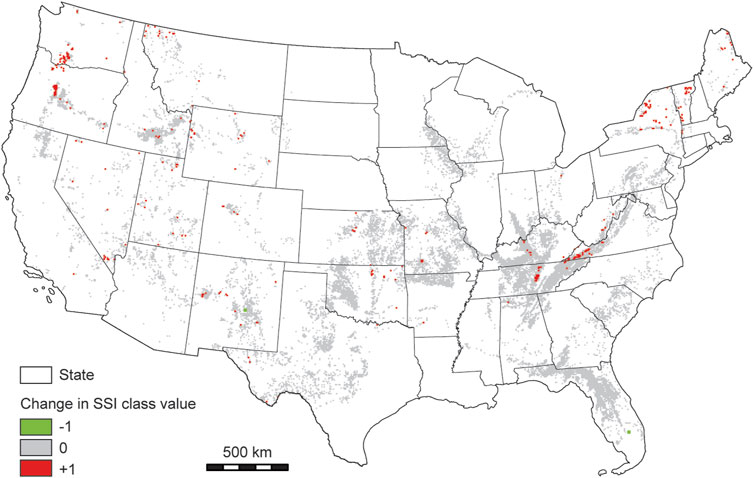
FIGURE 10. Map showing a comparison of SSI class values of 2079 estimates with current conditions. Positive values shown in red indicate higher estimated SSI class values in 2079 than with current conditions.
A comparison of the amount of land in counties with high and very high SSI values based on current conditions with amounts based on 2079 projections suggest that values do not change substantially (Figure 11A). The amount of land with high or very-high SSI values based on current conditions and 2070–2079 projections are the same for 96% of the 2,083 counties. For the 4% of counties that are estimated to increase the amount of land with high or very-high SSI values, these counties currently have little to no land currently classified in this way. Figure 11B shows similar data as Figure 11A but zooms in to focus on counties with less than 800 sq km of land classified as high or very high SSI values. Here we can see that increases in the amount of land classified as high or very-high SSI values are primarily in the U.S. Pacific Northwest region (e.g., counties in Washington and Oregon) and the U.S. New England region (e.g., Vermont and New York). Therefore, increases in these areas are not substantial compared to current sinkhole susceptibility in places like Tennessee and Florida; however, they do suggest that States not currently accustomed to having sinkhole hazards could see more sinkhole activity in future years.
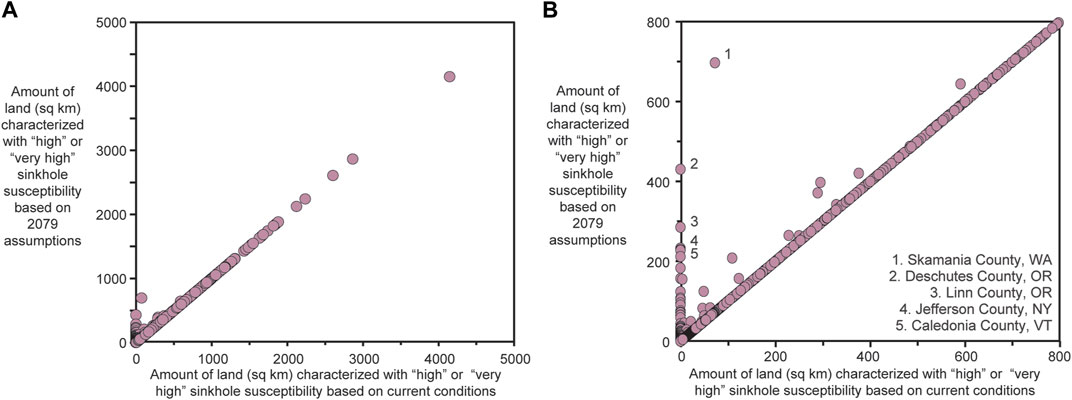
FIGURE 11. Comparison of the amount of total land (sq km) in a county that has estimated high and very-high SSI values based on current and 2070–2079 assumptions, including (A) a scatter plot of showing all counties in the study area and (B) a close up focusing just on counties with less than 800 sq km of land classified as high or very high SSI values to better visualize where increases are estimated.
Identifying areas that are susceptible to sinkhole formation may support efforts to protect lives, property, resources, and infrastructure but is also challenging given the range of factors that can influence the formation of closed depressions at a particular location. We hope our national-scale analysis will broaden the discussion of sinkhole susceptibility and that results can be used to develop effective risk-reduction strategies. For example, while certain states are more susceptible to sinkhole formation than others, our results demonstrate that sinkholes have some level of susceptibility within all states and 67% of counties in the conterminous United States.
We believe our approach to mapping sinkhole susceptibility at a national scale may provide multiple benefits to sinkhole-hazard planning. First, it may provide more nuance to understanding societal risks from sinkholes than simply assuming all locations with karst or pseudokarst geology have similar susceptibility. For example, we demonstrate that areas with high or very high SSI values were the most likely to contain known and probable sinkhole locations in three states (Table 1). These findings support previous assertions (e.g., Hyland et al., 2006; Galve et al., 2009; Doctor and Doctor, 2012; Kromhout and Baker, 2015; Kim et al., 2020) that sinkhole-susceptibility mapping based on closed-depression delineations derived from DEMs is an effective approach for identifying areas more likely to have sinkholes. Consistently finding sinkhole locations in areas with high or very high SSI values in three U.S. states also increases confidence in using this metric in states that lack sinkhole data. Second, our approach may support county- and state-based efforts by identifying areas that could benefit from additional site-specific studies for local development projects. Although 67% of counties in the conterminous U.S. have mapped karst or pseudokarst geology, only 27% of counties are classified as having high or very high SSI values. Third, our approach may provide a uniform approach for comparing counties, states, or regions, which could support federal resource-allocation decisions if a national karst-hazard-reduction program were to be created. Fourth, our approach transcends state boundaries and disparate approaches to mapping sinkhole hazards and thus may support consistent federal risk-reduction planning at the national level, such as facility siting, transportation planning, and land management.
Our results show that the areas with the largest amount of land having high and very high sinkhole susceptibility are primarily in Florida, Tennessee, Missouri, and Kentucky. Smaller pockets of high and very high sinkhole susceptibility exist in other states, such as northern Arkansas, southwestern Virginia, northwestern Alabama, southwestern and northwestern Georgia, southeastern Pennsylvania, southeastern Kansas, southern Indiana and Illinois, and eastern West Virginia (Figure 6). High and very high SSI values in these states are primarily driven by higher densities of closed depressions, the type of karst geology and soil textures that have been shown to be associated with closed depressions, and a higher number of days with extreme precipitation (Figure 2). High SSI values in the coastal plain regions of South Carolina and North Carolina are primarily related to the soil type. The geology there is mainly unconsolidated sandy marine, fluvial and aeolian deposits loosely cemented with carbonate that weather to loamy soils. These areas are not typically associated with known karst; however, sinkholes have occurred primarily due to sediment piping (pseudokarst) processes rather than from suffosion into bedrock voids.
Although changes in extreme precipitation and development patterns over the next 50 years may influence sinkhole formation, our results suggest that current county hotspots of higher sinkhole susceptibility are not estimated to change. SSI class values (e.g., moderate, high, and very high) for 98% of grid cells remain constant when comparing current conditions to 2070–2079 projections. The few instances of increases in SSI class values are primarily in areas of the U.S. Pacific Northwest and U.S. New England region, where extreme precipitation is forecasted to increase (Figure 5). Figure 11 demonstrates that the top counties highlighted today as having the largest amounts of land considered to have high or very high sinkhole susceptibility will remain the same in 2070–2079. Any increases in SSI values are estimated to occur in counties that currently have little to no land classified as high or very high sinkhole susceptibility (Figure 11) and again, this is due to projected increases in extreme precipitation (Figure 5). Therefore, projected changes in extreme precipitation and development patterns are not estimated to substantially change where sinkhole susceptibility is greatest today.
Our results provide insight on sinkhole susceptibility at the national scale; however, the extent of susceptibility may vary among these highlighted areas due to local and regional differences in bedrock lithologies, geologic structure, soil textures, and hydrological conditions. For example, large portions of the areas characterized as having very high SSI values are underlain with carbonate rocks at or near the land surface in a humid climate (Figures 1, 6). However, variations in geologic structure and in the specific carbonate-geological unit could increase or decrease sinkhole susceptibility within this group, i.e., different limestone units in the coastal plains of Florida, North Carolina, and Virginia may not produce the same number of closed depressions over time. There is also insufficient understanding of karst behavior to assume that pseudo-karst regions in the U.S. Pacific Northwest will behave in a similar way to areas in the U.S. Southeast region that has carbonate geological units and heavier precipitation.
Our mapping is a first step toward highlighting areas of sinkhole susceptibility at the national scale; however, we did not address several areas where additional research could be beneficial. One topic is the development of input data for all other areas of the greater United States, such as Puerto Rico, Hawaii, U.S territories, and Alaska (where permafrost-related, hazard susceptibility could be incorporated into the analysis). Sinkhole-susceptibility maps could be improved through the use of higher-resolution digital elevation model (DEM) data based on lidar remote sensing to delineate closed depressions. Current SSI mapping is based on 1/3 arc-second (approximately 10 m) resolution DEMs (United States Geological Survey, 2017), therefore the use of higher-resolution data would enable the delineation of closed depressions that represent even smaller sinkholes. However, we note that even with the ∼10-m resolution DEM, Table 1 demonstrates that our SSI maps still identified areas that represent 94%–99% of known and probable sinkholes in three states. Therefore, increases in DEM resolution may not affect overall accuracy of the SSI approach, but instead may offer the ability to provide more-precise estimates (i.e., small grid cells) for facility and infrastructure planning.
There are several hazard-assessment topics where additional research could benefit future sinkhole susceptibility mapping. One area for improvement is developing susceptibility maps that differentiate among the various types of sinkholes, such as subsidence sinkholes that tend to form gradually and may go undetected for long periods versus cover-collapse sinkholes that may develop abruptly and cause catastrophic damage to buildings and infrastructure (Kaufmann, 2007). Annual update cycles for closed-depression mapping would provide a temporal context for land-surface changes and could help differentiate sinkhole types. Temporal assessments could also lay the foundation for developing probabilities of sinkhole formation, since more recent activity implies higher hazards (Gutiérrez, 2016). Another hazard-assessment topic is to screen for closed depressions formed through non-karst related geomorphic processes in areas underlain by carbonate or evaporite rocks that have glacial or other sediment cover. Similarly, sinkhole susceptibility maps can be improved through a better understanding and recognition in the mapping of local factors, such as geologic structure, soil heterogeneity, water table elevations, and anthropogenic alterations to the landscape (Parise, 2012). Finally, future efforts could also expand on aspects of societal risk to these hazards, such as potential cascading hazards from a sinkhole (e.g., spread of hazardous materials), consequence analyses for specific types of assets (e.g., road and rail infrastructure), and place-based decision support tools for sinkhole mitigation that take into account local factors (e.g., geologic structure, soil type, drainage considerations). Despite these opportunities for further research, our results provide a baseline for understanding the highly variable nature of sinkhole susceptibility across the conterminous United States.
Our analysis of sinkhole susceptibility in karst or pseudokarst regions was done for the conterminous United States. Based on our approach and analysis, we reach several conclusions that could support sinkhole-related planning and guide future research efforts.
• These results provide a uniform index of sinkhole potential that can support national planning, instead of existing assessments produced through various methods within individual states or smaller areas.
• Areas of highest SSI values are aligned with locations of known and probable sinkholes in state databases, demonstrating that our approach can provide more nuance than simply assuming all karst and pseudokarst regions have the same level of sinkhole susceptibility.
• The concurrence of high and very high SSI values for locations of known and probable sinkholes also supports the assertion that sinkhole-susceptibility mapping based on closed-depression delineations derived from DEMs is an effective approach for identifying areas more likely to have sinkholes.
• Projected changes in extreme precipitation and development patterns did not substantially change current county hotspots of highest sinkhole susceptibility. Increases in sinkhole susceptibility are primarily in counties that currently have little to no land classified as high or very high sinkhole susceptibility.
The raw data supporting the conclusion of this article are available by the authors in Wood et al. (2023).
All authors contributed to conception and design of the study. NW, DD, and JA performed geospatial analysis. NW and DD wrote the first draft of the manuscript. All authors contributed to the article and approved the submitted version.
This study was supported by the United States Geological Survey (USGS) Science Synthesis, Analysis and Research Program.
We thank two journal reviewers, Eve Kuniansky, and James Kaufmann with the U.S. Geological Survey National Geospatial Technical Operations Center, for their insightful reviews of earlier versions of the article. Any use of trade, firm, or product names is for descriptive purposes only and does not imply endorsement by the U.S. Government.
The authors declare that the research was conducted in the absence of any commercial or financial relationships that could be construed as a potential conflict of interest.
All claims expressed in this article are solely those of the authors and do not necessarily represent those of their affiliated organizations, or those of the publisher, the editors and the reviewers. Any product that may be evaluated in this article, or claim that may be made by its manufacturer, is not guaranteed or endorsed by the publisher.
Al-Kouri, O., Al-Fugara, A., Al-Rawashdeh, S., Sadoun, B., and Pradhan, B. (2013). Geospatial modeling for sinkholes hazard map based on GIS & RS data. J. Geogr. Inf. Syst. 5, 584–592. doi:10.4236/jgis.2013.56055
Davies, W., Simpson, J., Ohlmacher, G., Kirk, W., and Newton, E. (1984). Engineering aspects of karst: United States Geological Survey, National Atlas of the United States of America. scale 1, 7,500,000.
Doctor, D., and Doctor, K. (2012). Spatial analysis of geologic and hydrologic features relating to sinkhole occurrence in Jefferson County, West Virginia. Carbonates Evaporites 27, 143–152. doi:10.1007/s13146-012-0098-1
Doctor, D., Jones, J., Wood, N., Falgout, J., and Rapstine, N. (2020). “Progress toward a preliminary karst depression density map for the conterminous United States,” in Proceedings of the sixteenth multidisciplinary conference on sinkholes and the engineering and environmental impacts of karst (first edition): NCKRI symposium 8. Editors L. Land, C. Kromhout, and M. Byle (Carlsbad (NM): National Cave and Karst Research Institute), 315–326.
Doctor, D., and Young, J. (2013). “An evaluation of automated GIS tools for delineating karst sinkholes and closed depressions from 1-meter LIDAR-derived digital elevation data,” in Proceedings of the thirteenth multidisciplinary conference on sinkholes and the engineering and environmental impacts of karst (first edition): NCKRI symposium 2. Editors L. Land, D. H. Doctor, and J. B. Stephenson (Carlsbad (NM): National Cave and Karst Research Institute), 449–458.
Dong, S., Wang, H., and Zhou, W. (2020). Sinkholes and their impacts on karst hydrogeology in a peatland complex of Northern Ontario, Canada. Carbonates Evaporites 35 (50), 50. doi:10.1007/s13146-020-00582-9
Dunigan, T. (2013). Data from “tnsinksq.zip” from Tennessee Sinkholes. Available at https://tnlandforms.us/landforms/sinks.php (Accessed December 31, 2013).
ESRI (2023). Point Statistics (Spatial Analyst). Available at https://pro.arcgis.com/en/pro-app/latest/tool-reference/spatial-analyst/point-statistics.htm (Accessed June 8, 2023).
Federal Emergency Management Agency (1997). Multihazard identification and risk assessment, a cornerstone of the national mitigation strategy. Washington, D.C. Federal Emergency Management Agency, 34.
Florida Office of Insurance Regulation (2010). Report on review of the 2010 sinkhole data call. Washington, D.C. Federal Emergency Management Agency. Available at https://www.floir.com/siteDocuments/Sinkholes/2010_Sinkhole_Data_Call_Report.pdf.
Galve, J., Gutiérrez, F., Remondo, J., Bonachea, J., Lucha, P., and Cendrero, A. (2009). Evaluating and comparing methods of sinkhole susceptibility mapping in the Ebro Valley evaporite karst (NE Spain). Geomorphology 111, 160–172. doi:10.1016/j.geomorph.2009.04.017
Gesch, D., Oimoen, M., and Evans, G. (2014). Accuracy assessment of the U.S. Geological Survey national elevation dataset, and comparison with other large-area elevation datasets—SRTM and ASTER: U.S. Geol. Surv. Open-File Rep. 2014 1008, 10. doi:10.3133/ofr20141008
Green, T. (2015). “Down the rabbit hole: Identifying physical causes of sinkhole formation in the UK,” in Proceedings of the fourteenth multidisciplinary conference on sinkholes and the engineering and environmental impacts of karst (first edition): NCKRI symposium 5. Editors D. Doctor, L. Land, and J. Stephenson (Carlsbad (NM): National Cave and Karst Research Institute), 177–187.
Gutiérrez, F. (2016). Sinkhole hazards, Oxford research encyclopedia of natural hazard science. Oxford: Oxford University Press.
Hyland, S., Kennedy, L., Younos, T., and Parson, S. (2006). Analysis of sinkhole susceptibility and karst distribution in the northern shenandoah valley, Virginia: Implications for low impact development (LID) site suitability models, Virginia water resources research center special report SR31-2006. United States: Virginia Polytechnic Institute and State University.
Ivey-Burden, L., and Todd, A. (2015). A method of mapping sinkhole susceptibility using a geographic information system: A case study for interstates in the karst counties of Virginia, UVA report 2013-04. United States: University of Virgnia, 30p.
Jia, L., Meng, Y., Li, L., and Yin, R. (2021). A multidisciplinary approach in cover-collapse sinkhole analyses in the mantle karst from Guangzhou City (SE China). Nat. Hazards 108, 1389–1410. doi:10.1007/s11069-021-04738-1
Jones, J., Doctor, D., Wood, N., Falgout, J., and Rapstine, N. (2021). Closed depression density in karst regions of the conterminous United States: Features and grid data, reference year 2019. United States: U.S. Geological Survey data release. doi:10.5066/P9EV2I12
Kaufmann, J. (2007). Sinkholes. United States: United States Geological Survey Fact Sheet, 2007–3060, 2 p.
Kelner, G. (2020). A karst feature predictability model within Barber County, Kansas, unpublished master’s thesis. Kansas: Fort Hays State University, 3144.
Kentucky Geological Survey (2003). Sinkhole data by county. Available at https://kgs.uky.edu/kgsweb/download/karst/sinkpick.htm (Accessed May 30, 2003).
Kidanu, S., Anderson, N., and Rogers, J. (2018). Using GIS-based spatial analysis to determine factors influencing the formation of sinkholes in Greene County, Missouri. Environ. Eng. Geoscience 24 (3), 251–261. doi:10.2113/eeg-2014
Kim, Y., Nam, B., Shamet, R., Soliman, M., and Youn, H. (2020). Development of sinkhole susceptibility map of east central Florida. Nat. Hazards Rev. 21 (4), 04020035. doi:10.1061/(asce)nh.1527-6996.0000404
Kromhout, C., and Baker, A. (2015). “Sinkhole vulnerability mapping: Results from a pilot study in north central Florida,” in Proceedings of the fourteenth multidisciplinary conference on sinkholes and the engineering and environmental impacts of karst (first edition): NCKRI symposium 5. Editors D. Doctor, L. Land, and J. Stephenson (Carlsbad (NM): National Cave and Karst Research Institute), 241–254.
Kuniansky, E., Weary, D., and Kaufmann, J. (2016). The current status of mapping karst areas and availability of public sinkhole-risk resources in karst terrains of the United States. J. Hydrogeology 24, 613–624. doi:10.1007/s10040-015-1333-3
Missouri Spatial Data Information Service (2019). 2018 sinkholes data. Available at http://data-msdis.opendata.arcgis.com/datasets/bb7ecb814719469a95151c2db3250397_0 (Accessed February 15, 2019).
Multi-Resolution Land Characteristics Consortium (2019). National land cover database 2019 land cover (CONUS). North Carolina: Research Triangle Park, NC. Available at https://www.mrlc.gov/data/nlcd-2019-land-cover-conus (Accessed February 2, 2022)
Nakicenovic, N., Alcamo, J., Davis, G., de Vries, B., Fenhann, J., Gaffin, S., et al. (2000). Emissions scenarios, A special report of working group III of the intergovernmental panel on climate change, intergovernmental panel on climate change. Available at https://www.ipcc.ch/site/assets/uploads/2018/03/sres-en.pdf.
Nam, B., Kim, Y., and Youn, H. (2020). Identification and quantitative analysis of sinkhole contributing factors in Florida's karst. Eng. Geol. 271, 105610. doi:10.1016/j.enggeo.2020.105610
Newton, J. (1987). Development of sinkholes resulting from man’s activities in the eastern United States. U.S. Geol. Surv. Circ. 968, 54.
Parise, M. (2012). A present risk from past activities—Sinkhole occurrence above underground quarries. Carbonates Evaporites 27, 109–118. doi:10.1007/s13146-012-0088-3
Pierce, D., Cayan, D., and Thrasher, B. (2014). Statistical downscaling using localized constructed analogs (LOCA). J. Hydrometeorol. 15 (6), 2558–2585. doi:10.1175/JHM-D-14-0082.1
Qui, X., Wu, S-S., and Chen, Y. (2020). Sinkhole susceptibility assessment based on morphological, imagery, and contextual attributes derived from GIS and imagery data. J. Cave Karst Stud. 82 (1), 1–17. doi:10.4311/2018es0118
Sohl, T., Sayler, K., Bouchard, M., Reker, R., Freisz, A., Bennett, S., et al. (2018). Conterminous United States land cover projections - 1992 to 2100. United States: U.S. Geological Survey data release. doi:10.5066/P95AK9HP
Soil Survey Staff (2020). Gridded soil Survey geographic (gSSURGO) database for the conterminous United States. United states department of agriculture, natural resources conservation Service. Available online at https://nrcs.app.box.com/v/soils (Accessed December 1, 2020).
Soller, D., Packard, P., and Garrity, C. (2012). Database for US Geological Survey map I–1970, map showing the thickness and character of quaternary sediments in the glaciated United States east of the rocky mountains: US geological Survey data series 656. http://pubs.usgs.gov/ds/656/.
Stoker, J., and Miller, B. (2022). The accuracy and consistency of 3D elevation program data—A systematic analysis. Remote Sens. 14 (4), 940. doi:10.3390/rs14040940
Subedi, P., Subedi, K., Thapa, B., and Subedi, P. (2019). Sinkhole susceptibility mapping in Marion County, Florida: Evaluation and comparison between analytical hierarchy process and logistic regression based approaches. Sci. Rep. 9, 7140. doi:10.1038/s41598-019-43705-6
Tihansky, A. (1999). “Sinkholes, west-central Florida,” in Land subsidence in the United States. Editors D. Galloway, D. R. Jones, and S. E. Ingebritsen (United States: US Geological Survey Circular), 121–140.
United States Census Bureau (2021). TIGER/Line shapefiles, at URL https://www2.census.gov/geo/tiger/TIGER2020/COUNTY/ (Accessed February 9, 2022).
United States Geological Survey (2016). National Hydrography Dataset (NHD) high resolution state or territory FileGDB 10.1 model. Version 2.2.1 (published 20160901), at URL https://www.usgs.gov/core-science-systems/ngp/national-hydrography/access-national-hydrography-products.
United States Geological Survey (2017). 3D Elevation Program 1/3rd arc-second digital elevation models (published 20171001), at URL https://www.usgs.gov/core-science-systems/ngp/3dep/data-tools (Accessed October 1, 2017).
United States Geological Survey (2019). USGS national transportation dataset in FileGDB 10.1 format, at URL https://data.usgs.gov/datacatalog/data/USGS:ad3d631d-f51f-4b6a-91a3-e617d6a58b4e (Accessed June 26, 2019).
United States Geological Survey (2021). Advanced research computing. Available at: https://doi.org/10.5066/F7D798MJ (Accessed February 1, 2021).
University of New South Wales (2021) Climdex - R95pTOT data, (Accessed February 9, 2021) at URL https://www.climdex.org/learn/indices/#index-R95pTOT
Walkinshaw, M., O'Geen, A., and Beaudette, D. (2021). Soil properties. California soil resource lab. Available at https://casoilresource.lawr.ucdavis.edu/soil-properties/ (Accessed October 1, 2021).
Wall, J., Doctor, D., and Terziotti, S. (2015). “A semi-automated tool for reducing the creation of false closed depressions from a filled LIDAR-derived Digital Elevation Model,” in Proceedings of the fourteenth multidisciplinary conference on sinkholes and the engineering and environmental impacts of karst (first edition): NCKRI symposium 5. Editors D. H. Doctor, L. Land, and J. B. Stephenson (Carlsbad (NM): National Cave and Karst Research Institute), 255–262.
Weary, D., and Doctor, D. (2014) Karst in the United States: A digital map compilation and database, U.S. Geol. Surv. Open-File Rep. 2014 1156, 23. doi:10.3133/ofr20141156
Weary, D. (2015). “The cost of karst subsidence and sinkhole collapse in the United States compared with other natural hazards,” in Proceedings of the fourteenth multidisciplinary conference on sinkholes and the engineering and environmental impacts of karst (first edition): NCKRI symposium 5. Editors D. Doctor, L. Land, and J. Stephenson (Carlsbad (NM): National Cave and Karst Research Institute), 433–445.
Wood, N., Doctor, D., Alder, J., and Jones, J. (2023). Geospatial files and tabular exposure estimates of sinkhole susceptibility for counties in the conterminous United States for current conditions and projections for the years 2070-2079. United States: U.S. Geological Survey data release. doi:10.5066/P97YWD2D
Wu, Q., Lane, C. R., Wang, L., Vanderhoof, M. K., Christensen, J. R., and Liu, H. (2019). Efficient delineation of nested depression hierarchy in digital elevation models for hydrological analysis using level-set method. JAWRA J. Am. Water Resour. Assoc. 55 (2), 354–368. doi:10.1111/1752-1688.12689
Yang, L., Jin, S., Danielson, P., Homer, C., Gass, L., Case, A., et al. (2018). A new generation of the United States national land cover database: Requirements, research priorities, design, and implementation strategies. ISPRS J. Photogrammetry Remote Sens. 146 (12), 108–123. doi:10.1016/j.isprsjprs.2018.09.006
Keywords: karst, sinkhole, hazard, exposure, geospatial
Citation: Wood NJ, Doctor DH, Alder J and Jones J (2023) Current and future sinkhole susceptibility in karst and pseudokarst areas of the conterminous United States. Front. Earth Sci. 11:1207689. doi: 10.3389/feart.2023.1207689
Received: 18 April 2023; Accepted: 03 July 2023;
Published: 18 July 2023.
Edited by:
Boo Hyun Nam, Kyung Hee University, Republic of KoreaReviewed by:
Yong Je Kim, Lamar University, United StatesCopyright © 2023 Wood, Doctor, Alder and Jones. This is an open-access article distributed under the terms of the Creative Commons Attribution License (CC BY). The use, distribution or reproduction in other forums is permitted, provided the original author(s) and the copyright owner(s) are credited and that the original publication in this journal is cited, in accordance with accepted academic practice. No use, distribution or reproduction is permitted which does not comply with these terms.
*Correspondence: Nathan J. Wood, bndvb2RAdXNncy5nb3Y=
†ORCID: Nathan J. Wood, orcid.org/0000-0002-6060-9729; Daniel H. Doctor, orcid.org/0000-0002-8338-9722; Jay Alder, orcid.org/0000-0003-2378-2853; Jeanne Jones, orcid.org/0000-0001-7549-9270
Disclaimer: All claims expressed in this article are solely those of the authors and do not necessarily represent those of their affiliated organizations, or those of the publisher, the editors and the reviewers. Any product that may be evaluated in this article or claim that may be made by its manufacturer is not guaranteed or endorsed by the publisher.
Research integrity at Frontiers
Learn more about the work of our research integrity team to safeguard the quality of each article we publish.