 Qingsong He
- College of Public Administration, Huazhong University of Science and Technology, Wuhan, China
The purpose of this study was to provide a new concept and technical method for the large-scale identification of industrial land and analyze the distribution characteristics of industrial land in China. The following research methods are employed using the point of interest data and random forest model based on data accessibility, this study selected 2015 data on Wuhan and Luoyang as training samples to identify the industrial land of China. Then, the proportion of industrial land in all 334 prefecture-level cities on the Chinese mainland was calculated, and the spatial pattern was analyzed. The results show that: 1) by comparing multiple experiments and robustness analysis, the optimal parameter setting of the random forest model is obtained. According to the test of actual industrial land distribution in Wuhan city and Luoyang city, the identification of industrial land in different scale cities by random forest model is accurate and effective. 2) From the perspective of spatial patterns, industrial land shows a “large aggregation and small scattering” distribution. 3) From the perspective of spatial distribution, the proportion of industrial land in these cities shows spatial aggregation. High–high aggregation areas were mainly distributed in North and Northeast China, and low–low aggregation areas were mainly located in West China. 4) From the perspective of related factors, industrial land was close to rivers, highways, and railway stations and had a relatively low correlation with the distribution of airports. Industrial land was located within approximately 10–60 km distance from the municipal government office. In terms of the proportion of industrial land, the proportion of industrial land is higher in the cities where the industrial land was closer to railway stations. However, when the industrial land in cities was closer to four other types of related factors (waters and lakes, major highways, airports, and municipal government stations), the share of industrial land is lower. In conclusion, the method based on the point of interest data and random forest model can accurately and effectively identify large-scale industrial land.
1 Introduction
Industry plays an important role in maintaining a steady growth of the national economy, and industrial land is the most basic natural resource to support industrial development. Industrial land refers to land that carries the production, operation, and service activities of economic entities in urbanized areas (Moomaw, 1978; Louw et al., 2012). With its unique social system, China’s economy has developed rapidly and consequently. China has become the world’s factory (Liu et al., 2014; Liu et al., 2018a, b). At the same time, China is also the only country that contains the whole industrial chain, which conveys a great advantage in international competition (Jcw et al., 2021). At present, there are two main forms of urban industrial land in China: industrial parks and scattered industrial land. In the context of the new normal economy, China has actively promoted the transformation and upgrading of the secondary industry, but the layout and planning of urban industrial land have not kept pace, resulting in problems such as waste of resources (Lai et al., 2020), destruction of the ecological environment (Yang et al., 2018), and a mismatch between industrial land and space (Zhang et al., 2020). Therefore, the scientific and effective identification and analysis of urban industrial land is of great significance to optimize the layout of urban industrial land, improve the scientificity of urban industrial land planning in the whole region, and promote China’s industrial transformation and upgrading.
In the past, the identification of urban industrial land mainly used traditional land data and remote sensing image maps (Myint et al., 2011; Dankoub et al., 2012; Zhang and Du, 2015). The artificial statistical survey, expert qualitative, remote sensing interpretation, and other methods were used for this identification (Murphy and Vance, 1954; Davies, 1959; Eklund et al., 1998); however, all these methods are problematic as they are time-consuming, laborious, and lack timeliness. Single remote sensing image data can only identify urban construction land in the process of large-scale recognition, and cannot further refine the spatial details of urban industrial land. Therefore, its application method must be further improved. The aforementioned identification methods are mostly based on a single city (or region), which cannot reflect the layout of urban industrial land on a larger scale, and different data (including years) and methods cannot enable case comparison. From the perspective of national conditions, although the quality and quantity of socio-economic data of developing countries (represented by China) have improved in recent years (Jean et al., 2016), there is still a lack of unified standard and complete data to conduct efficient research on the identification of industrial land within a country. Therefore, for large-scale industrial land recognition, a more effective method combined with remote sensing image data should be developed.
The development of geographic information technology, especially the application of big data (Toole et al., 2012; Long and Shen, 2015; He et al., 2018; Jo et al., 2020) and machine classification model (Wachtel et al., 2018; Li et al., 2019), provides new ideas for urban industrial land identification. Among big data commonly used in urban land research, point of interest (POI) data offers the advantages of wide coverage, large amount of data, and easy access (Ivan et al., 2016). POI data record the location information of physical point elements of various socio-economic departments, which is a more in-depth representation of the spatial distribution of socio-economic activity intensity and functional composite utilization (Mckenzie et al., 2015). Therefore, these data are widely used for the identification and analysis of urban land use types (Yuan et al., 2012; Zheng et al., 2014; Jiang et al., 2015). At present, research on urban land class recognition using POI data is mainly based on medium and small scales (Zhai et al., 2019), and a few large-scale studies have been conducted in China. Common classifiers include maximum likelihood estimation, support vector machines, decision tree, and random forest (RF) (Lu and Weng, 2006). The RF model has been proposed by Breiman (2001). Because of its high accuracy, good robustness, and practicality (Belgiu and Dragut, 2016), RF has attracted the attention of scholars in the field of land use (Li et al., 2019; Luciano et al., 2019), and has been applied to land use classification (Jamali, 2021; Sun et al., 2021). However, research on the identification of urban industrial land on a national scale has not been conducted, which limits the research on the spatial pattern analysis of urban industrial land in China from the macro level. In recent years, the spatial distribution characteristics of urban industrial land have attracted the attention of many scholars. The methods of spatial autocorrelation (Xie and Wang, 2015; Li et al., 2018), landscape pattern analysis (Lin et al., 2016), and co-location pattern mining (Marcon and Puech, 2009) have been employed. However, there are certain problems, such as small sample data, incompatibility, and spatial heterogeneity (the research conclusions of a single city cannot reflect the overall pattern).
In summary, to compensate for the shortcomings of the earlier research to a certain extent, this study uses large scale data (334 prefecture-level cities in China) and a 1 km × 1 km scale unit. Moreover, the National Land-Use/Cover Database of China with the spatial resolution of 30 m [NLUD-C, made from the Landsat TM image and China–Brazil Earth resource satellite image with a classification accuracy greater than 90% (Lai et al., 2016)] is used to explore the feasibility and scientificity of land class recognition based on POI data and the RF model. The spatial distribution characteristics of urban industrial land and the factors related to the layout planning of urban industrial land in China are clarified. The remainder of this study is structured as follows: Section 2 describes data source and data processing and introduces the method. Section 3 describes the results of industrial land identification, spatial pattern analysis, and correlation factor analysis in China. Section 4 presents the conclusion and discussion.
2 Methods and Data
2.1 Methods and Ideas
The research methods mainly involve RF, landscape pattern analysis, exploratory space data analysis (ESDA), and correlation factor analysis (which is a co-location pattern mining method). The four algorithm models of RF, artificial neural networks, logistic regression, and support vector machine were selected for experiments. The reason why these four kinds of analysis models were selected in this study is that they are widely used in the research of various urban land uses. Combined with the previous relevant literature on the classification of urban land use types (Wachtel et al., 2018; Li et al., 2019); as shown by the precision comparison presented in Table 1, RF was finally selected for China’s industrial land recognition training to obtain an urban industrial land map of China. First, the pattern characteristics of China’s urban industrial land were macroscopically grasped through spatial pattern analysis. Then, ESDA was used to explore the regional agglomeration of China’s urban industrial land. Finally, the distance relationship between China’s urban industrial land and related factors was explored through correlation factor analysis.
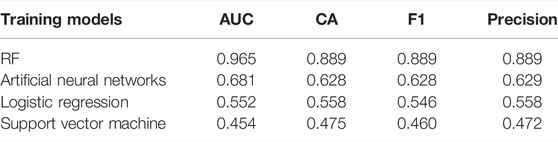
TABLE 1. Model accuracy comparison.
The research idea was based on POI data and RF, and by using the city construction map spot, Wuhan and Luoyang were selected as training samples. Employing the principle of data accessibility, the spatial distribution of industrial land under China’s 1 km grid unit was identified, and then, the industrial land ratio of 334 prefecture-level cities in Chinese mainland was calculated. Spatial pattern analyses (NP, SPLIT, and CONHESION), ESDA (Moran’s I, Local Moran’s I), and correlation factor analysis (nearest neighbor distance method) were used. The specific method flow chart is shown in Figure 1.
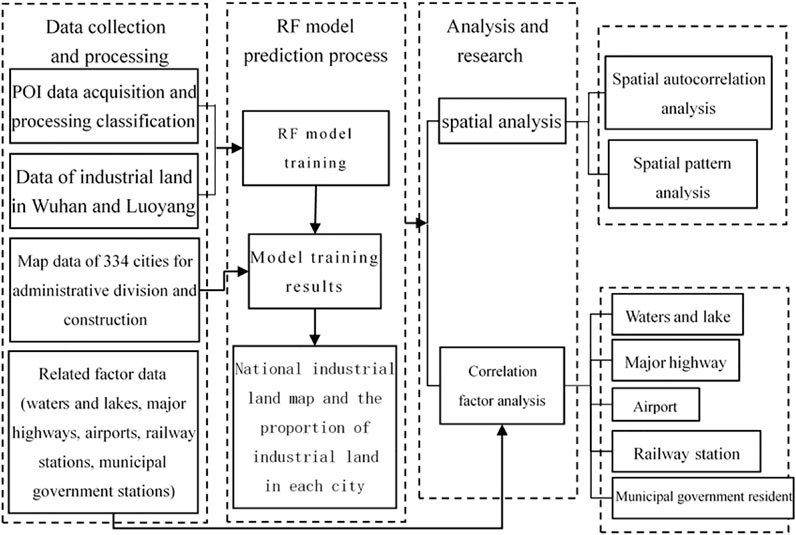
FIGURE 1. Method flow chart.
2.1.1 Random Forest Model
RF is a natural nonlinear data algorithm proposed by Breiman (2001), which can be used for regression analysis and data classification (Pal, 2005). RF is based on the single decision tree algorithm and combines the bagging method and the random subspace method. By bootstrap sampling of training samples, a training set is formed, and unselected samples are used to predict and evaluate the error. The decision tree sequence is obtained by a combination of multiple training sets, and the final prediction result is selected by voting (Ham et al., 2005).
From data accessibility perspective, the spatial distribution data of industrial land in Wuhan and Luoyang in 2015 were obtained based on the project cooperation in Wuhan Natural Resources and Planning Bureau and Luoyang Natural Resources and Planning Bureau, respectively. Other cities cannot be obtained publicly because the data of the third land survey have not been made public. Therefore, Wuhan and Luoyang were used as RF training samples. According to the research of Chang and Ke (2020) and the principle of practicality, POI indicators were selected from the perspective of the distribution characteristics of facilities on industrial land. For example, because of the dominant characteristics of functions, there are relatively few entertainment and leisure facilities, education, and medical facilities. Therefore, the following five variables were selected: the number of POIs (POISUM), the mixing degree of POIs (MIX), the proportion of POIs in industrial enterprises (FRATIO), the number of POI types (POITYPENUM), and the average distance among POIs (MEANDIS); moreover, the number of workers is relatively concentrated on industrial land, and the population density may be different from other urban land types. Therefore, population density (POPD) was selected as an index (POI data itself represent the population). Finally, considering that the roads inside the industrial land mainly serve the transportation vehicles in the plant area, the road network structure is much simpler than that outside of the industrial land; therefore, a seventh variable, that is, the highway node density per unit area (JUNCTIOND) was designed. The calculation of the aforementioned seven indicators was completed within the 1 km grid, the reason why this study chose it is that the spatial basic unit scales of various types of urban construction land are different. For example, many industrial lands are concentrated and connected in the form of industrial parks, whose degree of functional mixing is low, and the form of basic spatial units is large and complete. Among them, MIX refers to the mixing degree of different functions in a newly developed plot, and its formula is as follows:
In Formula 1,
After the selection of indicators, based on the selected training samples (including a certain amount of industrial land and non-industrial land), the ability of the RF model to identify industrial land is determined through the 10-folds crossover method. In this method, the data are randomly divided into 10 sets, nine of which are used to train the model and one data set is used for the prediction of the RF model. Finally, the distribution of industrial land in China was obtained. The aforementioned steps were completed using orange data mining software (https://orangedatamining.com/), which is often used for classification training and can obtain better classification training results (Naik and Samant, 2016; Ishak et al., 2020).
2.1.2 Spatial Analysis Method
This study used spatial pattern analysis to analyze the overall agglomeration of industrial land in China, and then used exploratory space data analysis to further analyze the spatial agglomeration degree of various internal regions. The two are the logical relationship from the whole to the inside.
2.1.2.1 Spatial Pattern Analysis
Analyzing the pattern of urban industrial land in China can more intuitively and effectively clarify its overall spatial characteristics. NP, SPLIT, and COHESION were selected in the patch type level index of FRAGSTATS for spatial pattern analysis. The three indexes could verify the overall macro and micro characteristics of China’s industrial land pattern and provided a reference for subsequent analysis and research. The description of each index is shown in Table 2 (Gao et al., 2012).
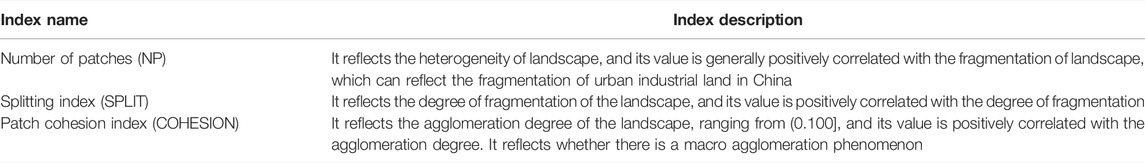
TABLE 2. Descriptions of landscape ecological index.
2.1.2.2 Exploratory Space Data Analysis
Global spatial autocorrelation analysis in ESDA is a method of spatial analysis that places spatial variables in the whole research space. Moran’s I and local Moran’s I are selected for analysis (Anselin, 1995). The formula is as follows:
In Formula 2, the range of calculation result is [−1,1]. A result within [−1,0] indicates that it is spatially negatively correlated, a result of 0 indicates that there is no spatial correlation, and a result in the range of (0,1] indicates that it is spatially positively correlated.
In Formula 3,
2.1.3 Statistical Method of Related Factors
ArcMap was used to calculate the average distance between urban industrial land and main waters and lakes, major highways (both national and provincial highways), airports, railway stations, and municipal government stations in 334 prefecture-level cities. Then, the relationship between these elements was statistically analyzed using SPSS software. According to this analysis, we not only analyze the distance analysis between industrial land and related factors in each city, but also classify cities with different proportions of industrial land, so as to intuitively see the status of urban-related factors with different proportions of industrial land, and finally achieve the purpose of comprehensive and scientific analysis to avoid miscellaneous analysis as far as possible.
2.2 Data Source and Processing
For the data source, the research area explored includes the whole Chinese mainland (Hong Kong, Macao, and Taiwan were excluded because of a lack of specific data). The data used include the urban construction maps and administrative boundaries of 334 prefecture-level cities in China for 2015, which is the base map of the 1 km grid established later. This means the identification of urban industrial land must be established within the scope that the base map is the construction land in the land use classification. The data involved in this study also include the data of industrial land in Wuhan and Luoyang, and the geographical data of China’s main waters and lakes, major highways (both national and provincial highways), airports, railway stations, and municipal government stations in 2017. The map spots for urban construction and the map spots of main waters and lakes originate from NLUD-C with a spatial resolution of 30 m of the Chinese Academy of Sciences. These data are interpreted by remote sensing images. Urban construction land is defined by impervious surface and urban vegetation (He et al., 2017). Because of the difficulty to obtain the latest data, the map used shows data of 2015. The original data of construction spots were diagrammatically translated from satellite remote sensing images, rather than using official urban boundaries. The utilized data scale is large, which can compensate for the problem of relatively old data to a certain extent. At the same time, it usually takes 2–3 years for China’s urban construction map spots (only extracted map spots) to develop into specific functions; based on data availability, this study selected the industrial land use data of Wuhan and Luoyang (both land use data in 2015). Among them, the land use data of Wuhan in 2015 were only used for training RF data, and the use of historical data in the training is a basic operation. The industrial land data of Wuhan and Luoyang in 2015 are land use survey data accessed from the Wuhan Natural Resources and Planning Bureau and Luoyang Natural Resources and Planning Bureau, respectively. These data were only used for the mapping of a single land type (industrial land), and these data do not involve other land types, and do not include specific coordinate information. These data can be used after being confirmed with the Luoyang natural resources and Planning Bureau. The administrative boundary data originate from China’s second land use survey. Also, 54 million POI data of 12 categories in China in 2017 were obtained through web crawler technology based on the Baidu map open interface. These data include shopping centers, transportation facilities, educational facilities, financial institutions, hotels, tourist attractions, community services, entertainment facilities, medical facilities, restaurants, and corporate facilities. These locations reflect the basic activities of local residents in the four aspects of life, work, commuting, entertainment, and leisure. More detailed POI data introduction and processing flow can be found in He et al. (2018). Because the morphological dimension of China’s land use map used is 2015, the POI data of 2017 were obtained, and the geographic data of major highways (both national and provincial highways), airports, and railway stations were obtained from the free map service open street map, which offers a large amount of data and strong timeliness.
In terms of data processing, this study used ArcGIS to extract the construction land of 334 prefecture-level cities in China from the land use map. A 1 km × 1 km grid was used as statistical unit to divide the construction land in China, China’s construction land was divided and seven types of POI indicators are calculated. Wuhan and Luoyang were used as training samples to identify China’s industrial land. After the identification of industrial land of 334 prefecture-level cities in China was completed with the RF model, the area and proportion of industrial land in each city were further counted, and the identified industrial land was extracted again using ArcGIS software. The whole research area was divided into industrial land and non-industrial land, and finally rasterized into the TIFF format.
3 Results and Analysis
3.1 Verification and Analysis of Random Forest Identification Results
Based on the availability of data, industrial land and non-industrial land contained in the land use survey data of Wuhan Central Urban Area in 2015 and the land use data of Luoyang in 2015 were extracted, and the two types of land were set as y = 1 and y = 0, respectively. After this setting was completed, data were intersected with the kilometer grid to obtain the data set of two types of land for each grid. Through multiple groups of experiments and combined with robustness analysis, 30% of the grid was extracted from industrial land and non-industrial land for training. After optimizing the experimental adjustment parameters, the training results were obtained using orange data mining software (Table 3).
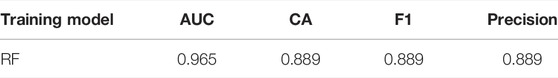
TABLE 3. Results of the training model.
After training with Wuhan and Luoyang, the predicted industrial land was compared with the actual industrial land in the main urban areas of Wuhan and Luoyang in 2015 as shown in Table 4 and Figure 2. The results show that the predicted area of industrial land in the central urban area of Wuhan is 73 km2, which is close to its actual industrial land area of 71.04 km2, and the predicted area of industrial land in the central urban area of Luoyang is 57 km2, which is close to the actual value of 59.09 km2. The comparison results between the predicted industrial land and the actual industrial land in Wuhan and Luoyang proved that POI data and RF can be used to identify urban industrial land.
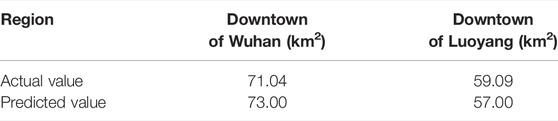
TABLE 4. Predicted actual values of industrial land in Wuhan city and Luoyang city.
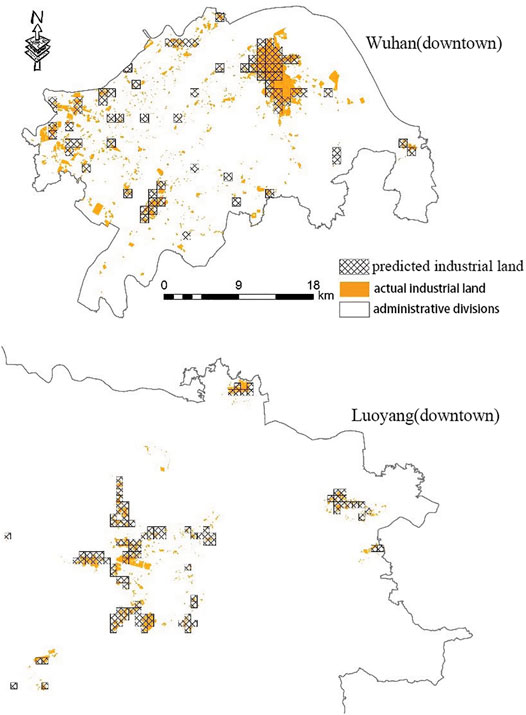
FIGURE 2. Comparison of predicted and actual industrial land use in Wuhan city and Luoyang city.
To further test the accuracy of urban industrial land prediction, the “intersect” tool of the software ArcGIS10.2 was used to intersect the predicted results of urban industrial land in Wuhan and Luoyang with the actual urban industrial land, which obtained the overlapping area S (i.e., the area with accurate predicted spatial location). The percentage of S and the actual area were used as a measurement standard to judge the recognition accuracy. The specific results are shown in Table 5. The overall recognition accuracy of the two places exceeds 60%, and that of Luoyang is 71.34%. Several of the plots failed to achieve accurate prediction. On the one hand, the prediction unit is a regular grid, but the actual patch is irregular, and intersecting the two will lose part of the area. On the other hand, the data in Table 4 show that the identification method is more suitable for predicting urban patches over 0.5 km2, which can capture a large range of urban industrial land, and its accuracy basically exceeds 60%.
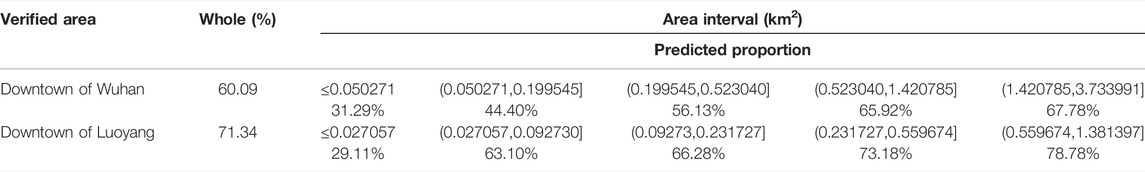
TABLE 5. Proportion of verified regional prediction.
3.2 Spatial Characteristics Analysis of Urban Industrial Land in China
3.2.1 Spatial Pattern Characteristics of Industrial Land in China
The numbers of NP, SPLIT, and COHESION in the patch type level index in FRAGSTATS were selected for spatial pattern analysis, to explore the agglomeration degree of industrial land in the national macro scope. The results are presented in Table 6 showing that the number of industrial land patches in China is 6,685, which is large. The separation index is high and the aggregation index is also high. This shows that the national industrial land presents a distribution trend of “large agglomeration and small dispersion” from the perspective of spatial pattern, that is, it shows strong agglomeration in a large regional scope, while it is relatively scattered in a small regional scope, for example, within a prefecture level administrative division.
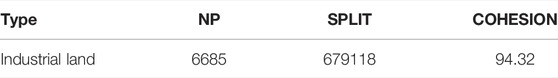
TABLE 6. Industrial land landscape fragmentation index.
3.2.2 Spatial Distribution Characteristics of Urban Industrial Land in China
The industrial land area of each city was assessed, but because the construction land area of each city is different, the area proportion of industrial land in construction land of each city was further assessed as shown in Figure 3 to analyze spatial characteristics. According to the standard of urban land classification and planning and construction land (GB 50137-2011), the proportion of urban industrial land is in the range of 15%–30%.
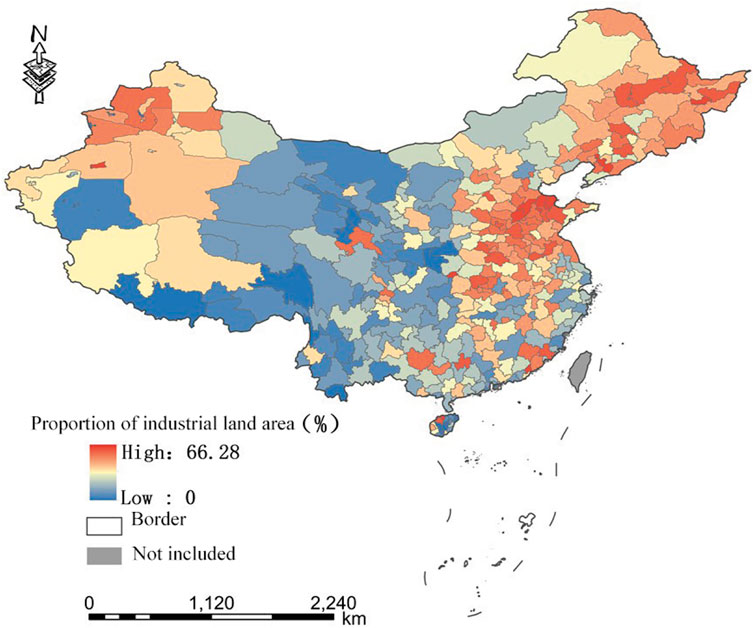
FIGURE 3. Proportions of industrial land in China’s prefecture-level cities.
According to statistical data shown in Table 7, among China’s 334 prefecture level administrative units, only 92 cities have this range, and the proportion of cities not in this range is 72.46%, of which 37 have less than 15% and 205 have more than 30%. This indicates that China’s 334 prefecture-level administrative units overall invest more in the secondary industry. The analysis results are in line with the national conditions indicating that the proportion of the secondary industry in the three major industries is much higher than that of developed countries. At the same time, the results show that many cities have not adhered to the recommended value of industrial land proportion according to the standards, which implies that the development objectives of various cities in China are diverse and that the development stages are different. This requires further studies at a later timepoint. From the perspective of spatial distribution characteristics, as shown in Figure 3, cities with a large proportion of industrial land are mostly concentrated in the north, especially in Shandong, Henan, and Hebei, three eastern provinces, which are located in the North China Plain, as well as a small part of Xinjiang. Here, the proportion of industrial land is relatively high in certain cities. As the cities with a high proportion of industrial land are concentrated in specific areas, it is necessary to further explore the degree of spatial agglomeration.
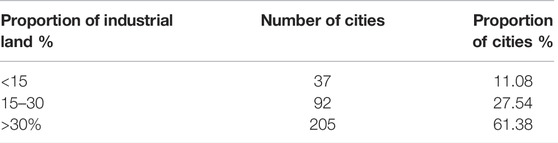
TABLE 7. Statistics on the number of cities with different proportions of industrial land.
Using GeoDa software and using data on the proportion of industrial land area of each prefecture level city, global and local spatial autocorrelation analyses were conducted on the predicted industrial land in China. As shown in Figure 4, the Moran’s I of the proportion of industrial land in 334 cities in China is 0.408, showing the characteristics of spatial positive correlation. This further shows that cities with a high proportion of industrial land in China have the characteristics of spatial agglomeration. To explore the spatial agglomeration characteristics and dispersion of industrial land in China more intuitively and carefully, further analysis was conducted via a LISA diagram in Figure 5. In general, there are clear differences in the agglomeration degree of industrial land in China. High–High agglomeration areas are mainly distributed in North China and Northeast China. Low–Low concentration areas are mainly concentrated in Tibet, Qinghai, Western Inner Mongolia, Western Sichuan, Yunnan, and Shaanxi.
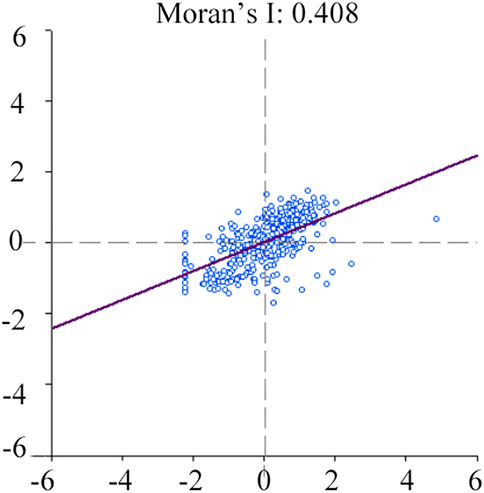
FIGURE 4. Moran’s I of industrial land proportion in 334 prefecture-level cities in China.
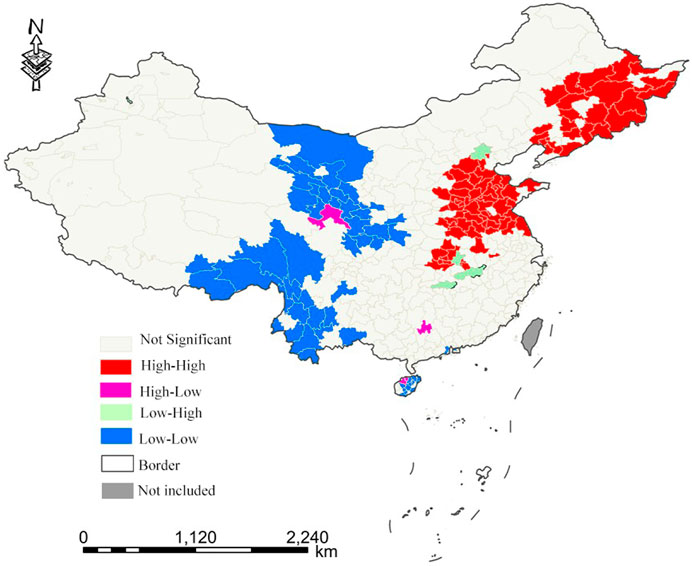
FIGURE 5. LISA map of industrial land proportion in 334 prefecture-level cities in China.
3.3 Analysis on Related Factors of Urban Industrial Land in China
In the past, scholars studied the factors affecting the spatial pattern of industrial land in a single city, and often discussed the relationship between the spatial distribution of urban industrial land and the distance to the urban center (McGrath, 2000; Langer and Korzhenevych, 2018), administrative center (Wang et al., 2007), river surface (Wang et al., 2007), highways, and railways (Fan et al., 2017). This research has verified that these factors have a certain correlation with the spatial pattern distribution of urban industrial land in China. Further analysis of the correlation factors of urban industrial land in China at the macro level has important reference significance for the overall understanding of the spatial pattern of urban industrial land in China.
Therefore, China’s main waters and lakes, main traffic highways (both national and provincial highways), airports, railway stations, and municipal government stations were used as centers, and the buffer distance was generated using ArcMap. Then, SPSS was used to generate a scatter map to analyze the relationship between the proportion of industrial land in China and the distance of five related factors. As shown in Figure 6, the industrial land in most cities in China is located within 10 km from the main waters and lakes (Figure 6A), not more than 3 km from the nearest main traffic highway (Figure 6B), and not more than 25 km from the nearest railway station (Figure 6D). Compared with the aforementioned three related factors, the phenomenon of “urban agglomeration” is not prominent in the distance relationship between industrial land and airport (Figure 6C) and municipal government garrison (Figure 6E). The distance between most urban industrial land and the nearest airport is about 130 km, but it is relatively scattered in this distance range. The industrial land in many cities is about 10–60 km away from the center of the municipal government.
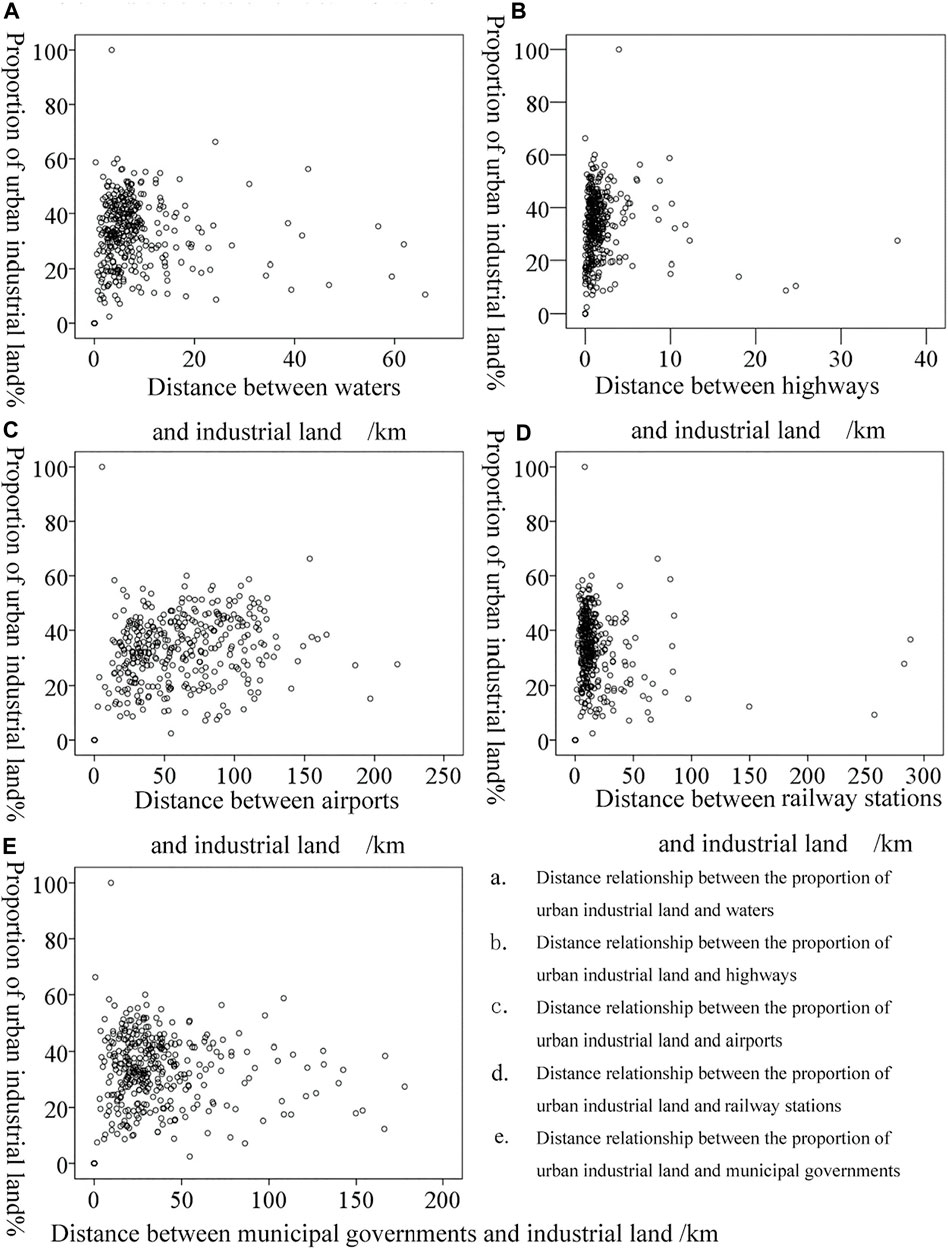
FIGURE 6. Industrial land proportion in 334 prefecture-level cities in China at different distances from related elements. (A) Distance relationship between the proportion of urban industrial land and waters. (B) Distance relationship between the proportion of urban industrial land and highways. (C) Distance relationship between the proportion of urban industrial land and airports. (D) Distance relationship between the proportion of urban industrial land and railway stations. (E) Distance relationship between the proportion of urban industrial land and municipal governments.
In Figure 6, the relationship between the proportion of urban industrial land and related factors cannot be effectively identified. Therefore, SPSS was used for tabular hierarchical statistics. The results in Table 8 show that the average proportion of urban industrial land within 2 km from main water bodies and lakes is 15.33%, which is significantly lower than that of other distance sections, and the average value within 1 km from the major highways is 28.11%, which is lower than that of other sections. The average value within 25 km from airports is 22.05%, which is also lower than the proportion of urban industrial land in other distance sections. The number of cities 20 km away from the railway station is not only small, but also the proportion of industrial land is low, which shows that the railway transportation is highly related to the location of industrial land. The industrial land of most cities is located within 100 km from the municipal government, and the proportion of urban industrial land less than 20 km in this distance is significantly lower than that of other distance segments.

TABLE 8. Statistical analysis of distance relationship between industrial land in 334 prefecture-level cities and related factors.
In summary, the industrial land of each city is close to the main waters and lakes, major highways, and railway stations, while there is no evident phenomenon of “urban agglomeration” from the airport. It is about 10–60 km from the garrison of the municipal government. The proportion of industrial land is not high in cities where the industrial land is close to the main waters and lakes, major highways, airports, and municipal government stations. However, the proportion of industrial land in cities close to the railway station is high, and the correlation between the two is high. The aforementioned results illustrate the distance relationship between China’s urban industrial land and related factors from the macro level, but the mechanism or the driving factors behind the relationship must be further discussed due to the focus and the limited length of the study.
4 Conclusion
In this study, POI data and RF are used to identify and analyze China’s industrial land. The main conclusions are summarized as follows:
1) By analyzing and comparing several groups of experiments, the result of RF for urban industrial land identification is proved to be scientific and referential. Based on the experimental results, the recognition accuracy of industrial land in industrial parks is greater than that of scattered industrial land.
2) From the perspective of spatial pattern, China’s urban industrial land presents the distribution trend of “large agglomeration and small dispersion.”
3) From the perspective of spatial distribution characteristics, cities with a high proportion of industrial land are mostly concentrated in the north. The Moran’s I of the proportion of industrial land in 334 cities in China is 0.408, which represents the characteristics of spatial agglomeration. High–high concentration areas are mainly distributed in North China and Northeast China, while low–low concentration areas are mainly concentrated in western regions such as Tibet, Qinghai, Western Inner Mongolia, Western Sichuan, Yunnan, and Shaanxi.
4) The industrial land of each city is close to the waters and lakes, highways, and railway stations, while there is no obvious connection with airports. Also, it is about 10–60 km away from the municipal government. In terms of the proportion of industrial land, the proportion of industrial land is not high in cities where the industrial land is close to waters and lakes, transportation highways, airports, and municipal government stations. The proportion of industrial land is high in cities where the industrial land is close to railway stations.
This study provides a new method and idea for single land type identification in large-scale research range. However, the following points may become the research direction in the future:
1) The POI data are only single period data, which fails to further analyze the temporal and spatial evolution of China’s urban industrial land. Also, there is a certain subjectivity in the selection of POI indicators. In the future, more complete time series POI data should be collected and standardized POI index selection standards should be formulated. Finally, this study selected urban industrial land as the research object, but China, as a developing country, has a large number of rural industrial land. An approach to scientifically and effectively identify a wide range of rural industrial land based on big data is a potential research direction.
2) It is necessary to continue to verify the applicability of RF to other types of industrial land.
3) The model used here is more suitable for the prediction of areas larger than 0.5 km2. Follow-up research will further improve the model method to better identify urban industrial land.
4) This study explores the relationship between urban industrial land and related factors but does not provide an in-depth analysis of the driving factors behind it. For example, industrial land is far away from municipal governments, which may be driven by multiple factors such as the government, enterprises, and the public, which should be explored in future research.
Data Availability Statement
The original contributions presented in the study are included in the article/Supplementary Material, further inquiries can be directed to the corresponding author.
Author Contributions
QH contributed to the conception of the study; XT performed the data analyses and wrote the manuscript.
Conflict of Interest
The authors declare that the research was conducted in the absence of any commercial or financial relationships that could be construed as a potential conflict of interest.
Publisher’s Note
All claims expressed in this article are solely those of the authors and do not necessarily represent those of their affiliated organizations, or those of the publisher, the editors, and the reviewers. Any product that may be evaluated in this article, or claim that may be made by its manufacturer, is not guaranteed or endorsed by the publisher.
References
Anselin, L. (1995). Local Indicators of Spatial Association: LISA. Geographical Anal. 27, 93–115. doi:10.1111/j.1538-4632.1995.tb00338.x
Belgiu, M., and Drăguţ, L. (2016). Random Forest in Remote Sensing: A Review of Applications and Future Directions. Isprs J. Photogrammetry Remote Sensing 114, 24–31. doi:10.1016/j.isprsjprs.2016.01.011
Chang, X., and Ke, H. (2020). Urban Impervious Surface Information Extraction Based on Random forest Algorithm: Taking Changchun as an Example. Bull. Surv. Mapp. 11, 43–49. doi:10.13474/j.cnki.11-2246.2020.0352
Dankoub, Z., Ayoubi, S., Khademi, H., and Lu, S.-G. (2012). Spatial Distribution of Magnetic Properties and Selected Heavy Metals in Calcareous Soils as Affected by Land Use in the Isfahan Region, Central Iran. Pedosphere 22 (1), 33–47. doi:10.1016/S1002-0160(11)60189-6
Davies, D. H. (1959). Boundary Study as a Tool in CBD Analysis: An Interpretation of Certain Aspects of the Boundary of Cape Town's Central Business District. Econ. Geogr. 35 (4), 322–345. doi:10.2307/142466
Eklund, P. W., Kirkby, S., and Salim, A. (1998). Data Mining and Soil Salinity Analysis. Int. J. Geographical Inf. Sci. 12 (3), 247–268. doi:10.1080/136588198241888
Fan, S., Zhang, L., Zeng, Z., Huang, Y., and Lin, X. (2017). Factors Influencing Land Intensive Use of Development Zone in Regions with Different Levels of Economic Development: A Case Study in Fujian Province. China Land Sci. 31 (06), 51–58. doi:10.11994/zgtdkx.20170627.132544
Gao, Y., Wu, Z., Lou, Q., Huang, H., Cheng, J., and Chen, Z. (2012). Landscape Ecological Security Assessment Based on Projection Pursuit in Pearl River Delta. Environ. Monit. Assess. 184 (4), 2307–2319. doi:10.1007/s10661-011-2119-2
Ham, J., Yangchi Chen, Y., Crawford, M. M., and Ghosh, J. (2005). Investigation of the Random forest Framework for Classification of Hyperspectral Data. IEEE Trans. Geosci. Remote Sensing 43 (3), 492–501. doi:10.1109/tgrs.2004.842481
He, Q., He, W., Song, Y., Wu, J., Yin, C., and Mou, Y. (2018). The Impact of Urban Growth Patterns on Urban Vitality in Newly Built-Up Areas Based on an Association Rules Analysis Using Geographical 'big Data'. Land Use Policy 78, 726–738. doi:10.1016/j.landusepol.2018.07.020
He, Q., Song, Y., Liu, Y., and Yin, C. (2017). Diffusion or Coalescence? Urban Growth Pattern and Change in 363 Chinese Cities from 1995 to 2015. Sustain. Cities Soc. 35, 729–739. doi:10.1016/j.scs.2017.08.033
Ishak, A., Siregar, K., AspriyatiGinting, R., Ginting, R., and Afif, M. (2020). Orange Software Usage in Data Mining Classification Method on the Dataset Lenses. IOP Conf. Ser. Mater. Sci. Eng. 1003 (1), 012113. doi:10.1088/1757-899X/1003/1/012113
Ivan, I., Singleton, A., Horák, J., and Inspektor, T. (2016). The Rise of Big Spatial Data. United Kingdom: Springer International Publishing.
Jamali, A. (2021). Land Use Land Cover Mapping Using Advanced Machine Learning Classifiers. Ekológia (Bratislava). 40 (3), 286–300. doi:10.2478/eko-2021-0031
Jean, N., Burke, M., Xie, M., Davis, W. M., Lobell, D. B., and Ermon, S. (2016). Combining Satellite Imagery and Machine Learning to Predict Poverty. Science 353, 790–794. doi:10.1126/science.aaf7894
Jiang, S., Alves, A., Rodrigues, F., Ferreira, J., and Pereira, F. C. (2015). Mining point-of-interest Data from Social Networks for Urban Land Use Classification and Disaggregation. Comput. Environ. Urban Syst. 53, 36–46. doi:10.1016/j.compenvurbsys.2014.12.001
Jo, S. S., Lee, S. H., and Leem, Y. (2020). Temporal Changes in Air Quality According to Land-Use Using Real Time Big Data from Smart Sensors in Korea. Sensors 20.21, 6374. doi:10.3390/s20216374
Lai, L., Huang, X., Yang, H., Chuai, X., Zhang, M., Zhong, T., et al. (2016). Carbon Emissions from Land-Use Change and Management in China between 1990 and 2010. Sci. Adv. 2 (11). doi:10.1126/sciadv.1601063
Lai, Y., Chen, K., Zhang, J., and Liu, F. (2020). Transformation of Industrial Land in Urban Renewal in Shenzhen, China. Land 9, 371. doi:10.3390/land9100371
Langer, S., and Korzhenevych, A. (2018). The Effect of Industrial and Commercial Land Consumption on Municipal Tax Revenue: Evidence from Bavaria: Evidence from Bavaria. Land Use Policy 77 (9), 279–287. doi:10.1016/j.landusepol.2018.05.052
Li, C., Liu, M., Hu, Y., Shi, T., Qu, X., and Walter, M. T. (2018). Effects of Urbanization on Direct Runoff Characteristics in Urban Functional Zones. Sci. Total Environ. 643, 301–311. doi:10.1016/j.scitotenv.2018.06.211
Li, G., Chang, L., Liu, X., Su, S., Cai, Z., Huang, X., et al. (2019). Monitoring the Spatiotemporal Dynamics of Poor Counties in China: Implications for Global Sustainable Development Goals. JOURNAL CLEANER PRODUCTION 227, 392–404. doi:10.1016/j.jclepro.2019.04.135
Lin, T., Sun, C., Li, X., Zhao, Q., Zhang, G., Ge, R., et al. (2016). Spatial Pattern of Urban Functional Landscapes along an Urban-Rural Gradient: a Case Study in Xiamen City, China. Int. J. Appl. Earth Observation Geoinformation 46, 22–30. doi:10.1016/j.jag.2015.11.014
Liu, Y., Fang, F., and Li, Y. (2014). Key Issues of Land Use in China and Implications for Policy Making. Land Use Policy 40, 6–12. doi:10.1016/j.jag.2015.11.01410.1016/j.landusepol.2013.03.013
Liu, Y., Li, J., and Yang, Y. (2018a). Strategic Adjustment of Land Use Policy under the Economic Transformation. Land Use Policy 74, 5–14. doi:10.1016/j.landusepol.2017.07.005
Liu, Y., Zhang, Z., and Zhou, Y. (2018b). Efficiency of Construction Land Allocation in China: an Econometric Analysis of Panel Data. Land Use Policy 74, 261–272. doi:10.1016/j.landusepol.2017.03.030
Long, Y., and Shen, Z. (2015). Geospatial Analysis and Application: A Comprehensive View of Planning Support Issues in the Beijing Metropolitan Area. Springer International Publishing.
Louw, E., van der Krabben, E., and van Amsterdam, H. (2012). The Spatial Productivity of Industrial Land. Reg. Stud. 46, 137–147. doi:10.1080/00343404.2010.530250
Lu, D., and Weng, Q. (2006). Use of Impervious Surface in Urban Land-Use Classification. Remote Sensing Environ. 102 (1-2), 146–160. doi:10.1016/j.rse.2006.02.010
Luciano, A. C. d. S., Picoli, M. C. A., Rocha, J. V., Duft, D. G., Lamparelli, R. A. C., Leal, M. R. L. V., et al. (2019). A Generalized Space-Time OBIA Classification Scheme to Map Sugarcane Areas at Regional Scale, Using Landsat Images Time-Series and the Random forest Algorithm. Int. J. Appl. Earth Observation Geoinformation 80, 127–136. doi:10.1016/j.jag.2019.04.013
Marcon, E., and Puech, F. (2009). Measures of the Geographic Concentration of Industries: Improving Distance-Based Methods. J. Econ. Geogr. 10 (5), 745–762. doi:10.1093/jeg/lbp056
McGrath, D. T. (2000). Urban Industrial Land Redevelopment and Contamination Risk. J. Urban Econ. 47 (3), 414–442. doi:10.1006/juec.1999.2147
Mckenzie, G., Janowicz, K., Gao, S., and Gong, L. (2015). How where Is when? on the Regional Variability and Resolution of Geosocial Temporal Signatures for Points of Interest. Comput. Environ. Urban Syst. 54, 336–346. doi:10.1016/j.compenvurbsys.2015.10.002
Moomaw, R. L. (1978). An Econometric Analysis of Industrial Land-Use Intensity within an Urban Area. Urban Stud. 15, 321–326. doi:10.1080/713702405
Murphy, R. E., and Vance, J. E. (1954). Delimiting the CBD. Econ. Geogr. 30 (3), 189–222. doi:10.2307/141867
Myint, S. W., Gober, P., Brazel, A., Grossman-Clarke, S., and Weng, Q. (2011). Per-pixel vs. Object-Based Classification of Urban Land Cover Extraction Using High Spatial Resolution Imagery. Remote Sensing Environ. 115 (5), 1145–1161. doi:10.1016/j.rse.2010.12.017
Naik, A., and Samant, L. (2016). Correlation Review of Classification Algorithm Using Data Mining Tool: WEKA, Rapidminer, Tanagra, Orange and Knime. PROCEDIA COMPUTER SCIENCE 85, 662–668. doi:10.1016/j.procs.2016.05.251
Pal, M. (2005). Random forest Classifier for Remote Sensing Classification. Int. J. Remote Sensing 26 (1), 217–222. doi:10.1080/01431160412331269698
Sun, Z., Jiao, H., Wu, H., Peng, Z., and Liu, L. (2021). Block2vec: An Approach for Identifying Urban Functional Regions by Integrating Sentence Embedding Model and Points of Interest. Ijgi 10 (5), 339. doi:10.3390/ijgi10050339
Toole, J. L., Ulm, M., González, M. C., and Bauer, D. (2012). Inferring Land Use from mobile Phone Activity. Proc. Acm Sigkdd Int. Workshop Urban Comput., 1–8. doi:10.1145/2346496.2346498
Wachtel, I., Zidon, R., Garti, S., and Shelach-Lavi, G. (2018). Predictive Modeling for Archaeological Site Locations: Comparing Logistic Regression and Maximal Entropy in north Israel and north-east China. J. Archaeological Sci. 92, 28–36. doi:10.1016/j.jas.2018.02.001
Wang, A., Mou, B., and Chen, S. (2007). Spatial Differentiation and Impact Factors of Industrial Land-Use in Guangzhou. Trop. Geogr. (02), 132–138.
Wang, J.-C., Jin, Z.-D., Yang, M., and Naqvi, S. (2021). Does Strict Environmental Regulation Enhance the Global Value Chains Position of china's Industrial Sector? Pet. Sci. 18 (6), 1899–1909. doi:10.1016/j.petsci.2021.09.023
Xie, H., and Wang, W. (2015). Spatiotemporal Differences and Convergence of Urban Industrial Land Use Efficiency for China's Major Economic Zones. J. Geogr. Sci. 25 (10), 1183–1198. doi:10.1007/s11442-015-1227-2
Yang, Q., Li, Z., Lu, X., Duan, Q., Huang, L., and Bi, J. (2018). A Review of Soil Heavy Metal Pollution from Industrial and Agricultural Regions in china: Pollution and Risk Assessment. Sci. Total Environ. 642 (15), 690–700. doi:10.1016/j.scitotenv.2018.06.068
Yuan, J., Zheng, Y., and Xie, X. (2012). “Discovering Regions of Different Functions in a City Using Human Mobility and POIs,” in The 18th ACM SIGKDD International Conference on Knowledge Discovery and Data Mining (New York, USA.
Zhai, W., Bai, X., Shi, Y., Han, Y., Peng, Z.-R., and Gu, C. (2019). Beyond Word2vec: An Approach for Urban Functional Region Extraction and Identification by Combining Place2vec and POIs. Comput. Environ. Urban Syst. 74 (03), 1–12. doi:10.1016/j.compenvurbsys.2018.11.008
Zhang, J., Zhang, X., Zhang, A., and He, S. (2020). Theory, Mechanism and Benefit Loss of Spatial Misallocation of Construction Land:an Empirical Analysis Based on Hubei Province. China Popul. Resour. Environ. 30 (04), 42–53. doi:10.12062/cpre.20191103
Zhang, X., and Du, S. (2015). A Linear Dirichlet Mixture Model for Decomposing Scenes: Application to Analyzing Urban Functional Zonings. Remote Sensing Environ. 169, 37–49. doi:10.1016/j.rse.2015.07.017
Keywords: POI data, random forest model, industrial land, spatial pattern analysis, associated factor analysis
Citation: He Q and Tang X (2022) Identification and Analysis of Industrial Land in China Based on the Point of Interest Data and Random Forest Model. Front. Environ. Sci. 10:907383. doi: 10.3389/fenvs.2022.907383
Received: 29 March 2022; Accepted: 12 April 2022;
Published: 11 May 2022.
Edited by:
Ying Jing, Zhejiang University, ChinaCopyright © 2022 He and Tang. This is an open-access article distributed under the terms of the Creative Commons Attribution License (CC BY). The use, distribution or reproduction in other forums is permitted, provided the original author(s) and the copyright owner(s) are credited and that the original publication in this journal is cited, in accordance with accepted academic practice. No use, distribution or reproduction is permitted which does not comply with these terms.
*Correspondence: Xinyu Tang, 2547728639@qq.com