 Xiaoxia Bian1
- 1School of Mathematics and Physics, Yancheng Institute of Technology, Yancheng, Jiangsu, China
- 2School of Mathematics and Big Data, Chaohu University, Chaohu, Anhui, China
- 3School of Economics, Nanjing University of Finance and Economics, Nanjing, Jiangsu, China
This paper attempts to explore the dynamic relationship between new energy industry development and energy structure transformation in China. Based on the real option model and stochastic frontier analysis (SFA), the development scale and technical level of the new energy industry are measured at the provincial level. The eastern region is in the lead, but there has been a certain degree of technological efficiency retreat, especially in Liaoning. The new energy industry in the central region has developed rapidly due to the deepening of the industrialization process. With the aid of PVAR model, impulse response function and variance decomposition, the results show that there exists a bidirectional dynamic relationship between the new energy industry and energy structure. In other words, the development of the new energy industry and the energy transition can be mutually predicted. Specifically, technology effect has a positive continuous and dramatic influence on the transformation of energy structure. In turn, the energy transition first elicits a response to size effects, but has a long-term impact on technology effects. This implies that the new energy industry will usher in scale expansion at the early stage of energy transition. It is worth noting that scale expansion will not always accelerate the transition process. At that time, technology played a long-term and central role. Therefore, reasonable expansion of new energy industry scale and efforts to develop new energy technology are important measures to ensure the orderly energy transition.
1 Introduction
Excessive use of fossil fuels has taken a huge toll on the environment. The increasing in coal consumption reversed the long-standing trend of gradual decarbonization of the world’s energy supply. Currently, fossil fuels still dominate the global energy system, accounting for more than 80% of total energy supply (Tian et al., 2022). The combustion of fossil fuels emits carbon dioxide, sulfur dioxide, etc. Carbon dioxide can persist in the atmosphere for a long time, forming a greenhouse effect. Emissions of GHG further contribute to global warming and lead to long-term changes in the climate system. Sulfur dioxide is a short-term pollutant but contributes to the formation of atmospheric aerosols. Aerosols mask the effects of global warming, but aerosol particles are highly toxic when inhaled and cause millions of premature deaths per year (Shindell and Smith, 2019). Sudden change of environment has a universal and irreversible impact on human beings and ecosystems, thus seriously threatening the future economic development. Climate change has become the common concern of all mankind. It requires rapid and far-reaching changes in the energy system (Fang et al., 2020a).
New energy has the advantages of pollution-free, large reserves and renewable. Due to these good performances, most countries are making efforts to develop new energy technologies. It is estimated with high confidence by IPCC that renewables are projected to supply 70%–85% of electricity in 2050 (IPCC, 2018). As advances in technology leads to a sharp drop in prices and grid-connected system ensures stable energy supply (Vishnupriyan and Manoharan, 2017), new energy industries such as wind power and photovoltaic have become a reliable solution for many countries to cope with the constraints of climate change and meet the needs of economic growth. In order to achieve the carbon neutrality by 2050 proposed in the European Green Agreement, the EU vigorously carry out energy transformation and reduce the carbon intensity of power generation. New energy undertakes the main task of decarbonization (Gerbaulet et al., 2019). During the period of China’s 13th Five-Year Plan, the development of green energy system played an important role in the reduction of carbon emission intensity. Carbon emission intensity in 2019 was 48.1% lower than that in 2005. The 2060 carbon neutral vision puts forward higher requirements for the adjustment and deep transformation of energy structure. The United States adjusts the existing power plants through the “Best Emissions Reduction System” in the form of legislation. Reduction of carbon dioxide emissions caused by power generation has become the main motivation to increase the use of wind energy and other renewable energy (Cardell and Anderson, 2015).
New energy sources are considered a promise in the global energy transition, especially in the post-pandemic era (Tian et al., 2022). First, fossil fuel prices are becoming unpredictable due to geopolitical conflicts, non-renewables, and declining demand. New energy is becoming the new favorite of investors. The energy transformation has made new energy more attractive to sustainable investment and financing (such as green finance and ESG investment). In the long run, the new energy industry faces double advantages of rising prices and quantities. The benefits are more certain and the return on investment is more stable, which in turn accelerates the energy transition. Secondly, the improvement of people’s environmental awareness and the development of intelligent technology are also new opportunities for the development of new energy. New energy vehicles are entering thousands of households, improving air pollution and accelerating the substitution of new energy for fossil energy in terminal energy consumption (Xing et al., 2021).
Existing studies have shown that the energy structure of global terminal consumption is developing towards low carbon pattern (Li et al., 2021). Promoting the substitution of low carbon energy for high carbon energy and new energy for fossil energy is the main way to realize the green and low carbon transformation of energy (Dogan and Seker, 2016). At present, China’s energy structure is not in the optimal state, and almost all provinces have the problem of low energy allocation efficiency (Sun et al., 2018). Despite the huge potential of new energy industry, it is still difficult to replace fossil energy with new energy (Gao et al., 2014; Fang et al., 2020b). This paper takes China as an example to study the dynamic relationship between the development of new energy industry and the transformation of energy structure. Although the proportion of coal consumption has been declining year by year, this is mainly due to the substitution of oil and natural gas for coal. The contribution of new energy to the transformation of energy structure is not obvious. As the urban cities continue to expand, growth in energy consumption is inevitable (Wang et al., 2019). China’s crude oil production is maintained at about 200 million tons nowadays, with little potential for production increase, high dependence on foreign sources, and restricted by ocean transportation capacity. Natural gas also has risks of geopolitical factors, which will directly affect China’s energy and even economic security.
The marginal contributions of this paper are as follows: Existing studies often equate the development of new energy industry with the transformation of energy structure as a pathway choice for low carbon emission reduction or sustainable development. This paper clarifies the relationship between the two, and further subdivides the development of the new energy industry into two dimensions: size and technology. On the one hand, the new generation power supply system requires a high proportion of new energy to replace fossil energy. On the other hand, different from the traditional energy industry, the new energy industry has the attributes of both resources and manufacturing. The development of new energy industry depends on the continuous breakthrough of energy technology. Thus, three variables (size effect, technology effect and energy structure) are studied in the one framework. And due to various kinds of energy and industries involved, existing studies are limited by data and measurement methods. With the help of the real option model and the stochastic Frontier model, this paper measures the growth prospects and technological inefficiencies of the new energy industry. Lastly, compared with the traditional time series analysis, this paper establishes a coevolutionary equation system that treats all variables as endogenous variables through the PVAR model, and controls the time and individual effect. Orthogonalized impulse response is used to identify the influence of an exogenous shock on the endogenous variables of the system, which makes the empirical results more reliable.
The rest of this paper is structured as follows. Section 2 reviews the research status of energy structure transformation and the development of new energy industry. Section 3 describes the variable design and introduces the empirical model. The empirical results are shown and analyzed in Section 4. Section 5 summarizes the conclusions and puts forward relevant implications.
2 Literature review
2.1 Energy structure transformation
Studies of energy consumption structure firstly focus on its environmental benefits. In order to cope with the urgent situation of climate change and promote the coordination between economic and social development and resource utilization, low-carbon transformation of energy structure is an important countermeasure to reduce carbon dioxide emissions on the premise of ensuring energy supply (Sun et al., 2018). Cardell and Anderson (2015) found that an increase in the supply of wind power generation by 10%–20% can reduce carbon emissions in the U.S. power supply industry by 15%–36% through Monte-Carlo simulation. Dogan and Seker (2016) and Zoundi (2017) both confirmed a bidirectional causality between renewable energy and carbon emissions. The utilization of new energy is conducive to reducing carbon dioxide emissions (Liu et al., 2021). It is expected uneconomic to invest in any additional fossil energy in the future. Coal and natural gas will be gradually phased out in the 2040s (Gerbaulet et al., 2019).
Others focus on the factors of energy structure transformation, such as consumer preference, energy price, resource endowment, economic growth, energy consumption and carbon emission constraints (Ren et al., 2022a). According to demand theory, energy price and resource endowment have a significant impact on energy consumption demand (Xue et al., 2021; Yang et al., 2021). Then what has to be considered in the process of energy transition is the high cost of new energy popularization (Marques and Fuinhas, 2012), which requires policymakers to keep a balance between the absorbing cost of energy transition and economic growth. Based on the classic Environmental Kuznets Curve in environmental economics, many scholars further study the inverted U-shaped relationship between the energy structure transformation and economic growth. However, the conclusions still reach no agreement, mainly divided into three groups. Some believe that the transformation of energy structure has not improved economic growth, or even has a negative impact (Marques and Fuinhas, 2012). Some hold that new energy is an important way to realize sustainable development and promote economic growth (Shahbaz et al., 2020; Shi et al., 2022). Others confirms a U-shaped relationship between energy structure transformation and economic growth (Han et al., 2022). In addition, energy consumption and carbon emission constraints are also important factors that many scholars take into account when studying the optimization of energy consumption structure (Wei et al., 2020).
It can be found that, the conclusion that the energy structure transformation can suppress carbon dioxide emissions is basically consistent. While the relationship between energy transition and economic growth is still uncertain. On the one hand, energy industry is the basic and pillar industry of the national economy. The reform of energy system will cause a profound impact on the industrial and consumption system. On the other hand, when energy consumption demand and renewable energy subsidies are too high, promoting renewable energy consumption could cause a tremendous economic cost. The relationship between energy structure transformation and economic growth is mainly reflected in the benefit of new energy industry. For the objective of absorbing the cost of transition and playing the role of new energy as an economic engine, it is necessary to further investigate a reasonable path to develop the new energy industry.
2.2 Development of new energy industry
As a strategic emerging industry, new energy involves many industries and has a wide influence. It is becoming a competitive economic growth point among countries in the world. Bhattacharya et al. (2016) conducted an empirical study on 38 largest renewable-energy-use countries. The results showed that new energy consumption had a positive impact on economic growth in 23 of them and a negative impact in 9. Shahbaz et al. (2020) tested this relationship again with updated data for the same 38 countries, and found that the number of countries with negative influence decreased significantly. Other scholars also found that the consumption of new energy has a significantly positive effect on economic growth in different countries and regions (Apergis and Payne, 2010; Paramati et al., 2018), indicating that the economic benefits brought by the new energy industry are gradually highlighted. In addition, some studies show that there is a feedback relationship between economic growth and new energy consumption (Ohler and Fetters, 2014). Namely, economic factors are also the reasons for promoting the development of the new energy industry. The increase of financial development and per capita income contribute to the increase of the consumption of renewable energy, and their influence on renewable energy is greater than that of non-renewable energy (Sadorsky, 2009; Zhao et al., 2020). However, some also found no relationship between economic development and new energy consumption or negative relationship (Menegaki, 2011; Ocal and Aslan, 2013).
New energy industry has dual constraints of economic growth and environmental protection. Its development path also shows differences from other industries. The decision to use new energy is made by the agent of the consumers, not by themselves. Thus a large-scale phenomenon of market failure exists in the new energy industry (Brown, 2001), which needs to be directed by government intervention (Guo et al., 2020). Many countries have heavily subsidized its commercialization and marketization. Most studies have proved that subsidies can correct market failures and promote environmental quality. However, no consensus has been reached in the effectiveness evaluation of subsidies (Grimaud and Rouge, 2008; Shen and Luo, 2015). Improper support for emerging industries will encourage enterprises to work for subsidies, or even fall into the situation where they are increasing revenue while losing money.
The effect of increasing returns to scale and the consequence of self-reinforcing mechanism will lead to the technology being locked in an inefficient or even suboptimal path (David, 1985). Technology path dependence will further limit the options of future innovation and diversification. As a knowledge and technology intensive industry, the green technology innovation is a driving force for sustainable development (Zhang et al., 2020). Technologies in wind, solar and hydropower will contribute more and more environmental and economic benefits (Gaete-Morales et al., 2018). The innovation of emerging technologies such as power storage technology will also play a supplementary role in reducing the cost of the entire set of new energy system (Züttel et al., 2022). Enterprises’ R&D activities to improve production efficiency and product quality are capable of changing energy use patterns, suppressing carbon emissions, and significantly reducing the cost of carbon emissions (Li and Lin, 2016). It is also worth noting that technological progress is uncertain and that investments in new technologies are to a certain extent irreversible (van Soest and Bulte, 2001). Correspondingly, uncertain policy environment and market environment will not only affect the energy market (Wang et al., 2022; Wen et al., 2022), but also affect technological innovation (Ren et al., 2022b, 2023). Policies that stimulate R&D to enhance the adoption of new technologies can backfire if the technology fails to meet expectations (Yang and Tang, 2019). In addition, the renewable energy policy also has the side effect of inducing technological risks, which irreversibly reduces the enthusiasm of firms to adopt new technologies, and makes the existing technologies lose their competitiveness earlier (Ye et al., 2022).
To sum up, as a knowledge-intensive industry, it is an urgent requirement for the new energy industry to break away from technology path dependence and achieve major technological breakthroughs. Therefore, appropriate methods should be considered to evaluate its size and technology. In addition, the existing literature lacks a comprehensive consideration of economic and environmental benefits. This paper explores the internal mechanism and dynamic relationship in more detail, hoping to provide reference for the formation of new energy industry development policy.
3 Methodology
In order to deeply depict the role of the size and technology effect of new energy industry in the process of low-carbon energy structure transformation, this paper firstly constructs the scale evaluation index of the new energy industry from the micro level through the real option model. Stochastic frontier analysis (SFA) is used to estimate the technical efficiency of the new energy industry. Through the PVAR model, impulse response function and variance decomposition, the dynamic relationship between the development of new energy industry and energy consumption structure is analyzed.
3.1 Variables
Size effect of new energy industry (SIZE). In order to maximize the benefits, new energy industry is required to be supported by a certain scale economy in the early stage of development. A large fixed investment ratio is significant. Thus the construction cycle and cost recovery period is long. New energy enterprises have high requirements for manpower and material resources, which leads to high requirements for amounts of capital and stable cash flow. Therefore, the scale of an enterprise is essential. However, if merely using indexes such as corporate assets or stock value to indicate the scale of industrial development, it has not taken into account the volatility and risk of the growth, nor can it reflect the social benefits and prospect value of the new energy. This paper attempts to use the real option model to evaluate the value of new energy enterprises.
According to the Black-Scholes option pricing theory (Black and Scholes, 1973), the real option model extends the connotation of options, regards the owner’s equity as an option based on the market value of enterprise assets, and accounts for the market information and prospect value. The real option model is a dynamic value evaluation model and can evaluate the project value in the uncertain market. It has been widely used in the evaluation of renewable energy investment projects and the overall benefit analysis of renewable energy development planning (Lee and Shih, 2010). Existing studies have applied it to the decision-making of nuclear power investment, geothermal project and photovoltaic smart grids (Fan et al., 2019; Castellini et al., 2021). Applying the option pricing formula derived from the Black-Scholes differential equation to the real option model, the following expression is constructed.
Here,
Technology effect of new energy industry (TECH). As a knowledge and technology intensive industry, the technical efficiency determines the sustainable development ability, which is an indispensable index to evaluate the new energy industry. The technology effect measured in this paper is a kind of generalized technology efficiency. That is, it includes all the forces that change the production function caused by specific technological improvement and innovation, and attributes the remaining part of output that cannot be explained by the input of production factors to technological progress. So traditional technology innovation indexes based on the single indicator, such as the spending on R&D, the number of patent application are no longer applicable. What’s more, these single indexes still belong to a kind of intermediate output variables. The efficiency measurement of input-output can not only reflect the commercialization results of knowledge input, but also reflect the economic value of other R&D effects such as the improvement of technological process and product quality through the final products and services. In this paper, the stochastic Frontier function is used to estimate the technical efficiency of the new energy industry. The SFA method relaxes the assumption of constant substitution elasticity. Setting the model in the form of transcendental logarithmic production function can check the validity of the function form, thus ensuring a better goodness of fit. Scholars generally believe that SFA method based on production function can better reflect the authenticity of efficiency (Kang et al., 2022; Zeng et al., 2023). This method takes into account greatly the impact of random environmental disturbances and management inefficiency factors on the new energy industry. Specifically, the stochastic Frontier production function of this paper is constructed as follows.
Here, subscript
Therefore, technology effect of the new energy industry embodied in the stochastic Frontier production function model is defined as the ratio between the actual output and the maximum output represented by the Frontier (i.e., the output when technical efficiency loss is 0) at the given factor input level. Formally, TECH is specified as:
Energy consumption structure (EC). Looking back at the history of energy, mankind has gone through two transition processes. The first transition was from firewood to coal in the early 19th century, and the second was from coal to oil and gas in the 1960s (Verbong and Geels, 2007). Each transition is characterized by decarbonization, that is, the carbon element in alternative energy is reduced and the hydrogen element is increased. The process of energy transformation is the process of low-carbon energy development (Zhao and You, 2020). Therefore, a proxy indicator of the ratio of coal consumption to total energy consumption is used to measure the energy structure EC (Fang et al., 2022).
3.2 Empirical model
The dynamic relationship between multiple variables is often difficult to be explained by strict economic theory. Although there are structural methods such as simultaneous equation models, the endogenous variables appear at both the left end and the right end of the equation, making parameter estimation extremely complicated. In order to verify the relationship among variables, we adopt panel vector autoregressive (PVAR) model for research. PVAR model was proposed by Holtz-Eakin et al. (1988). Like the ordinary VAR model, its advantage lies in that it treats all variables as endogenous variables, thus avoiding the problems of endogeneity and model setting errors. In addition, PVAR model overcomes the defect that the ordinary VAR model cannot estimate the data with short time series and small sample size. Holtz-Eakin et al. (1988) points out that when
Here,
Since the individual effect
4 Empirical analysis
In 2019, China has ranked first in the world in terms of both the newly installed capacity and cumulative installed capacity of global wind power. However, the wind power industry is still in the stage of grabbing subsidies. Enterprises are working fast in order to get subsidies, falling into the situation of increasing revenue while losing money. In terms of technology, China’s wind power industry still relies heavily on imports of high-end components. For example, the carbon fiber materials used in the manufacture of wind power blades did not achieve domestic breakthroughs until 2019 and leaves a demand gap of more than ten thousand tons. Likewise, the fan spindle bearing is also limited by high-precision machine tools, induction heating equipment and other high-end manufacturing technology, which cannot realize the domestic substitution for imported. It can be seen that the development of the new energy industry should consider not only the scale expansion, but also the technical progress.
4.1 Data: Sources and description
According to the criteria for new energy industries in the Strategic Emerging Industries Classification (2018)1, this paper lists companies whose main business involves nuclear power, wind energy, solar energy, biomass energy and other new energy industries, as well as smart grids, as new energy companies by analyzing the information disclosed in the company’s annual report. The sample interval is from 2007 to 2017. After excluding the companies marked by abnormal transactions such as ST, *ST, and PT and the absence of data during the sample interval, the number of new energy enterprises finally increased from 26 in 2006 to 81 in 2016. Size effect was summarized at the provincial level.
Due to the wide variety of new energy sources, the required input-output indica-tors related industry data cannot be directly obtained, which hinders the calculation of Technology effect. Fortunately, the new energy industry basically belongs to the three industries of general equipment manufacturing, electrical machinery and equipment manufacturing, and electric power and heat production and supply industries. This paper uses the total assets and the number of workers of industrial enterprises above designated size in these three industries as input variables, and the industrial product sales value as output variables. Finally estimate the technology effect of new energy industry, and form the panel data of 19 provinces2.
According to the calculated new energy industry evaluation indicators, Figure 1 show the development of new energy industry in China’s provinces in 2006, 2011, and 2016 respectively. The horizontal axis represents the technological effect, and the vertical axis represents the scale effect. The larger the value, the better. In other words, the farther the point on the map is from the origin of the coordinate, the better the development of the new energy industry. It can be seen that the points of most provinces concentrated in the lower-left portion of the coordinate axes in 2006 (Figure 1A). At that time, China’s Renewable Energy Law has just been promulgated. The status of new energy, its impact on China’s economy in the future, and China’s sustainable development strategy were not determined until then in the form of laws. The development of new energy is still in its infancy, with limited funds, high costs, and weak technologies that are not sufficient for wide application.
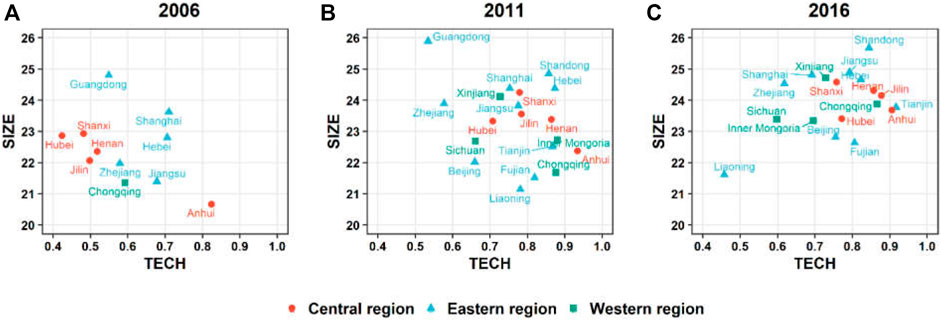
FIGURE 1. Development of new energy industry in China in (A) 2006; (B) 2011; (C) 2016.
After that, the National Development and Reform Commission and relevant departments issued several synchronized policies for the development of new energy. The task of new energy development is pointed out clearly. The proportion of renewable energy use is increasing gradually. As is shown in Figure 1B and Figure 1C, except for Liaoning, the development of new energy industry in other regions tends to be far away from the coordinate origin from 2011 to 2016. The size effect of Guangdong Province has always been the first, but the technical effect is relatively backward. The technology effect of Anhui and Tianjin remains at the forefront. The development of Shandong Province in the two dimensions is relatively balanced, and gradually surpasses Shanghai and Hebei.
China has achieved a large-scale layout of new energy industries in wind energy, photovoltaic, hydropower, nuclear energy, etc. The distribution of these resources in China has significant regional characteristics. It can be seen from the results of Figure 1B,C that the scale of Xinjiang’s new energy industry is far ahead in the western region. As early as the 1950s, China began to explore wind power generation and built the first 10,000 kW wind farm in Xinjiang. In addition to inland areas (mainly northern Inner Mongolia and Xinjiang), China’s wind energy resources are mainly concentrated in the eastern coastal areas. This is because the wind system composed of monsoon, land sea breeze and tropical cyclone brings rich wind energy resources to the coastal areas.
On the contrary, China’s hydropower resources are mainly located in the southwest inland areas, accounting for about 75% of total. However, hydropower development involves large-scale migration, ecological protection, construction costs and other issues. On the whole, the development of new energy industry still has potential to be tapped. Figure 1A shows that although the new energy industry in Chongqing and Sichuan has developed early, the overall scale and technology still need to be improved.
Furthermore, China has rich solar energy resources. The photovoltaic industry has reached the international leading level. As a battery module manufacturing base, the Yangtze River Delta has gathered a large number of new energy manufacturing enterprises. Jiangsu has gathered a large number of new energy enterprises, and its obvious late development advantage can be seen from Figure 1. In general, the eastern region relies on its own capital accumulation and technological strength to achieve steady industrial development, while the western region develops relatively slowly. The central region is also outstanding with its advantages in raw material supply and advanced equipment manufacturing.
The financial data source of this paper is Resset Database, the input-output index data is obtained from China Industry Statistical Yearbook, and the energy structure data comes from China Energy Statistical Yearbook. Linear interpolation method is used to supplement some missing data, and descriptive statistics of variables are shown in Table 1.
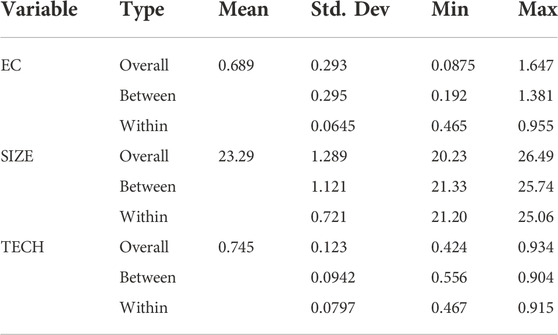
TABLE 1. Descriptive statistics of variables.
4.2 PVAR estimation results
In order to avoid spurious regressions caused by unstable data, this paper first perform a panel unit root test on the three variables. ADF-Fisher and PP-Fisher tests are adopted to test each individual in the panel. According to Choi (2001), four methods (in-verse chi-square transformation, inverse normal transformation, inverse logic trans-formation and modified inverse chi square transformation) are proposed to synthesize p values into Fisher statistics. The results are shown in Table 2. The original series may have unit roots. After calculating the growth rate of each variable, the new series (gEC, gSIZE, gTECH) are obtained, all of which are stationary.
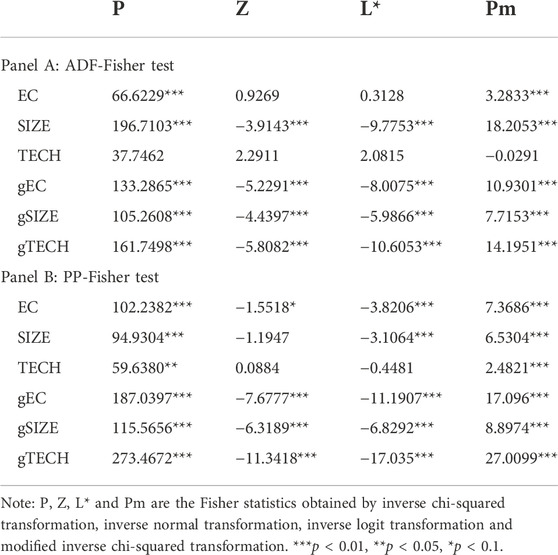
TABLE 2. Panel unit root test results.
Before performing GMM estimation on the PVAR model, it is necessary to deter-mine the lag order of the variable. Information criterion is adopted to select the lag order according to the minimum statistics of MBIC, MAIC and MQIC. The results are shown in Table 3. The lag 1 period is selected as the best lag order of the PVAR model. Table 3 also shows the over-identification test based on the J statistic. The results show that the first-order lag PVAR model J test cannot reject the null hypothesis that all instrumental variables are exogenous, indicating that the over-identification constraint is effective.
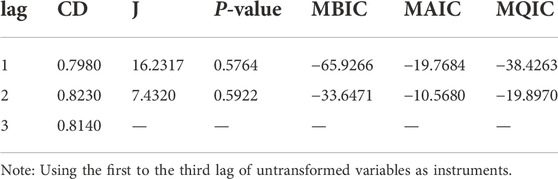
TABLE 3. Determination of the lag period.
Parameters are estimated on the basis of selecting the optimal lag order. The GMM estimation results of the PVAR model are shown in Table 4. The first-order lag of gEC is significantly negatively related to gTECH, indicating that the improvement of the energy structure (the proportion of coal consumption declines) is helpful to promote the development of the new energy industry, and it is mainly reflected in the technology effect. At the same time, there is a significant negative correlation between first-order-lagged gTECH and gEC. The technological effect of the development of new energy industry can also in turn promote the low-carbon transformation of energy consumption structure. As for the size and technology effect, the first-order lag gSIZE and gTECH are negatively correlated, which indicates that size effect may have a negative impact on technological progress and industrial innovation. The first-order lag gTECH and gSIZE show a positive correlation, which means that technology effects may drag down the size effect. However, the relationship between the two is not significant, and further research and verification are needed.
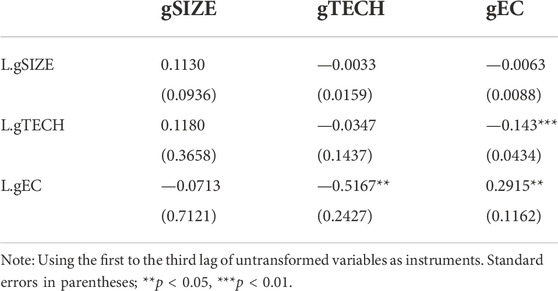
TABLE 4. Regression results of PVAR model.
4.3 Impulse response analysis
The impulse response function can be used to analyze the dynamic response of the system after an impact is exerted on one variable, so as to test the long and short term relationship between the variables. The orthogonalized impulse response function based on the Cholesky decomposition depends on the order of the variables. The basic principle is that the variables in the Cholesky matrix are ordered from relatively exogenous to endogenous. Combined with the panel VAR estimation results, it is deemed that there is a bidirectional dynamic relationship between the development of new energy industry and the low-carbon transformation of energy structure. This relationship is mainly reflected in the technology effect, and size effect is relatively faint. Further-more, Granger causality test is performed on gSIZE, gTECH, and gEC to determine the order of variables, as shown in Table 5.
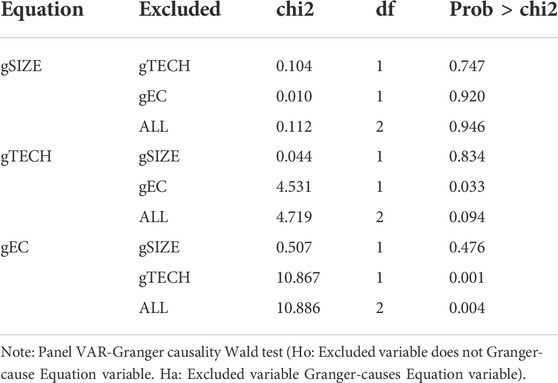
TABLE 5. Granger causality test results.
Granger causality test shows that gEC and gTECH are bidirectional causality, gSIZE and gEC are joint granger-causes of gTECH, while gSIZE and gTECH jointly granger cause gEC. Therefore, this paper conducts impulse response analysis in the order of Energy Structure, Size Effect, Technology Effect and Technology Effect, Size Effect and Energy Structure respectively. As shown in Figures 2, 3, there is no substantial difference between the two kinds of results. The estimation results of the PVAR model are robust.
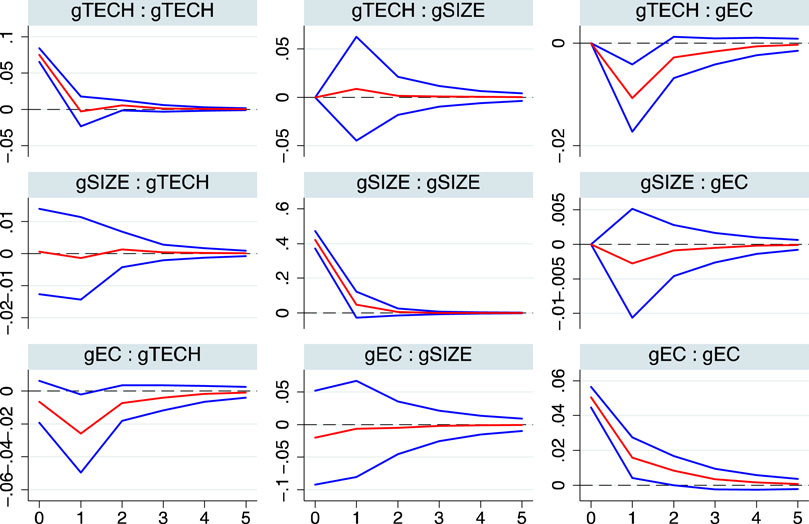
FIGURE 2. Orthogonalized impulse response (ordered by gEC gSIZE gTECH).
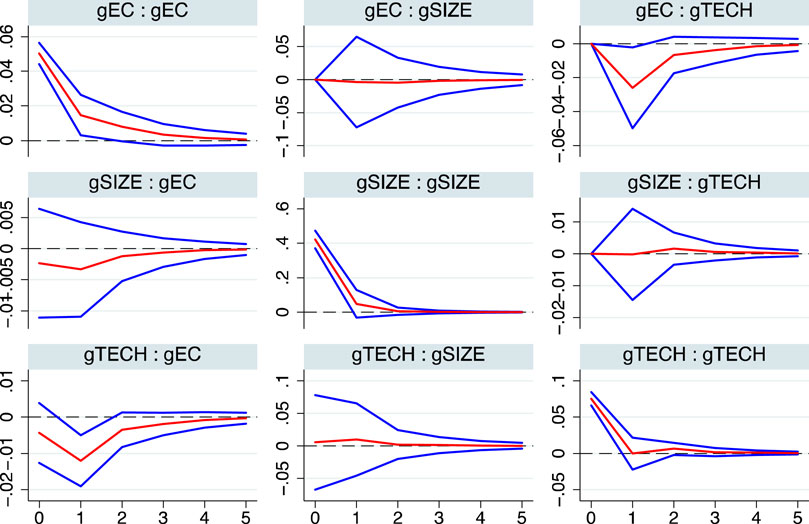
FIGURE 3. Orthogonalized impulse response (ordered by gTECH gSIZE gEC).
By exerting a standard deviation shock on the endogenous variable, the orthogonal impulse response function graphs are obtained by using Monte-Carlo simulation 500 times. The upper and lower limits of 95% confidence intervals are given. Figure 2 contains (3 × 3) subgraphs. The three subgraphs in the first row treat gTECH as the impulse variable, respectively depicting the dynamic response of gTECH on gTECH, gEC, and gSIZE. The results show that gSIZE has a positive response to gTECH, while gEC has a negative response to gTECH. It can be seen from the second subgraph that technology effect has a positive impact on size effect, and tends to be stable after the second period. The third subgraph shows that technological progress has led to the low-carbon transformation of energy structure, and has a relatively sustained impact, which tends to be stable after the fifth period. It means that technological progress has a more lasting impact on the energy structure in terms of the development scale of the industry itself.
Correspondingly, the three subgraphs of second row treat gSIZE as impulse variable. The response of gTECH to gSIZE is negative in the first period, and then changes from negative to positive after the second period, illustrating that size effect firstly drags down the technology effect. Namely, the new energy industry initially focuses on the development of the scale effect, which may squeeze the resources required for industrial technological progress. However, the response of gEC to gSIZE is negative all along, indicating the development of industrial scale can always improve the energy structure.
The three subgraphs of the third row take gEC as the impulse variable. The response results of gTECH and gSIZE are negative. It reflects that energy low-carbon transformation leads to the development of technology and size effects. In comparison between the two, the improvement of energy structure continues to stimulate the technology effect until the fifth period, while the response of size effect is more fierce and rapid, but soon levels off.
The result of changing the order of gTECH and gEC is shown in Figure 3, and the conclusion has not changed significantly. It is worth noting that the mutual promotion between size effect and technology effect is very small, but both of them have a positive impact on the low-carbon transformation of the energy structure. It suggests that it is reasonable to divide the evaluation index of industrial development into two factors: size and technology. In addition, technology progress has a more significant effect on the improvement of energy structure, and at the same time energy transition has a more obvious stimulus on the technology effect, which confirms the bidirectional Granger causality between gTECH and gEC.
In general, there is no significant dynamic relationship between the scale and technology effect within the new energy industry, which may be caused by resource competition. Whether it is the market risk faced by expanding the scale or the innovation risk faced by accelerating R&D, enterprises need to rationally allocate the limited resources at the initial stage of development. This reveals that the supporting advantages within the new energy industry chain need to be further discovered. In addition, gSIZE and gTECH have different degrees of response to the energy structure. The new energy industry will benefit from the energy substitution. With the enhancement of carbon constraints and the rise of fossil energy prices, the demand for new energy shows a long-term growth trend. This will bring double benefits to the new energy, which will lead to the expansion of the scale. However, China’s new energy metals are limited, and the profits available in the raw materials sector are small. Relying on a complete industrial system and strengthening innovation in the new energy manufacturing sector is the focus of the future development.
4.4 Variance decomposition
The method of variance decomposition is further adopted to describe the interaction between size effect, technology effect and energy structure through the relative variance contribution rate. That is, the ratio of the movement of the variable caused by the impact of itself and other variables. Likewise, the variance decomposition also de-pends on the order of the variables. To ensure the robustness of results, variance de-composition is carried out still in the order of Energy Structure, Size Effect, Technology Effect and Technology Effect, Size Effect and Energy Structure respectively. As shown in Table 6, there is no substantial difference between the results under the two different orders.
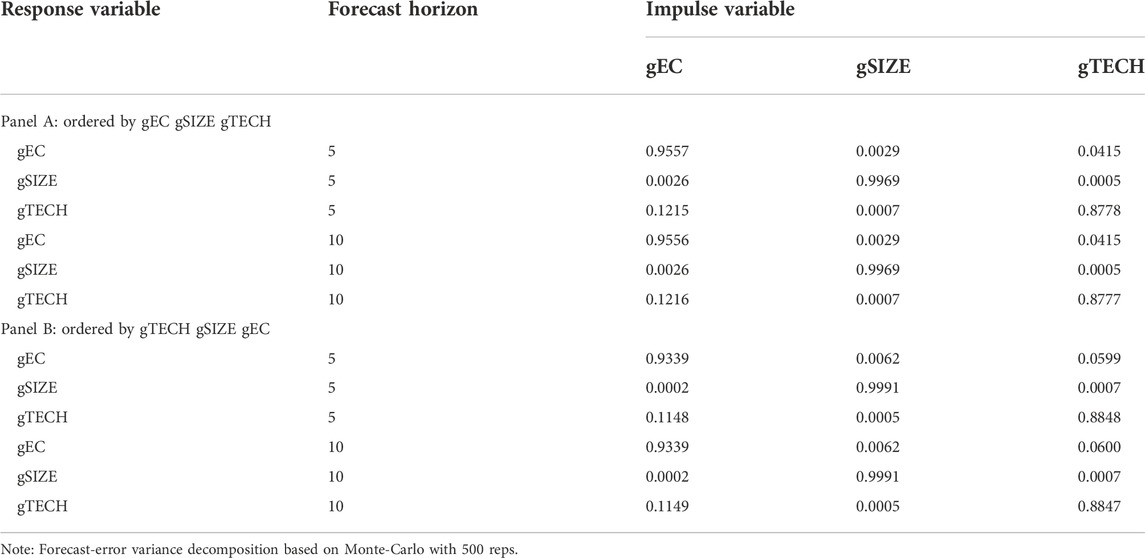
TABLE 6. Variance decomposition.
Table 6 shows no significant difference between the prediction results of the 10th period and the 5th period, indicating that the system has stabilized after the 5th period. The variance decomposition of gEC shows that in addition to the impact from itself, the remaining variance contribution mainly comes from gTECH, and the contribution of gSIZE is relatively small. gSIZE has a response of more than 90% to its previous value, which confirmed the existence of positive self-feedback behavior. The variance de-composition of gTECH shows that the prediction variance from gEC is much larger than that from gSIZE. Therefore, there is a two-way promotion between technology effect and energy structure. During the structure of a clean, low-carbon, safe and efficient modern energy system, energy technology innovation must play a decisive role in the energy revolution and must be placed at the core of energy development. At the same time, among the three variables, the impact reaction of technology effect on itself is the least. It can be predicted that in the long run, technology effect will become a new growth point in the development of the industry. New energy industry, especially the wind power industry, should break the current situation of working fast just for subsidies as soon as possible.
5 Conclusion and implications
Through real option model and stochastic frontier analysis, the development of new energy industry in China is evaluated from both scale and technology in this paper. The results show that the new energy industry in the central region is developing rap-idly, which is better than that in the eastern and western regions. The eastern region has a significant lead in the scale and technology of new energy, but the northeastern region, such as Liaoning Province, shows a backward state in terms of technical efficiency. With the advancement of China’s industrialization process, the secondary industry has gradually deepened in the central region. Industrial development, accompanied by the upgrading of driving forces and rising strength, has accelerated the transition to cleaner energy. Although the western region has abundant new energy resources, the industrial structure still tends to be industrial and agricultural. The weak industrial base leads to the lack of internal driving force of the new energy industry, and the development is relatively flat.
This paper further studies the dynamic relationship between the new industry and energy structure transformation through the PVAR model, impulse response function and variance decomposition. It is found that there exists a bidirectional dynamic relationship between the development of new energy industry and the low-carbon trans-formation of energy structure. The relationship is mainly reflected in the technology effect, while weak in the size effect. The estimation results of PVAR model are sup-ported by Granger causality test. Furthermore, through impulse response function and variance decomposition, it is found that technology effect has a continuous and dramatic positive impact on the improvement of energy structure, while the size effect is relatively short-lived. In turn, energy structure transformation has an impact on the development of new energy industry, as it stimulates the size effect more drastically and rapidly, but has a long-term impact on the technological effect. It reveals the core role of energy technology progress in the construction of clean and low-carbon energy system. At present, developing countries like China are playing an increasingly important role in the international economy. Their economy is in a transitional stage from rough to intensive, from factor-driven to innovation-driven. Energy is an essential material foundation of society. The production and consumption of energy, technological innovation and system reform all need the active guidance of the government, so that the quality and efficiency of an energy system can be steadily improved.
Our research provides some important policy implications. First of all, optimize the layout of the energy industry, so as to achieve multi-regional and multi-energy coordinated development. The results from Figure 1 show that there is a mismatch in industrial development and resource distribution by region in China. In the future strategic layout, the eastern coastal areas will mainly undertake the tasks of new energy industry R&D and high-end manufacturing. The central region undertakes the tasks of core material development and energy transmission. The western region relies on rich natural resources to develop new energy power generation projects. Secondly, the development of new energy industry is not achieved overnight. The results in Figure 2 and Figure 3 show that the impact of the scale expansion of new energy on energy transition is short-term rather than long-term. Therefore, there should be a global development plan to optimize resource allocation and capacity utilization. Finally, it is necessary to consolidate technological advantages and take the initiative in the energy industry chain. It is supposed to expand the technology boundary, and develop the technology effect to become a new growth point in the process of industrial development.
We have to admit that our research still has some other limitations, which provides opportunities for future research. Due to data availability and model requirements, this paper only considers listed new energy enterprises as samples. In fact, as an emerging industry, some unlisted new energy enterprises are also an important part of the industrial development. However, the evaluation of their market value is a difficult problem, which is also needed to be solved in the application of real option model to scale measurement in the future. In addition, in order to enrich the applicability and generalizability of our conclusions, future research should be further extended to other regions or time spans to verify the findings.
Data availability statement
The original contributions presented in the study are included in the article/Supplementary Material, further inquiries can be directed to the corresponding authors.
Author contributions
Conceptualization, XB and PC; data curation, XB and GF; formal analysis, PC; investigation, XB; methodology, XB, ZG, and PC; resources, PC and GF.; software, XB, GF, and PC; validation, XB and PC; visualization, XB and PC; writing—original draft, XB, ZG, and PC; writing—review and editing, XB, PC, ZG, and GF. All authors have read and agreed to the published version of the manuscript.
Funding
The research is supported by the National Natural Science Foundation of China (No. 72274092; 71774077), Special Science and Technology Innovation Program for Carbon Peak and Carbon Neutralization of Jiangsu Province (Grant Nos. BE2022612-4 and BE2022610).
Conflict of interest
The authors declare that the research was conducted in the absence of any commercial or financial relationships that could be construed as a potential conflict of interest.
Publisher’s note
All claims expressed in this article are solely those of the authors and do not necessarily represent those of their affiliated organizations, or those of the publisher, the editors and the reviewers. Any product that may be evaluated in this article, or claim that may be made by its manufacturer, is not guaranteed or endorsed by the publisher.
Supplementary material
The Supplementary Material for this article can be found online at: https://www.frontiersin.org/articles/10.3389/fenrg.2022.1082368/full#supplementary-material
Footnotes
1National Bureau of Statistics, 2018, http://www.stats.gov.cn/tjgz/tzgb/201811/t20181126_1635848.html.
2The 19 provinces, municipalities and autonomous regions are: Shanghai, Inner Mongolia, Beijing, Jilin, Sichuan, Tianjin, Anhui, Shandong, Shanxi, Guangdong, Xinjiang, Jiangsu, Hebei, Henan, Zhejiang, Hubei, Fujian, Liaoning, and Chongqing.
References
Apergis, N., and Payne, J. E. (2010). Renewable energy consumption and economic growth: Evidence from a panel of OECD countries. Energy Policy 38, 656–660. doi:10.1016/j.enpol.2009.09.002
Arellano, M., and Bover, O. (1995). Another look at the instrumental variable estimation of error-components models. J. Econ. 68, 29–51. doi:10.1016/0304-4076(94)01642-D
Bhattacharya, M., Paramati, S. R., Ozturk, I., and Bhattacharya, S. (2016). The effect of renewable energy consumption on economic growth: Evidence from top 38 countries. Appl. Energy 162, 733–741. doi:10.1016/j.apenergy.2015.10.104
Black, F., and Scholes, M. (1973). The pricing of options and corporate liabilities. J. Polit. Econ. 81, 3–21. doi:10.1142/9789814759588_0001
Brown, M. A. (2001). Market failures and barriers as a basis for clean energy policies. Energy Policy 29, 1197–1207. doi:10.1016/S0301-4215(01)00067-2
Cardell, J. B., and Anderson, C. L. (2015). Targeting existing power plants: EPA emission reduction with wind and demand response. Energy Policy 80, 11–23. doi:10.1016/j.enpol.2015.01.021
Castellini, M., Menoncin, F., Moretto, M., and Vergalli, S. (2021). Photovoltaic smart grids in the prosumers investment decisions: A real option model. J. Econ. Dyn. Control 126, 103988. doi:10.1016/j.jedc.2020.103988
Choi, I. (2001). Unit root tests for panel data. J. Int. Money Finance 20, 249–272. doi:10.1016/S0261-5606(00)00048-6
Dogan, E., and Seker, F. (2016). Determinants of CO2 emissions in the European Union: The role of renewable and non-renewable energy. Renew. Energy 94, 429–439. doi:10.1016/j.renene.2016.03.078
Fan, J. L., Wang, J. X., Hu, J. W., Wang, Y., and Zhang, X. (2019). Optimization of China’s provincial renewable energy installation plan for the 13th five-year plan based on renewable portfolio standards. Appl. Energy 254, 113757. doi:10.1016/j.apenergy.2019.113757
Fang, G., Lu, L., Tian, L., He, Y., and Bai, Y. (2020a). Can China achieve the energy-saving and emission reducing objectives during the “13th five-year-plan”? — a systematic evolutionary analysis. J. Clean. Prod. 262, 121256. doi:10.1016/j.jclepro.2020.121256
Fang, G., Lu, L., Tian, L., He, Y., and Yin, H. (2020b). Research on the influence mechanism of carbon trading on new energy—a case study of ESER system for China. Phys. A Stat. Mech. its Appl. 545, 123572. doi:10.1016/j.physa.2019.123572
Fang, G., Wang, L., Gao, Z., Chen, J., and Tian, L. (2022). How to advance China’s carbon emission peak?— a comparative analysis of energy transition in China and the USA. Environ. Sci. Pollut. Res. 29, 71487–71501. doi:10.1007/s11356-022-20958-9
Gaete-Morales, C., Gallego-Schmid, A., Stamford, L., and Azapagic, A. (2018). Assessing the environmental sustainability of electricity generation in Chile. Sci. Total Environ. 636, 1155–1170. doi:10.1016/j.scitotenv.2018.04.346
Gao, C., Sun, M., Shen, B., Li, R., and Tian, L. (2014). Optimization of China’s energy structure based on portfolio theory. Energy 77, 890–897. doi:10.1016/j.energy.2014.09.075
Gerbaulet, C., von Hirschhausen, C., Kemfert, C., Lorenz, C., and Oei, P.-Y. (2019). European electricity sector decarbonization under different levels of foresight. Renew. Energy 141, 973–987. doi:10.1016/j.renene.2019.02.099
Grimaud, A., and Rouge, L. (2008). Environment, directed technical change and economic policy. Environ. Resour. Econ. 41, 439–463. doi:10.1007/s10640-008-9201-4
Guo, Z., Zhang, X., Feng, S., and Zhang, H. (2020). The impacts of reducing renewable energy subsidies on China’s energy transition by using a hybrid dynamic computable general equilibrium model. Front. Energy Res. 8. doi:10.3389/fenrg.2020.00025
Han, Y., Liu, Y., and Liu, X. (2022). Decoupling Re-analysis of CO2 emissions and economic growth from two dimensions. Front. Energy Res. 10. doi:10.3389/fenrg.2022.896529
Holtz-Eakin, D., Newey, W., and Rosen, H. S. (1988). Estimating vector autoregressions with panel data. Econometrica 56, 1371–1395. doi:10.2307/1913103
Kang, J., Yu, C., Xue, R., Yang, D., and Shan, Y. (2022). Can regional integration narrow city-level energy efficiency gap in China? Energy Policy 163, 112820. doi:10.1016/j.enpol.2022.112820
Lee, S.-C., and Shih, L.-H. (2010). Renewable energy policy evaluation using real option model — the case of Taiwan. Energy Econ. 32, S67–S78. doi:10.1016/j.eneco.2010.04.010
Li, K., and Lin, B. (2016). Impact of energy technology patents in China: Evidence from a panel cointegration and error correction model. Energy Policy 89, 214–223. doi:10.1016/j.enpol.2015.11.034
Li, X., Zhang, Y., Fan, X., and Yin, J. (2021). Impact of substitution rate on energy consumption structure: A dynamical system Approach. Arab. J. Sci. Eng. 46, 1603–1615. doi:10.1007/s13369-020-04694-1
Liu, G., Kong, Z., Dong, J., Dong, X., Jiang, Q., Wang, K., et al. (2021). Influencing factors, energy consumption, and carbon emission of central heating in China: A supply chain perspective. Front. Energy Res. 9. doi:10.3389/fenrg.2021.648857
Marques, A. C., and Fuinhas, J. A. (2012). Is renewable energy effective in promoting growth? Energy Policy 46, 434–442. doi:10.1016/j.enpol.2012.04.006
Menegaki, A. N. (2011). Growth and renewable energy in europe: A random effect model with evidence for neutrality hypothesis. Energy Econ. 33, 257–263. doi:10.1016/j.eneco.2010.10.004
Ocal, O., and Aslan, A. (2013). Renewable energy consumption–economic growth nexus in Turkey. Renew. Sustain. Energy Rev. 28, 494–499. doi:10.1016/j.rser.2013.08.036
Ohler, A., and Fetters, I. (2014). The causal relationship between renewable electricity generation and gdp growth: A study of energy sources. Energy Econ. 43, 125–139. doi:10.1016/j.eneco.2014.02.009
Ouyang, Y., and Li, P. (2018). On the nexus of financial development, economic growth, and energy consumption in China: New perspective from a GMM panel VAR approach. Energy Econ. 71, 238–252. doi:10.1016/j.eneco.2018.02.015
Paramati, S. R., Apergis, N., and Ummalla, M. (2018). Dynamics of renewable energy consumption and economic activities across the agriculture, industry, and service sectors: Evidence in the perspective of sustainable development. Environ. Sci. Pollut. Res. 25, 1375–1387. doi:10.1007/s11356-017-0552-7
Ren, X., Dou, Y., Dong, K., and Li, Y. (2022a). Information spillover and market connectedness: Multi-scale quantile-on-quantile analysis of the crude oil and carbon markets. Appl. Econ. 54, 4465–4485. doi:10.1080/00036846.2022.2030855
Ren, X., liu, Z., Jin, C., and Lin, R. (2023). Oil price uncertainty and enterprise total factor productivity: Evidence from China. Int. Rev. Econ. Finance 83, 201–218. doi:10.1016/j.iref.2022.08.024
Ren, X., Zhang, X., Yan, C., and Gozgor, G. (2022b). Climate policy uncertainty and firm-level total factor productivity: Evidence from China. Energy Econ. 113, 106209. doi:10.1016/j.eneco.2022.106209
Sadorsky, P. (2009). Renewable energy consumption and income in emerging economies. Energy Policy 37, 4021–4028. doi:10.1016/j.enpol.2009.05.003
Shahbaz, M., Raghutla, C., Chittedi, K. R., Jiao, Z., and Vo, X. V. (2020). The effect of renewable energy consumption on economic growth: Evidence from the renewable energy country attractive index. Energy 207, 118162. doi:10.1016/j.energy.2020.118162
Shen, J., and Luo, C. (2015). Overall review of renewable energy subsidy policies in China – contradictions of intentions and effects. Renew. Sustain. Energy Rev. 41, 1478–1488. doi:10.1016/j.rser.2014.09.007
Shi, L., Guan, X., Gao, K., Pang, L., Liu, Y., and Xu, Z. (2022). Key technologies of rural integrated energy system with renewable energy as the main body. Front. Energy Res. 10. doi:10.3389/fenrg.2022.979599
Shindell, D., and Smith, C. J. (2019). Climate and air-quality benefits of a realistic phase-out of fossil fuels. Nature 573, 408–411. doi:10.1038/s41586-019-1554-z
Sun, J., Li, G., and Wang, Z. (2018). Optimizing China’s energy consumption structure under energy and carbon constraints. Struct. Change Econ. Dyn. 47, 57–72. doi:10.1016/j.strueco.2018.07.007
Tian, J., Yu, L., Xue, R., Zhuang, S., and Shan, Y. (2022). Global low-carbon energy transition in the post-COVID-19 era. Appl. Energy 307, 118205. doi:10.1016/j.apenergy.2021.118205
van Soest, D. P., and Bulte, E. H. (2001). Does the energy-efficiency paradox exist? Technological progress and uncertainty. Environ. Resour. Econ. 18, 101–112. doi:10.1023/A:1011112406964
Verbong, G., and Geels, F. (2007). The ongoing energy transition: Lessons from a socio-technical, multi-level analysis of the Dutch electricity system (1960–2004). Energy Policy 35, 1025–1037. doi:10.1016/j.enpol.2006.02.010
Vishnupriyan, J., and Manoharan, P. S. (2017). Demand side management approach to rural electrification of different climate zones in Indian state of Tamil Nadu. Energy 138, 799–815. doi:10.1016/j.energy.2017.07.140
Wang, X., Li, J., and Ren, X. (2022). Asymmetric causality of economic policy uncertainty and oil volatility index on time-varying nexus of the clean energy, carbon and green bond. Int. Rev. Financial Analysis 83, 102306. doi:10.1016/j.irfa.2022.102306
Wang, Z., Ahmed, Z., Zhang, B., and Wang, B. (2019). The nexus between urbanization, road infrastructure, and transport energy demand: Empirical evidence from Pakistan. Environ. Sci. Pollut. Res. 26, 34884–34895. doi:10.1007/s11356-019-06542-8
Wei, C., Löschel, A., and Managi, S. (2020). Recent advances in energy demand research in China. China Econ. Rev. 63, 101517. doi:10.1016/j.chieco.2020.101517
Wen, F., Tong, X., and Ren, X. (2022). Gold or Bitcoin, which is the safe haven during the COVID-19 pandemic? Int. Rev. Financial Analysis 81, 102121. doi:10.1016/j.irfa.2022.102121
Xing, J., Leard, B., and Li, S. (2021). What does an electric vehicle replace? J. Environ. Econ. Manag. 107, 102432. doi:10.1016/j.jeem.2021.102432
Xue, F., Feng, X., and Liu, J. (2021). Influencing factors of new energy development in China: Based on ARDL cointegration and granger causality analysis. Front. Energy Res. 9. doi:10.3389/fenrg.2021.718565
Yang, M., Yuan, Y., and Sun, C. (2021). The economic impacts of China’s differential electricity pricing policy: Evidence from energy-intensive firms in Hunan Province. Energy Econ. 94, 105088. doi:10.1016/j.eneco.2020.105088
Yang, Z., and Tang, M. (2019). Welfare analysis of government subsidy programs for fuel-efficient vehicles and new energy vehicles in China. Environ. Resour. Econ. 74, 911–937. doi:10.1007/s10640-019-00353-8
Ye, F., Paulson, N., and Khanna, M. (2022). Are renewable energy policies effective to promote technological change? The role of induced technological risk. J. Environ. Econ. Manag. 114, 102665. doi:10.1016/j.jeem.2022.102665
Zeng, M., Zheng, L., Huang, Z., Cheng, X., and Zeng, H. (2023). Does vertical supervision promote regional green transformation? Evidence from central environmental protection inspection. J. Environ. Manag. 326, 116681. doi:10.1016/j.jenvman.2022.116681
Zhang, Y.-J., Liu, J.-Y., and Su, B. (2020). Carbon congestion effects in China’s industry: Evidence from provincial and sectoral levels. Energy Econ. 86, 104635. doi:10.1016/j.eneco.2019.104635
Zhao, N., and You, F. (2020). Can renewable generation, energy storage and energy efficient technologies enable carbon neutral energy transition? Appl. Energy 279, 115889. doi:10.1016/j.apenergy.2020.115889
Zhao, P., Lu, Z., Fang, J., Paramati, S. R., and Jiang, K. (2020). Determinants of renewable and non-renewable energy demand in China. Struct. Change Econ. Dyn. 54, 202–209. doi:10.1016/j.strueco.2020.05.002
Zoundi, Z. (2017). CO2 emissions, renewable energy and the Environmental Kuznets Curve, a panel cointegration approach. Renew. Sustain. Energy Rev. 72, 1067–1075. doi:10.1016/j.rser.2016.10.018
Keywords: new energy, energy transition, real option, stochastic frontier analysis, PVAR model
Citation: Bian X, Chen P, Gao Z and Fang G (2023) How to promote the energy transition? —An analysis based on the size and technology effect in new energy industry. Front. Energy Res. 10:1082368. doi: 10.3389/fenrg.2022.1082368
Received: 31 October 2022; Accepted: 22 November 2022;
Published: 10 January 2023.
Edited by:
Xiaohang Ren, Central South University, ChinaReviewed by:
Ming Zhang, China University of Mining and Technology, ChinaYang Bai, China University of Petroleum, China
Copyright © 2023 Bian, Chen, Gao and Fang. This is an open-access article distributed under the terms of the Creative Commons Attribution License (CC BY). The use, distribution or reproduction in other forums is permitted, provided the original author(s) and the copyright owner(s) are credited and that the original publication in this journal is cited, in accordance with accepted academic practice. No use, distribution or reproduction is permitted which does not comply with these terms.
*Correspondence: Zhengye Gao, gaozy2020@163.com; Guochang Fang, fgchang79@163.com