 Yultuz Omarbakiyeva
 Larissa Hahn
 Pascal Klein
 Ingrid Krumphals
 Bianca Watzka
- 1Institute of Physics, Otto von Guericke University Magdeburg, Magdeburg, Germany
- 2Physics Education Research, Faculty of Physics, University of Göttingen, Göttingen, Germany
- 3University College of Teacher Education Styria, Graz, Austria
- 4Didactics of Physics and Technics, RWTH Aachen University, Aachen, Germany
Introduction: This paper is concerned with investigating the cognitive demands of solving force diagram tasks in different scenarios, specifically in the wind context.
Methods: In this study, students were trained using worked examples and then completed tasks in two different scenarios while their eye movements were monitored with eye-tracking technology. After completing the tasks, cognitive load was assessed to evaluate the impact of task complexity on cognitive processing. Eye-tracking metrics were analyzed in detail to identify gaze strategies, differences and similarities.
Results: It was found that a three-force scenario (surface wind formation) induced a higher intrinsic cognitive load than a two-force scenario, which is not only theoretically justified by cognitive load theory, but also confirmed by eye-tracking metrics. Although correlation analyses show no significant relationship between the ability to mentally rotate and learning success, the role of mental rotation in problem solving is highlighted by eye-tracking data.
Discussion: Our results contribute to a better understanding of the learning and problem-solving mechanisms involved in wind direction determination and offer possible implications for the design of more effective teaching and learning methods in this area.
1 Introduction
The context of wind is an interdisciplinary area that can stimulate students' interest in physical principles through meteorological phenomena. By the compound term “context of wind” we mean the description of air movement and its causes from a physical perspective. Physically, wind can be described as a vector, which gives rise to both a direction, i.e., the wind direction, and a magnitude, namely the wind speed. The causes of air movement respectively wind can be described using Newton's force approach (Watzka et al., 2025). The inclusion of wind in physics teaching can have a number of benefits: First, it allows the application of Newton's first axiom to a everyday life context. This gives students the opportunity to apply the basic principles of physics to real meteorological phenomena and to develop a deeper understanding of the Newton's first axiom as well as the dynamics of air parcel (Ahrens and Henson, 2016). Another benefit of including wind in physics lessons is that students can apply and deepen their knowledge of free body diagrams in a real-world context (Sutaphan and Yuenyong, 2019). This allows students to improve their ability to analyze forces and their effects in the real world. In addition, the use of the context wind in the classroom provides a clear explanation of the complex concept of the Coriolis force, which is often difficult for students to grasp. By using examples related to wind, students can better understand and appreciate how the Coriolis force works. Various research studies (Küchemann et al., 2020; Glessmer and De Wet, 2018; Arnell, 2022) have shown that students have difficulty understanding the non-inertial frame of reference, including the Coriolis force. However, by specifically integrating wind topics into physics lessons, these concepts can be made more accessible and students' understanding can be improved. Wind topics connect to various subjects, such as meteorology, geography, environmental science, and engineering. By integrating wind concepts, students can see how different disciplines intersect, encouraging a more holistic understanding of science. Understanding wind dynamics requires applying concepts such as vector analysis, forces (including standard topic like free body diagram), and energy transfer.This helps students develop critical thinking and problem-solving skills as they work to understand complex systems (Löffler et al., 2018; Eshetu and Assefa, 2019; Pozas et al., 2020). Free body diagrams, which are a standard topic in physics education, are not only relevant in the context of wind but also in numerous everyday scenarios. One such example is dogs pulling a sledge (see on the left of Figure 1). Figure 1 demonstrates how an everyday life example can be represented in an abstract manner. Although the everyday scene, such as dogs pulling a sledge, provides a useful point of reference and helps to anchor the concept in a familiar context, the transition to an abstract image, like a force diagram, can often prove too challenging for students, increasing their cognitive load. It is therefore essential to investigate the impact of cognitive load when force diagrams are employed to solve physics problems (Girwidz and Kohnle, 2021). Abstract, logical representations play an important role in physics (Opfermann et al., 2021). Among other things, they serve to describe physical principles in a universally valid way. Such abstract, logical representations, like force diagrams, also have a constructive function. This means that physical principles can be directly applied within the representation. For example, resulting forces can be determined.
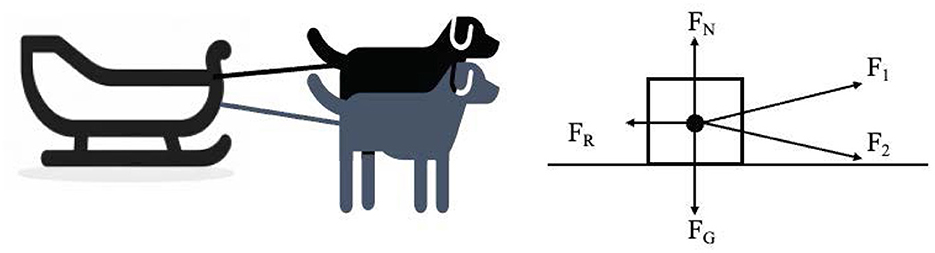
Figure 1. Left: Two dogs pulling a sled—a scene from everyday life. Right: Abstract representation of the forces acting on the sled: FN is the normal force, FG is the gravitational force, FR is the frictional force, F1 and F2 are pulling forces.
By investigating the cognitive load associated with solving tasks in both wind and non-wind contexts, insights can be gained into effective instructional strategies to help learners navigate force diagrams more effectively in different domains. Cognitive Load Theory (CLT) is concerned with the load on cognitive systems during knowledge acquisition and assumes a limited working memory capacity (Sweller, 1988; Sweller et al., 1998). Exceeding this capacity can lead to cognitive overload, which affects the learning process. There are three factor models including intrinsic load, extraneous load and germane load (Sweller et al., 1998). Intrinsic Cognitive Load (ICL) is the natural load associated with the complexity of the learning material itself. Extraneous Cognitive Load (ECL) refers to unnecessary cognitive demands that are not directly related to the actual learning process. Germane Cognitive Load (GCL) is viewed positively as it indicates the cognitive effort required for deeper understanding and integration of new concepts.
Wind is the horizontal movement of air masses in the atmosphere resulting from the pressure difference. Common pressure areas like high (H)- and low (L)-pressure zones frequently are found on isobaric maps (see left of the Figure 2). Isobaric lines on these maps connect points with equal pressure. To simplify the explanation of wind formation, we introduce the model of an “air parcel,” an abstract representation of air. The air parcel model is based on various assumptions (Watzka et al., 2025).
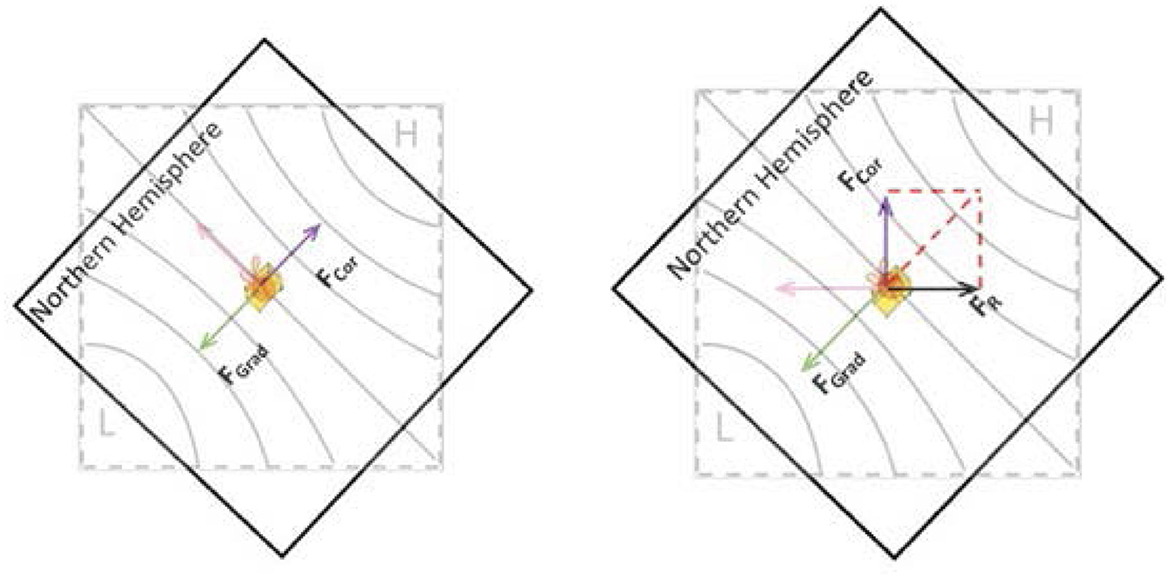
Figure 2. Left: The free body diagram for the air parcel at altitude shows the pressure gradient force in green, the Coriolis force in purple and the direction of motion of the air parcel with a pink arrow. Right: The free body diagram for the air parcel at the surface shows, in addition to the pressure gradient force and the Coriolis force, also the friction force in black. Adapted from Rubitzko et al. (2021).
When an air parcel is placed on an isobaric map for example at the altitude (above 1,000 m), it travels along the pressure gradient, moving from areas of higher pressure to lower pressure. This movement is driven by the pressure gradient force (FGrad), which accelerates the air parcel from high to low pressure zones. Additionally, the Coriolis force (FCor), a result of the Earth's rotation, influences the air parcel. This force deflects the air parcel to the right in the Northern Hemisphere and to the left in the Southern Hemisphere. Consequently, influenced by both forces, the air parcel moves in a direction balancing the pressure gradient and Coriolis forces. When these forces reach equilibrium, the air parcel moves at a constant speed.
The surface wind should be considered separately (see right of the Figure 2). Here, in addition to the pressure gradient and the Coriolis force, the friction of the air on the earth's surface plays a role. Friction always slows down the air parcel. The direction of the surface wind is determined by the balance between the pressure gradient force, the Coriolis force and the friction force (FR). Therefore, the surface wind does not run directly along the isobars, but deviates from this direction due to the frictional and Coriolis forces.
It is useful to analyze how the cognitive load differs during the solution of tasks for the altitude and surface wind, because in a natural way a different complexity is given and this must have an effect on the cognitive load.This would be transferable to many other examples from physics. The different influences of the forces on wind formation two scenarios can affect the cognitive load of the participants and allow a differentiated analysis. By analyzing the cognitive load of solving the two- and three-force diagrams separately, specific challenges can be identified and better understood. Since force additions are graphically represented through force diagrams, and users can apply various strategies when solving force additions using these diagrams, it is useful to investigate the approaches through eye-tracking.
Several reviews have been written on the use of eye tracking in various educational settings (Gegenfurtner et al., 2011; Lai et al., 2013; Alemdag and Cagiltay, 2018; Hahn and Klein, 2022). These reviews provide a comprehensive insight into the use of eye-tracking technology in various educational contexts. Eye-tracking studies in physics education often analyze students' visual attention (Watzka et al., 2021; Hoyer and Girwidz, 2020), problem-solving strategies (Kekule, 2017; Klein et al., 2019; Susac et al., 2019; Klein et al., 2021; Becker et al., 2022, 2023) and cognitive load (Hurzlmeier et al., 2021; Hahn and Klein, 2023). The Force Concept Inventory (FCI) is frequently used in physics education to assess understanding of basic physics concepts, particularly those related to forces. In addition, the FCI has been used in several studies with eye-tracking technology (Kekule and Viiri, 2018; Han et al., 2017; Rosiek et al., 2017). Kekule and Viiri focused on the understanding of Newton's concept of force and investigated students' attention distribution when learning physics using eye-tracking. The results show that students who were able to solve the R-FCI tasks correctly found the correct solution very quickly in both verbal and graphical representations. The students who did not solve the tasks correctly did not show a consistent strategy, except that they paid the least attention to the correct answer. Another relevant study from Han et al. (2017) investigated students' visual attention when completing the FCI test, which was administered by computerized assessment. In particular, it examined how students' understanding of physical concepts affected their processing time and performance. The main findings of the study were that students spent the most time looking at the pictures for all questions in the FCI test, followed by looking at the correct answer option. Students were also found to have longer fixations when reading high difficulty questions than when answering low difficulty questions. The results suggest that a higher cognitive effort is required when a student is engaged in reasoning about common physics concepts. Eye-tracking has also been used in the context of weather (Canham and Hegarty, 2010). However, the focus of Hegarty's study was on how the graphical presentation of information affects the understanding of weather maps and how this understanding can be improved through knowledge of relevant meteorological principles. In the study, forces such as the pressure gradient force and the Coriolis force were taught during the training, however, these forces were not explicitly considered during the eye-tracking measurement.
For problem solving using the free body diagram in the wind context, having strong mental rotation skills may be important. The concept of mental rotation (mR) refers to the cognitive ability to rotate mental representations of objects in space without performing physical movements. We take it into account because high and low-pressure systems can appear in different locations, and thus are positioned differently on isobaric maps. As a result, the force diagrams need to be aligned according to the location of the high and low-pressure systems. Therefore, they must be rotated depending on the situation. The concept of mental rotation was first introduced by Shepard and Metzler (1971). There are numerous studies that have shown that involving mental rotation can have a positive impact on learning outcomes (Cheung et al., 2020; Stieff, 2007; Kozhevnikov et al., 2007). For example, a study by Kozhevnikov et al. (2007) investigated the relationship between spatial ability and kinematic task solving. The results of the study showed that most students with low spatial ability were unable to combine two motion vectors, change the reference system, and interpret diagrams literally, in contrast to students with high spatial ability. As our study also involved working with vectors to solve the task and because the force diagram must always be rotated depending on the positions of high and low-pressure systems, we measured mental rotation ability as a control variable.
Although there have been many eye-tracking studies of the force concept, particularly using the FCI, and Hegarty's study focuses specifically on the graphical presentation of weather information, there has been no specific investigation of the relationship between cognitive load and problem-solving using free body diagrams in the context of wind direction, despite the fact that force diagrams are firmly established in school curricula and frequently applied in everyday life. By filling this gap, the study contributes to a more comprehensive understanding of the application of physics in real-world scenarios. Understanding how individuals process this information could lead to better learning materials that improve practical problem-solving skills in these common situations. This could lead to the development of better instructional strategies that align with cognitive load theory. The strength of the wind context is that we find an authentic situation within the same context, where the force diagram for upper-level wind is naturally less complex than for surface wind. As mentioned earlier, the free body diagram for the surface wind becomes more complex due to the frictional force compared to that for altitude wind. Specifically, we want to investigate whether the inclusion of an additional force in the free body diagram results in an increased cognitive load. We intend to test our hypotheses through a quantitative analysis of eye movement data and a cognitive load questionnaire. In our study we will investigate the following research questions:
RQ1: What is the relationship between cognitive load and learning success in solving physics problems using the free body diagram in the context of wind (altitude and surface wind)?
This question is both meaningful and important as it explores the relationship between cognitive load and learning outcomes in a real-life context that challenges students' abstract thinking skills. The use of free body diagrams is inherently abstract, which can increase cognitive load. The wind context (high altitude and surface wind) provides a unique opportunity to analyze how different conditions affect cognitive load. Investigating cognitive load in relation to free body diagrams within the context of wind direction could help educators understand how students process complex information. Reducing cognitive overload could enhance learning and retention, leading to better performance in physics and meteorology-related problem-solving tasks. The use of free body diagrams is inherently abstract, which can increase cognitive load. The wind context (high altitude and surface wind) provides a unique opportunity to analyze how different conditions affect cognitive load.
RQ2: To what extent does the level of cognitive load explain the differences in learning success by applying the free body diagram in the context of wind (altitude and surface wind scenarios)?
RQ3: What strategies do students use to solve the free body diagram problems?
Since the aim of Research Question 3 is to explore the different strategies students use when solving free body diagram problems, this will be approached through an exploratory analysis. Therefore, no specific hypothesis will be formulated at this stage.
H1: There is a statistically significant correlation between the perceived cognitive load and the recall knowledge of learners when solving physics problems using free body diagrams in the context of wind, encompassing both altitude and surface winds. Similar studies on physics content have also shown such correlations (Ertl et al., 2020).
H2: The higher the intrinsic and extraneous cognitive load and the lower the germane cognitive load, the lower the learning success when applying the force diagram in the context of altitude wind (2 forces) or surface wind (3 forces).
2 Methods
2.1 Sample
The sample consists of 20 voluntary participants, 4 female and 16 males. Of these participants, 10 are enrolled in the master's program for physics education (M = 26.3, SD = 7.04), while the remaining 10 are enrolled in a certificate course for career changers (M = 37.4, SD = 4.93), who are already teaching physics in school. All participants were in their second term, representing the entire cohort for that year.
2.2 Procedure
Our study began with a demographic survey of the participants and a mental rotation test (used as a control variable), followed by a training unit featuring two worked examples on applying two-force and three-force diagrams in the context of wind (see Supplementary material). Participants then completed both an recall test (see Figure 3) and a transfer test. During the training and testing phases, eye-tracking technology was used to record participants' gaze patterns. The study did not ask about prior knowledge of forces and force diagrams, as this material is usually covered in secondary school. It was expected that the subjects who were completing their Masters in Teaching for Secondary Schools, as well as career changers who were already teaching physics in schools, would have this knowledge.
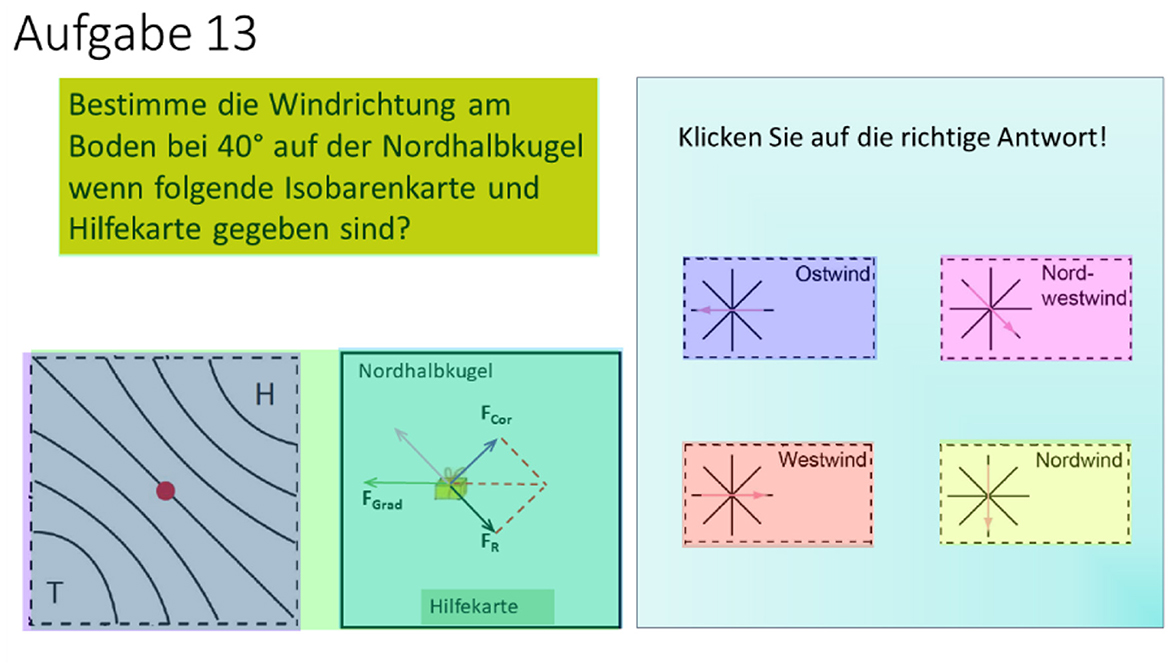
Figure 3. Example item with AOIs “Assignment”, “isobar map”, “help card” and four answer options. The eights AOI contains both isobar and help card. In the “help card”, the free body diagram is presented, which is mentally rotated in order to solve the problem. Item title is “Task 13” (Aufgabe 13), the assignment text is “Determine the surface wind direction at 40° in the northern hemisphere if the following isobar map and help map are given?” The help card is shown in English in Figure 2. The answer area: “Click on the correct answer!, east wind, northwest wind, west wind, north wind”.
2.3 Demographic survey
The demographic survey includes five items: gender, age, field of study, second subject, and current semester in the program.
2.4 Mental rotation
The Card Rotation Test (CRT) by Ekstrom et al. (1976) was used to test mental rotation ability (Cronbach's α = 0.96, N = 20). The test consisted of 10 tasks with a total of 80 items. Participants had 3 minutes to answer as many items correctly as possible.
2.5 Training unit
Before carrying out the wind direction tests, the participants were given special training. This training consisted of a presentation with a total of 10 slides (see Supplementary material), which provided an introduction to the topic of wind formation at altitude and at surface. The presentation included two “worked examples” which served as practical examples for the participants to apply the concept. The use of worked examples enhances learning by promoting deeper understanding and active engagement with the material through targeted instruction and structured transitions from the example stage to independent problem solving (Renkl, 2005; Hoogerheide and Roelle, 2020). In addition, two tasks were set for the participants to solve independently to deepen their understanding and encourage the application of what they had learned. This specific training method was used to ensure that the participants developed a basic understanding of the topic and were able to successfully complete the wind direction determination tasks. During the “worked examples” training, the participants were also monitored using eye-tracking.
2.6 Cognitive Load Test
In order to analyze the influences on cognitive load, the adapted cognitive load test from Leppink et al. (2014) was applied. This test consists of internal, external and germane components (see Tables 1, 2). The cognitive load test was carried out after the training and the testing phases.
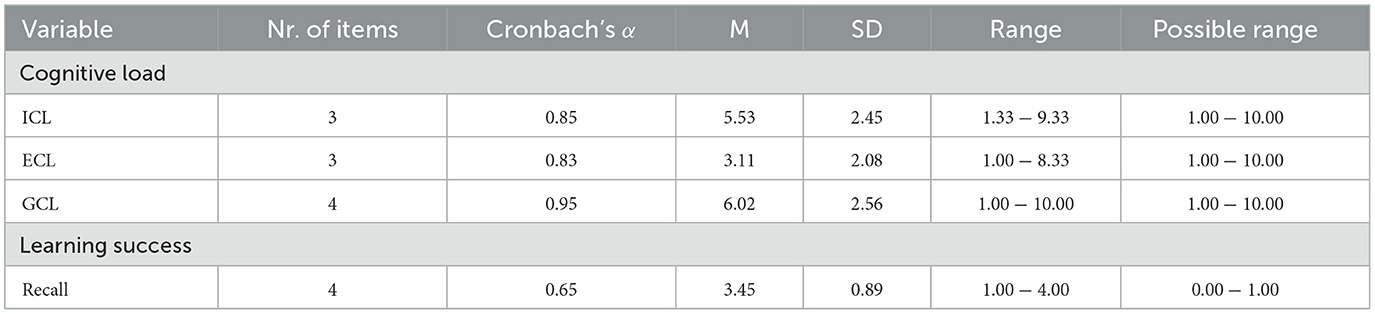
Table 1. Descriptive statistics on cognitive load and learning success for the altitude wind (two forces).
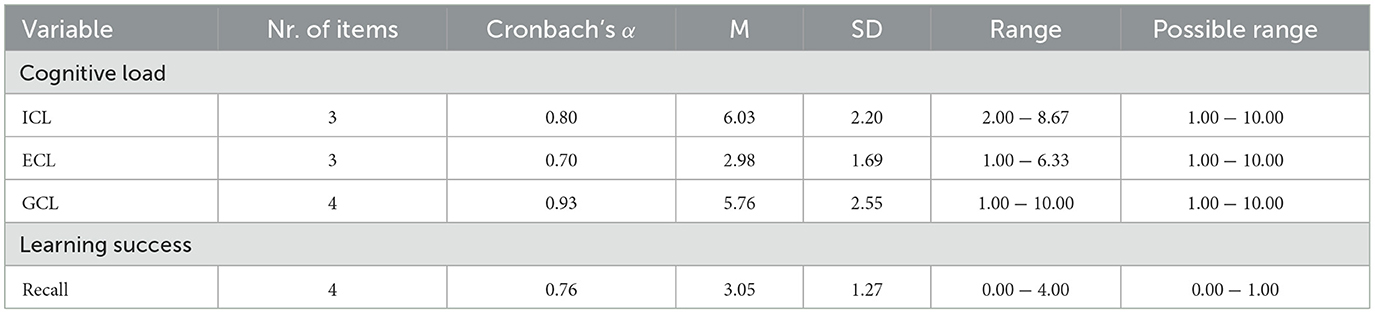
Table 2. Descriptive statistics on cognitive load and learning success for the surface wind (three forces).
2.7 Recall and transfer test
A total of 20 items were used in the knowledge test conducted as part of this study. These items were divided in such a way that 8 of them required the recall of knowledge (Cronbach's α = 0.75) and 12 required the transfer of knowledge (Cronbach's α = 0.98). Of the 8 recall items, four assessed the knowledge of applying the free body diagram in the context of altitude wind, and four assessed the knowledge of applying the free body diagram in the context of surface wind. Our focus in this paper is on recall items only. Each item was designed in a standardized format (see Figure 3): The task was located at the top left, an isobar map and a free body diagram as a help card were shown at the bottom left, and four answer options were listed on the right. The structure of the test and the design of the items were carefully selected to ensure that they adequately capture the participants' ability to recall and transfer knowledge in relation to the topic of the study. The order of the recall tasks alternated, starting with a task for the altitude wind, followed by one for the surface wind.
2.8 Eye-Tracker
In our study, the tasks were presented on a 24−inch screen with a resolution of 1240 × 1028 pixels. The refresh rate of the screen was 120Hz. The Tobii Pro Fusion screen-based eye-tracking system with an accuracy of 0.30 degrees of visual angle in optimal conditions and a sampling frequency of 120Hz was used to record eye movements. Gaze data was captured and AOIs were defined using Tobii Pro Lab software. The standard “Identification by Velocity Threshold” (I-VT) algorithm was used (velocity threshold of 30°/s) (Salvucci and Goldberg, 2000). To ensure accurate calibration of the eye-tracking system, participants were asked to fixate a point on the screen, which was displayed sequentially at five different positions. The experimenter checked the correspondence between the measured eye positions and the actual pixels on the screen. If the result was unsatisfactory, the calibration was repeated. The average calibration accuracy over all participants was 0.36 degrees and average calibration precision was 0.27 RMS (degrees). In our study, a total of 8 Areas of Interest (AOIs) were defined for gaze analysis. An example of an AOI can also be seen in the Figure 3. The size and positioning of the AOIs remained consistent across all tasks, ensuring consistency of gaze analysis across the study.
2.9 Data analysis
A correlation coefficient could be calculated to test whether there is a statistically significant relationship between perceived cognitive load and recall knowledge. For RQ2, a linear regression analysis could be conducted to determine whether the level of cognitive load serves as a significant predictor of the observed differences in recall knowledge. The Spearman's correlation coefficient and stepwise linear Regression were calculated using SPSS version 28. Wilcoxon rang sum test with the Hochberg correction, Sankey diagrams, Levenshtein distance and cluster analysis were performed in Python, using specialized libraries for data processing and statistical calculations. Levenshtein distance is used in eye-tracking studies to analyze and compare gaze patterns (Was et al., 2017; Kosel et al., 2021). The Levenshtein distance is a metric used to measure the difference between two sequences. It quantifies the minimum number of single character edits (insertions, deletions or substitutions) required to transform one sequence into another. By assessing the sequence of AOIs, it can be determined the similarity of visual attention and path tracking between participants. For example, if participant A's sequence of AOIs is “ABC” and participant B's sequence is “ABD”, the Levenshtein distance between these two sequences is 1 because only one substitution (changing “C” to “D”) is needed to make the sequences identical. Following the calculation of Levenshtein distances, K-means clustering analysis was used to identify potential clusters within the data, facilitating the identification of patterns based on similarities in gaze trajectories between participants. K-means is an iterative clustering algorithm that divides data points into K clusters. It aims to minimize the variance within each cluster by iteratively updating the cluster centroids until convergence. Stability of the results was ensured by performing multiple computations using different random states in the K-means algorithm.
3 Results
3.1 Descriptive Statistics
Tables 1, 2 show the descriptive statistics for cognitive load and learning success for altitude and surface wind: the ICL, the ECL and the GCL, and the learning success, measured by recall items. For each variable, the number of items, the mean (M), the standard deviation (SD), the observed range and the possible range are given. For example for the altitude wind, ICL has a mean of 5.53 with a standard deviation of 2.45 and an observed range of 1.33 to 9.33, which is within the possible range of 1.00 to 10.00 and for the surface wind, ICL has a mean value of 6.03, a standard deviation of 2.20 and a value range of 2.00 to 8.67. In Table 1, the learning success for the altitude wind shows a mean value of 3.45 with a low scatter (SD = 0.89), while in Table 2 the learning success for the surface wind shows a slightly lower mean value of 3.05 with a higher scatter (SD = 1.27).
The figure in the Supplementary material shows a scatter diagram with the results of the CRT of 20 participants (Cronbach's α = 0.96). A dashed red line represents the mean value of the CRT values (M = 48.55, SD = 25.66). Participants 4, 8, 10, 11 and 18 in particular have very low CRT values.
3.2 Relationship between cognitive load and learning success (RQ1)
Table 3 shows the bivariate correlations (Spearman's rho) between the learning success and the cognitive load for the altitude wind. The variables in columns (1) to (4) represent respectively the learning success by the score of the recall items (Recall), the ICL, the ECL and the GCL. Significant correlation coefficients are highlighted. There is a significant negative correlation between learning success and intrinsic cognitive load (r = −0.48, p < 0.05) and between learning success and extraneous cognitive load (r = −0.67, p < 0.01). Table 4 shows similar results for the surface wind. There is a significant negative correlation between learning success and intrinsic cognitive load (r = −0.57, p < 0.01) and between learning success and extraneous cognitive load (r = −0.53, p < 0.01). There is no significant correlation between learning success and germane cognitive load for the altitude wind (r = 0.30, p = 0.20) and also for the surface wind (r = 0.32, p = 0.17). The correlation between learning success and the mental rotation was also analyzed. As the results were not significant, they are not presented in this article.
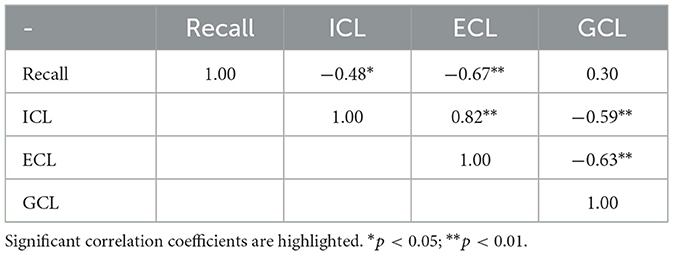
Table 3. Bivariate correlations (Spearman's r) between learning success and cognitive load for the altitude wind (two forces).
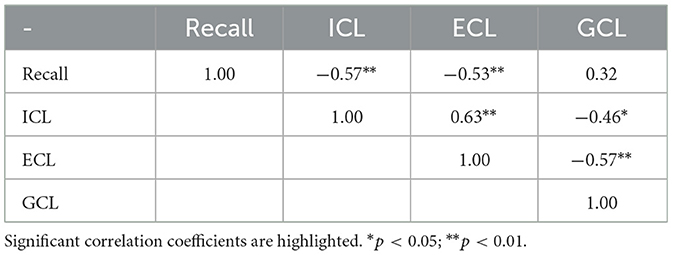
Table 4. Bivariate correlations (Spearman's r) between learning success and cognitive load for the surface wind (three forces).
3.3 Prerequisites (RQ2)
Normality of Residuals: The standardized residuals were assessed through a histogram and a normal P-P plot, which confirmed an approximately normal distribution. Homoscedasticity: A scatterplot of standardized residuals against predicted values showed no systematic patterns, indicating that the assumption of homoscedasticity was met. Independence of Errors: The Durbin-Watson statistic for the final model was 1.56, which falls within the acceptable range (1.5–2.5), confirming no significant autocorrelation of residuals. Multicollinearity: Variance Inflation Factors (VIF) were calculated and found to be below 5 for all predictors, indicating no significant multicollinearity (Field, 2013).
3.4 Regression analysis (RQ2)
Table 5 shows the results of the multiple regression with stepwise method for predicting learning success for altitude wind recall items. As the examples were shown and processed during the instruction, it is assumed that the participants familiarized themselves with the structure of the task. The order of the predictors in the model was chosen as follows: In the first step, only ICL was considered to assess its primary influence. In the second step, ICL and ECL were added to assess the additional explanatory power of ECL. The third step included ICL, ECL and GCL to analyze the additional contribution of GCL to the prediction. The order was chosen based on the theoretical relationship between the variables. ICL is affected first by the introduction of additional force, which in turn increases ECL. Finally, both ICL and ECL can influence GCL. This stepwise approach allows us to examine how these types of cognitive load interact as complexity increases. Since the mental rotation did not correlate with learning success (see RQ1), it was not included as a predictor here either. In step 1, ICL can explain 21% of variance in learning success (B = −0.18, β = −0.51, p = 0.02). In step 2, the R2 increased to 47%. The influence of ICL changed with a B-value of 0.07 and a non-significant p-value of 0.48, indicating a non-significant positive effect. ECL, on the other hand, proved to be a significant negative predictor of learning success with a B-value of −0.38 and p = 0.006. In step 3, with including of GCL into the model, the R2 increased slightly to 0.48, explaining 48% of the variance in learning success. ICL remained non-significant with a B-value of 0.07 and a p-value of 0.51. ECL maintained its strong significant negative influence (B = −0.43, β = −1.00, p = 0.004). GCL showed a slight negative influence on learning success (B = −0.08, β = −0.23), but this was not statistically significant (p = 0.28). Table 6 shows similar analyses for the surface wind. In step 1, only ICL was included in the model, which was a significant predictor of learning success (B = −0.27, p = 0.04), explaining 18% of the variance in learning success (R2 = 0.18). When ECL was added in step 2, neither ICL (B = 0.11, p = 0.45) nor ECL (B = −0.33, p = 0.10) were significant predictors, although the R2 increased to 0.26. With the addition of GCL in step 3, none of the predictors were significant, with ICL (B = −0.11, p = 0.47), ECL (B = −0.36, p = 0.13) and GCL (B = −0.03, p = 0.80) all showing non-significant p-values.
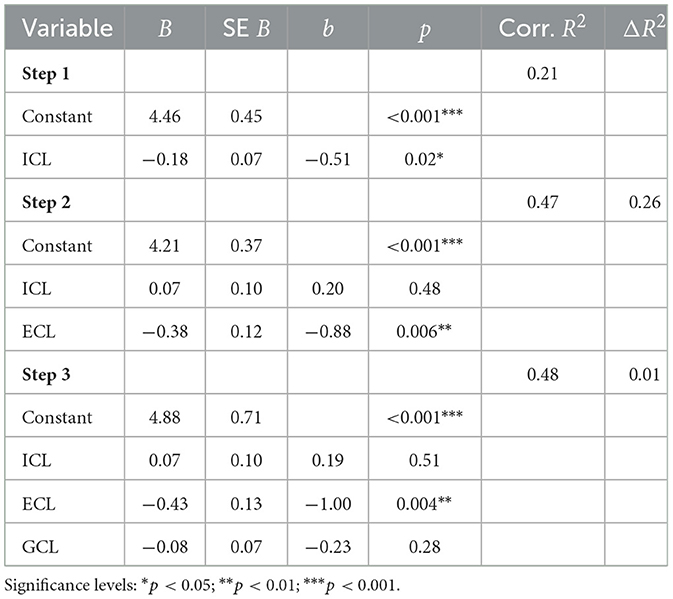
Table 5. Multiple regression with stepwise method to predict learning success (altitude wind).
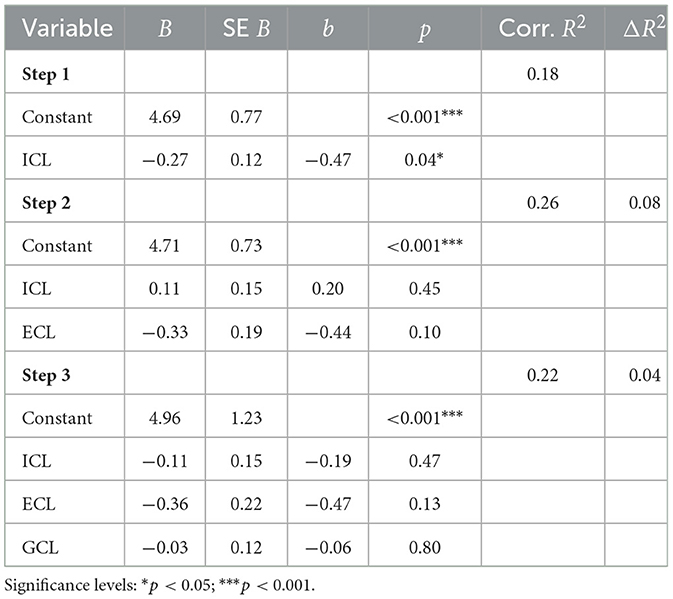
Table 6. Multiple regression with stepwise method to predict learning success (surface wind).
3.5 Eye-tracking analysis (RQ3)
The Sankey diagrams (see Figures 4, 5) illustrate the variety of transitions between the different areas of interest (AOIs) for all participants for both the altitude wind and the surface wind. In the diagrams, the source and destination nodes represent the different AOIs, while the lines in between visualize the transitions between these areas. The width of the lines corresponds to the number of transitions, while the color of the lines reflects the color of the source node. The numbers along the lines represent the respective values of the transitions. For the altitude wind shown in Figure 4, notable transitions include 54 from “Assignment” to “Isobar map”, 209 from “Help card” to “Isobar map” and 182 from “Isobar map” back to “Help card”. In addition, there were 26 transitions from “Correct answer” to “Help card” and 40 transitions from “Incorrect answer” to “Help card”. Looking at Figure 5, we see that the most frequent transitions for the surface wind occur between the same AOIs as for the altitude wind. In particular, there is a higher number of transitions for the surface wind, especially between the “Help card” and the “Isobar map”, with 291 (forward) and 262 (back) transitions respectively.
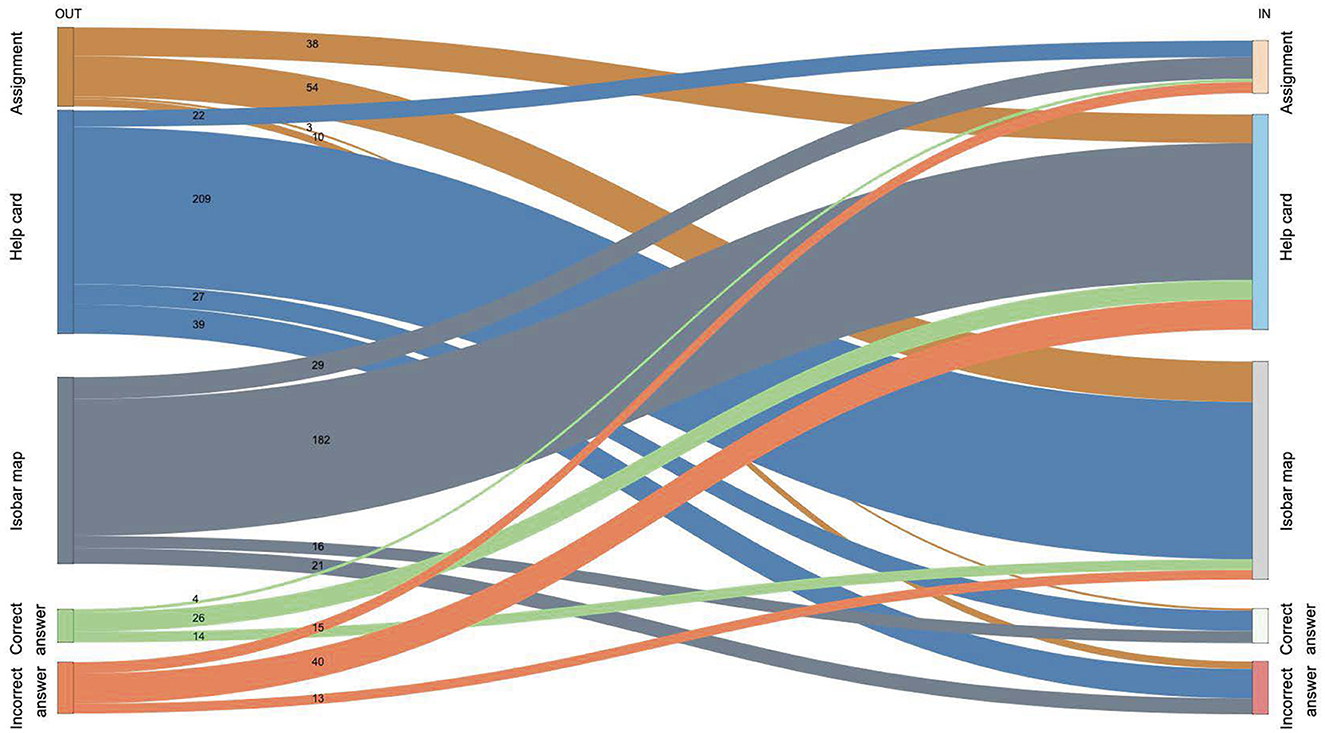
Figure 4. Sankey-Diagram for the transitions between AOIs over all participants for the altitude wind tasks.
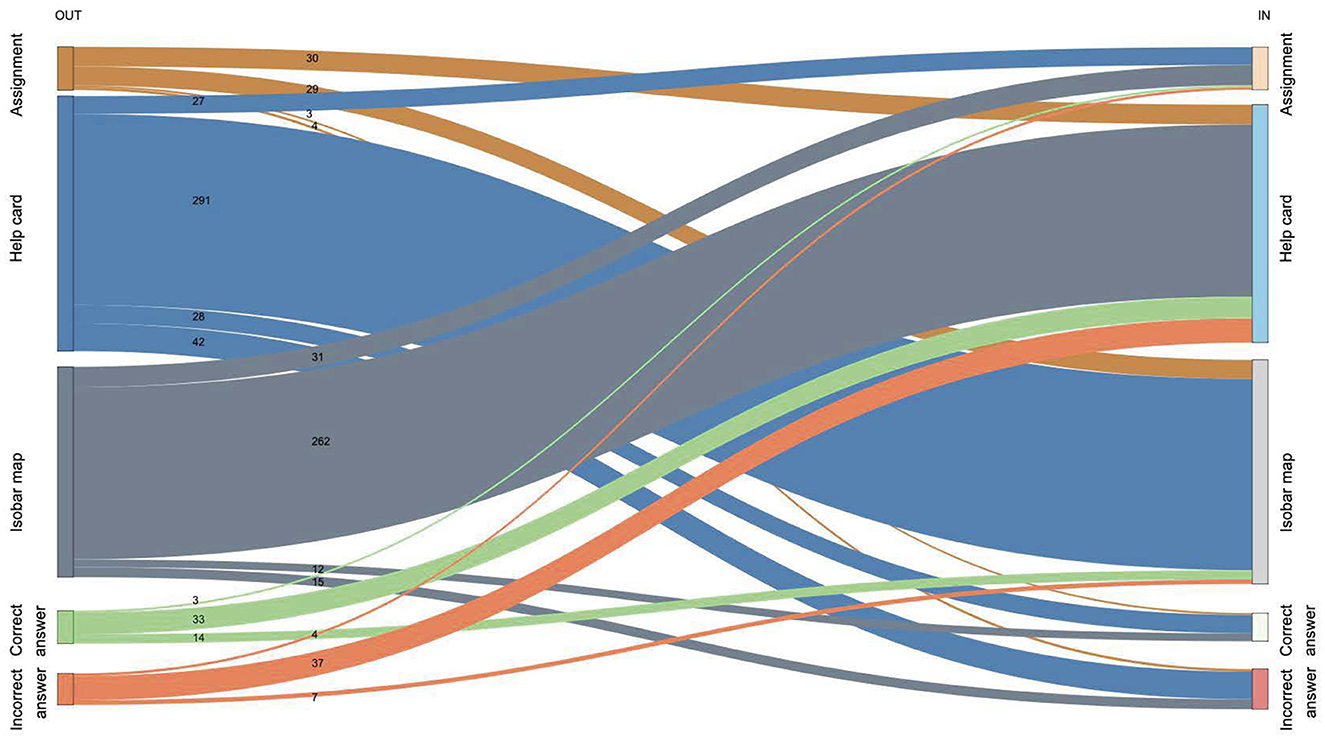
Figure 5. Sankey-Diagram for the transitions between AOIs over all participants for the surface wind tasks.
Table 7 presents the results of the eye-tracking metrics for different areas of interest (AOIs), specifically for the altitude and surface items. The eye movement variables, including Relative Fixation Count (RFC), Mean Total Fixation Duration (MFD) in seconds, and Time to First Fixation (TFF) in seconds, are listed for each AOI. The results are presented as means with standard deviations, with values listed for each metric and each AOI. To analyze the means of the variables, pairwise comparisons were made using the Wilcoxon rank sum test with Benjamini-Hochberg correction. The results of this test are presented as W-values, z-values, adjustment of p-values and effect size (r). There are significant differences between the mean values for altitude and surface wind for the metrics RFC and MFD for the AOIs “Assignment” and “Help Card” (p < 0.05). For TFF, there are significant differences almost for all AOIs (p < 0.001).
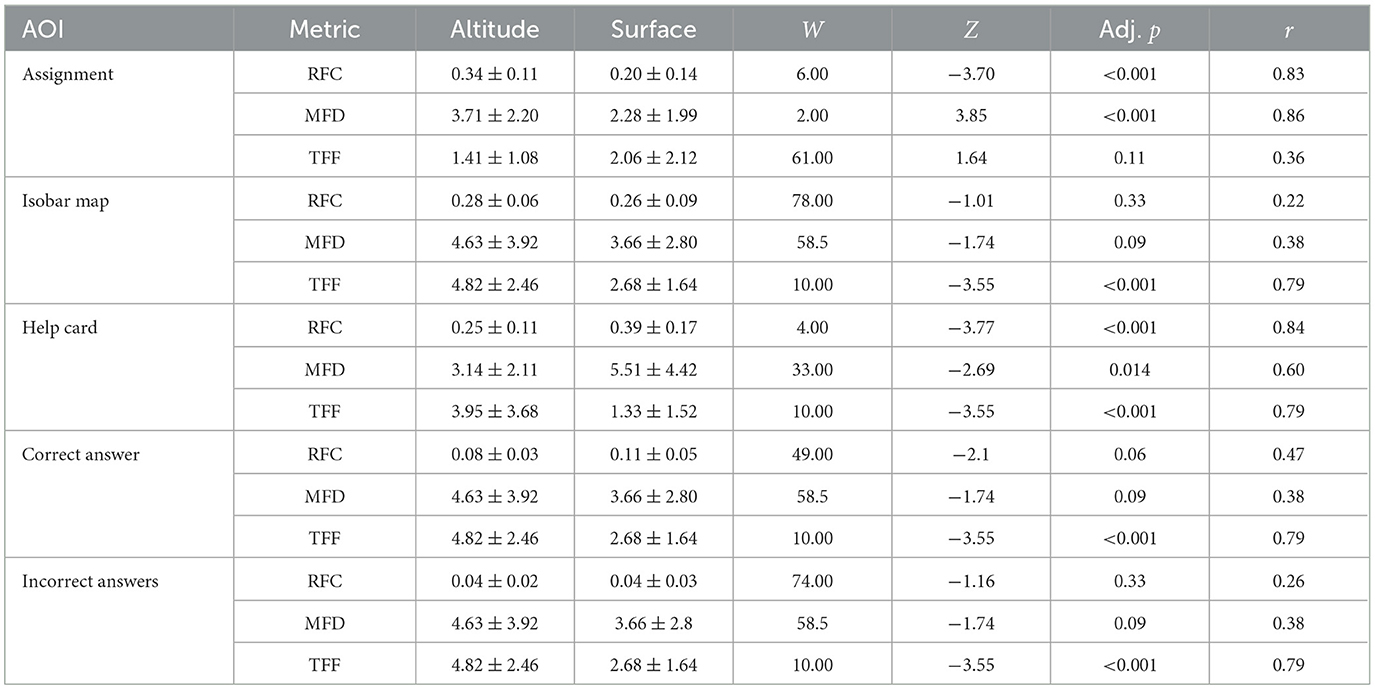
Table 7. Results of the eye tracker metrics for different AOIs for the altitude and surface wind.
The Figure 6 shows four scatter plots visualizing the mean fixation duration (MFD) in milliseconds for different participants and specific areas of interest (AOIs). These graphs present the results for two AOIs: “Help card” and “Isobar map”, because the task is primarily solved using these areas. Other AOIs, such as the task description and answer alternatives, do not provide clear information regarding a specific problem-solving strategy, and thus were not analyzed in detail. Each AOI in the scatterdiagram in Figure 6 is analyzed in two contexts–“Surface” and “Altitude”. The MFD charts show that the data points for “Altitude” are less scattered than in the “Surface” scenario, but there are still some outliers above the mean value.
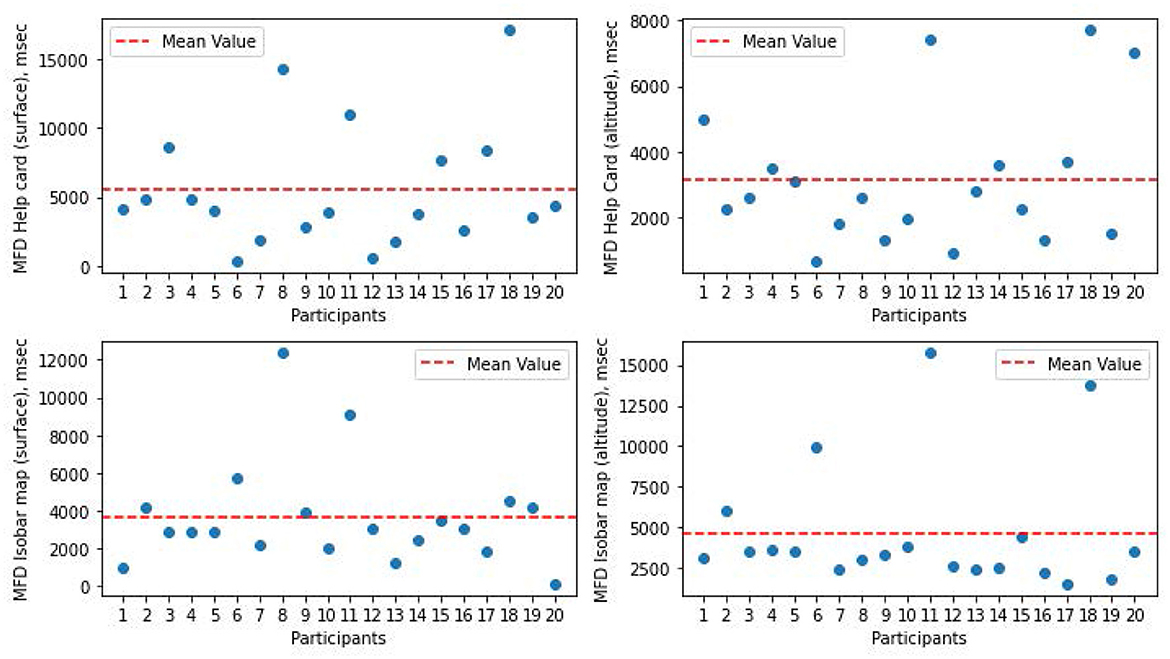
Figure 6. Scatterdiagram shows the mean of total fixation duration (MFD) in the AOIs “Help card” and “Isobar map” of every participant for all surface and altitude wind items.
The Levenshtein distance was calculated for each item in order to check whether the participants had similar gaze patterns. The heatmap (see Figure 7) visualizes the pairwise Levenshtein distances between participants' gaze path for each item based on the AOI sequence. Each cell represents the distance measure, with darker shades representing shorter distances and greater similarity, and lighter shades representing longer distances and greater dissimilarity. The scale below shows the color intensity of the distance values. Lets look at the first subplot in Figure 7. This heatmap shows the pairwise Levenshtein distances between the gaze trajectories of 20 participants looking at item 1. The y-axis lists the participants, labeled 1 to 20, and the x-axis reflects this with the same participant numbers. Each cell on the grid corresponds to the Levenshtein distance between the gaze sequences of two participants. The diagonal line of white squares from top-left to bottom-right represents each participant's comparison to themselves, i.e. a distance of zero. Light shades of cells indicate shorter distances, i.e. greater similarity between the participants' gaze trajectories, while dark shades correspond to greater distances, i.e. dissimilarity. Looking at the heatmap in more detail, let's take a look at the cell representing the Levenshtein distance between participant 4 and participant 2. This cell has a dark shade and a value of 77, indicating a high Levenshtein distance, which means that the gaze patterns of these two participants were less similar. Conversely, if the cell is lighter (participant 4 and participant 3), their gaze patterns were more similar, indicating a lower Levenshtein distance (38). Please note that the color of the numbers is not important, only the color of the cells.
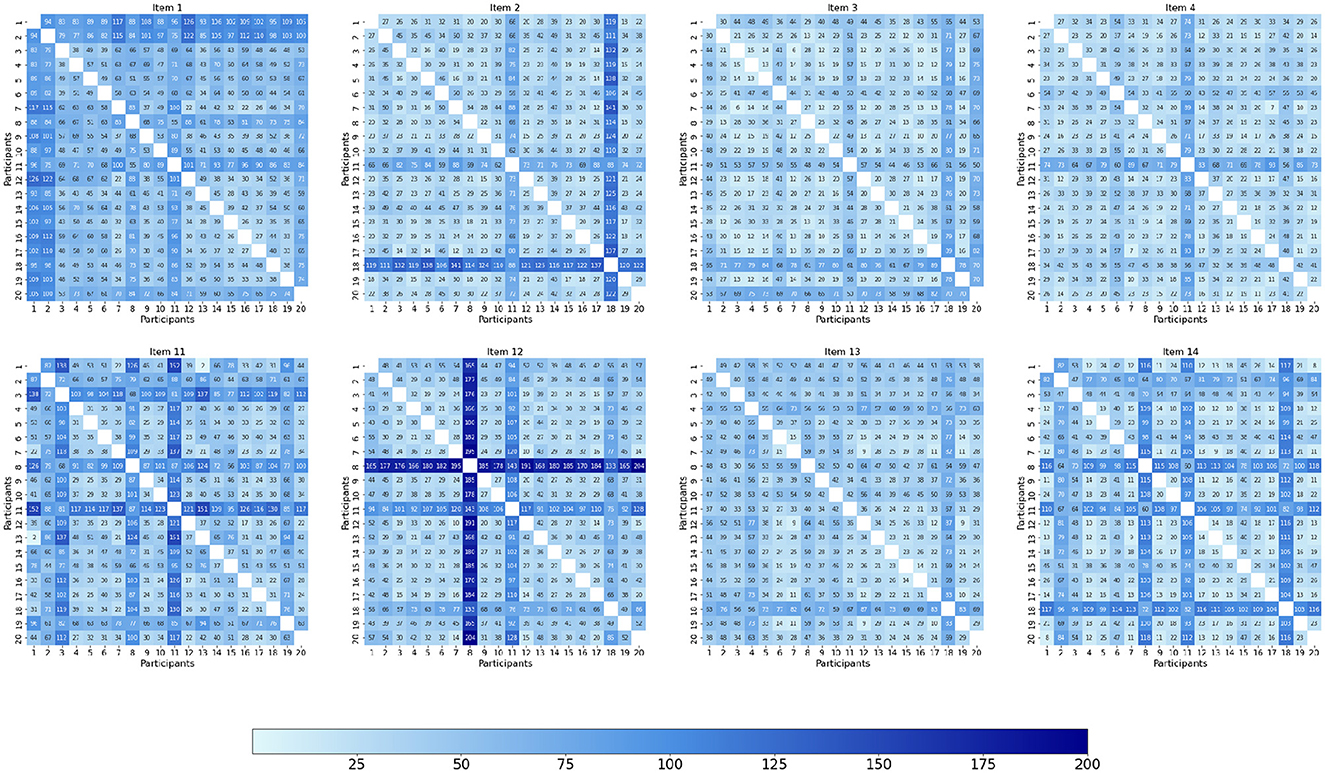
Figure 7. Heatmaps of the Levenshtein distance for every item.
Based on the Levenshtein distance the K-means cluster analysis were performed. In this study, K = 2 was chosen based on the Silhouette score, which measures the cohesion and separation of clusters. The Silhouette score was maximized at K = 2, indicating optimal clustering. These Silhouette scores are also written in Figure 8. In Figure 8 we illustrate the K-means cluster membership derived from Levenshtein distances. Participants are plotted on the x-axis and their cluster assignments are plotted on the y-axis. Yellow indicates membership in one cluster, while purple dots indicates membership in the other.
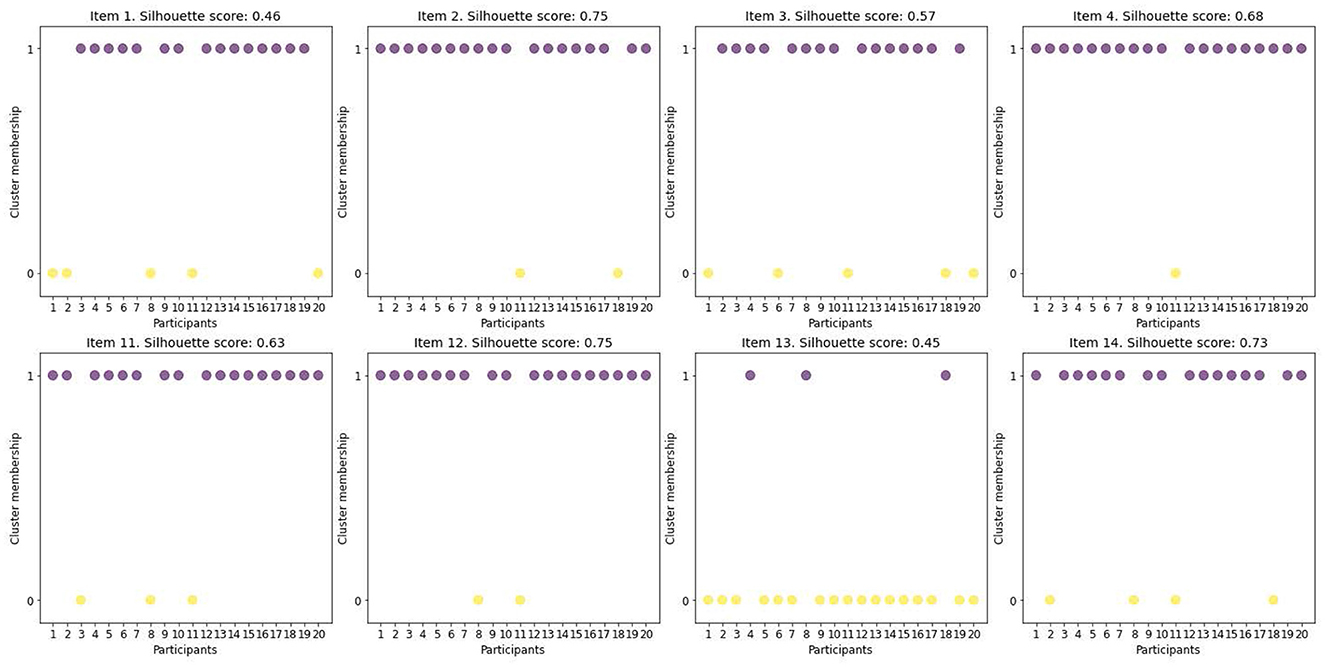
Figure 8. Cluster membership and Silhouette scores based on Levenshtein distances for every item.
4 Discussion
(RQ1) To answer the first research question, the bivariate correlations (Spearman's r) between success in learning (recall knowledge) recall for the altitude (two-forces) wind and the surface (three-forces) wind and the different types of cognitive load were analyzed. A comparison of the bivariate correlations between knowledge recall for the altitude (Table 3) and the surface winds (Table 4) and the different types of cognitive load shows similar trends. For both scenarios, there is a significant negative correlation between knowledge recall and intrinsic cognitive load (−0.48* for altitude and −0.57** for surface). Comparing the correlations between altitude and surface wind scenarios reveals a stronger negative correlation between ICL and learning success for surface (−0.57**) compared to altitude (−0.48*). This suggests that tasks for the surface (three-force) wind may be more complex, leading to a higher intrinsic cognitive load, which is reflected in a stronger negative correlation with learning success (Klepsch and Seufert, 2021). The comparison of correlation between knowledge use and extraneous cognitive load shows that ECL has a stronger negative correlation with learning success for the altitude tasks (−0.67**) than for the surface tasks (−0.53**). This suggests that external factors, such as task or help cards, may have a greater influence on learning success in the first tasks (altitude wind) than in the surface wind tasks. The sequential order of the tasks, with the altitude (two-force) scenario following the surface (three-force) scenario, may have contributed to the weaker correlation between extraneous cognitive load and learning success for the surface tasks compared to the altitude tasks. It is suggested that the subjects may have become familiar to the task environment during the altitude tasks and therefore did not pay attention to the task presentation during the surface tasks. This was also supported by the analysis of eye-tracking metrics: In the altitude scenario, participants paid more attention to the task description and to each element of the items. In the surface scenario, however, they immediately focused on the key elements relevant to solving the task, such as the help card and the isobar map. This is consistent with the principles of CLT (Sweller, 1988; Sweller et al., 2011), which suggests that a familiar learning environment can reduce extraneous cognitive load. By becoming familiar with the task environment in the altitude scenario, participants likely required fewer cognitive resources to process the task presentation in the surface scenario, thereby shifting their focus directly to the key elements necessary to solve the task. The nearly identical values for the correlation between GCL at altitude and surface suggest a weak positive relationship between germane cognitive load and knowledge recall in both scenarios. The hypothesis H1 that there is a significant correlation between the perceived cognitive load and knowledge recall was partially confirmed.
(RQ2) The stepwise multiple regression analysis for predicting learning success in high altitude wind recall tasks provides insights into the role of cognitive load (see Tables 5, 6). In the first step, it is clear that ICL has a significant negative influence on learning success with a B = −0.18, p = 0.02* for the altitude (two-forces) tasks and also negative (B = −0.27) and statistically significant (p = 0.04*) for the surface (three-forces) tasks. In both cases this indicates that an increase in intrinsic cognitive load is associated with a decrease in learning. This finding supports the theory (Paas et al., 1994; Sweller, 1988) that a high ICL can put a strain on working memory and thus impair performance. The higher value of the ICL for the surface scenario compared to the altitude scenario suggests that the tasks in the surface scenario were more complex than those in the altitude scenario. With the inclusion of ECL in the second step for the altitude scenario (Table 5), the influence of ICL remains insignificant (B = 0.07, p = 0.48), while ECL emerges as a significant predictor with B = −0.38 (p = 0.006**). There is a similar trend in the surface scenario (Table 6): after the addition of ECL, ICL loses its statistical significance, suggesting that its influence on learning success may be overshadowed by ECL (B = −0.33, p = 0.10). The comparison between the two scenarios shows that ECL was greater for the altitude scenario than for the surface scenario. This again confirms our result from RQ1. In the third step for altitude wind the coefficient for ICL is positive (B = 0.07), but p value is greater than 0.05, so this effect is not statistically significant. ECL has a significantly negative influence on learning success (B = −0.43, p = 0.004**). For GCL (B = −0.08, p = 0.28), a negative correlation with learning success is also indicated, but this is not significant. The model explains 56% of the variance in learning success, which indicates that there is a moderate to strong fit. The corrected R2 is 0.48, which indicates a reasonable fit and takes into account the sample size. The stepwise multiple regression analysis showed that extraneous cognitive load in particular has a significant and negative influence on learning success. This is in line with the cognitive load theory, which states that a high extraneous load can overload the working memory and thus impair the learning process (Sweller, 1988). The comparison between Tables 5 and 6 in the third step shows that the tasks related to surface wind show a similar trend to those related to altitude wind, with the ECL for surface wind tasks being lower than that for altitude wind tasks. Addressing the second research question (RQ2), it is evident that the components of cognitive load can predict 48% of the variance in learning success for altitude wind tasks and 22% of the variance for surface wind tasks. The difference in predictive power for the two scenarios suggests the presence of other predictors that could account for this difference. A more detailed investigation using eye-tracking metrics could potentially explain further differences between the two scenarios. This would shed light on the nuanced ways in which learners interact with the tasks.
(RQ3) This question could be addressed through qualitative and quantitative analysis of eye-tracking data, examining patterns of gaze behavior and fixation durations to identify and categorize the different strategies used by students in solving recall tasks of free body diagram in the context of altitude and surface wind scenarios. Looking at the transitions (see Figures 4, 5) between the AOIs for wind at altitude and surface wind, it is noticeable that in both scenarios most of the transitions take place between the isobar map and the help card. The number of transitions from “Help card” to “Isobar map” and from “Isobar map” to “Help card” was significantly higher, as we can see in the Sankey diagram, for the surface wind than in the first diagram for altitude. This suggests that in the surface scenario more participants switched between the help card and the isobar map, whereas in the altitude scenario there were fewer transitions between the same AOIs. This observation can be explained by the fact that the content for the surface wind is much more complex, as additional force such as friction have to be taken into account.
The reduction in the number of transitions between the “Assignment” and other AOIs in the tasks for the surface wind compared to the “altitude” tasks can be explained by the fact that the participants were first confronted with the “altitude” tasks. As a result, they first had to familiarize themselves with the task design and setting. These results confirm the effects of externeaous cognitive load for the surface wind and show that participants may switch less between resources as they are already familiar with the structure and format of the tasks. The transition rates between the correct (and also incorrect) answer and other AOIs are very similar in both scenarios. We propose that there are increased transitions between the help cards (or isobar maps) and the AOIs of the answer area. It appears that the participants were likely searching for the answer after working with the isobar maps and the help card.
The results of the eye movement metrics in Table 7 illustrate the difference between the “Altitude” and “Surface” scenarios. In particular, for the AOI “Assignment”, the mean fixation duration (MFD) in the “altitude” scenario was 3.71 ± 2.20 seconds is significantly longer than in the “Surface” scenario with 2.28 ± 1.99 seconds. This suggests that participants worked more intensively on the “Altitude” assignment text, possibly because they were presented at the beginning of the study and required a more thorough reading of the instructions. In contrast, participants appear to have partially ignored the assignment text on “Surface” scenario, as evidenced by shorter fixation times in this scenario. This finding is supported by the analysis of the Sankey diagrams in Figures 4, 5, which show the transitions between different AOIs. The TFF and the RFC also confirm that attention and engagement were higher for the assignment text in the altitude than in the surface scenario.
The analysis of the AOI “Isobar map” shows that the RFC in the “Altitude” and “Surface” scenarios is almost the same, which indicates that the test subjects viewed both scenarios approximately the same number of times. However, they did not look at these AOIs for the same length of time: MFD was viewed in the “Altitude” scenario longer than in the “Surface” scenario. This result can be explained by the fact that the isobar maps were introduced for the first time in the “Altitude” tasks and participants therefore needed more time to familiarize themselves with this new map. The TFF was also longer in the “Altitude” scenario, as the subjects first familiarized themselves more intensively with the task before turning to the isobar maps. In the “Surface” scenario, on the other hand, in which the task could be ignored, the test subjects moved on to working on the isobar maps more quickly. A similar trend is observed for the Help Card, where the TFF in the “Altitude” condition is also notably higher than in the “Surface” condition. In the “Help card” area, the results show significant differences between the “Altitude” and “Surface” scenarios, particularly in the RFC and MFD metrics. The data shows that in the “Surface” scenario, the help card was viewed significantly more frequently and for longer, with an RFC of 0.39 ± 0.17 and an MFD of 5.51 ± 4.42 seconds. In comparison, the “Altitude” scenario had an RFC of 0.25 ± 0.11 and an MFD of 3.14 ± 2.11 seconds. These observations indicate that the tasks for the three-force diagrams were more complex in the context of the “surface” and that the participants therefore required more support. The increased use of the help cards in this scenario could indicate that the participants had more difficulty processing the required information and solving the tasks. For the AOIs “Correct Answer” and “Incorrect Answers”, the data show no significant differences between the “Altitude” and “Surface” scenarios in the metrics RFC and MFD. The TFF for both AOIs also shows significant differences. This can be also explained by the faster task completion in the surface scenario, where participants likely did not spend as much time reading the assignment.
The Levenshtein distance analysis (see Figure 7) for the altitude wind (items 1 to 4) and surface wind (items 11 to 14) tasks shows that participants' scan paths become more similar with each additional item. For the initial items 1 and 11, participants were probably orienting themselves to the structure of the task, resulting in less uniform scan paths. There is no clear clustering here, which is confirmed by the lower values for the Silhouette score (see Figure 8). For the following three items, however, there is increased coherence, particularly for the altitude wind of the scan paths, suggesting a better understanding of the task and a better adaptation to the environment. On the other hand, the surface wind tasks (items 12 to 14) show differences in the scan paths among several items. Some participants (8, 11 and 18) have high Levenshtein distances than the other participants. To better understand these differences, the gaze paths of these participants were analyzed in more detail. The analysis of eye-tracking metrics revealed that these participants had a very long mean total fixation duration (see Figure 6). They spent significantly longer periods working with the isobar map and the help card compared to the other participants. The detailed analysis of all variables showed that the subjects generally scored low on the card rotation tests, although their recall scores continued to be high. The help card provided, which can also be used to solve the problem by rotation, indicates that they worked longer on the tasks due to low rotation ability. This again confirms a finding that has been repeatedly demonstrated in many other studies (Cheung et al., 2020; Stieff, 2007; Kozhevnikov et al., 2007). This result could indicate that learners should train their ability to mentally rotate in order to be able to complete tasks with force diagrams more effectively and quickly. In general, the result may help to target teaching methods in which these skills are improved.
5 Limitations
The current study has several limitations that should be considered in future research. One notable limitation is the relatively small sample size, which reduces statistical power and may limit the generalizability of the findings. In our case we calculated the power with the programm G*Power 3.1. The value for the power was 0.62, which is pretty low. Future research should involve a larger number of participants to obtain more robust and representative data. Addressing this limitation would allow future studies to provide a more comprehensive understanding of the factors influencing success in complex recall tasks.
Additionally, the fixed order of the scenarios, with the altitude scenario always preceding the surface scenario, may have influenced the results. This fixed sequence might have fostered task familiarity or learning effects, leading to reduced cognitive load in the subsequent scenario. Future studies should consider randomizing the order of the scenarios to control for potential order effects and better isolate the influence of task characteristics on cognitive load and performance.
Finally, while eye-tracking metrics provided valuable insights into attentional and cognitive processes, they were not complemented by qualitative data, such as interviews or post-task questionnaires. Such data could have offered a deeper understanding of participants' cognitive strategies and subjective experiences. Future research should integrate both quantitative and qualitative measures to provide a more holistic view of the factors influencing cognitive load and learning in complex tasks.
These limitations highlight the exploratory nature of this study. Future research should aim to address these issues by employing larger sample sizes, randomization of task order, pre- and post-testing, and the inclusion of qualitative methods. This would enable a more comprehensive and rigorous understanding of cognitive load and its role in learning success.
6 Conclusion
The results of the study provide important insights into the relationships between cognitive load, mental rotation ability and learning success in recall tasks. The processing of tasks with three-force diagrams is more difficult than the processing of tasks with two-force diagrams. This is confirmed by cognitive load scales and supported by eye-tracking analysis. Another important finding of the study is that subjects seem to compensate for their lack of rotational ability by spending more time working. Of course it is difficult to generalize this result, but as mentioned in limitation it is possible to check it with large sample and limit of processing time. These results emphasize the importance of cognitive load and mental rotation ability for performance in problem-solving tasks and support the development of targeted teaching methods to improve these skills. Future research should focus on the expansion of variables such as participants' prior knowledge, the use of targeted cognitive load questionnaires, and the assessment of learning success through posttests. In addition, it would make sense to increase the sample size in order to improve the generalizability of the results and enable a more differentiated analysis of the influencing factors.
Data availability statement
The raw data supporting the conclusions of this article will be made available by the authors, without undue reservation.
Ethics statement
Ethical approval was not required for the studies involving humans in accordance with the local legislation and institutional requirements. The participants provided their written informed consent to participate in this study.
Author contributions
YO: Data curation, Formal analysis, Investigation, Methodology, Project administration, Software, Visualization, Writing – original draft, Writing – review & editing, Conceptualization. LH: Resources, Writing – review & editing. PK: Resources, Writing – review & editing. IK: Writing – review & editing. BW: Conceptualization, Supervision, Writing – review & editing, Resources, Software.
Funding
The author(s) declare that no financial support was received for the research, authorship, and/or publication of this article.
Conflict of interest
The authors declare that the research was conducted in the absence of any commercial or financial relationships that could be construed as a potential conflict of interest.
Publisher's note
All claims expressed in this article are solely those of the authors and do not necessarily represent those of their affiliated organizations, or those of the publisher, the editors and the reviewers. Any product that may be evaluated in this article, or claim that may be made by its manufacturer, is not guaranteed or endorsed by the publisher.
Supplementary material
The Supplementary Material for this article can be found online at: https://www.frontiersin.org/articles/10.3389/feduc.2025.1451020/full#supplementary-material
References
Alemdag, E., and Cagiltay, K. (2018). A systematic review of eye tracking research on multimedia learning. Comp. Educ.125:23. doi: 10.1016/j.compedu.2018.06.023
Arnell, J. B. (2022). Toward a Conceptual Approach to the Coriolis Force: Cataloging Intuitive Knowledge Elements in Intermediate Physics Learners (Theses and Dissertations). Logan Utah: Utah State University.
Becker, S., Knippertz, L., Ruzika, S., and Kuhn, J. (2023). Persistence, context, and visual strategy of graph understanding: Gaze patterns reveal student difficulties in interpreting graphs. Phys. Rev. Phys. Educ. Res., 19:020142. doi: 10.1103/PhysRevPhysEducRes.19.020142
Becker, S., Küchemann, S., Klein, P., Lichtenberger, A., and Kuhn, J. (2022). Gaze patterns enhance response prediction: more than correct or incorrect. Phys. Rev. Phys. Educ. Res., 18:020107. doi: 10.1103/PhysRevPhysEducRes.18.020107
Canham, M., and Hegarty, M. (2010). Effects of knowledge and display design on comprehension of complex graphics. Learn. Instruct. 20, 155–166. doi: 10.1016/j.learninstruc.2009.02.014
Cheung, C. N., Sung, J. Y., and Lourenco, S. F. (2020). Does training mental rotation transfer to gains in mathematical competence? Assessment of an at-home visuospatial intervention. Psychol. Res. 84, 2000–2017. doi: 10.1007/s00426-019-01202-5
Ekstrom, R. B., French, J. W., and Harman, H. H. (1976). Manual for Kit of Factor-Referenced Cognitive Tests. Princeton: Educational Testing Service.
Ertl, B. M., Watzka, B., Csanadi, A., Hoyer, C., and Girwidz, R. (2020). “Physics learning environments: The impact of auditive and visual cues on outcomes and cognitive load,” in AERA Online Paper Repository, AERA Annual Meeting (2020, online).
Eshetu, F., and Assefa, S. (2019). Effects of context-based instructional approaches on students' problem-solving skills in rotational motion. EURASIA J. Mathem. Sci. Technol. Educ. 15:em1665. doi: 10.29333/ejmste/102283
Field, A. (2013). Discovering Statistics Using IBM SPSS Statistics: And Sex and Drugs and Rock ‘n' Roll. Sage, Los Angeles: IBM.
Gegenfurtner, A., Lehtinen, E., and Säljö, R. (2011). Expertise differences in the comprehension of visualizations: A meta-analysis of eye-tracking research in professional domains. Educ. Psychol. Rev. 23, 523–552. doi: 10.1007/s10648-011-9174-7
Girwidz, R., and Kohnle, A. (2021). Multimedia and Digital Media in Physics Instruction. Cham: Springer International Publishing, 297–336.
Glessmer, M. S., and De Wet, P. D. (2018). Supporting conceptual understanding of the coriolis force through laboratory experiments. Current: J. Marine Educ. 37, 92–94. doi: 10.5334/cjme.5
Hahn, L., and Klein, P. (2022). Eye tracking in physics education research: a systematic literature review. Phys. Rev. Phys. Educ. Res. 18:013102. doi: 10.1103/PhysRevPhysEducRes.18.013102
Hahn, L., and Klein, P. (2023). Analysis of eye movements to study drawing in the context of vector fields. Front. Educ. 8:1162281. doi: 10.3389/feduc.2023.1162281
Han, J., Chen, L., Fu, Z., Fritchman, J., and Bao, L. (2017). Eye-tracking of visual attention in web-based assessment using the force concept inventory. Eur. J. Phys. 38:045702. doi: 10.1088/1361-6404/aa6c49
Hoogerheide, V., and Roelle, J. (2020). Example-based learning: new theoretical perspectives and use-inspired advances to a contemporary instructional approach. Appl. Cogn. Psychol. 34, 787–792. doi: 10.1002/acp.3706
Hoyer, C., and Girwidz, R. (2020). Animation and interactivity in computer-based physics experiments to support the documentation of measured vector quantities in diagrams: an eye tracking study. Phys. Rev. Phys. Educ. Res. 16:020124. doi: 10.1103/PhysRevPhysEducRes.16.020124
Hurzlmeier, M., Watzka, B., Hoyer, C., Girwidz, R., and Ertl, B. (2021). Lernergebnisse und individuelle prozesse des physik-lernens mit auditiven und visuellen hinweisen. Zeitschrift für Pädagogische Psychologie 38, 627–652. doi: 10.1024/1010-0652/a000331
Kekule, M. (2017). Learning Style Preferences and Their Influence on Students' Problem Solving in Kinematics Observed by Eye-Tracking Method. AIP Conf. Proc. 1804, 030002.
Kekule, M., and Viiri, J. (2018). Students' approaches to solving r-fci tasks observed by eye-tracking method. Sci. Educ. 9, 117–130. doi: 10.14712/18047106.1010
Klein, P., Becker, S., Küchemann, S., and Kuhn, J. (2021). Test of understanding graphs in kinematics: Item objectives confirmed by clustering eye movement transitions. Phys. Rev. Phys. Educ. Res. 17:013102. doi: 10.1103/PhysRevPhysEducRes.17.013102
Klein, P., Viiri, J., and Kuhn, J. (2019). Visual cues improve students' understanding of divergence and curl: evidence from eye movements during reading and problem solving. Phys. Rev. Phys. Educ. Res. 15:10126. doi: 10.1103/PhysRevPhysEducRes.15.010126
Klepsch, M., and Seufert, T. (2021). Making an effort versus experiencing load. Front. Educ. 6:645284. doi: 10.3389/feduc.2021.645284
Kosel, C., Holzberger, D., and Seidel, T. (2021). Identifying expert and novice visual scanpath patterns and their relationship to assessing learning-relevant student characteristics. Front. Educ. 5:612175. doi: 10.3389/feduc.2020.612175
Kozhevnikov, M., Motes, M., and Hegarty, M. (2007). Spatial visualization in physics problem solving. Cogn. Sci. 31, 549–579. doi: 10.1080/15326900701399897
Küchemann, S., Klein, P., Fouckhardt, H., Gröber, S., and Kuhn, J. (2020). Students' understanding of non-inertial frames of reference. Phys. Rev. Phys. Educ. Res. 16:010112. doi: 10.1103/PhysRevPhysEducRes.16.010112
Lai, M., Tsai, M., Yang, F., Hsu, C., Liu, T., Lee, S. W., et al. (2013). A review of using eye-tracking technology in exploring learning from 2000 to 2012. Educ. Res. Rev. 10, 90–115. doi: 10.1016/j.edurev.2013.10.001
Leppink, J., Paas, F., van Gog, T., van der Vleuten, C. P., and van Merriënboer, J. J. (2014). Effects of pairs of problems and examples on task performance and different types of cognitive load. Learn. Instruct. 30, 32–42. doi: 10.1016/j.learninstruc.2013.12.001
Löffler, P., Pozas, M., and Kauertz, A. (2018). How do students coordinate context-based information and elements of their own knowledge? An analysis of students' context-based problem-solving in thermodynamics. Int. J. Sci. Educ. 40, 1935–1956. doi: 10.1080/09500693.2018.1514673
Opfermann, M., Schmeck, A., and Fischer, H. E. (2021). Multiple Representations and Learning Physics. Cham: Springer International Publishing, 175–199.
Paas, F. G. W. C., van Merriënboer, J. J. G., and Adam, J. J. (1994). Measurement of cognitive load in instructional research. Percept. Motor Skills 79, 419–430. doi: 10.2466/pms.1994.79.1.419
Pozas, M., Löffler, P., Schnotz, W., and Kauertz, A. (2020). The effects of context-based problem-solving tasks on students' interest and metacognitive experiences. Open Educ. Stud. 2, 112–125. doi: 10.1515/edu-2020-0118
Renkl, A. (2005). The Worked-Out Examples principle in Multimedia Learning (Cambridge: Cambridge University Press), 229–245.
Rosiek, R., Sajka, M., Ohno, E., Shimojo, A., Iwata, M., and Wcisło, D. (2017). An excerpt from an eye-tracking comparative study between poland and japan with the use of force concept inventory. AIP Conf. Proc. 1804:060003. doi: 10.1063/1.4974400
Salvucci, D. D., and Goldberg, J. H. (2000). “Identifying fixations and saccades in eye-tracking protocols,” in Proceedings of the 2000 Symposium on Eye Tracking Research & Applications, ETRA '00 (New York, NY: Association for Computing Machinery), 71–78.
Shepard, R. N., and Metzler, J. (1971). Mental rotation of three-dimensional objects. Science 171, 701–703. doi: 10.1126/science.171.3972.701
Stieff, M. (2007). Mental rotation and diagrammatic reasoning in science. Learn. Instruct. 17, 219–234. doi: 10.1016/j.learninstruc.2007.01.012
Susac, A., Bubić, A., Planinic, M., Movre, M., and Palmovic, M. (2019). Role of diagrams in problem solving: an evaluation of eye-tracking parameters as a measure of visual attention. Phys. Rev. Phys. Educ. Res. 15:13101. doi: 10.1103/PhysRevPhysEducRes.15.013101
Sutaphan, S., and Yuenyong, C. (2019). Stem education teaching approach: inquiry from the context based. J. Phys.: Conf. Series 1340:012003. doi: 10.1088/1742-6596/1340/1/012003
Sweller, J. (1988). Cognitive load during problem solving: effects on learning. Cogn. Sci. 12, 257–285. doi: 10.1016/0364-0213(88)90023-7
Sweller, J., van Merrienboer, J. J. G., and Paas, F. G. W. C. (1998). Cognitive architecture and instructional design. Educ. Psychol. Rev. 10, 251–296. doi: 10.1023/A:1022193728205
Was, C., Sansosti, F., and Morris, B. (2017). Eye-Tracking Technology Applications in Educational Research. Pennsylvania: IGI Global.
Watzka, B., Hoyer, C., Ertl, B., and Girwidz, R. (2021). Wirkung visueller und auditiver hinweise auf die visuelle aufmerksamkeit und lernergebnisse beim einsatz physikalischer lernvideos. Unterrichtswissenschaft 49:7. doi: 10.1007/s42010-021-00118-7
Keywords: cognitive load, learning success, eye-tracking, stem education, physics, Levenshtein distance
Citation: Omarbakiyeva Y, Hahn L, Klein P, Krumphals I and Watzka B (2025) Relationship between the cognitive load and the learning success in applying force diagrams: eye-tracking study. Front. Educ. 10:1451020. doi: 10.3389/feduc.2025.1451020
Received: 18 June 2024; Accepted: 06 January 2025;
Published: 29 January 2025.
Edited by:
André Bresges, University of Cologne, GermanyReviewed by:
Sebastian Becker-Genschow, University of Cologne, GermanySascha Schneider, University of Zurich, Switzerland
Copyright © 2025 Omarbakiyeva, Hahn, Klein, Krumphals and Watzka. This is an open-access article distributed under the terms of the Creative Commons Attribution License (CC BY). The use, distribution or reproduction in other forums is permitted, provided the original author(s) and the copyright owner(s) are credited and that the original publication in this journal is cited, in accordance with accepted academic practice. No use, distribution or reproduction is permitted which does not comply with these terms.
*Correspondence: Yultuz Omarbakiyeva, eXVsdHV6Lm9tYXJiYWtpeWV2YUBvdmd1LmRl