 Emmanuel Atindama
 Michael Ramsdell
 David P. Wick
 Sumona Mondal
 Prashant Athavale
94% of researchers rate our articles as excellent or good
Learn more about the work of our research integrity team to safeguard the quality of each article we publish.
Find out more
ORIGINAL RESEARCH article
Front. Educ., 13 February 2025
Sec. STEM Education
Volume 10 - 2025 | https://doi.org/10.3389/feduc.2025.1435279
Introduction: The study examines the impact of targeted educational interventions on the academic success and retention of engineering students identified as high-risk, with a focus on two student groups historically underrepresented in STEM: underrepresented minority (URM) and female students. These interventions included an alternative curriculum pathway, a co-calculus support course, and spatial visualization training. Building on our previous work, we evaluated the outcomes of interventions designed to improve retention and graduation rates among the most academically underprepared students from these groups, who were consequently categorized as high-risk.
Methodology: We analyzed data from 10 student cohorts, covering 5 years before and 5 years after the interventions were implemented. We utilized a two-population proportion test to compare the groups' retention rates, graduation rates, and success in early STEM courses during pre- and post-intervention periods. Additionally, we constructed logistic regression models to identify key factors influencing on-time graduation.
Results: Our results show that the interventions significantly increased both the 4- and 6-year graduation rates for high-risk URM students by nearly 20 percentage points. Although high-risk female students improved retention and graduation rates, these changes were not found to be statistically significant. However, their performance in early foundation STEM courses, particularly Physics I and Calculus I, significantly improved post-intervention.
Discussion: Logistic regression models indicated a shift in the significance of the graduation rate predictors post-intervention, demonstrating the efficacy of these tailored strategies. The reduced importance of Physics I grades in predicting on-time graduation during the intervention years suggests a benefit of the alternative curriculum pathway, which decoupled this course from Calculus I for high-risk students. Additionally, the intervention mitigated the previously significant predictor of being non-URM for on-time graduation, indicating a leveling effect for URM students. These findings highlight the potential of customized interventions to enhance the academic outcomes and retention of high-risk students in STEM disciplines.
Racial and gender disparities in STEM fields are well-documented, with research consistently indicating that retention rates are particularly low for historically underrepresented students of color and women (Anderson and Kim, 2006; Griffith, 2010; Hill et al., 2010; Shaw and Barbuti, 2010; Chen, 2013).
In our previous research (Wick et al., 2022), we described a methodology for identifying academically underprepared students entering engineering majors, categorized as high-risk students. We also evaluated the impact of targeted interventions through a study encompassing 10 student cohorts. These interventions, further described in Section 1.1, include an Alternative Curriculum Pathway, a Co-Calculus support course, and Spatial Visualization training. Thus, the study uses data spanning 16 years to include data from the graduation of the final cohort. This paper builds upon our work (Wick et al., 2022) by specifically examining the impact of these targeted interventions on high-risk underrepresented minority (URM) and female engineering students. We aim to understand the various factors influencing the success of these groups in completing their engineering degrees and retaining their enrollment through predictive modeling.
Our study addresses the following research questions:
I What is the impact of targeted interventions on the retention rates and graduation rates for these groups?
II What is the impact of the interventions on the success in foundational early STEM courses for these groups?
III What are the key factors responsible for the on-time graduation of these groups?
Racial and gender disparities in STEM education: The challenges faced by high-risk URM and female students in engineering disciplines are complex and multifaceted. These groups often encounter systemic barriers that can impede their academic progress and reduce retention rates in Science, Technology, Engineering, and Mathematics (STEM) fields (Markle et al., 2022). Recent research continues to show lower retention and graduation rates for URM and female students in STEM fields. For instance, a study by Riegle-Crumb et al. (2019) found that minority students, particularly African Americans and Hispanics, have lower persistence rates in science and engineering majors compared to their white and Asian counterparts. Similarly, Cheryan et al. (2017) highlighted the persistence gap between male and female students in STEM, with women being less likely to continue in STEM majors after their first year. This ongoing disparity underscores the need for targeted interventions to support these underrepresented groups in achieving academic success in STEM disciplines.
Numerous interventions have been proposed and implemented to address these racial and gender disparities. Summer bridge programs, supplemental instruction, and mentorship initiatives have shown promise in supporting URM and female students in STEM. For example, Ghazzawi et al. (2021) demonstrated that summer bridge programs significantly improve graduation rates for URM students by providing early academic support. Palid et al. (2023) emphasized the importance of targeted interventions to address the systemic challenges faced by URM students, advocating for comprehensive support systems that include academic advising, tutoring, and mentoring. Culturally responsive mentoring has shown promise in combating stereotype threats and supporting URM students in STEM. Studies indicate that interactions with underrepresented faculty and mentors can significantly improve the confidence and commitment of students from these backgrounds (Mondisa and McComb, 2015; Miguel and Kim, 2015; Haeger and Fresquez, 2016). Community-oriented interventions such as the Meyerhoff Scholar's program (Sto Domingo et al., 2019) have been successful in increasing the diversity of underrepresented groups in STEM fields.
Importance of foundational early STEM courses: In our present work, we aim to understand the impact of the targeted interventions on the success of URM and female students in early STEM courses. Indeed, performance in early STEM courses is a strong predictor of long-term success in STEM majors. Aulck et al. (2017) noted that students who perform well in introductory mathematics courses are more likely to persist in STEM fields. This finding is supported by the work of Schalk et al. (2009, 2011), who demonstrated that targeted interventions in these courses can significantly improve student outcomes. Wick et al. (2022) further emphasized the importance of addressing academic preparedness in these foundational courses to enhance retention and graduation rates.
Predictive modeling in STEM education: In recent years, predictive modeling has emerged as a valuable tool for identifying at-risk students and tailoring interventions to their specific needs (Sghir et al., 2023). For example, Prasanth and Alqahtani (2023) developed a machine-learning-based predictive model to predict which university students are at risk of dropping out. Aulck et al. (2017) developed a machine learning-based predictive model to forecast STEM attrition using first-year academic data, highlighting the critical role of early performance in foundational mathematics courses. Similarly, Rohr (2012) found that SAT scores and high school GPA are significant predictors of college retention in STEM fields, underscoring the importance of academic preparedness.
This paper builds upon our previous study (Wick et al., 2022), which aimed to enhance the success and retention of engineering students at a private research university by first identifying and then supporting underprepared students.
In 2009, the university established a First-Year Council as part of a strategic initiative to improve student performance and retention in STEM fields (Turner, 2008; Jaspersohn, 2017). The council included deans from the Colleges of Arts and Sciences and Engineering and faculty members from Mathematics, Physics, and Engineering, adopting an interdisciplinary approach to assess the readiness of incoming students for their first-year STEM courses through a thorough analysis of pre-college survey data. The university extensively evaluated first-year student performance in introductory Calculus and Physics courses, leveraging historical data collected over several years, supported by an initial grant from Procter & Gamble in 2009 (Schalk et al., 2009, 2011). Principal Component Analysis (PCA) of pre-entry data highlighted that Mathematics and Physics Diagnostic scores, obtained from both internal and external evaluative instruments, were significant independent measures influencing student outcomes.
A sunflower plot, generated (see Wick et al., 2022, Figure 1) using data from the Fall 2006 to 2010 cohorts, illustrates the paired normalized Mathematics and Physics Diagnostics scores for students co-enrolled in Calculus I and Physics I during their first semester. This plot showcases the diversity in student preparation levels, categorizing the data into four quadrants based on Diagnostic Survey performance. These quadrants represented different preparedness levels in Mathematics and Physics, leading to four risk categories: Low-Risk (well-prepared in both subjects), High-Risk (ill-prepared in both subjects), and Medium-Risk (well-prepared in one subject but not the other). For logistical reasons, a small subgroup of the highest-risk students from the Medium-Risk category was included in the analysis to further expand the High-Risk category. This methodology was the foundation for developing and validating a binary classifier that identified High-Risk students on a per-cohort basis from 2011 onward, ensuring uniformity of subject selection across each cohort year.
Targeted interventions to assist underprepared students: To improve student achievement and STEM retention (Chapman et al., 2015) the university implemented several strategies:
• Alternative curriculum pathway: high-risk engineering students from Fall 2011 onwards followed an alternate schedule that delayed Physics I to the second semester and replaced it with the Engineering and Society course that counted toward graduation requirements and did not increase students' time to graduation. This decoupling allowed less-prepared students to improve their math skills before tackling Calculus-based Physics without sacrificing degree progress.
• Co-calculus for all: starting in 2011, all Calculus students were placed in Co-Calculus (a low-credit mathematics skills course), regardless of pre-entry scores. Students could choose to complete the course or test out after achieving a specific competency level, shifting the course perception from “fail in” to “pass out.”
• Optional spatial visualization (SV) training: students with scores below a designated cut-off on the Purdue Spatial Visualization assessment's Rotations component (Guay, 1977) were scheduled for SV training. Participation was optional, and from 2012 to 2015, a significant portion of high-risk engineering students engaged in this training.
The interventions by Wick et al. (2022) significantly improved the academic performance and overall success of high-risk students. The high-risk students exhibited improved retention rates during the intervention years (p < 0.001), and their 4- and 6-year graduation rates were notably superior (p < 0.05 and p < 0.001, respectively) compared to the rates of similar students from the pre-intervention period. Wick et al. (2022) also demonstrated that the high-risk students who participated in the interventions were more successful in early foundation STEM courses than their peers from the pre-intervention years.
However, our prior work did not explore the specific impact of these interventions on URM and female students in the High-Risk category. URM and female students may have different academic needs due to varying levels of preparation and different experiences in their educational journeys. URM students often encounter systemic barriers, including stereotype threats and microaggressions, which can hinder their academic progress and sense of belonging in STEM fields (Sue et al., 2007; Torres et al., 2010). These experiences can negatively impact their psychological well-being, engagement, and retention in STEM programs. Likewise, female students in STEM face different barriers such as gender stereotypes, lack of role models, and male-dominated cultures (UNESCO, 2023; AAUW, 2023). Therefore, there is a need to explore the specific impact of targeted interventions on these groups separately.
To this end, this study extends our prior work to high-risk URM and female students. For this study, we identified an average of 145 high-risk students per cohort year, of which 9.5% identified as URM students and 22% identified as female. On average, < 3% of the high-risk students identified as both URM and female. While our limited sample size did not permit us to explore a deeper analysis of students at the intersection of these groups, namely the sub-group of high-risk URM women, there is merit in expanding our understanding of the outcomes of these groups separately, with the hope of revealing potential overlap. Specifically, we examine the first- and second-year STEM retention rates and the 4- and 6-year graduation rates for these groups. Section 2.1 details the methodology for comparing pre-intervention and post-intervention groups.
Understanding how these interventions influenced various groups is crucial. Given the already higher STEM retention and 6-year graduation rates (Wick et al., 2022), developing a predictive model for these outcomes is less crucial. Hence, this study focuses on developing predictive models for the 4-year graduation (on-time graduation) of high-risk students and their subgroups before and after the intervention. These predictive models, detailed in Section 2.3, will provide valuable insights into the mechanisms by which the interventions affected high-risk students.
While building the predictive models, it is important to justify the potential predictors used. Some researchers have linked SAT scores to various aspects of success in college. Chissom and Lanier (1975) found that SAT scores positively correlate with first-year GPA. Similarly, Rohr (2012) identified the aggregate SAT score as one of the primary predictors of retention in STEM fields. Conversely, Boldt (2000) reported that SAT scores do not predict academic performance for students in the lower 10th percentile of SAT scores. Nevertheless, since the university historically used SAT performance as an admission criterion, we included SAT scores as potential predictors in our models.
High school GPA offers a measure of student success but lacks consistency across different schools due to varying scales. The literature does not strongly support high school GPA as a predictor of college success. Indeed, Noble and Sawyer (2002) found that even a perfect 4.0 GPA in high school did not predict a first-year college GPA above 3.0. However, Martin et al. (2006) found that high school percentile rank highly correlates with college GPA. Therefore, our analysis included high school percentile rank instead of high school GPA.
Recent research by López et al. (2022) identified academic preparedness, demographic variables, and early course performance as critical factors influencing STEM retention. Consequently, our predictive modeling includes early STEM courses such as Calculus, Physics, and Chemistry.
Definitions of high-risk, URM, and female students: Our definition of underrepresented minority (URM) includes the following domestic demographic categories for race/ethnicity: Black/African American, Hispanic, American Indian/Alaska Native, and Native Hawaiian or Other Pacific Islander. We have excluded international students from this analysis due to the focus on domestic demographics. For the collection of data on sex and race/ethnicity, we relied on self-identified data. Consequently, our URM student group encompasses female URM students as well. Likewise, the group of female students includes all students who identified as female, irrespective of race or ethnicity. The group of all high-risk students includes individuals categorized as high-risk, irrespective of their sex, race, or ethnicity. We excluded students whose sex or race/ethnicity data were unknown from the analysis.
Note that in this work, we aim to answer three research questions outlined in Section 1 enumerated as I, II, and III. We detail the methodologies employed to address these questions in Sections 2.1-2.3, respectively. Section 2.1 describes our approach to assess the impact of targeted interventions on the retention and graduation rates of high-risk URM and female students. To achieve this, we employ the two-population proportion test (Neter et al., 1996). In Section 2.2, we detail the methodology used to measure the intervention's impact on the success of these groups in early STEM courses, again utilizing the two-population proportion test. Section 2.3 focuses on identifying key factors affecting the on-time graduation of the two groups by developing logistic regression models (Cox and Snell, 1989).
Before we proceed, we define our control and treatment groups for clarity. The “URM control group” consists of URM engineering students (N1 = 38) identified as high-risk from 2006 to 2010, based on the binary classifier described in Wick et al. (2022). The “URM treatment group” includes URM engineering students (N2 = 63) classified as high-risk from 2011 to 2015. Similarly, we define the “female control group” (N1 = 118) and “female treatment group” (N2 = 166) for the same cohort years.
Given that the treatment and control groups span different years, we ensured their statistical similarity at the time of university admission by comparing SAT component scores. From 2005 to 2015, the SAT included three sections: Math, Verbal, and Writing. We used Welch's generalized t-test (Welch, 1947) to compare the SAT component scores of the two groups, confirming their comparability.
This section presents the methodology to analyze the impact of the interventions on the retention and graduation rates of URM and female engineering students.
We define first-year STEM retention as the percentage of first-year STEM major students enrolled in STEM majors at the beginning of their second year. Similarly, we define second-year STEM retention as the percentage of first-year STEM major students enrolled in STEM majors at the beginning of their third year. We compared the first & second-year retention rates as well as the 4 and 6-year graduation rates before and after the interventions. To this effect, we visualized the first & second-year retention rates and 4-year graduation rates of high-risk URM engineering students for the years 2006 to 2015 using bar plots. We repeated these visualizations for high-risk female engineering students. We used the two-population proportion test (Neter et al., 1996) to obtain the statistical significance of the comparison between the control and treatment groups.
This section describes the methodology to quantify the impact of the intervention on the success rates of URM and female engineering students in foundational STEM courses: Physics I, Physics II, Calculus I, Calculus II, Chemistry I, and Chemistry II. One of our primary objectives is to measure student success in foundational STEM courses as a direct result of our interventions. We anticipate that the impact of these interventions will manifest in the short term. It is important to note that a student's success across multiple attempts at a course could result from factors other than the intervention. Moreover, including such students in the analysis could overinflate the results. Consequently, we conservatively considered only the outcome (Success or Failure) of students' first attempts at these courses to isolate the impact of the intervention, defining “success” as achieving a “C” grade or better on the first attempt. This approach ensures consistency in methodology with our previous research (Wick et al., 2022).
We used the two-population proportion test (Neter et al., 1996) to determine the statistical significance of the difference between the two groups. For Physics I, Calculus I, and Chemistry I, we defined the control groups as high-risk URM (or female) engineering students in the cohort years 2006 − 2010 who took the corresponding courses concurrently in their first semester. For the subsequent courses (Physics II, Calculus II, and Chemistry II), the control group included high-risk URM (or female) engineering students from the 2006 to 2010 cohorts who registered for these courses after passing the initial part of the corresponding courses.
The treatment group consisted of high-risk URM (or female) engineering students in the cohort years 2011 − 2015 who registered for the Engineering and Society course in the first semester and Physics I course in the second semester of their cohort year as denoted in the Alternative Pathway intervention previously described. Additionally, we mandated that students in the treatment group be registered for Calculus I and Chemistry I during the first semester of their cohort year. For the subsequent courses (Physics II, Calculus II, and Chemistry II), the “treatment group” included high-risk (URM or female) engineering students in the cohort years 2011 − 2015 who registered for these courses after passing the first part of the corresponding course.
We aimed to model the 4-year (or “on-time”) graduation rates, a crucial metric for understanding the educational outcomes of various groups of high-risk students. This section outlines the methodology used to develop these models. The response variable in these models is the 4-year graduation status, where a value of “1” indicates that a student graduated within 4 years, and “0” otherwise. To comprehensively analyze the factors influencing graduation rates, our initial set of explanatory variables included grades in foundational STEM courses, first-year GPA, high school percentile rank, SAT component scores, sex, and URM/non-URM categorization, resulting in 13 explanatory variables. We constructed models to predict 4-year graduation outcomes for the following populations:
• High-risk students of all genders and races before and after the intervention,
• High-risk URM students before and after the intervention, and
• High-risk female students before and after the intervention.
In total, we developed six distinct models to evaluate the impact of the interventions across these different groups.
Choice of the model: To develop a robust model, we evaluated several methodologies, including logistic regression, random forest, support vector machines, k-nearest neighbor algorithm, and neural networks, using five-fold cross-validation. We found that the accuracy of the logistic regression model was consistently within 5% of the other models. Additionally, the logistic regression model offers the added advantage of identifying the contribution of individual factors influencing the graduation rate. Consequently, we selected the logistic regression model for this study due to its comparative accuracy and interpretability.
Choice of explanatory variables: Selecting appropriate explanatory variables is crucial for developing an accurate model. It is particularly imperative to avoid multicollinearity between explanatory variables, as it can result in unstable and unreliable estimates of regression coefficients (Belsley et al., 2004). To address this, we began with the following explanatory variables: grades in early foundation STEM courses, first-year GPA, high school percentile rank, and SAT component scores (math, verbal, and writing). Certain categorical variables may be constant depending on the subset of students selected for the model. For example, if all the students in a subset are female, the variable “Sex” becomes constant. In such cases, we eliminate these constant variables from the list of explanatory variables. Furthermore, we addressed multicollinearity by eliminating variables with high multicollinearity using a procedure adapted from Athavale et al. (2021). The steps in this procedure are as follows:
Step 1. Compute the Variance Inflation Factor (VIF) (Belsey et al., 1980) for each explanatory variable in the model. If all the VIFs are < 5, we declare this to be the final linear model.
Step 2. If an explanatory variable has a VIF of >5, we remove the explanatory variable with the largest VIF.
Step 3. After removing a variable, it is possible to include more data points in our model. For example, after removing a certain variable, we could include students for whom that variable was not previously available.
Step 4. We construct the linear model with the remaining explanatory variables.
Step 5. Go to Step 1.
After removing factors that cause multicollinearity, we needed to select the variables that yield the optimal logistic model. To achieve this, we employed the stepwise regression technique using the backward elimination procedure (Beale et al., 1967). To evaluate the model's performance, we calculated the accuracy measure and plotted the receiver operating characteristics (ROC) curve, which illustrates Sensitivity (True Positive Rate) against Specificity (False Positive Rate). We also computed the area under the ROC curve (AuROC), with a higher AuROC value indicating a more accurate model fit.
We used Version 4.4.1 of the R programming language for the coding with the following R libraries: readxl 1.4.3, tidyr 1.3.1, car 3.1-2, dplyr 1.1.4, plyr 1.8.9, caret 6.0-94, pROC 1.18.5, e1071 1.7-16.
The results obtained for the methods described in Sections 2.1–2.3 are delineated in Sections 3.1–3.3, respectively.
It was essential to ensure that the groups are statistically similar before and after the interventions. To confirm this, we used Welch's two-tailed t-test (H0:μ1 = μ2) to confirm there was no statistically significant difference (p>0.01) in SAT component scores before and after the intervention for all high-risk students, female high-risk students, and URM high-risk students. We also conducted Welch's one-sided t-test with the null hypothesis that the groups before the intervention had SAT component scores at least as high as the group after the intervention (H0:μ1≥μ2). The p−values were >0.05 for all groups across all three sections of the SAT, indicating that we did not have significantly better-prepared students in the intervention group. In particular, the p−values for the high-risk URM group for the Math section were 0.034 and 0.983 for the null hypotheses H0:μ1 = μ2 and H0:μ1≥μ2, respectively.
Therefore, any academic improvement observed after the intervention cannot be attributed to better-prepared students in the intervention group. Consequently, we proceeded with the quantitative analysis of the intervention's impact on these groups. Figure 1 presents boxplots for high-risk URM students, while the Supplementary material provides similar boxplots for all high-risk and high-risk female students for completeness.
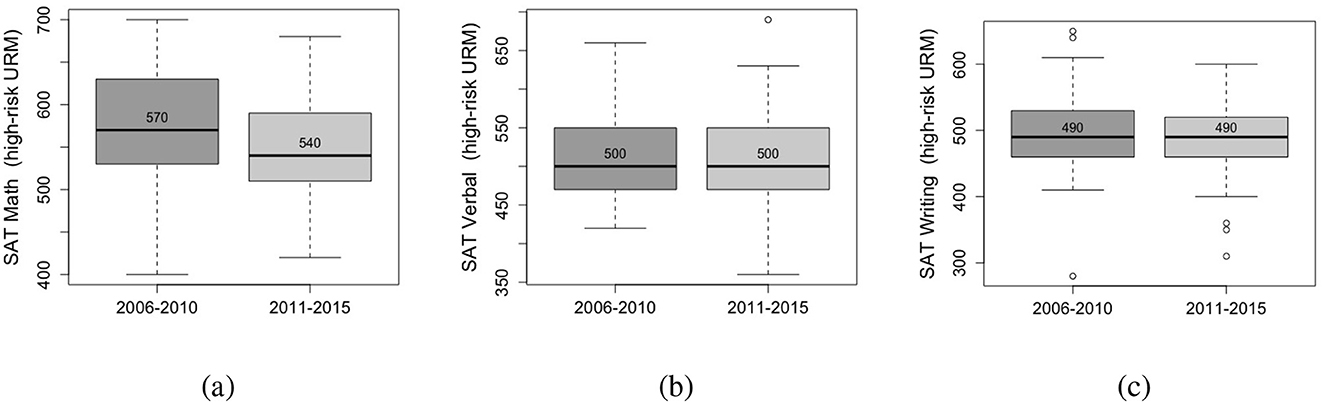
Figure 1. Boxplots showing the SAT component scores before (control) and after (treatment) the intervention for high-risk URM students in (A) Math (p = 0.034), (B) Verbal (p = 0.594), and (C) Writing sections (p = 0.387). The p−values >0.01 confirm that the two groups are similar with respect to their SAT scores in all three components.
Figures 2, 3 illustrate the STEM retention and graduation rates for high-risk URM and female engineering students, respectively. Tables 1, 2 provide the corresponding rates and raw numbers along with the p−values from the two-population proportion tests.
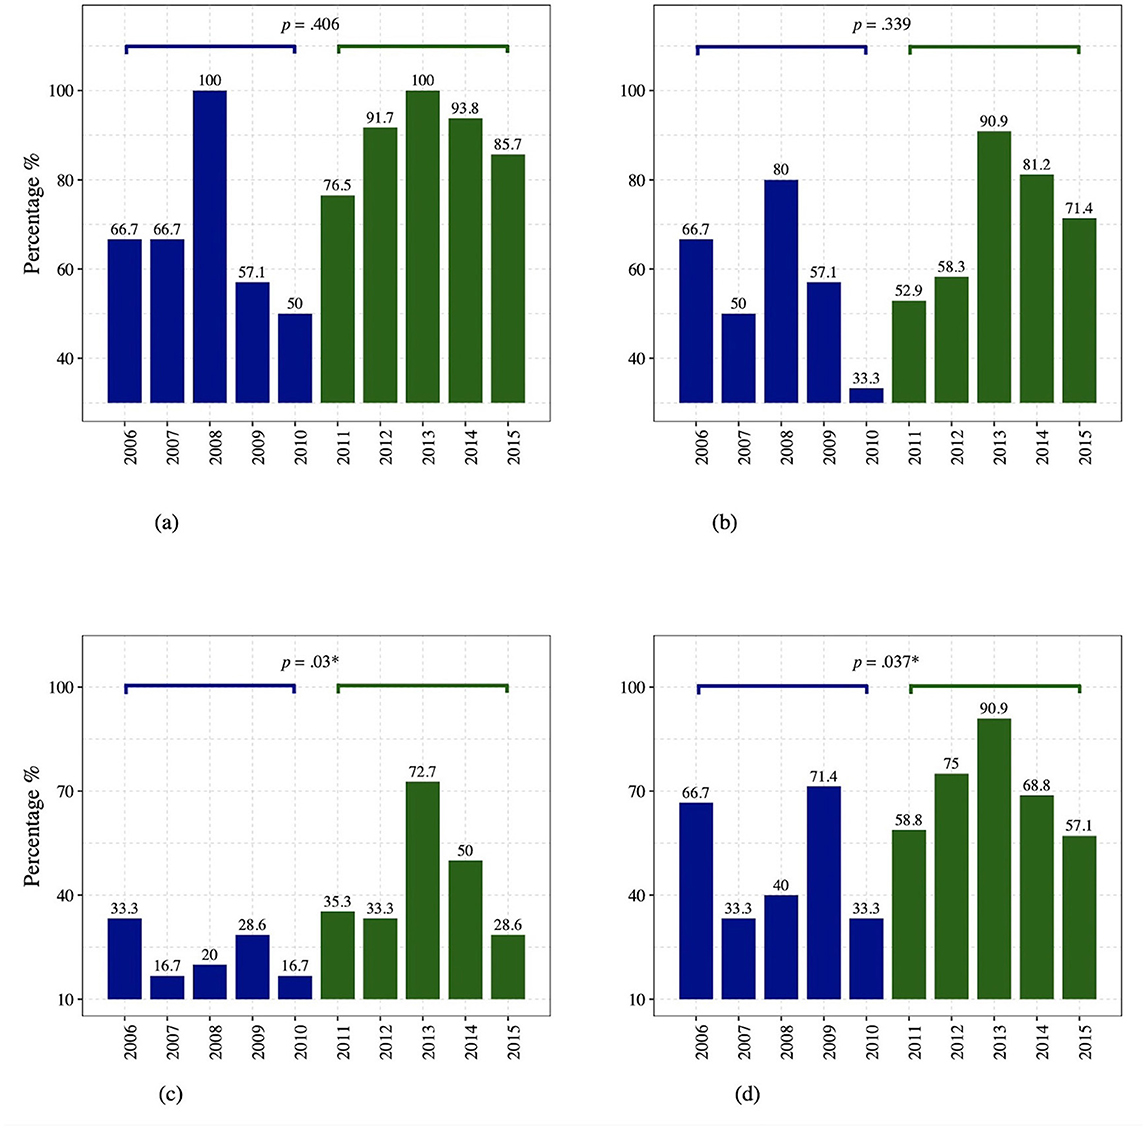
Figure 2. The first row shows the (A, B) First and Second-year STEM retention for the URM engineering students in the High-Risk group. The second row shows the (C, D) 4- and 6-year graduation rates for the URM engineering students in the High-Risk group. ***p < 0.001,** p < 0.01,* p < 0.05.
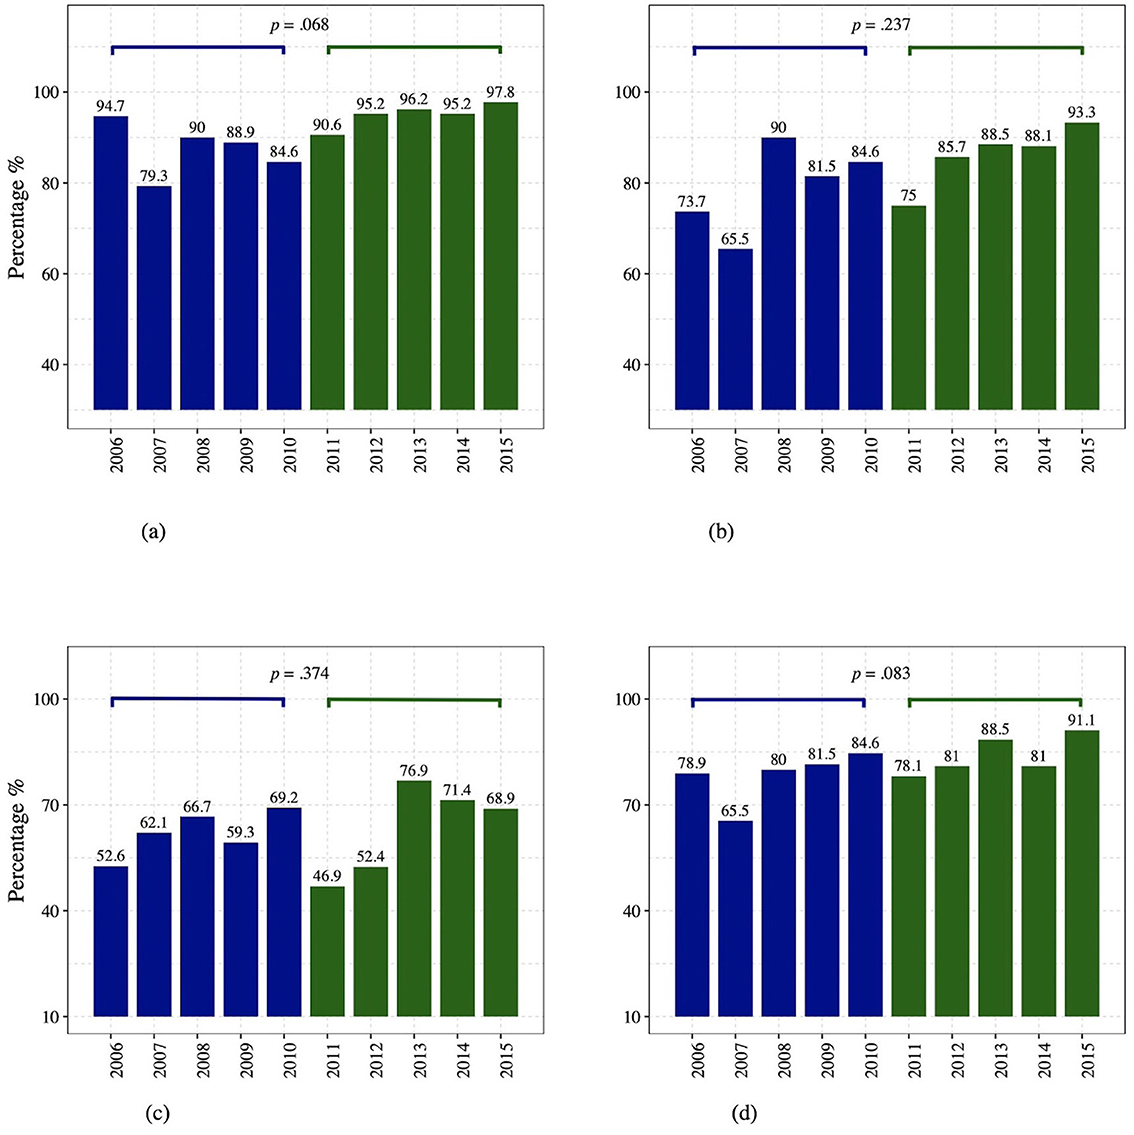
Figure 3. The first row shows the (A, B) First and Second year STEM retention for the female engineering students in the High-Risk group. The second row shows the (C, D) 4- and 6-year graduation rates for the female engineering students in the High-Risk group.
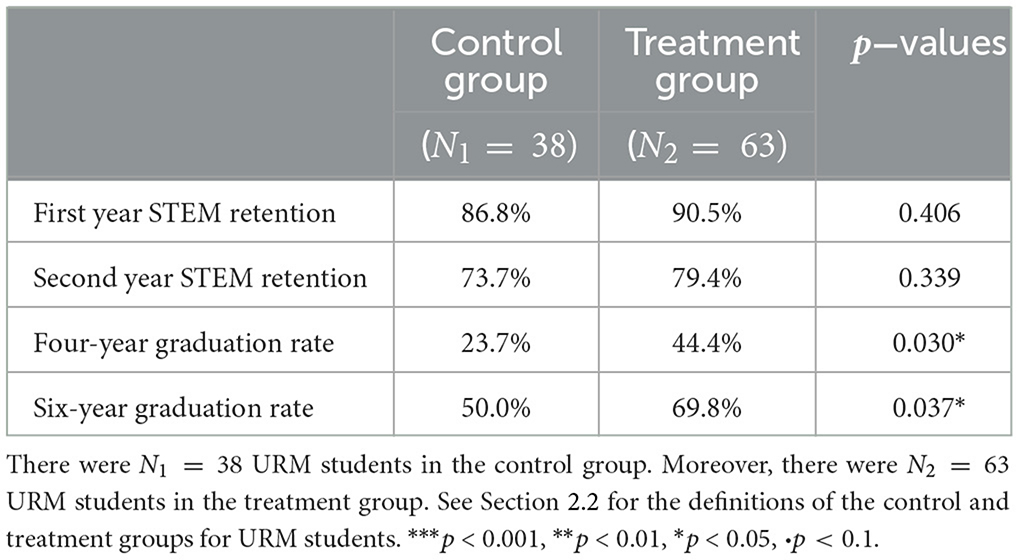
Table 1. Success rates for URM students in the control group and the treatment group along with the p−values for the two-population proportion tests.
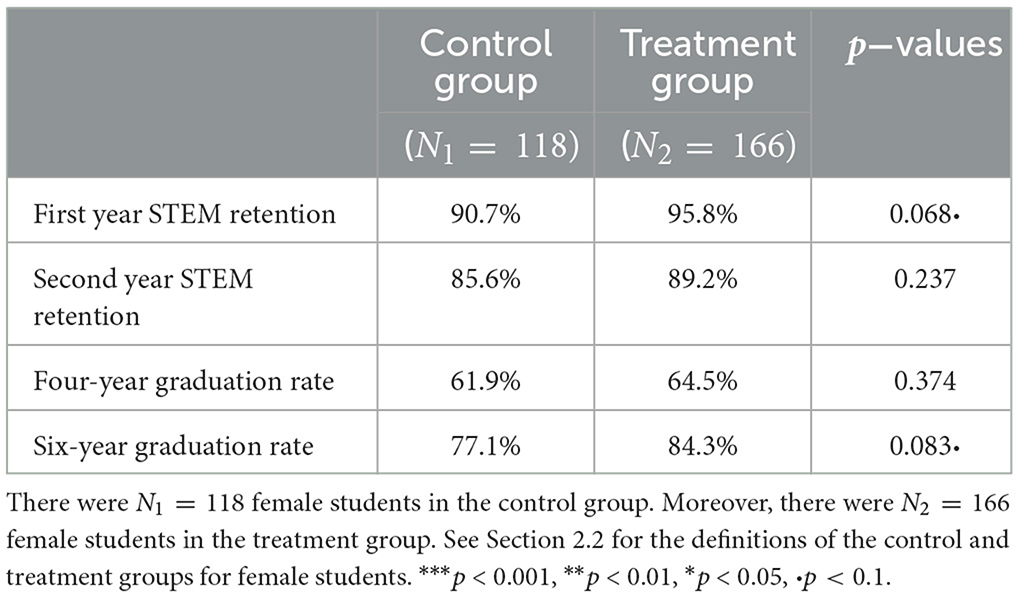
Table 2. Success rates for female students in the control group and the treatment group along with the p-values for the two-population proportion tests.
For URM high-risk students in the control group (2006–2010), the first-year STEM retention rate was 86.8% (of 38 students). This rate improved to 90.5% (of 63 students) in the treatment group (2011–2015), though the improvement was not statistically significant (p>0.05). Similarly, the second-year STEM retention improved from 73.7% in the control group to 79.4% in the treatment group, which was also not statistically significant (p>.05). The 4-year graduation rate for URM students in the treatment group was 44.4%, significantly higher (p < 0.05) than the 23.7% observed in the control group. Additionally, the 6-year graduation rate for the URM students in the treatment group was 69.8% (of 63 students), significantly better (p < 0.05) than the 50% (of 38 students) in the control group.
High-risk female engineering students in the treatment group showed a first-year STEM retention rate of 95.8% (of 166 students), higher than the 90.7% (of 118 students) in the control group. This improvement was marginally significant (p < 0.1). The second-year STEM retention rate for female students was 89.2% in the treatment group, compared to 85.6% in the control group, though this difference was not statistically significant (p>0.05).
High-risk female students in the treatment group exhibited higher 4-year and 6-year graduation rates compared to the control group. Specifically, 64.5% of 166 high-risk females in the treatment group graduated in 4 years, compared to 61.9% of 118 in the control group, though this difference was not statistically significant (p>0.05). The 6-year graduation rate for high-risk females was 84.3% in the treatment group versus 77.1% in the control group, with this improvement being only marginally significant (p < 0.1).
High-risk students demonstrated improved success rates during the intervention years in early foundational STEM courses (Wick et al., 2022). Following this trend, high-risk female students in the treatment group exhibited significantly greater success than those in the control group in Physics I and Calculus I, with p-values of 0.002 and 0.03, respectively. However, this improvement did not extend to other early STEM courses. Furthermore, we observed no statistically significant improvement in the performance of URM students in early foundational STEM courses. We show the details of these results in Figures 4, 5.
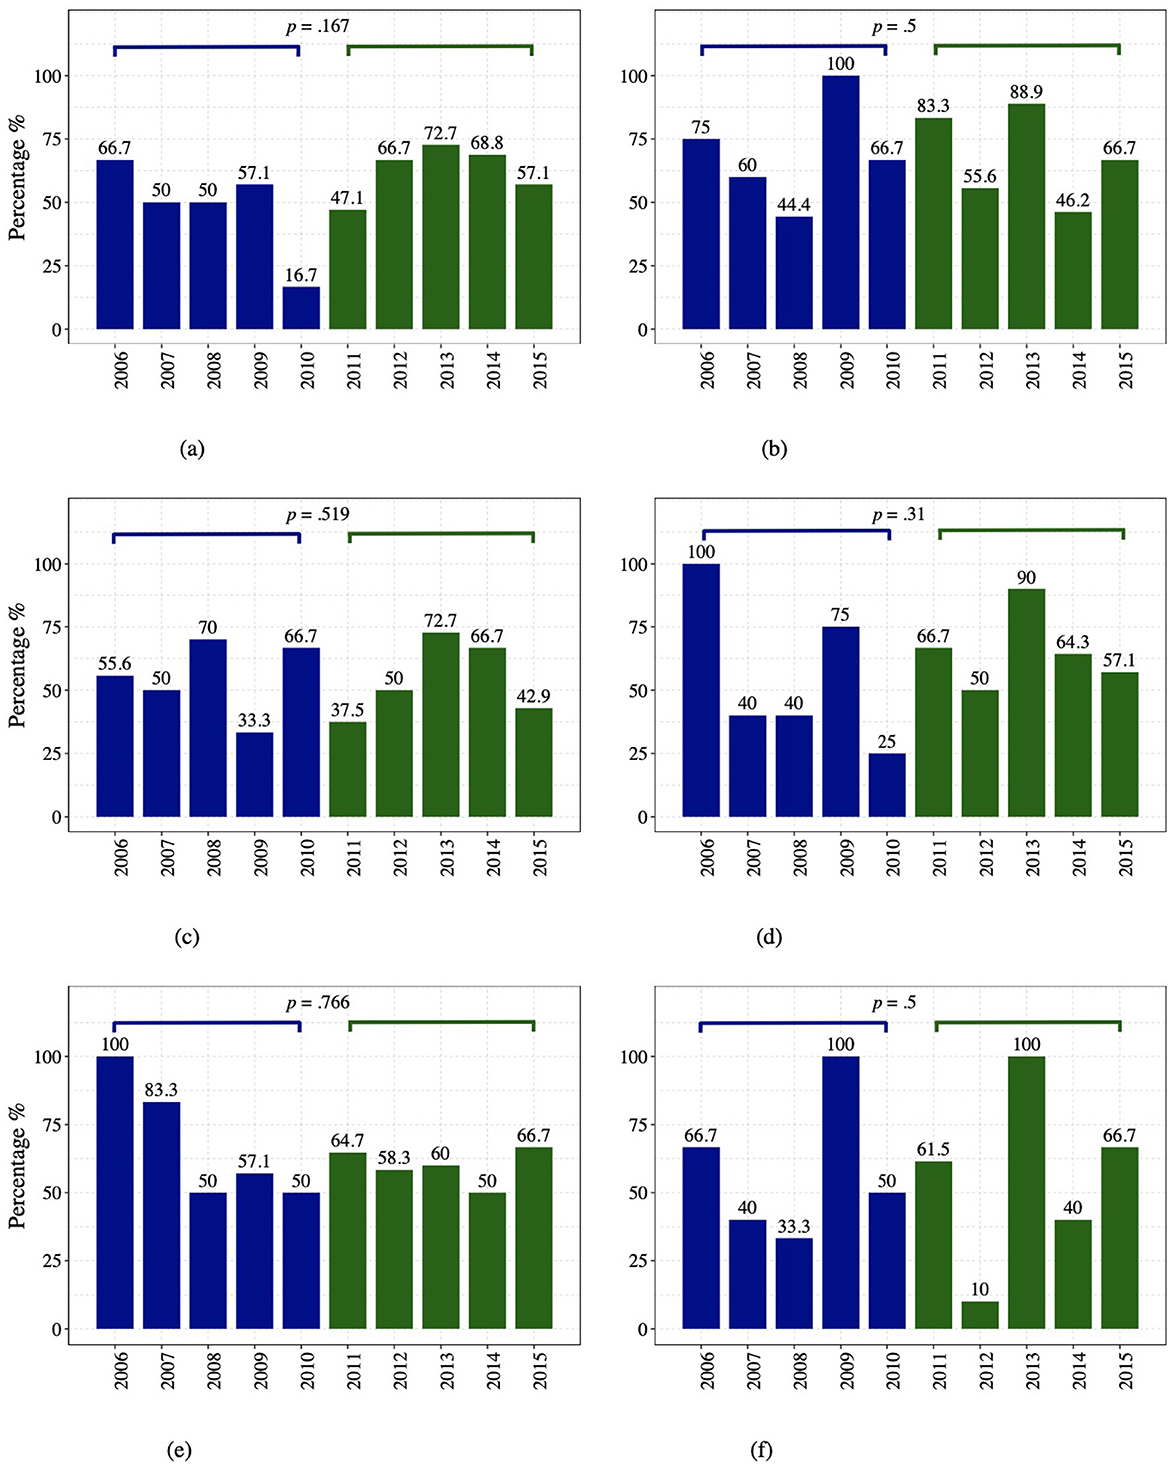
Figure 4. The success rates of High-Risk URM students in the early foundation STEM courses from the cohort years Fall 2006 − 2015. The success rates in the pre-intervention years (Fall 2006 − 2010) are shown in blue, whereas the post-intervention years (Fall 2011 − 2015) are in green. The significance levels and the p-values indicating the differences in the pre-intervention and intervention years are shown in the individual graphs. ***p < 0.001,**p < 0.01,*p < 0.05. (A) Physics I success rate. (B) Physics II success rate. (C) Calculus I success rate. (D) Calculus II success rate. (E) Chemistry I success rate. (F) Chemistry II success rate.
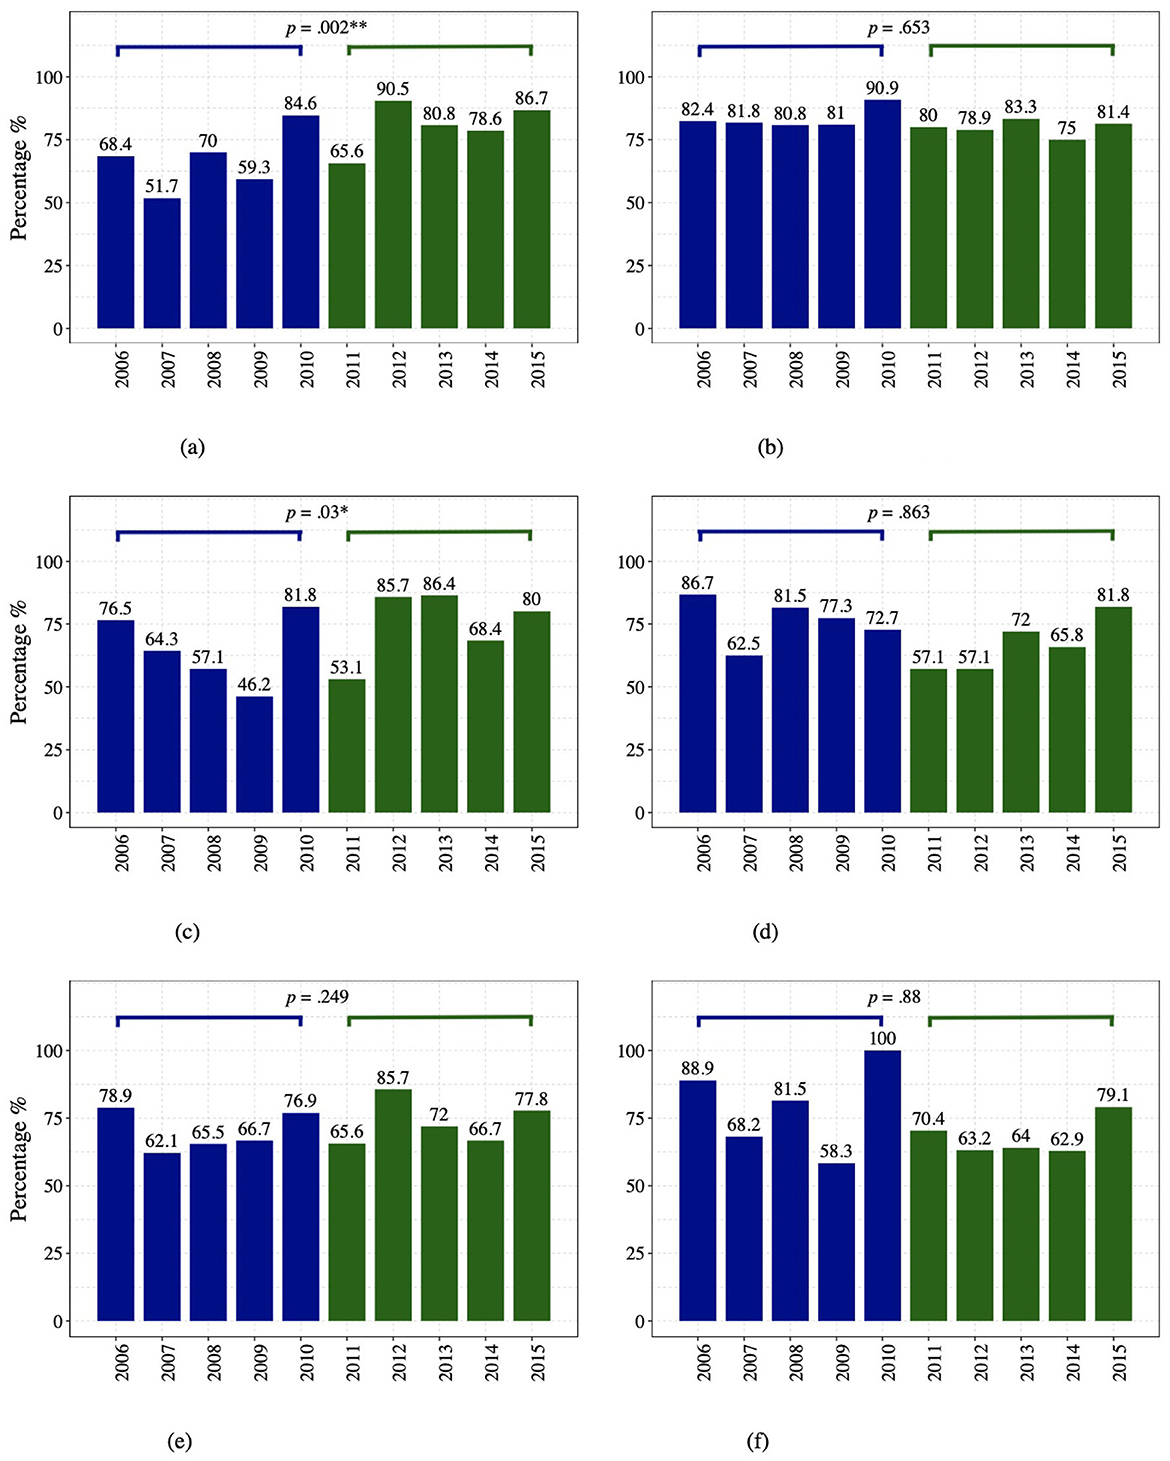
Figure 5. The success rates of High-Risk female students in the early foundation STEM courses from the cohort years Fall 2006 − 2015. The success rates in the pre-intervention years (Fall 2006 − 2010) are shown in blue, whereas the post-intervention years (Fall 2011 − 2015) are in green. The significance levels and the p-values indicating the differences in the pre-intervention and intervention years are shown in the individual graphs. ***p < 0.001,**p < 0.01,*p < 0.05. (A) Physics I success rate. (B) Physics II success rate. (C) Calculus I success rate. (D) Calculus II success rate. (E) Chemistry I success rate. (F) Chemistry II success rate.
Tables 3–8 present the results of the models discussed in Section 2.3. These tables list the variables retained in the final model after stepwise backward elimination, along with their coefficients, 95% profile likelihood-based confidence intervals (Cox and Snell, 1989), and corresponding p-values. Additionally, we report the accuracy of each model, the area under the receiver operating characteristic curve (AuROC), the Akaike information criterion (AIC) (Akaike, 1974), and the null and residual deviance with the corresponding degrees of freedom.
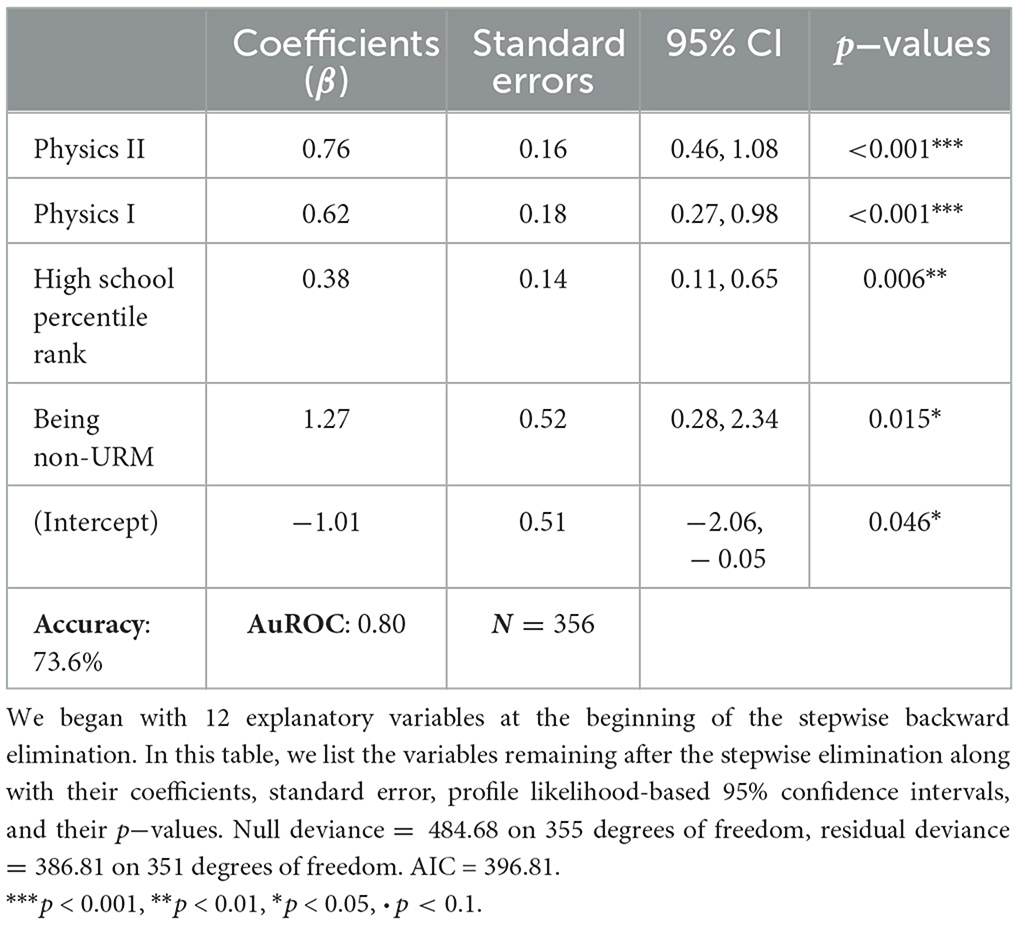
Table 3. The pre-intervention model on-time graduation for all 356 high-risk students.
Tables 3, 4 display the results of the 4-year graduation model for all high-risk students before and after the intervention, respectively. Both models excluded the explanatory variable “First year GPA” due to high variance inflation factor (VIF) indicating multicollinearity. Consequently, the stepwise regression procedure included 12 explanatory variables.
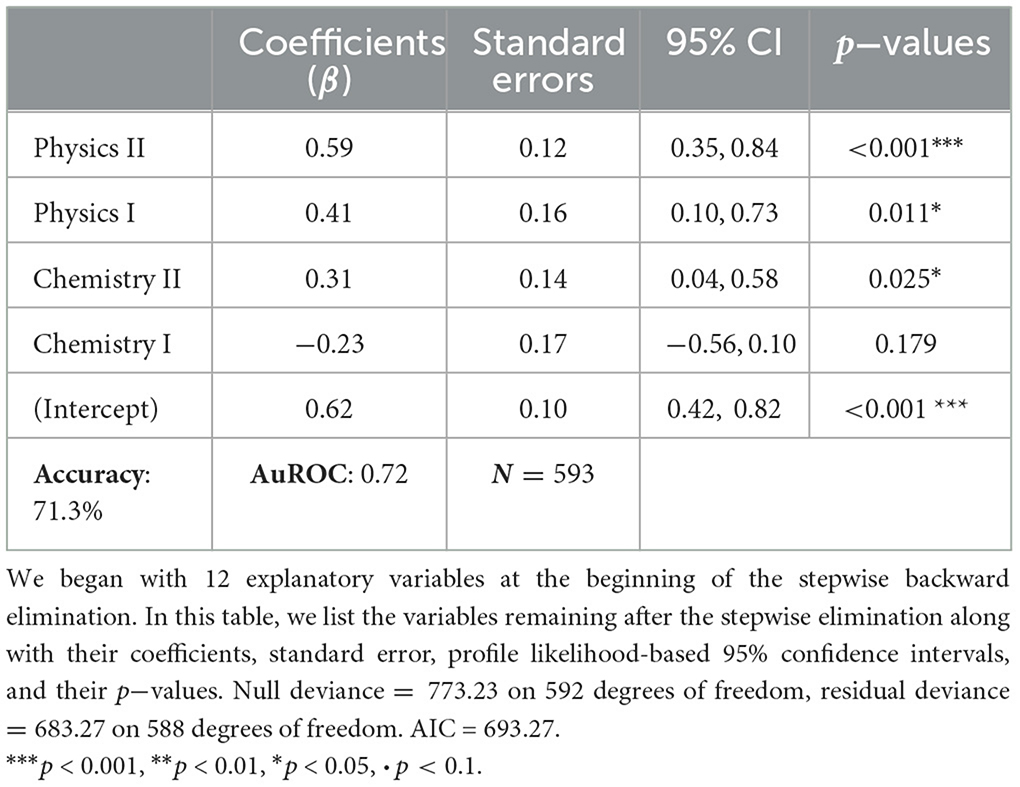
Table 4. The post-intervention model for on-time graduation for all 593 high-risk students.
In both models, grades in Physics II emerged as the most significant factor (p < 0.001). Before the intervention, Physics I grade was more significant (p < 0.001) than after the intervention (p = 0.011). High school percentile rank was a significant predictor before the intervention (p = 0.006), but it did not appear among the predictors in the post-intervention model.
Prior to the intervention, being from a non-URM group was positively associated with on-time graduation (p = 0.015), whereas this variable was not a predictor in the post-intervention model. The models for all high-risk students before and after the intervention had accuracy of 73.6 and 71.3%, respectively.
Tables 5, 6 present the results of the 4-year graduation model for high-risk URM students before and after the intervention, respectively. Since these models focus exclusively on URM students, the URM status variable was constant and therefore excluded.

Table 5. The pre-intervention model for on-time graduation for 30 high-risk URM students.
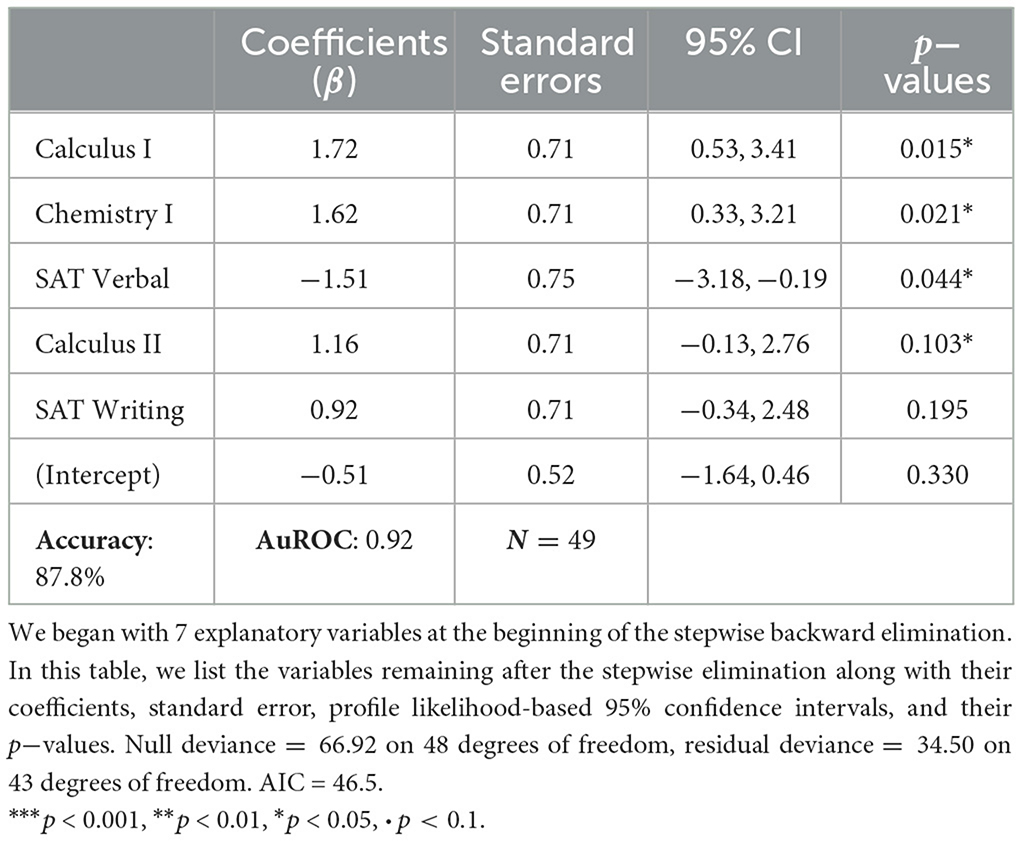
Table 6. The post-intervention model for on-time graduation for 49 high-risk URM students.
To construct these models, complete data for all considered variables was required. Consequently, the number of students included in the models—30 in the pre-intervention and 49 in the post-intervention was slightly lower than the number of students in the control group (38) and the treatment group (63) shown in Table 1, as some students were exempt from SAT scores. This pattern was also observed for female students, as shown in Tables 7, 8. In the pre-intervention model, variables such as First-Year GPA, Physics I & II, Chemistry I & II, and Calculus I were eliminated due to high variance inflation factors (VIF). In the post-intervention model, First-Year GPA, high school percentile rank, Physics I & II, and SAT math scores were excluded for the same reason. This resulted in six explanatory variables for the pre-intervention model and seven for the post-intervention model after stepwise elimination.
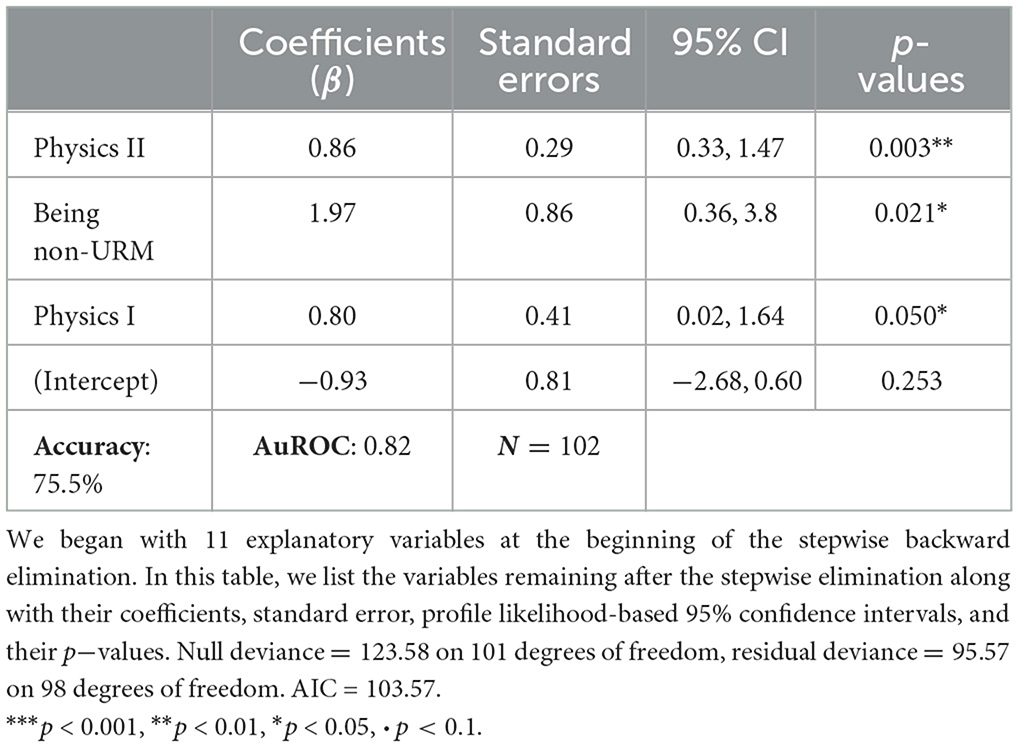
Table 7. The pre-intervention model for on-time graduation for 102 high-risk female students.
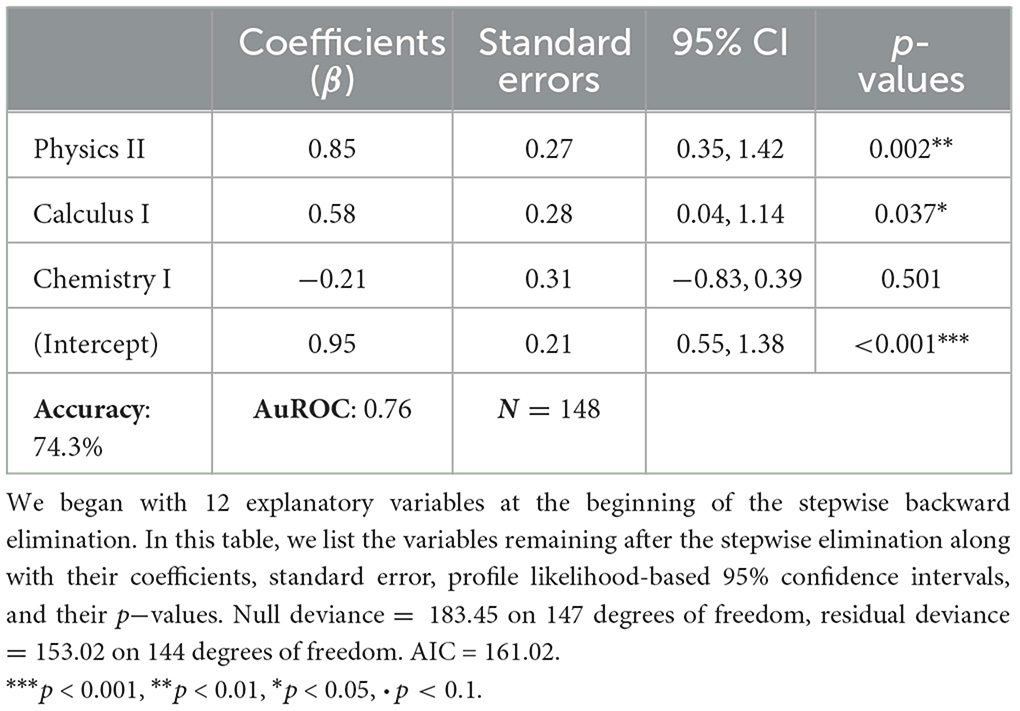
Table 8. The post-intervention model for on-time graduation for 148 high-risk female students.
In the pre-intervention model, the Calculus II grade was the only significant predictor (p = 0.02). Whereas the post-intervention model identified grades in Calculus I, Chemistry I, SAT Verbal, and Calculus II as significant predictors of 4-year graduation (p < 0.05).
The accuracy of the pre-intervention model was 83.3%, while the post-intervention model achieved an accuracy of 87.8%.
Tables 7, 8 present the results of the 4-year graduation models for high-risk female students before and after the intervention, respectively. The variable “Sex” was constant for all students in this group and was therefore removed from the models. Additionally, “First Year GPA” was excluded from the pre-intervention model due to the high variance inflation factor (VIF).
In both models, “Physics II grade” emerged as the most significant predictor (p < 0.01). In the pre-intervention model, “Physics I grade” was also a significant predictor (p = 0.05). However, in the post-intervention model, “Calculus I grade” became the second most significant predictor (p = 0.037).
Consistent with the models for all high-risk students (see Tables 3, 4), being from a non-URM group was a significant predictor in the pre-intervention model (p = 0.021) but not in the post-intervention model.
The accuracy of the pre-intervention model was 75.5%, while the post-intervention model had an accuracy of 74.3%.
The results of this study provide significant insights into the impact of targeted interventions on the academic success of high-risk underrepresented minority (URM) and female engineering students.
We analyzed the retention and graduation rates of high-risk URM and female students pre-and post-intervention. As delineated in Section 3.1 and showcased in Table 1, there is a marked improvement in both 4- and 6-year graduation rates among high-risk URM students, with an increase of nearly 20 percentage points in each. This is a significant finding for the URM students that is approximately double the 10 percentage point increase that we reported in our prior work for all high-risk students. Notably, this rise is observed even with increased URM student enrollment at the university. While high-risk female students also demonstrated progress in STEM retention during the first 2 years and in 4- and 6-year graduation rates, these increases were not statistically significant. Nevertheless, they experienced a significant improvement in Physics I and Calculus I course performance after interventions were implemented. Contrarily, performance in early foundation STEM courses displayed no statistically significant improvement for URM high-risk students.
Furthermore, we formulated logistic regression models to understand factors impacting the success of high-risk students. Table 3 reveals that grades in Physics I and II were significant indicators (p < 0.001) of the on-time graduation of the high-risk students before the intervention. Post-intervention, as shown in Table 4, the influence of Physics I waned (p < 0.05), likely due to its intentional delay and decoupling from Calculus I for the treatment group.
Interestingly, the high school percentile rank was an important predictor (p = 0.006) of on-time graduation before the intervention. This reliance diminished post-intervention, suggesting the intervention may have neutralized students' lack or gaps in prior educational preparation on their college-level success. Additionally, the pre-intervention model marked non-URM status as significant for on-time graduation (p = 0.015). This factor became non-predictive post-intervention, hinting at a potential leveling of the playing field for URM students due to the intervention.
For URM students, pre-intervention data highlighted Calculus II as the sole significant predictor for on-time graduation. Post-intervention, however, four nearly equally significant factors emerged. Intriguingly, SAT verbal scores were inversely related to on-time graduation for high-risk URM students. The inverse relationship between SAT verbal scores and on-time graduation for URM students may be an indication of underlying biases. Studies by Freedle (2006) and Santelices and Wilson (2010) noted discrepancies in SAT verbal items between African American and White students which may reflect systemic biases that underestimate the potential of African American students.
Evaluating models for high-risk female students (as seen in Tables 7, 8), the significant predictor of being a non-URM student pre-intervention (p = 0.021) was no longer apparent post-intervention, emphasizing the intervention's efficacy in assisting female URM students at risk.
Before the intervention, Physics I grades were pivotal in predicting on-time graduation for all high-risk students, particularly female students. However, this predictive capacity was absent post-intervention across all groups, possibly highlighting the positive implications of the decision to delay Physics I for high-risk students.
This change in significant predictors underscores the dynamic nature of academic success factors, as also noted by López et al. (2022). It suggests that the interventions not only provided immediate support but also altered the pathways to academic success. López et al. (2022) highlighted similar findings, where tailored interventions in academic settings led to changes in the predictive power of various success factors. They emphasized that interventions could address underlying inequities, thereby transforming the predictors of success.
We note that our findings align with recent literature, which underscores the importance of nuanced interventions in STEM education. Specifically, as noted earlier, Ghazzawi et al. (2021) emphasizes the role of contextual and culturally responsive pedagogy in enhancing the engagement and retention of URM students in STEM disciplines. This aligns with our findings, suggesting the need for more context-specific interventions for URM students. Additionally, our approach of quantitative analysis to STEM education is supported by Aulck et al. (2017), who present their own predictive methods for STEM attrition. Indeed, the improvements observed in female students' performance in Physics I and Calculus I are consistent with the benefits of tailored academic support highlighted by Aulck et al. (2017). Furthermore, the work by López et al. (2022) highlights the critical role of tailored support systems, such as mentoring and academic support services, in improving outcomes for URM students in STEM, resonating with our observations on the impact of interventions on URM students. These recent works suggest that ongoing evaluation and refinement of intervention strategies, incorporating the latest research insights, are crucial for enhancing the efficacy of these programs. By continually adapting our approaches to the evolving needs of URM and female STEM students, we can more effectively foster an inclusive and supportive educational environment.
One of the limitations of this study is that we investigated educational intervention within a private university. Additionally, the sample sizes for URM and female subgroups were limited. To remedy these limitations, in future we plan to include larger, more diverse samples from multiple institutions, incorporate qualitative measures, and examine the detailed implementation and differential impacts of interventions on various subgroups.
One notable aspect of this study is its comprehensive scope, encompassing data from cohorts spanning 2006 to 2015 and following students through to their graduation in 2021. This extensive 16-year timeframe provides a robust longitudinal perspective, allowing for in-depth analysis of long-term trends and outcomes. While replicating such a study would require a similar timeframe and substantial organizational effort, the valuable insights gained are significant. By sharing these findings, we aim to contribute to the body of knowledge in STEM education, providing a strong foundation for future research and interventions that can build upon our work.
Our study demonstrates that the implemented interventions had a positive impact on URM and female high-risk students, though the effects differed for each group. This differentiation underscores the need for more tailored and course-specific intervention strategies to address the unique challenges faced by these student cohorts.
In particular, the findings suggest that high-risk URM students would benefit significantly from interventions specifically focused on early mathematics courses. In contrast, high-risk female students would benefit from targeted interventions in Physics. Additional support through tutoring and remedial courses for these groups could further enhance the effectiveness of the interventions. We observe that the intervention changes the significance of factors in the predictive model. This phenomenon emphasizes the need for continuous assessment of the model and support strategies.
Moreover, we should consider refining existing programs based on detailed feedback and performance data from these groups. Our predictive analysis indicates that the significance of Physics I grades in predicting on-time graduation diminished post-intervention, likely due to the strategic delay in taking this course for high-risk students. This finding suggests that the intentional and strategic sequencing of other STEM courses may have similar implications and warrants further investigation.
The current study extends our previous work by assessing the impact of interventions aimed at high-risk students, with a particular focus on underrepresented minority (URM) and female engineering students. Our primary objective was to determine the efficacy of these interventions in improving retention and success in early STEM foundation courses and, ultimately, the 4- and 6-year graduation rates.
Our findings reveal a significant positive shift in the performance metrics of high-risk URM students post-intervention, particularly in the 4- and 6-year graduation rates. This outcome is especially noteworthy given the increasing enrollment of URM students at the university during this period. While there were noticeable improvements in retention and graduation rates for high-risk female students, these improvements were not statistically significant. However, their performance in early foundation STEM courses, particularly Physics I and Calculus I, showed notable improvement post-intervention.
The logistic regression models further revealed some encouraging trends. For all high-risk students, the importance of Physics I grades in predicting on-time graduation declined post-intervention, likely due to the strategic delay in introducing this course. This supports the original rationale of delaying the calculus-based Physics I course for the least prepared students to allow them focused time to achieve a basic level of proficiency in Calculus before needing to apply it in learning Physics. Interestingly, for all high-risk students and in particular for high-risk female students, the factor of being non-URM lost its significance post-intervention. This suggests the intervention's success in equalizing opportunities and nullifying any potential advantage of being non-URM in achieving on-time graduation. While sample size limitations prohibited a formal and separate analysis of the intersectionality of the URM and female groups, this observation hints at a positive impact of the interventions for high-risk URM women.
The shift in the significance of predictors post-intervention across all groups underscores the profound influence the intervention had on high-risk students. The strategies implemented, including the restructured course schedule and additional training modules, have positively redirected the paths of students who might have otherwise struggled. Our study indicates that the intervention had differing positive impacts on high-risk URM and female students. This supports the need for an even more tailored approach in future STEM pathway designs specific to these groups and invites continued investigation into similar interventions aimed at enhancing success for our most at-risk student populations.
The raw data supporting the conclusions of this article will be made available by the authors, without undue reservation.
The studies involving humans were approved by Institutional Review Board, Clarkson University. The studies were conducted in accordance with the local legislation and institutional requirements. Written informed consent for participation was not required from the participants or the participants' legal guardians/next of kin because it was not required in accordance with the national legislation and institutional requirements.
EA: Data curation, Software, Visualization, Writing – review & editing. MR: Data curation, Writing – review & editing. DW: Writing – review & editing. SM: Validation, Writing – review & editing. PA: Formal analysis, Software, Writing – original draft, Writing – review & editing.
The author(s) declare that no financial support was received for the research, authorship, and/or publication of this article.
We are grateful for the many years of support from Dr. Anthony G. Collins, the former President of Clarkson University. We acknowledge the significant contributions of Dr. Peter Turner, former Dean of the School of Arts & Sciences, Dr. Goodarz Ahmadi, former Dean of the Coulter School of Engineering, and other faculty who served on the First-Year Council at Clarkson University.
The authors declare that the research was conducted in the absence of any commercial or financial relationships that could be construed as a potential conflict of interest.
The author(s) declared that they were an editorial board member of Frontiers, at the time of submission. This had no impact on the peer review process and the final decision.
All claims expressed in this article are solely those of the authors and do not necessarily represent those of their affiliated organizations, or those of the publisher, the editors and the reviewers. Any product that may be evaluated in this article, or claim that may be made by its manufacturer, is not guaranteed or endorsed by the publisher.
The Supplementary Material for this article can be found online at: https://www.frontiersin.org/articles/10.3389/feduc.2025.1435279/full#supplementary-material
AAUW (2023). The STEM Gap: Women and Girls in Science, Technology, Engineering and Mathematics. Washington, DC: American Association of University Women.
Akaike, H. (1974). A new look at the statistical model identification. IEEE Trans. Automat. Contr. 19, 716–723. doi: 10.1109/TAC.1974.1100705
Anderson, E., and Kim, D. (2006). Increasing the success of minority students in science and technology. Washington, DC: American Council on Education.
Athavale, P., Kumar, V., Clark, J., Mondal, S., and Sur, S. (2021). Differential impact of COVID-19 risk factors on ethnicities in the United States. Front. Public Health 9:743003. doi: 10.3389/fpubh.2021.743003
Aulck, L., Aras, R., Li, L., L'Heureux, C., Lu, P., and West, J. (2017). STEM-ming the tide: predicting STEM attrition using student transcript data. arXiv [Preprint]. arXiv:1708.09344. doi: 10.48550/arXiv.1708.09344
Beale, E., Kendall, M., and Mann, D. (1967). The discarding of variables in multivariate analysis. Biometrika 54, 357–366. doi: 10.1093/biomet/54.3-4.357
Belsey, D. A., Kuh, E., and Welsch, R. E. (1980). Regression Diagnostics: Identifying Influential Data and Sources of Collinearity. New York, NY: John Wiley & Sons. doi: 10.1002/0471725153
Belsley, D. A., Kuh, E., and Welsch, R. E. (2004). Regression Diagnostics: Identifying Influential Data and Sources of Collinearity. Hoboken, NJ: John Wiley & Sons.
Boldt, K. E. (2000). Predicting academic performance of high-risk college students using Scholastic Aptitude Test scores and noncognitive variables. Raleigh, NC: North Carolina State University.
Chapman, E. A., Wultsch, E. M., DeWaters, J., Moosbrugger, J. C., Turner, P. R., Ramsdell, M. W., et al. (2015). “Innovating engineering curriculum for first-year retention,” in 2015 ASEE Annual Conference & Exposition (Seattle, WA), 26–967. doi: 10.18260/p.24304
Chen, X. (2013). STEM attrition: college students' paths into and out of STEM fields. Statistical analysis report. NCES 2014-001. Washington, DC: National Center for Education Statistics.
Cheryan, S., Ziegler, S. A., Montoya, A. K., and Jiang, L. (2017). Why are some STEM fields more gender balanced than others? Psychol. Bull. 143, 1–35. doi: 10.1037/bul0000052
Chissom, B. S., and Lanier, D. (1975). Prediction of first quarter freshman GPA using sat scores and high school grades. Educ. Psychol. Meas. 35, 461–463. doi: 10.1177/001316447503500227
Freedle, R. O. (2006). How and why standardized tests systematically underestimate African-Americans' true verbal ability and what to do about it: towards the promotion of two new theories with practical applications. St. John's Law Rev. 80, 183–226.
Ghazzawi, D., Pattison, D., and Horn, C. (2021). Persistence of underrepresented minorities in STEM fields: are summer bridge programs sufficient? Front. Educ. 6:630529. doi: 10.3389/feduc.2021.630529
Griffith, A. L. (2010). Persistence of women and minorities in STEM field majors: Is it the school that matters? Econ. Educ. Rev. 29, 911–922. doi: 10.1016/j.econedurev.2010.06.010
Guay, R. (1977). Purdue Spatial Visualization Test - Visualization of Rotations. Lafayette, IN: Purdue Research Foundation.
Haeger, H., and Fresquez, C. (2016). Mentoring for inclusion: the impact of mentoring on undergraduate researchers in the sciences. CBE - Life Sci. Educ. 15:ar36. doi: 10.1187/cbe.16-01-0016
Hill, C., Corbett, C., and St Rose, A. (2010). Why so few? Women in science, technology, engineering, and mathematics. Washington, DC: AAUW.
Jaspersohn, R. P. (2017). Addressing Student Success and Retention in STEM Majors Through Strategic Curriculum Pathways and Early Research Experiences. Potsdam, NY: Clarkson University.
López, N., Morgan, D. L., Hutchings, Q. R., and Davis, K. (2022). Revisiting critical STEM interventions: a literature review of STEM organizational learning. Int. J. STEM Educ. 9:39. doi: 10.1186/s40594-022-00357-9
Markle, R. S., Williams, T. M., Williams, K. S., deGravelles, K. H., Bagayoko, D., Warner, I. M., et al. (2022). Supporting historically underrepresented groups in STEM higher education: the promise of structured mentoring networks. Front. Educ. 7:674669. doi: 10.3389/feduc.2022.674669
Martin, J. H., Montgomery, R. L., and Saphian, D. (2006). Personality, achievement test scores, and high school percentile as predictors of academic performance across four years of coursework. J. Res. Pers. 40, 424–431. doi: 10.1016/j.jrp.2005.02.001
Miguel, A. M. S., and Kim, M. M. (2015). Successful latina scientists and engineers: their lived mentoring experiences and career development. J. Career Dev. 42, 133–148. doi: 10.1177/0894845314542248
Mondisa, J.-L., and McComb, S. A. (2015). Social community: a mechanism to explain the success of STEM minority mentoring programs. Mentor. Tutoring: Partnersh. Learn. 23, 149–163. doi: 10.1080/13611267.2015.1049018
Neter, J., Kutner, M. H., Nachtsheim, C. J., and Wasserman, W. (1996). Applied Linear Statistical Models, 4th Edn. Chicago, IL:Irwin.
Noble, J., and Sawyer, R. (2002). Predicting Different Levels of Academic Success in College Using High School GPA and ACT Composite Score. ACT Research Report Series 2002-2004. Iowa City, IA: ACT, Inc.
Palid, O., Cashdollar, S., Deangelo, S., Chu, C., and Bates, M. (2023). Inclusion in practice: a systematic review of diversity-focused STEM programming in the united states. Int. J. STEM Educ. 10, 1–16. doi: 10.3102/2006414
Prasanth, A., and Alqahtani, H. (2023). “Predictive modeling of student behavior for early dropout detection in universities using machine learning techniques,” in 2023 IEEE 8th International Conference on Engineering Technologies and Applied Sciences (ICETAS) (Bahrain: IEEE), 1–5. doi: 10.1109/ICETAS59148.2023.10346531
Riegle-Crumb, C., King, B., and Irizarry, Y. (2019). Does STEM stand out? Examining racial/ethnic gaps in persistence across postsecondary fields. Educ. Res. 48, 133–144. doi: 10.3102/0013189X19831006
Rohr, S. L. (2012). How well does the SAT and GPA predict the retention of science, technology, engineering, mathematics, and business students. J. Coll. Stud. Retent.: Res. Theory Pract. 14, 195–208. doi: 10.2190/CS.14.2.c
Santelices, M. V., and Wilson, M. (2010). Unfair treatment? The case of Freedle, the SAT, and the standardization approach to differential item functioning. Harv. Educ. Rev. 80, 106–134. doi: 10.17763/haer.80.1.j94675w001329270
Schalk, P. D., Wick, D. P., Turner, P. R., and Ramsdell, M. W. (2009). “Impact: integrated mathematics and physics assessment for college transition,” in 2009 39th IEEE Frontiers in Education Conference (San Antonio, TX: IEEE), 1–6. doi: 10.1109/FIE.2009.5350498
Schalk, P. D., Wick, D. P., Turner, P. R., and Ramsdell, M. W. (2011). “Predictive assessment of student performance for early strategic guidance,” in 2011 Frontiers in Education Conference (FIE) (Rapid City, SD: IEEE), S2H-1–S2H-5. doi: 10.1109/FIE.2011.6143086
Sghir, N., Adadi, A., and Lahmer, M. (2023). Recent advances in predictive learning analytics: a decade systematic review (2012–2022). Educ. Inf. Technol. 28, 8299–8333. doi: 10.1007/s10639-022-11536-0
Shaw, E. J., and Barbuti, S. M. (2010). Patterns of persistence in intended college major with a focus on STEM majors. NACADA J. 30, 19–34. doi: 10.12930/0271-9517-30.2.19
Sto Domingo, M. R., Sharp, S., Freeman, A., Freeman, T. Jr., Harmon, K., Wiggs, M., et al. (2019). Replicating Meyerhoff for inclusive excellence in STEM. Science 364, 335–337. doi: 10.1126/science.aar5540
Sue, D. W., Capodilupo, C. M., Torino, G. C., Bucceri, J. M., Holder, A. M. B., Nadal, K. L., et al. (2007). Racial microaggressions in everyday life: Implications for clinical practice. Am. Psychol. 62, 271–286. doi: 10.1037/0003-066X.62.4.271
Torres, L., Driscoll, M. W., and Burrow, A. L. (2010). Racial microaggressions and psychological functioning among highly achieving African-Americans: a mixed-methods approach. J. Soc. Clin. Psychol. 29, 1074–1099. doi: 10.1521/jscp.2010.29.10.1074
Turner, P. R. (2008). A predictor-corrector process with refinement for first-year calculus transition support. Primus 18, 370–393. doi: 10.1080/10511970601131639
UNESCO (2023). Girls' and women's education in science, technology, engineering and mathematics (STEM). Paris: UNESCO.
Welch, B. L. (1947). The generalization of ‘student's' problem when several different population varlances are involved. Biometrika 34, 28–35. doi: 10.1093/biomet/34.1-2.28
Keywords: STEM, engineering curriculum, first year, logistic modeling, retention, underrepresented minority, females in STEM
Citation: Atindama E, Ramsdell M, Wick DP, Mondal S and Athavale P (2025) Impact of targeted interventions on success of high-risk engineering students: a focus on historically underrepresented students in STEM. Front. Educ. 10:1435279. doi: 10.3389/feduc.2025.1435279
Received: 20 May 2024; Accepted: 28 January 2025;
Published: 13 February 2025.
Edited by:
Subramaniam Ramanathan, Independent Researcher, SingaporeReviewed by:
Maurice H. T. Ling, University of Newcastle, SingaporeCopyright © 2025 Atindama, Ramsdell, Wick, Mondal and Athavale. This is an open-access article distributed under the terms of the Creative Commons Attribution License (CC BY). The use, distribution or reproduction in other forums is permitted, provided the original author(s) and the copyright owner(s) are credited and that the original publication in this journal is cited, in accordance with accepted academic practice. No use, distribution or reproduction is permitted which does not comply with these terms.
*Correspondence: Prashant Athavale, cGF0aGF2YWxAY2xhcmtzb24uZWR1
Disclaimer: All claims expressed in this article are solely those of the authors and do not necessarily represent those of their affiliated organizations, or those of the publisher, the editors and the reviewers. Any product that may be evaluated in this article or claim that may be made by its manufacturer is not guaranteed or endorsed by the publisher.
Research integrity at Frontiers
Learn more about the work of our research integrity team to safeguard the quality of each article we publish.