- 1Faculty of Industrial & Systems Engineering, Tarbiat Modares University, Tehran, Iran
- 2Imam Khomeini International University, Qazvin, Iran
Background: As the intersection of artificial intelligence (AI) and education deepens, predictive analytics using machine learning (ML) and deep learning (DL) models offer novel approaches to assessing student performance in online environments. However, challenges remain in accurately predicting high achievers and identifying students at risk due to limitations in traditional assessment models. This study explores the capabilities of these models in predicting academic achievement and highlights their potential role in reshaping educational assessment paradigms.
Objectives: To evaluate the efficacy of various AI models—including Random Forest, XGBoost, and recurrent neural networks (RNNs)—in identifying at-risk students and differentiating levels of academic achievement, with an emphasis on inclusive and adaptive educational assessments. A key focus is on leveraging these models to create more inclusive and adaptive educational assessments.
Methods: We analyzed a dataset comprising interaction data from the Open University Learning Analytics Dataset (OULAD), which includes clickstream data on student interactions with course materials from over 32,000 students. The models were trained and evaluated using performance metrics such as accuracy, precision, recall, and F1-scores, specifically targeting predictions of student withdrawals and distinctions.
Results: The models effectively identified students at risk of withdrawing, with the Random Forest model achieving an accuracy of 78.68% and deep learning models approximately 77%. However, accurately predicting high achievers posed challenges, suggesting a complex relationship between interaction data and academic success. This limitation underscores the need for more nuanced modeling approaches to improve predictions for top-performing students.
Conclusion: This research demonstrates the promise of AI-driven models in enhancing educational assessments while also highlighting current limitations in capturing academic excellence. Our findings indicate a need for ongoing development of AI tools that are ethically designed and capable of supporting dynamic, inclusive assessment strategies. Future research should focus on incorporating additional factors, such as student motivation and study behaviors, to enhance predictive accuracy, particularly for high achievers. Such advancements can contribute to a more equitable and effective educational landscape.
1 Introduction
In the 21st century, technological advancements have revolutionized various sectors, including education. Online learning platforms present unique opportunities to assess and predict student performance, yet challenges remain in accurately identifying at-risk and high-achieving students in these virtual environments. These platforms offer flexible learning opportunities, making education accessible to individuals in remote and developing regions who might otherwise be unable to attend traditional university classes in person (Zhou et al., 2020; Nguyen et al., 2021).
One of the key advantages of online learning platforms is their ability to generate and store vast amounts of student learning data. This data is a valuable resource for educational research, enabling the analysis of learning behaviors and outcomes (Dahdouh et al., 2018; Hernández et al., 2019). Learning Management Systems (LMS) play a crucial role in this context by facilitating the collection of data on student activities and interactions within the online learning environment (Macfadyen and Dawson, 2010). LMSs are equipped to track and record detailed logs of student behaviors, which can then be analyzed by early warning systems to assess learning performance, identify students at risk of failure, and provide timely feedback and support (Kotsiantis et al., 2010; Lust et al., 2013).
Educational Data Mining (EDM) has emerged as a powerful approach for analyzing educational big data, utilizing techniques from machine learning, statistics, and cognitive psychology to address various educational challenges (Hashim et al., 2020). Studies have demonstrated that data from LMSs, such as logs of online activities, can be leveraged to predict student performance and identify at-risk students (Macfadyen and Dawson, 2010; Bulut et al., 2022). Studies have addressed these challenges through regression problems, which predict performance scores, and classification problems, which predict whether a student will pass, fail, or drop out.
Student behavior in online learning platforms differs from traditional classroom settings, where motivation plays a crucial role in performance (Davis et al., 2014). Numerous studies have identified various factors contributing to student performance, with time and instructor support being significant in online platforms (Fidalgo-Blanco et al., 2015; Hone and El Said, 2016; Khan et al., 2018). Additionally, predicting students’ grades for future courses has been explored, with models leveraging past course performance and initial assessments showing significant correlations (Marbouti et al., 2016; Hlosta et al., 2017).
Recent research in EDM has provided valuable insights into factors influencing student performance. For example, studies by Wardat et al. (2023) examined the impact of student characteristics on academic success, AlAli et al. (2024) evaluated Science, Technology, Engineering, and Mathematics (STEM) aligned teaching practices for gifted learners, and Khalil et al. (2023) explored strategies to enhance mathematical writing skills. These studies highlight the diverse applications of EDM in improving educational outcomes and addressing the complexities of modern educational settings.
Machine learning techniques, such as Random Forests and logistic regression, are frequently employed in these predictive models due to their robustness and ability to handle complex datasets while providing interpretable results (Marbouti et al., 2015; Leitner et al., 2017; Adnan et al., 2021). The integration of deep learning techniques into learning analytics is emerging, with studies demonstrating the effectiveness of neural networks in predicting student performance, assessing student progress, and recognizing patterns in educational (Fei and Yeung, 2015; Coelho and Silveira, 2017; Okubo et al., 2017; Alboukaey et al., 2020). Deep learning methods like Convolutional Neural Networks (CNNs) and Recurrent Neural Networks (RNNs) have shown promise in various applications, including image processing, handwriting recognition, and natural language processing (Xiang et al., 2020; Yıldırım et al., 2020; Raj et al., 2021).
Despite the progress, significant gaps remain in the application of EDM to online learning environments and current methods often fall short in predicting high achievers and require more nuanced models to effectively capture complex engagement patterns. Previous studies have predominantly focused on traditional classroom settings, with limited exploration of comprehensive LMS data detailing every student (Riestra-González et al., 2021; Hooda et al., 2022). This study aims to bridge this gap by utilizing click data from online courses to predict student academic performance and develop early warning systems. Specifically, we investigate how data mining methodologies can effectively forecast student learning outcomes using click data in a fully virtual course.
Our study addresses this gap by applying robust AI models suited for analyzing intricate student data. This research involves a substantial cohort of students enrolled in various online courses at the Open University United Kingdom (OUUK). We analyze click data collected throughout the course duration to construct predictive models for identifying students at risk and also high-achieving students. By examining the impact of click variables on academic performance, we aim to develop reliable prediction models for an early warning system using different classification algorithms. In conclusion, this study aims to evaluate the predictive power of AI models to support early interventions, contributing to more inclusive and adaptive assessment strategies in online education.
The rest of this paper is structured as follows. In Section 2, we delve into prior research on the evolution of LMS and EDM. Section 3 outlines the methodologies employed to construct the early warning model and the data collection process. Section 4 presents the experimental outcomes of the classification systems. Section 5 discusses the development and assessment of the system. Finally, Section 6 concludes the study.
2 Methods
2.1 Dataset
This study utilizes the Open University Learning Analytics Dataset (OULAD), which provides a rich source of data on student interactions within an online learning environment (Kuzilek et al., 2017). The OULAD dataset includes information on student demographics, course structure, assessments, and interactions with the virtual learning environment (VLE). The dataset encompasses the following key components:
• Student information includes details on student demographics, such as age, gender, and highest education/educational background. This information is crucial for understanding the diverse student population and analyzing how different demographic factors may influence learning behaviors and outcomes.
• Course information provides data on the course structure, including modules, assessments, and learning materials. It offers insights into the educational content and how it is organized, which is essential for understanding the context in which students are learning.
• VLE interactions captures logs of student interactions with the virtual learning environment. These logs record every click and interaction a student has within the online platform, providing invaluable data for analyzing learning behaviors and identifying patterns that correlate with academic performance. This interaction data enables us to track how students engage with the course materials and the frequency and intensity of their interactions.
• Assessment information includes details on the various assessments students undertake throughout the course, such as quizzes, assignments, and exams. This information helps in understanding how different assessment types impact student performance and learning progression.
The OULAD has been extensively used in educational research due to its depth and breadth of information. It allows researchers to explore various aspects of online learning and develop models that can provide actionable insights for improving student outcomes. By leveraging this rich dataset, our study aims to predict student academic performance and develop early warning systems that can identify students at risk of failure. We focus on utilizing the click data from the VLE to forecast student learning outcomes and establish early alert mechanisms. By examining these interactions, we aim to determine how early in the semester an early alert mechanism can reliably predict student learning outcomes and which data mining methodologies offer superior predictive capabilities for learning outcomes in a virtual course.
2.1.1 Extracted dataset
The VLE table from the OULAD provides comprehensive data on students’ interactions with the virtual learning environment. This includes clicks on various types of learning resources, which are crucial for understanding student behaviors and engagement.
A key contribution of our work is the creation of specific features based on click data from the VLE table. By developing new features such as q1q1, q2q2, q3q3, q4q4, and not_clicked, we aim to capture the nuances of student interactions with VLE resources. These features help in understanding the relationship between student engagement and academic performance, enabling more accurate predictions and early identification of at-risk students.
To measure how much a student interacts with VLE resources, we sorted the number of clicks in a specific classroom on a specific resource. Then, we placed each student into one quartile or not_clicked based on their number of clicks. After doing this for all VLE resources in a specific class, we created five features: q1q1, q2q2, q3q3, q4q4, and not_clicked. These features represent the number of times a student is in the first quartile, second quartile, third quartile, fourth quartile, or did not click the resource at all, respectively.
To illustrate the type of data used in this study, a sample dataset is shown in Table 1. This dataset includes variables such as gender, region, highest education, IMD band, age band, number of previous attempts, studied credits, registration and unregistration dates, click data divided into quartiles (q1 to q4), and the final result.
The dataset contains a total of 29,570 students, with the following distribution of final results: 7,053 Fail, 12,362 Pass, and 10,157 Withdrawn. By analyzing this data, we aim to understand the impact of student interactions with the VLE on their academic performance and identify at-risk students early in the semester.
2.2 Algorithms
2.2.1 Data preprocessing
The initial step involved cleaning and preprocessing the dataset to ensure the quality and integrity of the data. This process included:
2.2.1.1 Handling missing values
Missing data points were identified and handled appropriately to maintain the dataset’s consistency. The strategy for dealing with missing values was based on the nature of each variable. For numerical features, we used mean imputation to replace missing values with the average value of the respective feature. For categorical features, we used mode replacement to substitute missing values with the most frequent category. This approach ensures that the dataset remains complete and avoids the potential bias introduced by removing instances with missing values.
2.2.1.2 Feature encoding
Categorical variables were encoded using one-hot encoding to convert them into a machine-readable form. This step was crucial for incorporating categorical data into our predictive models. One-hot encoding transforms each categorical variable into a new binary variable (0 or 1) for each unique category. For example, a categorical variable with three categories, such as ‘low’, ‘medium’, and ‘high’, would be converted into three binary variables, each representing one of these categories. This process prevents the model from interpreting ordinal relationships between categories that do not exist.
2.2.1.3 Data scaling
Feature scaling was applied to normalize the range of independent variables in the data. We utilized the StandardScaler from Scikit-learn to scale the features, ensuring that no variable would dominate the model’s performance due to its scale. StandardScaler standardizes the features by removing the mean and scaling to unit variance, which is particularly important for algorithms that are sensitive to the scale of the data, such as Support Vector Machines and K-Nearest Neighbors (kNN).
2.2.2 Feature selection
A crucial aspect of our methodology was selecting the most relevant features for predicting student performance. This selection process involved:
2.2.2.1 Correlation analysis
We conducted a correlation analysis to identify and exclude features with high multicollinearity, ensuring the model’s interpretability and efficiency. Multicollinearity occurs when two or more features are highly correlated, which can distort the model’s estimation of the relationship between each feature and the target variable. By removing features with high multicollinearity, we reduce redundancy and improve the model’s performance. The Pearson correlation coefficient was calculated for all pairs of numerical features, and highly correlated pairs (correlation coefficient > 0.8) were noted. One feature from each highly correlated pair was excluded based on domain knowledge and its relevance to the prediction task.
2.2.2.2 Feature importance evaluation
Machine learning models, including decision trees and ensemble methods, were employed to assess the importance of each feature. Decision trees and ensemble methods like Random Forests provide feature importance scores, which indicate the contribution of each feature to the model’s predictions. Features with higher importance scores have a more significant impact on the target variable. We used these models to rank the features based on their importance scores and retained the top features for model development. This approach ensures that only the most influential features are included, reducing the risk of overfitting and improving the model’s generalizability.
2.2.2.3 Domain knowledge
In addition to the automated feature selection techniques, we incorporated domain knowledge to ensure that the selected features were meaningful and relevant to the educational context. For example, features related to student demographics (e.g., age, gender), academic background (e.g., highest education, number of previous attempts), and interaction data (e.g., clicks on VLE resources categorized into q1q1, q2q2, q3q3, q4q4, and not_clicked) were considered essential for predicting student performance. These features provide a comprehensive view of the factors influencing student outcomes and are supported by existing literature in EDM (Li and Xue, 2023).
2.2.3 Model development
2.2.3.1 Linear regression
Linear Regression (Schneider et al., 2010) served as our baseline model for performance comparison. This model assumes a linear relationship between the independent variables (features) and the dependent variable (student performance). By fitting a linear equation to observed data, Linear Regression estimates the coefficients for the features that minimize the difference between the predicted and actual outcomes. This model is particularly useful for its simplicity, interpretability, and efficiency in computation. It provides a benchmark for assessing the complexity needed in predictive modeling for this dataset, allowing us to evaluate the incremental value added by more complex models. The mathematical expression related to linear regression is as follows:
where:
• is the dependent variable (student performance),
• are the independent variables (features),
• are the coefficients,
• is the error term.
2.2.3.2 Decision trees and random forests
Decision Trees (Quinlan, 1986) were chosen for their capability to model non-linear relationships and interactions between features without requiring any assumptions about the distribution of data. A decision tree splits the data into subsets based on the value of input features, with each node representing a decision on a specific feature and each branch representing an outcome of that decision. This process continues recursively, resulting in a tree-like model of decisions.
Building on the concept of Decision Trees, Random Forests aggregate the predictions of multiple decision trees to improve predictive accuracy and control over-fitting. This ensemble method combines the predictions from numerous decision trees constructed on different subsamples of the dataset. Each tree in a Random Forest is built from a sample drawn with replacement (bootstrap sample) from the training set. Moreover, when splitting a node during the construction of the tree, the split that is chosen is no longer the best split among all features. Instead, the split that is picked is the best split among a random subset of the features. As a result, this model is robust against overfitting and is better suited for handling complex datasets with intertwined feature interactions, making it a valuable tool for predicting student performance across various dimensions.
2.2.3.3 MultiOutputRegressor
This approach extends traditional regression models to handle multiple continuous outcomes by fitting one regressor per target. In our study, the MultiOutputRegressor framework was employed with an Extra Trees Regressor as the base estimator. The Extra Trees Regressor is an ensemble method that fits a number of randomized decision trees on various sub-samples of the dataset and uses averaging to improve predictive accuracy and control overfitting.
To address the challenge of predicting multiple target variables related to student performance simultaneously, we utilized a MultiOutputRegressor. This approach is advantageous in EDM, where predicting multiple aspects of student performance, such as grades in different subjects or progression over time, is necessary to provide a comprehensive assessment.
In our study, this framework was employed with an Extra Trees Regressor as the base estimator. The use of an Extra Trees Regressor within the MultiOutputRegressor allows for capturing complex, non-linear interactions between features, offering robustness and generalizability in predicting the multi-dimensional nature of student performance.
2.2.4 Hyperparameter tuning
To optimize model performance, we conducted hyperparameter tuning using RandomizedSearchCV, which involves the following steps:
2.2.4.1 Parameter space definition
A comprehensive search space was defined for each model, including parameters such as the number of estimators, max depth, min samples split, and min samples leaf for tree-based models.
2.2.4.2 RandomizedSearchCV implementation
RandomizedSearchCV was used to perform hyperparameter optimization. This method involves randomly sampling a fixed number of hyperparameter combinations from the specified parameter space and evaluating each combination through cross-validation (Liashchynskyi and Liashchynskyi, 2019).
2.2.4.3 Cross-validation strategy
We implemented a 3-fold cross-validation strategy to reliably evaluate the models’ performance and mitigate the risk of overfitting. This approach splits the data into three subsets, training the model on two subsets and validating it on the third, and repeating this process to ensure robust performance estimates.
2.2.4.4 Selection of best parameters
The combination of parameters that resulted in the best performance, according to the cross-validation results, was selected for the final model. The evaluation metrics used to assess model performance included accuracy, precision, recall, and F1 score, as detailed in next subsection.
Results of hyperparameter tuning:
• Decision trees:
• Best parameters: criterion='gini', max_depth=20, min_samples_split=2, min_samples_leaf=1
• Random forests:
• Best parameters: n_estimators=200, max_features='sqrt', max_depth=30, min_samples_split=2, min_samples_leaf=2, bootstrap=True
• MultiOutputRegressor with extra trees regressor:
• Best parameters: n_estimators=500, criterion='mse', max_features='auto', max_depth=None, min_samples_split=2, min_samples_leaf=1, bootstrap=True
• Neural network:
• Best parameters: hidden_layer_sizes=(100,50,10), activation='relu', solver='adam', alpha=0.0001, learning_rate='adaptive', max_iter=500
These hyperparameters were selected based on cross-validation performance, ensuring the models are optimized for the given dataset. This tuning process plays a vital role in enhancing the model’s predictive accuracy and overall performance (Qiu, 2024).
2.2.5 Model evaluation
The final step in our methodology was the evaluation of the selected model’s performance. We employed the following metrics to provide a comprehensive assessment of the models’ predictive capabilities:
2.2.5.1 Mean squared error
2.2.5.1.1 Description
MSE quantifies the average squared difference between the actual and predicted values. It provides a measure of model accuracy, with lower values indicating better performance. Its formula is:
where is the actual value, is the predicted value, and is the number of observations.
2.2.5.2 R-squared
2.2.5.2.1 Description
R2, or the coefficient of determination, assesses the proportion of variance in the dependent variable that is explained by the independent variables. It indicates the model’s explanatory power, with values closer to 1 indicating better fit. Its formula is:
where is the mean of the actual values.
2.2.5.3 Precision
2.2.5.3.1 Description
Precision measures the proportion of true positive predictions among the total positive predictions made by the model. It is particularly useful for evaluating the relevance of positive predictions. Its equation is:
where TP is the number of True Positives and FP is the number of False Positives.
2.2.5.4 Recall
2.2.5.4.1 Description
Recall, or sensitivity, measures the proportion of true positive predictions among the actual positive cases. It is crucial for assessing the model’s ability to identify positive instances. Its equation is:
where FN is the number of False Negatives.
2.2.5.5 F1-score
2.2.5.5.1 Description
The F1-Score is the harmonic mean of precision and recall, providing a balanced measure of the model’s performance in terms of both metrics. Its formula is:
These evaluation metrics offer a robust framework for assessing the performance of our models, ensuring that both accuracy and the quality of predictions are taken into account. The inclusion of these metrics allows for a comprehensive evaluation, highlighting the strengths and weaknesses of each model.
3 Results
3.1 Random forest model evaluation
3.1.1 Initial model with all features
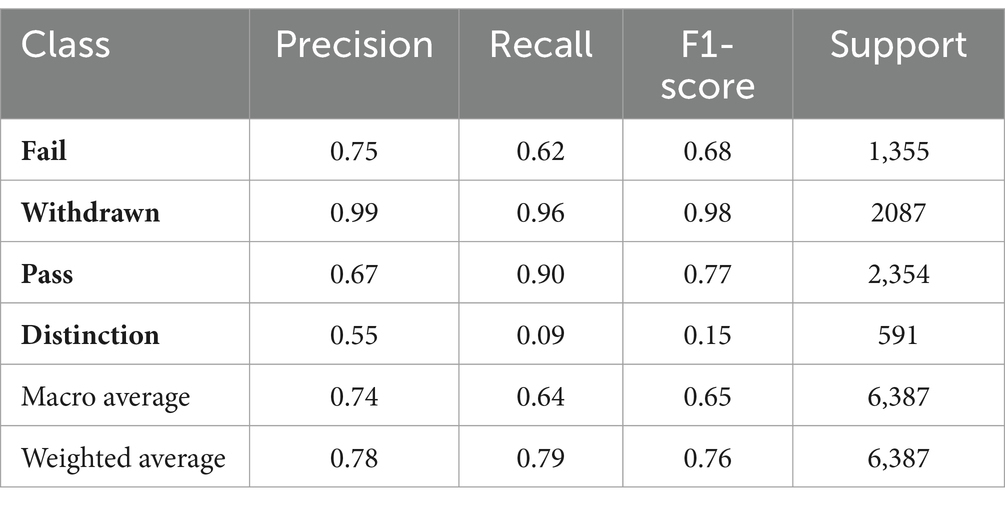
The first assessment involved training a Random Forest Classifier using all available features. The model’s performance is summarized in Tables 2, 3.
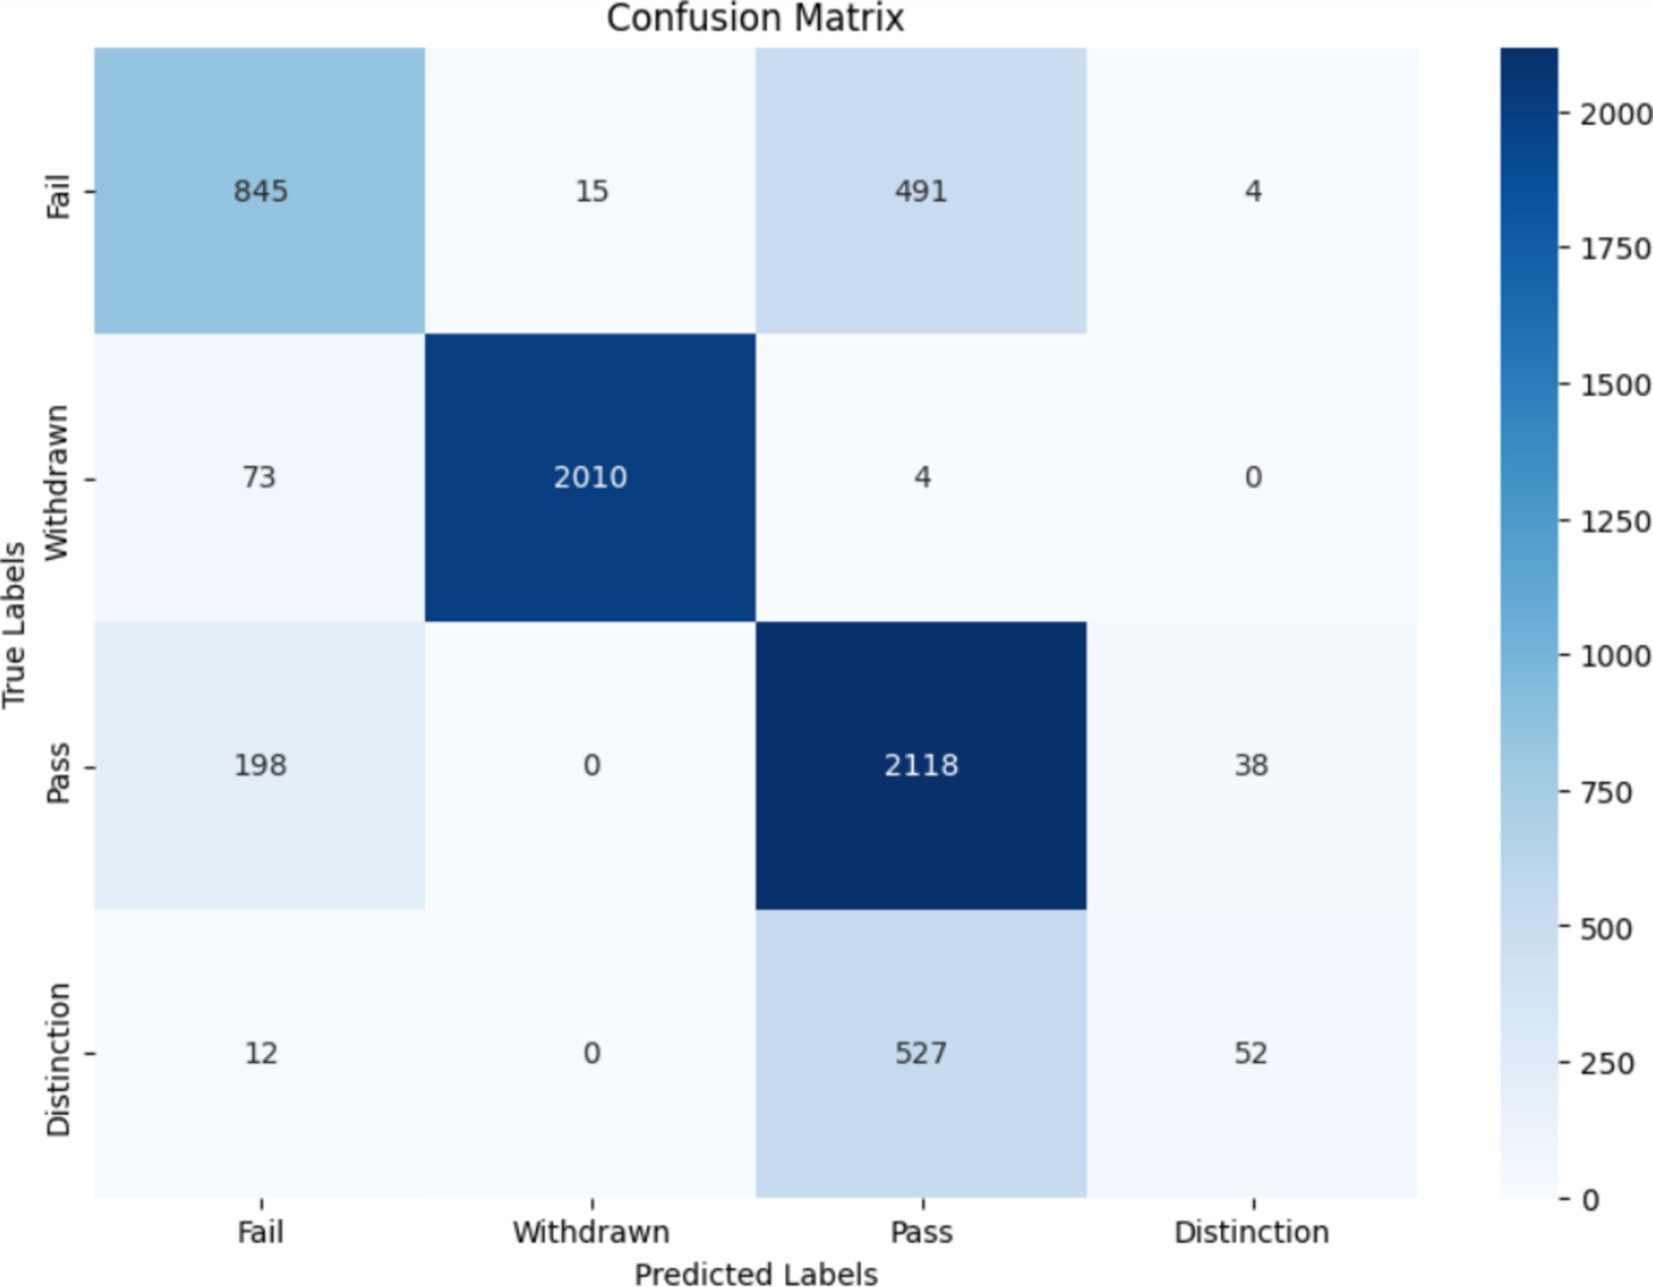
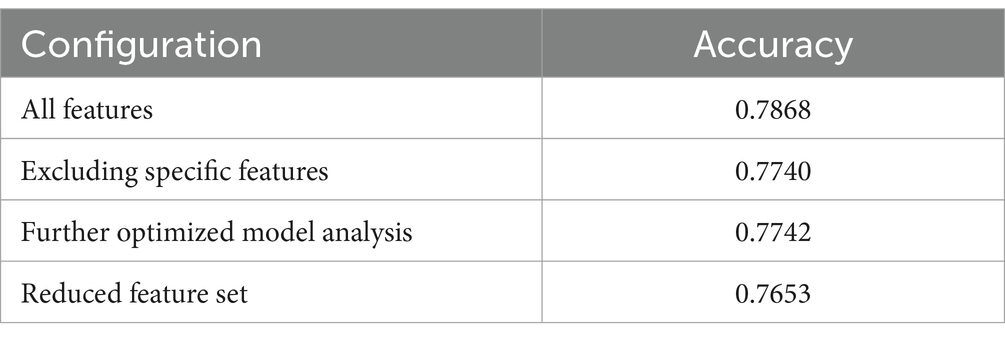
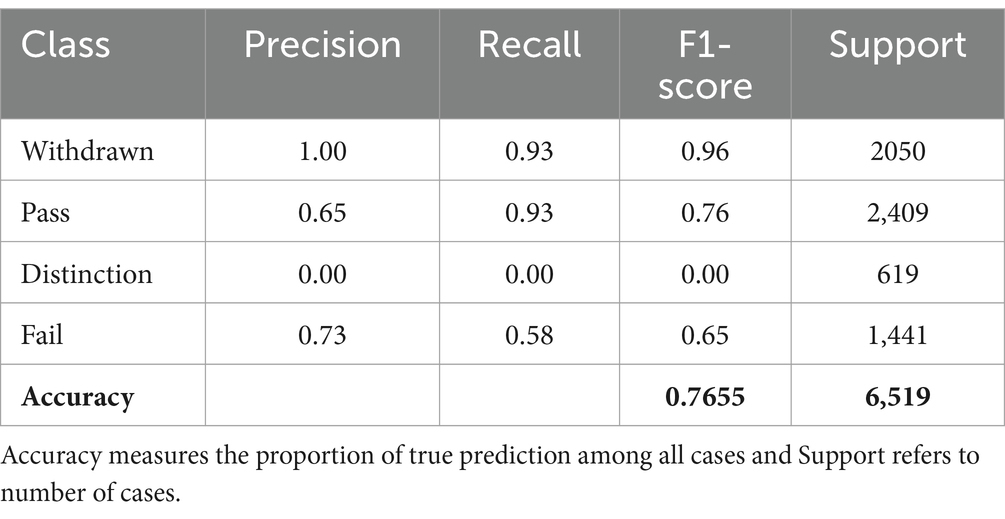
The initial evaluation of the Random Forest Classifier, utilizing all available features within the dataset, yielded an accuracy of 78.68%. The classification report for this model demonstrates a varied performance across different classes, with precision, recall, and f1-score reflecting the model’s effectiveness in predicting outcomes. Notably, the model showed a strong performance in identifying the withdrawn students with a precision of 99% and an f1-score of 98%, while it struggled more with the distinction class, evidenced by a lower f1-score of 15%. Also, the confusion matrix of this classifier is presented in Figure 1.
3.1.2 Optimized random forest model
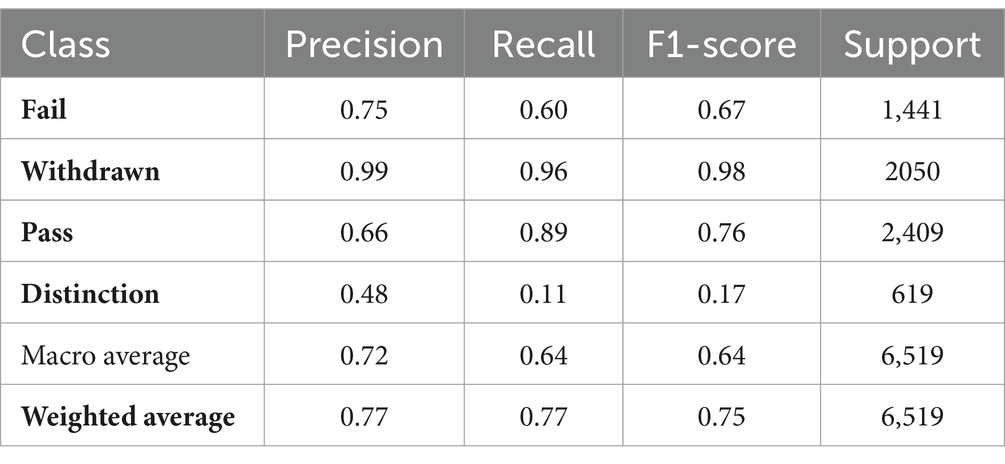
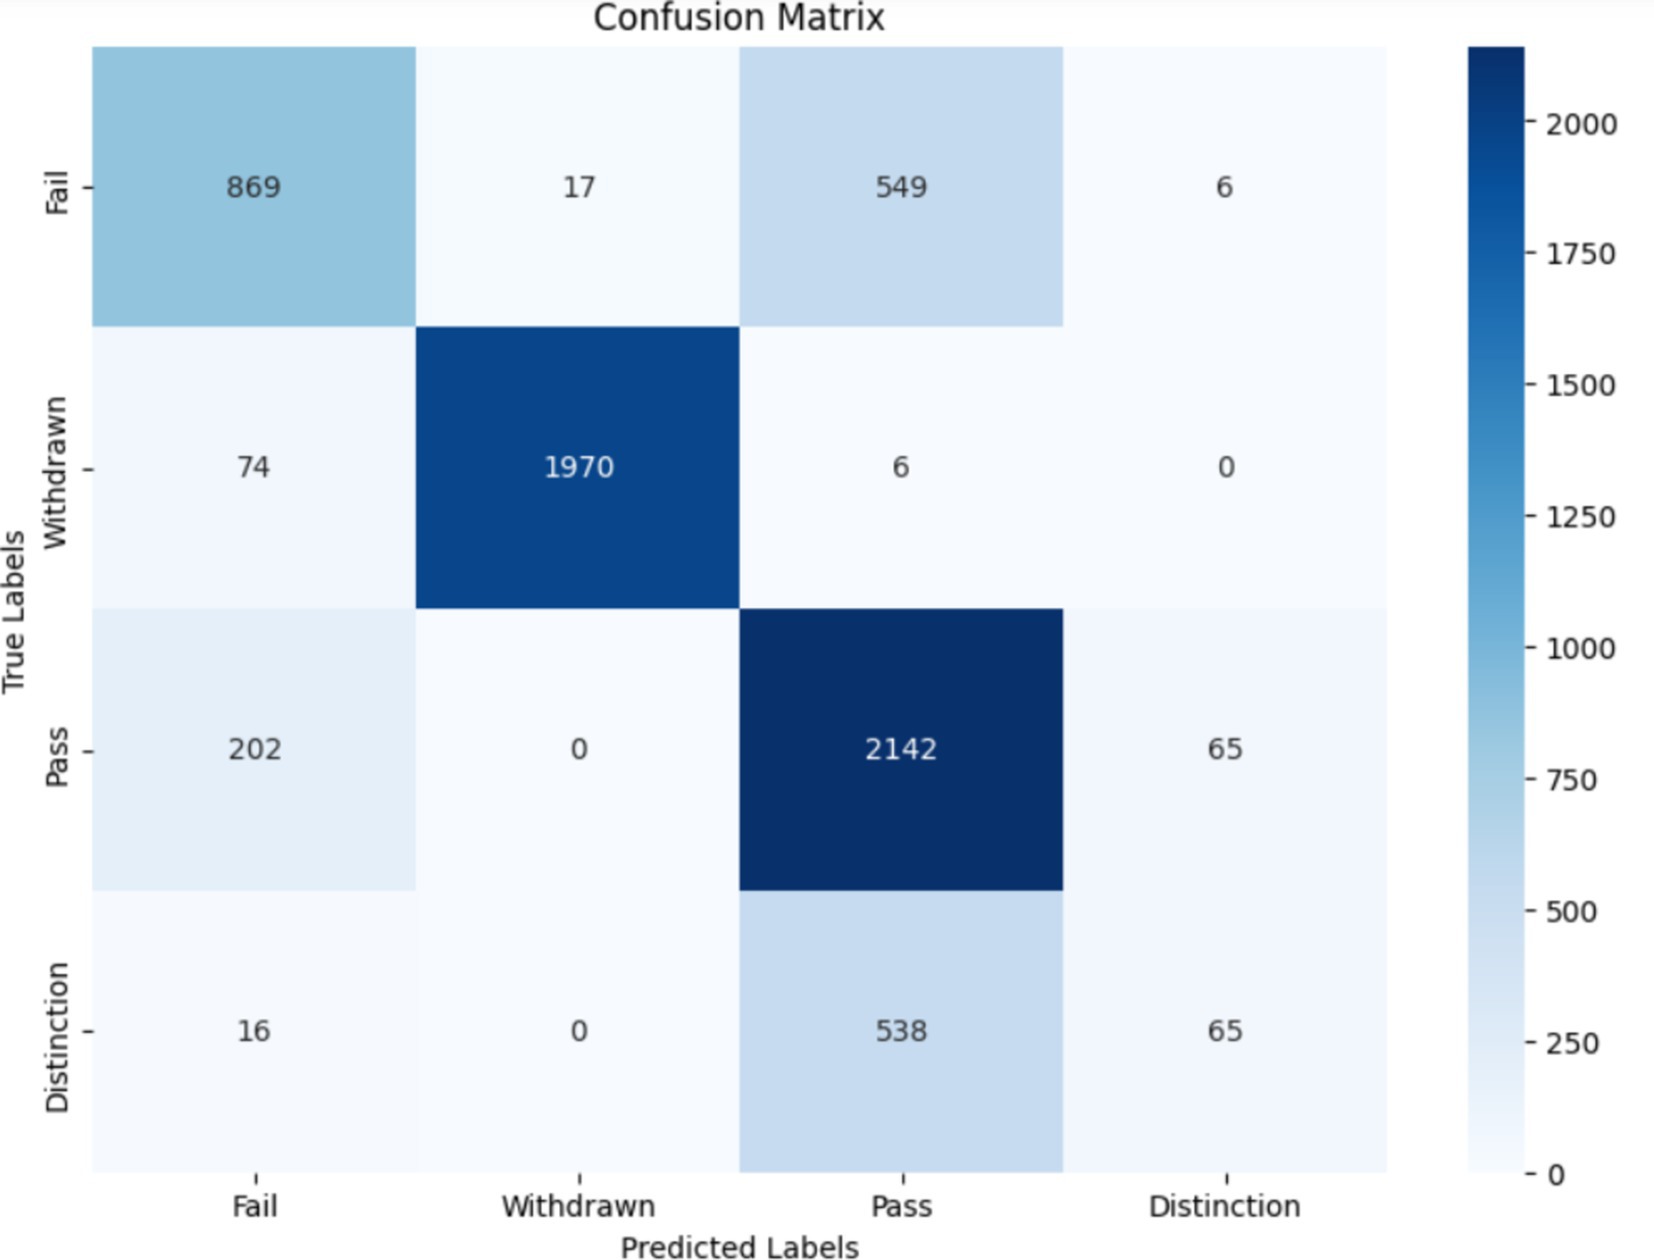
Further analysis was conducted by training a new Random Forest Classifier, excluding specific features (student id, region, imd band, age band, gender) and implementing an imputation strategy for missing data. The performance of this optimized model is detailed in Tables 4, 5.
This optimized model achieved an accuracy of 77.40%, with the classification report showing a consistent performance pattern as observed with the initial model. The exclusion of the specified columns and the adoption of data imputation had a marginal impact on model performance, decreasing accuracy by approximately 1% (see Figure 2).
3.1.3 Performance comparison and key takeaways
The comparison between the full-feature model and the optimized model revealed a slight decrease in accuracy, indicating a marginal impact from the excluded features. The most influential features for model performance have been identified as VLE interactions and educational background, suggesting these areas as focal points for future model tuning and analysis.
3.1.4 Influence of educational background
An experiment removing the “highest education” feature showed a minimal impact on accuracy, suggesting that this variable is not a critical determinant of predictive outcomes. This insight led to a focus on “VLE interactions” as the primary influential factor on model performance.
3.1.5 Experimentation with additional features
In light of these findings, further experimentation was planned by excluding course details as well as educational background from the feature set, as explained in Table 6. Preliminary expectations suggested that their removal would not significantly affect model accuracy.
3.1.6 Anticipated outcome
The approach aimed to demonstrate the model’s robustness with a reduced feature set, emphasizing the pivotal role of VLE interactions in predictions. The forthcoming analysis is expected to validate the negligible impact of removing additional features on overall accuracy. The last iteration of this approach yielded an accuracy of 76.53%, with the classification report indicating a slight decrease in performance across various metrics.
Our results underscore the significance of feature selection in building effective predictive models. While certain features like ‘highest education’ showed minimal impact on model accuracy, the primary focus on ‘interactions’ has been validated as crucial for understanding and predicting student performance. The marginal decrease in accuracy, as features were streamlined, highlights the robustness of our model and the potential for optimizing feature sets without substantially compromising predictive performance.
Continuing from the analysis of Random Forest, we delve into the exploration of deep learning and other advanced modeling techniques to enhance predictive accuracy further. The following sections detail the performance of these models and strategic shifts towards integrating diverse modeling approaches.
3.2 Transitioning to deep learning
3.2.1 Deep learning model evolution
We advanced our analysis by incorporating a deep learning model, designed with multiple hidden layers. This model signifies a shift from traditional machine learning methods, aiming to capture complex patterns within the data more effectively. The performance of the model is described in Table 7.
Accuracy stabilized at approximately 77%, maintaining consistency with previous models. This maintained accuracy level suggests that deep learning techniques closely align with the predictive performance of earlier models, without significant differences.
3.3 Advancing to gradient boosting machines
3.3.1 XG boost integration
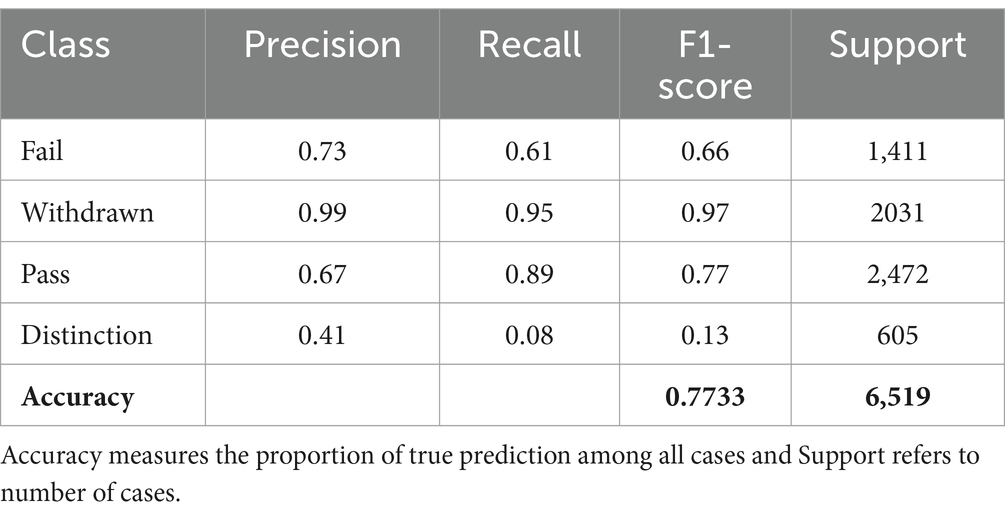
The exploration continued with the application of Extreme Gradient Boosting (XG Boost), a renowned Gradient Boosting Machine library, known for its performance and efficiency.
• Accuracy: Recorded at 77.33%, aligning with the accuracy levels of prior models.
• Interpretation: The consistent accuracy, despite the sophistication of XGBoost, indicates a potential plateau in performance improvement with the current dataset and features. The result is shown in Table 8.
3.4 Developing an integrated modeling strategy
3.4.1 Comprehensive approach
An integrative strategy was crafted, combining Principal Component Analysis (PCA), XG Boost, a sophisticated deep learning model, and stacking techniques, aiming for enhanced prediction accuracy and deeper data insights (see Table 9).
Integrated model performance:
• Random forest classifier accuracy: 0.7283
• XGB classifier accuracy: 0.7342
• Voting classifier accuracy: 0.7385
• Deep learning model accuracy: 0.7757
Key finding: the deep learning model emerged as the most effective, maintaining an accuracy rate of approximately 77.57%.
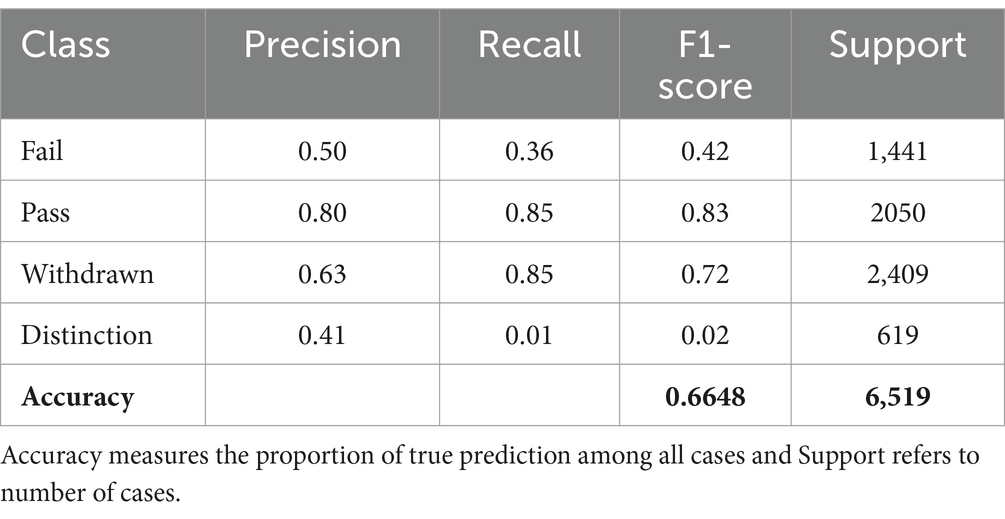
3.4.2 Simplifying with logistic regression
Optimization shifted towards a logistic regression model, aiming for simplicity and efficiency in model development without compromising performance.
• Accuracy: 66.48%, indicating a reduction in predictive accuracy compared to more complex models.
3.4.3 Transition to recurrent neural network
3.4.3.1 RNN integration
The exploration of deep learning techniques advanced with the incorporation of a Recurrent Neural Network (RNN), focusing on capturing temporal dependencies and patterns.
3.5 RNN model performance
• Accuracy: Consistently maintained at 77%, indicating that even sophisticated RNN architectures might not significantly surpass the predictive accuracy plateau with the current dataset.
3.5.1 Comprehensive analysis with full dataset RNN
3.5.1.1 RNN model with full dataset performance
• Accuracy: Improved slightly to 78%, suggesting that utilizing the full dataset enables the RNN to capture more comprehensive data nuances, achieving a slight accuracy improvement.
The exploration of various machine learning and deep learning approaches, from Random Forest and XG Boost to deep learning and RNN models, highlights the challenges of surpassing an accuracy plateau. However, the integrative and sophisticated modeling strategies, especially with the full dataset, show promise for slight improvements and deeper insights into predictive dynamics.
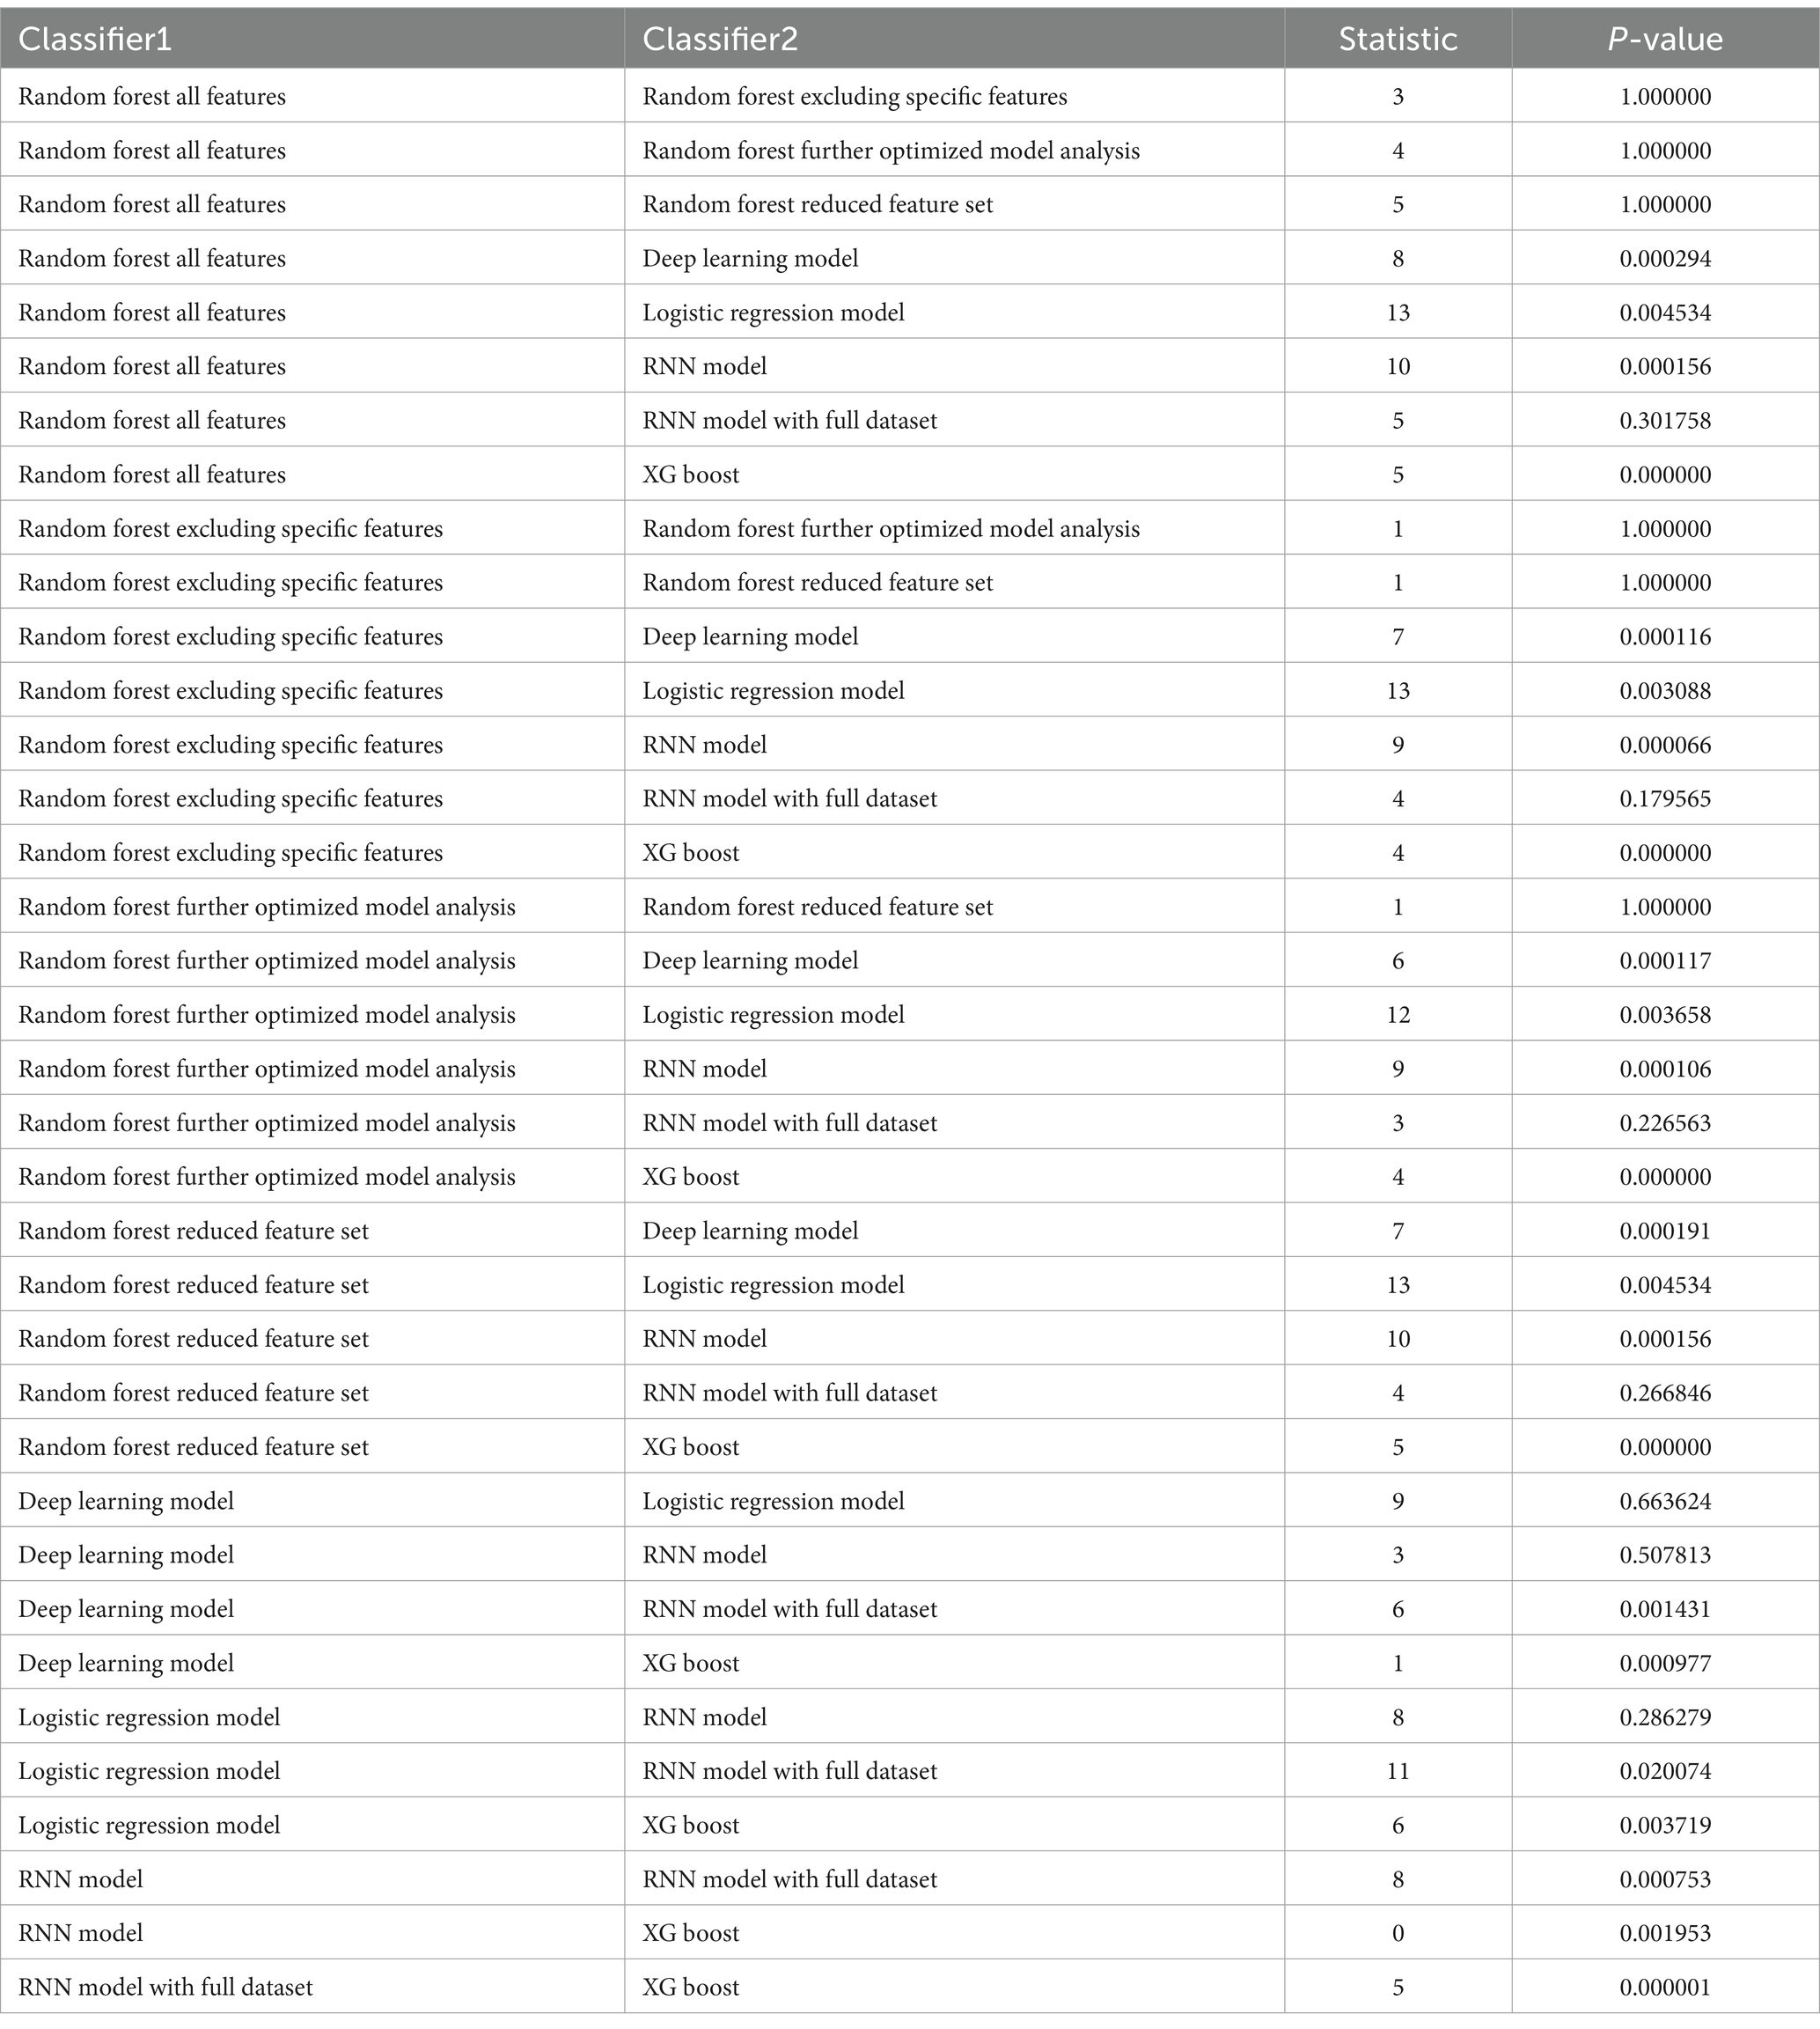
3.6 Classifier performance comparison using McNemar’s test
To evaluate the statistical significance of the performance differences between the classifiers, we conducted McNemar’s test for each pair of classifiers. McNemar’s test is a non-parametric method used for comparing paired proportions, making it suitable for evaluating the performance of two classifiers by comparing their predictions on a paired basis. This test provides a statistical basis for determining whether there is a significant difference in the performance of the classifiers.
3.6.1 Methodology
The contingency table used in McNemar’s test was constructed based on the number of correct and incorrect predictions made by each classifier. Specifically, for each pair of classifiers, we compared the number of instances where both classifiers made correct predictions, both made incorrect predictions, and where one classifier made a correct prediction while the other made an incorrect prediction. The test statistic and p-value were then calculated to determine the significance of the performance difference.
3.6.2 Results
The results of McNemar’s test for each pair of classifiers are presented in Table 10. The table includes the test statistic and the corresponding p-value for each pair of classifiers. The p-values obtained from McNemar’s test (p-value less than 0.05) indicate the statistical significance of the differences in performance between the classifiers as it is shown in Table 10.
Significant differences in model performance were observed in several comparisons. For instance, the comparison between the Random Forest All Features model and the Deep Learning model yielded a p-value of 0.000294, indicating a statistically significant difference. Similarly, comparisons involving other classifiers, such as the Logistic Regression Model, RNN Model, and XGBoost, often showed significant differences in performance, as evidenced by the significant p-values (<0.05).
In contrast, certain comparisons demonstrated non-significant differences in performance. For example, the comparison between the Random Forest All Features model and the Random Forest model excluding specific features resulted in a high p-value (e.g., 1.000000), suggesting that the performance differences were not statistically significant.
These results provide a detailed understanding of how different classifiers perform relative to each other, allowing researchers to make better decisions on which classifiers to use for specific tasks.
4 Discussions
This study embarked on a comprehensive exploration of predictive modeling techniques to forecast student performance in online courses, leveraging a rich dataset encapsulating students’ interactions with course materials. Our analysis spanned from traditional Random Forest models to advanced deep learning approaches, including GBMs and RNNs. The primary objective was to ascertain the predictive power of these models, particularly in identifying students at risk of withdrawing and those poised to achieve top grades.
4.1 Predicting students who withdraw
A significant finding from our study is the models’ pronounced ability to predict the withdrawal class with high accuracy. This outcome is particularly evident in the Random Forest and deep learning models, where the precision for identifying withdrawn students reached as high as 99%, with an f1-score of 98% (see Tables 3, 5, 8). This robust predictive capability implies that the models can effectively use student interaction data to flag those who are likely to disengage and potentially drop out of the course. Such insights are invaluable for educational institutions and online course providers, enabling timely interventions to support at-risk students and reduce dropout rates.
4.2 Predicting students who pass
Predicting high achievers remains challenging due to the complexity of factors influencing academic excellence. High engagement with VLE resources does not necessarily translate to top grades, suggesting that other qualitative factors, such as study habits, intrinsic motivation, and external support, play a significant role (MacLaren et al., 2017). Further research into these factors and their impact on the challenges faced by the models in accurately predicting high achievers is warranted. Exploring additional data sources that capture behavioral, motivational, and cognitive dimensions could yield richer insights into student success.
4.3 Distinguishing between students who pass and those who obtain distinction(s)
Our analysis revealed a notable limitation in the models’ ability to distinguish between students who merely pass the course and those who achieve distinction. The performance metrics indicate a significant drop in precision and recall for the distinction class across most models, with some unable to differentiate between the two categories effectively. This suggests that while high interaction with course materials is a good predictor of course completion, it does not necessarily correlate with top academic performance. This limitation may also stem from the fact that these two categories are not mutually exclusive, as students who pass may share overlapping behavioral traits with those who achieve distinction, complicating the models’ ability to make clear distinctions. This outcome aligns with Section 3, which highlights that the features derived from interaction data, while effective for identifying disengagement, may lack the nuance required to capture the full complexity of academic excellence.
This finding prompts a critical discussion on the nature of student engagement and its impact on academic success. It challenges the assumption that the quantity of interaction with learning materials directly translates to higher achievement. Instead, it may imply that the quality of engagement, the effectiveness of study strategies, or other factors not captured by interaction data alone play a crucial role in determining academic excellence.
Overall, the discrepancy in model performance between predicting withdrawals and distinguishing top performers underscores the complexity of educational outcomes and the multifaceted nature of learning. It highlights the need for more nuanced models that can incorporate a broader spectrum of predictors, including qualitative aspects of student engagement and personalized learning paths. Additionally, while the models achieved strong performance for at-risk predictions, the consistent accuracy plateau across various modeling techniques, despite their sophistication, suggests we may be approaching the limits of predictive performance with the current feature set and dataset. These findings are consistent with previous research by Fynn and Adamiak (2018) who compared different data mining algorithms in an open distance learning (ODL) context. Their work highlighted the importance of algorithm selection and optimization in addressing diverse educational challenges, particularly in environments with unique data structures. Furthermore, the dataset itself has limitations that may contribute to this plateau, as different teaching styles, course structures, and content delivery methods likely influence student interaction patterns in unique ways. Thus, the results may reflect certain biases inherent in the dataset, underscoring the need for a more diversified data collection across varied educational contexts.
5 Conclusion
Our investigation into machine learning and deep learning models for predicting student performance in online courses provides essential benchmarks for educational analytics. By evaluating a range of models, including Random Forest, XGBoost, and RNNs, we established their predictive capabilities in identifying students at risk of withdrawal and their limitations in accurately distinguishing high achievers. Notably, the Random Forest model’s accuracy of 78.68% and the consistent performance of deep learning models around 77% highlight the potential of these models for early warning systems, with the Random Forest achieving a precision of up to 99% in predicting withdrawals. This high level of precision underscores the value of these models in identifying at-risk students, allowing educational institutions to implement timely interventions and enhance student retention.
However, the study’s reliance solely on interaction data from the OULAD presents limitations in capturing the full spectrum of factors that influence academic excellence. While interaction data is effective for predicting course engagement and withdrawal, it does not fully encompass qualities associated with top academic performance, such as intrinsic motivation, study strategies, and external support systems. Our findings, particularly the modest improvement in accuracy to 78% with the RNN model, underscore the complex relationship between engagement levels and academic success, suggesting that high interaction with VLEs does not necessarily translate to top grades.
To address these limitations, future research should incorporate a wider range of behavioral and qualitative data, such as the time students spend on specific tasks, engagement with various content types, and cognitive factors that impact learning outcomes. Additionally, experimenting with hybrid models that combine traditional statistical approaches with deep learning techniques may provide a more nuanced understanding of student performance, especially for high achievers. Such advancements would enable educational institutions to tailor interventions for diverse student needs, supporting both at-risk learners and those striving for academic distinction. By developing these models further, we move closer to achieving adaptive, inclusive, and personalized educational experiences that foster success for every student.
Data availability statement
Publicly available datasets were analyzed in this study. This data can be found at: https://analyse.kmi.open.ac.uk/open_dataset.
Author contributions
M-RB: Writing – review & editing, Writing – original draft. HS: Writing – original draft. AH: Writing – review & editing. EA: Supervision, Writing – review & editing.
Funding
The author(s) declare that no financial support was received for the research, authorship, and/or publication of this article.
Conflict of interest
The authors declare that the research was conducted in the absence of any commercial or financial relationships that could be construed as a potential conflict of interest.
Correction note
This article has been corrected with minor changes. These changes do not impact the scientific content of the article.
Publisher’s note
All claims expressed in this article are solely those of the authors and do not necessarily represent those of their affiliated organizations, or those of the publisher, the editors and the reviewers. Any product that may be evaluated in this article, or claim that may be made by its manufacturer, is not guaranteed or endorsed by the publisher.
Abbreviations
AI, Artificial Intelligence; ML, Machine Learning; DL, Deep Learning; EDM, Educational Data Mining; LMS, Learning Management System; OULAD, Open University Learning Analytics Dataset; RF, Random Forest; RNN, Recurrent Neural Network; XGBoost, Extreme Gradient Boosting; GBM, Gradient Boosting Machine; CNN, Convolutional Neural Network; ANN, Artificial Neural Network; MSE, Mean Squared Error; F1-Score, Harmonic mean of precision and recall, used to measure model accuracy; CV, Cross-Validation; STEM, Science, Technology, Engineering, and Mathematics; PCA, Principal Component Analysis; ODL, Open Distance Learning.
References
Adnan, M., Habib, A., Ashraf, J., Mussadiq, S., Raza, A., Abid, M., et al. (2021). Predicting at-risk students at different percentages of course length for early intervention using machine learning models. IEEE Access 9:1. doi: 10.1109/ACCESS.2021.3049446
AlAli, R., Wardat, Y., Saleh, S., and Alshraifin, N. (2024). Evaluation of STEM-aligned teaching practices for gifted mathematics teachers. Europ. J. STEM Educ. 9:08. doi: 10.20897/ejsteme/14625
Alboukaey, N., Joukhadar, A., and Ghneim, N. (2020). Dynamic behavior based churn prediction in mobile telecom. Expert Syst. Appl. 162:113779. doi: 10.1016/j.eswa.2020.113779
Bulut, O., Gorgun, G., Yildirim-Erbasli, S. N., Wongvorachan, T., Daniels, L., Gao, Y., et al. (2022). Standing on the shoulders of giants: online formative assessments as the foundation for predictive learning analytics models. Br. J. Educ. Technol. 54, 19–39. doi: 10.1111/bjet.13276
Coelho, O., and Silveira, I. (2017). Deep learning applied to learning analytics and educational data mining: a systematic literature. Review 28:143. doi: 10.5753/cbie.sbie.2017.143
Dahdouh, K., Dakkak, A., Oughdir, L., and Messaoudi, F. (2018). Big data for online learning systems. Educ. Inf. Technol. 23, 2783–2800. doi: 10.1007/s10639-018-9741-3
Davis, H., Dickens, K., Leon, M., Sánchez Vera, M., and White, S. (2014). MOOCs for universities and learners: an analysis of motivating factors, vol. 1, 105–116.
Fei, M., and Yeung, D.-Y. (2015). Temporal models for predicting student dropout in massive open online courses, 256–263.
Fidalgo-Blanco, Á., Sein-Echaluce, M. L., García-Peñalvo, F. J., and Conde, M. Á. (2015). Using learning analytics to improve teamwork assessment. Comput. Hum. Behav. 47, 149–156. doi: 10.1016/j.chb.2014.11.050
Fynn, A., and Adamiak, J. (2018). A comparison of the utility of data mining algorithms in an open distance learning context. South African J. High. Educ. 32, 81–95. doi: 10.20853/32-4-2473
Hashim, A., Akeel, W., and Khalaf, A. (2020). Student performance prediction model based on supervised machine learning algorithms. IOP Conf. Series 928:032019. doi: 10.1088/1757-899X/928/3/032019
Hernández, A., Herrera-Flores, B., Tomás, D., and Navarro-Colorado, B. (2019). A systematic review of deep learning approaches to educational data mining. Complexity 2019, 1–22. doi: 10.1155/2019/1306039
Hlosta, M., Zdrahal, Z., and Zendulka, J. (2017). Ouroboros: early identification of at-risk students without models based on legacy data., in Proceedings of the Seventh International Learning Analytics & Knowledge Conference, (New York, NY, USA: Association for Computing Machinery), 6–15.
Hone, K. S., and El Said, G. R. (2016). Exploring the factors affecting MOOC retention: a survey study. Comput. Educ. 98, 157–168. doi: 10.1016/j.compedu.2016.03.016
Hooda, M., Rana, C., Dahiya, O., Shet, J. P., and Singh, B. K. (2022). Integrating LA and EDM for improving students success in higher education using FCN algorithm. Math. Probl. Eng. 2022:e7690103, 1–12. doi: 10.1155/2022/7690103
Khalil, I., Hashim, R., Wardat, Y., and Alasmari, N. (2023). Exploring primary school mathematics teachers’ strategies for enhancing students’ mathematical writing skills. J. Educ. Soc. Res 13:196. doi: 10.36941/jesr-2023-0102
Khan, I. U., Hameed, Z., Yu, Y., Islam, T., Sheikh, Z., and Khan, S. U. (2018). Predicting the acceptance of MOOCs in a developing country: application of task-technology fit model, social motivation, and self-determination theory. Telematics Inform. 35, 964–978. doi: 10.1016/j.tele.2017.09.009
Kotsiantis, S., Pierrakeas, C., and Pintelas, P. (2010). Predicting students’ performance in distance learning using machine learning techniques. Appl AI 18, 411–426. doi: 10.1080/08839510490442058
Kuzilek, J., Hlosta, M., and Zdrahal, Z. (2017). Open University learning analytics dataset. Sci. Data 4:170171. doi: 10.1038/sdata.2017.171
Leitner, P., Khalil, M., and Ebner, M. (2017). “Learning analytics in higher education—a literature review” in Studies in systems, decision and control, 1–23. Available at: https://www.researchgate.net/publication/313826553_Learning_Analytics_in_Higher_Education-A_Literature_Review
Li, J., and Xue, E. (2023). Dynamic interaction between student learning behaviour and learning environment: Meta-analysis of student engagement and its influencing factors. Behav. Sci. 13:59. doi: 10.3390/bs13010059
Liashchynskyi, P., and Liashchynskyi, P. (2019). Grid search, Random Search, Genetic Algorithm: A Big Comparison for NAS. Available at: https://arxiv.org/abs/1912.06059
Lust, G., Elen, J., and Clarebout, G. (2013). Students’ tool-use within a web enhanced course: explanatory mechanisms of students’ tool-use pattern. Comput. Hum. Behav. 29, 2013–2021. doi: 10.1016/j.chb.2013.03.014
Macfadyen, L. P., and Dawson, S. (2010). Mining LMS data to develop an “early warning system” for educators: a proof of concept. Comput. Educ. 54, 588–599. doi: 10.1016/j.compedu.2009.09.008
MacLaren, R., Tran, V. H., and Chiappe, D. (2017). Effects of motivation orientation on schoolwork enjoyment and achievement and study habits. Think. Skills Creat. 24, 199–227. doi: 10.1016/j.tsc.2017.03.003
Marbouti, F., Diefes-Dux, H. A., and Madhavan, K. (2016). Models for early prediction of at-risk students in a course using standards-based grading. Comput. Educ. 103, 1–15. doi: 10.1016/j.compedu.2016.09.005
Marbouti, F., Diefes-Dux, H., and Strobel, J. (2015). Building course-specific regression-based models to identify at-risk students. Available at: https://www.researchgate.net/publication/281274363_Building_course-specific_regression-based_models_to_identify_at-risk_students
Nguyen, T., Netto, C. L., Wilkins, J. F., Bröker, P., Vargas, E. E., Sealfon, C. D., et al. (2021). Insights into students’ experiences and perceptions of remote learning methods: from the COVID-19 pandemic to best practice for the future. Front. Educ. 6:647986. doi: 10.3389/feduc.2021.647986/full
Okubo, F., Yamashita, T., Shimada, A., and Ogata, H. (2017). A neural network approach for students’ performance prediction, in Proceedings of the Seventh International Learning Analytics & Knowledge Conference, (New York, NY, USA: Association for Computing Machinery), 598–599.
Qiu, J. (2024). An analysis of model evaluation with cross-validation: techniques, applications, and recent advances. Adv. Econ. Manag. Polit. Sci. 99, 69–72. doi: 10.54254/2754-1169/99/2024OX0213
Raj, N. S., Prasad, S., Harish, P., Boban, M., and Cheriyedath, N. (2021). “Early prediction of at-risk students in a virtual learning environment using deep learning techniques” in Adaptive instructional systems. Adaptation strategies and methods. eds. R. A. Sottilare and J. Schwarz (Cham: Springer International Publishing), 110–120.
Riestra-González, M., Paule-Ruíz, M., and Ortin, F. (2021). Massive LMS log data analysis for the early prediction of course-agnostic student performance. Comput. Educ. 163:104108. doi: 10.1016/j.compedu.2020.104108
Schneider, A., Hommel, G., and Blettner, M. (2010). Linear regression analysis: part 14 of a series on evaluation of scientific publications. Dtsch. Arztebl. Int. 107, 776–782. doi: 10.3238/arztebl.2010.0776
Wardat, Y., Belbase, S., Tairab, H., Takriti, R. A., Efstratopoulou, M., and Dodeen, H. (2023). The influence of student factors on students’ achievement in the trends in international mathematics and science study in Abu Dhabi emirate schools. Front. Psychol. 14:1168032. doi: 10.3389/fpsyg.2023.1168032
Xiang, L., Guo, G., Yu, J., Sheng, V. S., Yang, P., Xiang, L., et al. (2020). A convolutional neural network-based linguistic steganalysis for synonym substitution steganography. MBE 17, 1041–1058. doi: 10.3934/mbe.2020055
Yıldırım, Ö., Baloglu, U. B., and Acharya, U. R. (2020). A deep convolutional neural network model for automated identification of abnormal EEG signals. Neural Comput. & Applic. 32, 15857–15868. doi: 10.1007/s00521-018-3889-z
Keywords: artificial intelligence in education, predictive analytics in learning, online learning assessment, data-driven education, assessment innovation, machine learning models
Citation: Borna M-R, Saadat H, Hojjati AT and Akbari E (2024) Analyzing click data with AI: implications for student performance prediction and learning assessment. Front. Educ. 9:1421479. doi: 10.3389/feduc.2024.1421479
Edited by:
Kelly Anne Young, University of South Africa, South AfricaReviewed by:
John Bush Idoko, Near East University, CyprusNugroho Agung Pambudi, Sebelas Maret University, Indonesia
Yousef Wardat, Yarmouk University, Jordan
Copyright © 2024 Borna, Saadat, Hojjati and Akbari. This is an open-access article distributed under the terms of the Creative Commons Attribution License (CC BY). The use, distribution or reproduction in other forums is permitted, provided the original author(s) and the copyright owner(s) are credited and that the original publication in this journal is cited, in accordance with accepted academic practice. No use, distribution or reproduction is permitted which does not comply with these terms.
*Correspondence: Elham Akbari, ZWFrYmFyaUBtb2RhcmVzLmFjLmly
 Mahdi-Reza Borna
 Hanan Saadat
 Aref Tavassoli Hojjati
 Elham Akbari1*

