 Yuhan Chen
- 1Institute of Geographic Information System (GIS), Remote Sensing (RS), and Global Positioning System (GPS), Beijing Forestry University, Beijing, China
- 2Beijing Key Laboratory of Precise Forestry, Beijing Forestry University, Beijing, China
The Tibetan Plateau (TP), known as the third pole, is the highest plateau in the world. It has numerous wetlands, which are important ecological security barriers and plays an important role in mitigating global climate change. This paper employed breaks for additive seasonal and trend (BFAST) algorithm for the mutation detection of the monthly normalized difference vegetation index (NDVI) in wetlands. In addition, correlation analysis and residual analysis were used to study the response of climate change and human activities to NDVI of alpine wetland vegetation in the TP during 2000–2015. The results indicate that the NDVI showed a weak upward trend of 0.009/10a (P < 0.05) with the climate presenting a trend of dry heat development. The NDVI of the growing season was greatly affected by temperature factors with the highest correlation coefficient of 0.686 (P < 0.01). The temperature in the month before and solar radiation in the 3 months before also presented a time lag effect on NDVI, and their correlation coefficients were 0.574 (P < 0.05) and 0.636 (P < 0.05), respectively. Additionally, human activities may have a positive impact on the wetland after 2008. This study explored, for the first time, the NDVI variations of the dynamic wetland and their correlations with temperature, precipitation and solar radiation.
1. Introduction
With the process of global warming, ecosystems are affected by more and more natural and human factors. Studies have shown that climate variation can change vegetation coverage (Timoney et al., 2019; Wen et al., 2019; Rezaei and Gurdak, 2020; Goodwin et al., 2021). The Tibetan Plateau (TP) is an eco-sensitive area to climate change (Wei and Wu, 2021). Wetlands provide immense storage of carbon that, if released with climate shifts, could accelerate those changes (Mitsch et al., 2009). Climate change threatens terrestrial water storage and Himalayan plant species over the TP (Salick et al., 2014; Li et al., 2022). As the third pole, the TP has the largest wetland area in China, which may significantly affect the TP’s vegetation (Yuan et al., 2014; Wang et al., 2020). The threat of climate change is considered to be a major factor that can affect the function and biogeochemistry of wetlands (Salimi et al., 2021). In the case of the Alpine wetland, it is vulnerable to low temperatures, strong evapotranspiration, large direct radiation and special ecological environments (including glaciers, frozen soils, deserts, meadows, etc.) (Kraaijenbrink et al., 2017; Dakhil et al., 2019; Wei and Wu, 2021).
Although the response of vegetation to climate change has become a hot topic of the research of the TP, most of them focus on grassland or forest ecosystems (Ding et al., 2013; Yi et al., 2014; Sun et al., 2016; Wang et al., 2016; Dakhil et al., 2019; Xiong et al., 2019). Therefore, in the context of climate variation, clarifying the response of wetland vegetation to climatic change in the TP is crucial.
For the study of wetland vegetation on the TP, Shen et al. (2022) (Kun et al., 2020) found that vegetation growth was influenced by temperature and precipitation, but the limitation is that the wetland extent in their research was fixed. A study (Xue et al., 2018) revealed that the wetlands on the TP have started to deteriorate. About 6.4% of their area has been lost from the 1970s to 2010s. In fact, wetland space is dynamic and changing. With this in mind, we discussed the vegetation cover status of the changing wetlands year by year.
For meteorological research, we not only discussed temperature and precipitation like others (Wang et al., 2011; Guo et al., 2014; Jiang et al., 2017; Shen et al., 2022), but also added solar radiation. The TP has abundant solar energy resources because of its high elevation (Wang and Qiu, 2009). Solar radiation plays a critical role in hydrological cycling, vegetation growth, climate, weather change, and so on (Yaghoubi and Sabzevari, 1996; Zhou et al., 2010; Yue and Huang, 2011; Colak et al., 2013). What’s more, scholars have studied the time-lag effect of climate (Bao et al., 2014; Diao et al., 2021; Zuo et al., 2021). Richard and Poccard (1998) and Zhe and Zhang (2021) used correlation coefficients to investigate the relationship between climate and the Normalized Difference Vegetation Index (NDVI), attesting a time response of the current and previous months. Guo et al. (2014) also found the time-lag effect of NDVI response to climate change, while the study area was in the semiarid region of the TP. Currently, the time-lag effects are still poorly understood in alpine wetland vegetation.
The alpine wetland vegetation is facing more severe and variable climatic conditions as well as complex ecosystems. In this study, monthly NDVI data and various meteorological data from 2000 to 2015 were used to analyze the vegetation greenness of the wetlands in the TP for a long time series by the breaks for additive seasonal and trend (BFAST) model and other methods. The main objective of our investigation has been to reveal the tipping points (Lenton, 2013) of wetland greenness and climate in the new century, and to explain the extent of climate change and human activities on alpine vegetation. In addition, the time-lag effects of alpine vegetation on climate variables can be further discussed by investigating the temporal pattern in NDVI of the vegetation growing season. This research is expected to provide scientific reference for vegetation protection, ecological management and rational development in this area under the background of climate change.
2. Materials and methods
2.1. Study area
The Tibetan Plateau (26° 00′ 12″ N∼39° 46′ 50″ N, 73° 18′ 52″ E∼104° 46′ 59″ E) is located in the southwest of China (Figure 1), about 2,945 km long from east to west and 1,532 km long from north to south (Chen et al., 2021). Due to its high elevation, this region has quite cold winters, mild summers and large diurnal temperature variations (Xiong et al., 2019) and the solar radiation of the TP is relatively high (Zhou et al., 2010). The annual average temperature is approximately between −5 and 8°C (Xin et al., 2008; Wang and Han, 2012). The inter-annual variation in temperature on the TP is small but the diurnal variation is large (Kirillin et al., 2021; Zhang et al., 2021). Known as the water towers of Asia (Yao et al., 2022), however, most of the TP is an arid and semi-arid region with not much precipitation (Zhang et al., 2000). The annual precipitation on the TP is about 400 mm, and there are significant seasonal differences in precipitation (Wang and Han, 2012; Wang et al., 2021). Spring and winter are the driest seasons on the annual scale. The main land use type in the area is grassland, followed by forest (Tang et al., 2018).
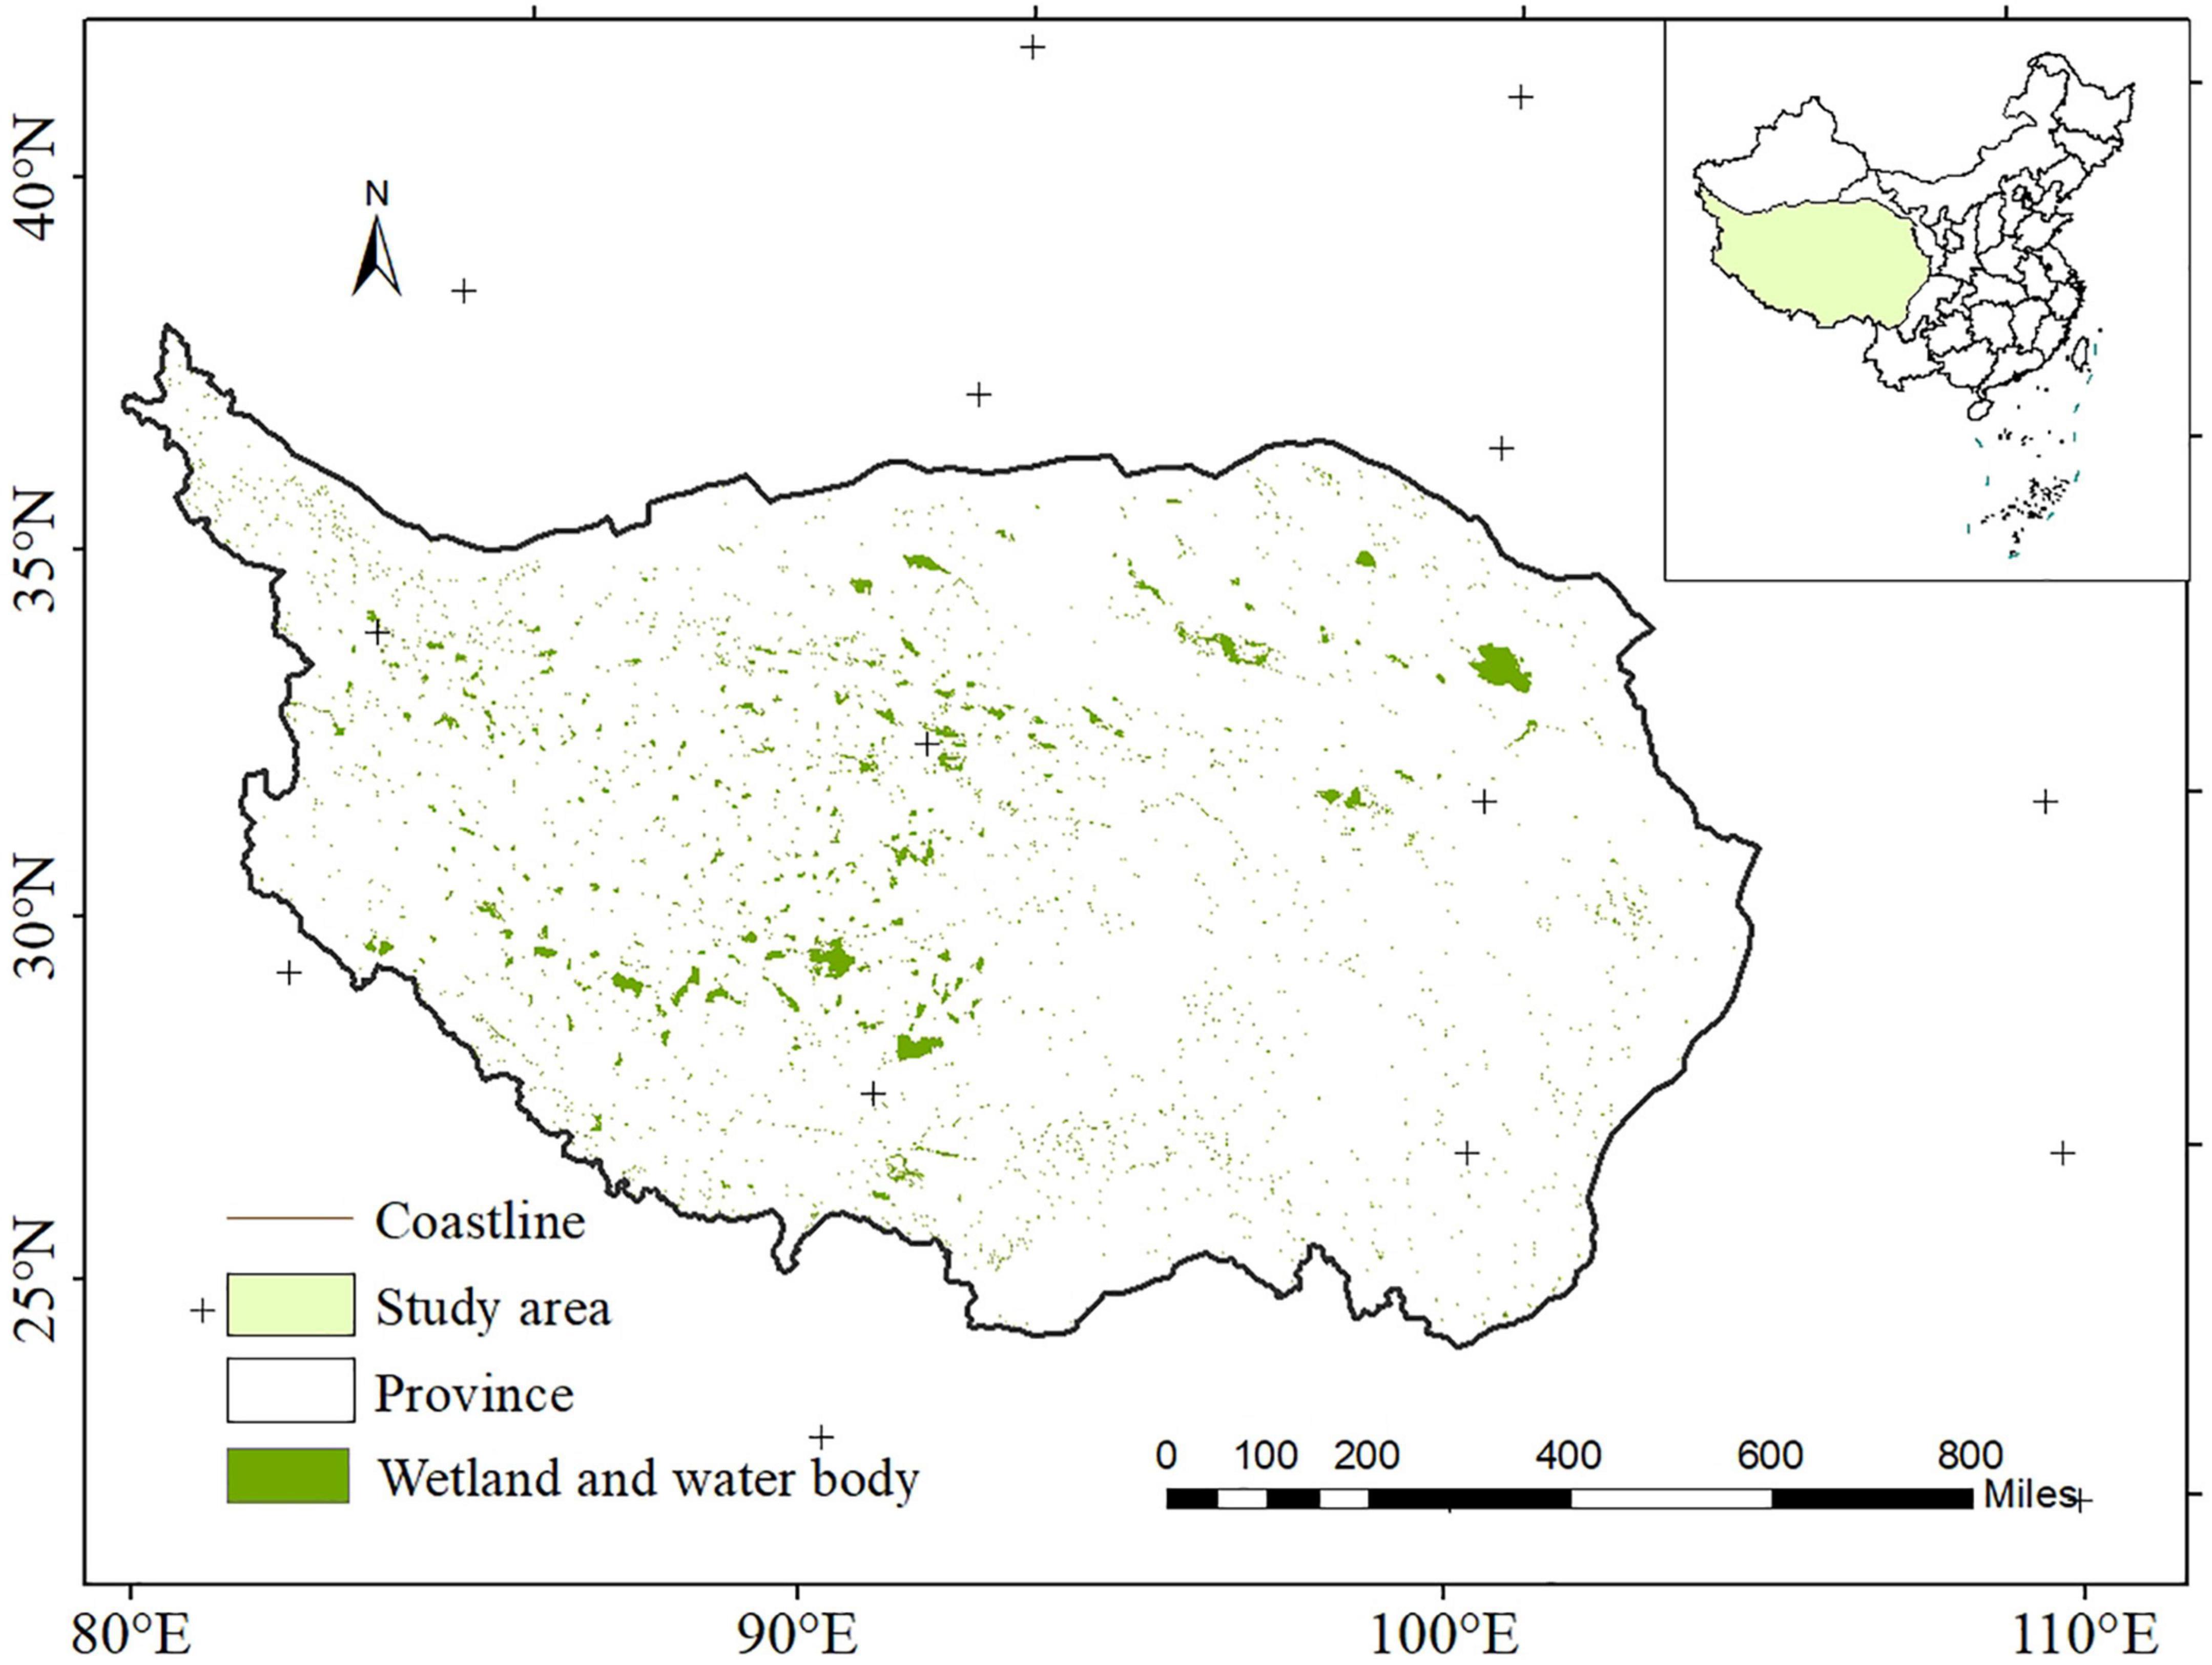
Figure 1. Location of the study area.
2.2. Data
Land use data (Xu et al., 2021) were obtained through Google Earth Engine (GEE) platform with a spatial resolution of 30 m. The User‘s Accuracy (UA) of wetland for this data set is higher, with UA of 71.06%, compared with datasets like Globeland30, FROM-GLC, and GLC-FCS30 (UA of 52.23, 29.25, and 47.17%, respectively). What’s more, the kappa coefficient for Asian reached 0.72 and the UA for the land use type of wetland reached 76.09%. In this paper, we yearly extracted the wetland and water body data from 2000 to 2015 as a mask for analyzing NDVI changes.
The vegetation index can reflect the vegetation cover, among which, NDVI is the best indicator to reflect the vegetation growth condition and vegetation cover. In this paper, the continuous time series SPOT/VEGETATION NDVI satellite remote sensing data were used to synthesize the 10 days NDVI data into monthly data by using the maximum-value composition (MVC) (Holben, 1986) technique, and was free downloaded from the Resource and Environment Data Cloud Platform, Chinese Academy of Sciences1 with a 1 km resolution from 2000 to 2015 (Xu, 2018). In order to avoid the interference of non-vegetation information on the alpine wetland vegetation NDVI with reference (Yu et al., 2012; Ding et al., 2013; Kun et al., 2020) to the previous vegetation NDVI thresholds on the TP, the data in this research must meet certain requirements as follows: (1) the average value of NDVI in April-September shall be more than 0.10; (2) the value of NDVI shall exceed than 0; (3) the average value of NDVI in winter shall be less than 0.4; (4) June to October was selected as the length of growth season (LOG) for analyzing whether there is a hysteresis response of NDVI to climate.
The meteorological data used were monthly precipitation (Peng, 2020), temperature (Peng, 2019), and solar radiation (Feng and Wang, 2020) data from 2000 to 2015 from the National Tibetan Plateau/Third Pole Environment Data Center.2 The spatial resolution of precipitation data and average temperature data is 1 km, and the resolution of solar radiation data is 10 km. For further comparing the impacts of seasonal climate factors on NDVI, we calculated the average values of climate factors during spring (March, April, and May), summer (June, July, and August), autumn (September, October, and November), and winter (December, January, and February).
2.3. Methodology
2.3.1. Mutation detection
For this study, the BFAST algorithm was used to analyze the abrupt change characteristics of vegetation greenness in alpine wetlands between 2000 and 2015. BFAST was first proposed in 2010 to make vegetation disturbance identification well in remote sensing data identification (Verbesselt et al., 2010b), and now the algorithm is used in several fields (Wang et al., 2014; Fang et al., 2018; Gholamnia et al., 2019), including climate analysis, hydrological analysis, and economic analysis. In this study, the BFAST package in R statistical software is used to obtain the tipping points of monthly NDVI of wetlands on the TP from 2000 to 2015, which can provide an analysis of the effect of climate anomalies on vegetation greenness and also help to research whether there is a lag period in the effect of climate on vegetation greenness. Formula is as follows (Verbesselt et al., 2010a):
where Yt is the observed data at time t; Tt is the fitted trend component; St is the fitted seasonal component; et is the remainder component; n is the total number of observed data. The BFAST procedures (Watts and Laffan, 2014) use a parameter known as h to determine the maximum number of breaks in the data set. This parameter can help in detecting trend changes. Following their work and the recommendations by Verbesselt et al. (2010b) and Fang et al. (2018), we hypothesized that the minimum interval between adjacent abrupt changes was approximately 2 years within a 16-year time series (2000–2015) in this study, therefore, h = 0.13 was used. Besides, the “harmonic” seasonal model was chosen for natural vegetation, while the “dummy” model is often used for cropland (Verbesselt et al., 2010a).
What’s more, based on the correlation between climate and NDVI, we used the Mann–Kendall mutation test (Kendall, 1938; Shadmani et al., 2012) to calculate the tipping points in meteorology and verify the wetland vegetation changes in response to climate change.
2.3.2. Correlation analysis
Pearson’s correlation coefficients were calculated for examining the relationship between NDVI (during vegetation growing season, from June to October) and precipitation, average temperature, solar radiation in the current month, the first month before, the first 2 months before and the first 3 months before. This research used this common method of testing correlation to analyze the time lag effect of vegetation response to climate. The calculation steps are as follows (Xiong et al., 2019):
where r is the linear correlation coefficient; cov is the covariance; x is the NDVI value; y is the precipitation (mm), temperature (°C), or solar radiation (W/m2). The value of r ranges from −1 to l, and the larger the absolute value, the higher the degree of correlation. If r < 0, it indicates that the index promotes NDVI; otherwise, it inhibits NDVI.
2.3.3. Residual analysis
One of the most important factors that can affect the vegetation of a region is climate change. The residual analysis method can also separate the effects of human activities from those caused by environmental changes (Evans and Geerken, 2004). The predicted value of NDVI is fitted by meteorological factors, which is the amount of climate change impact. The difference between the calculated value and the true value of NDVI can be considered as the influence of human factors. This method is called residual analysis and has been widely used (Herrmann et al., 2005; Higginbottom and Symeonakis, 2014; Fernández-Giménez et al., 2017; Jiang et al., 2017; Chu et al., 2019). It can be presented using the following equation:
where ε is the NDVI residual; NDVIreal is the true value of NDVI; NDVIpre is the predicted value of NDVI. If ε > 0, it indicates that human activities have a positive impact; If ε < 0, it indicates human activities produce negative effects; if ε = 0, indicating that the impact of human activities is relatively weak. If the residuals trend is significant, the NDVI variations can be explained by human activities (Jiang et al., 2017; Chu et al., 2019).
3. Results
3.1. Analysis of vegetation greenness changes in alpine wetlands
As shown in Figure 2, the NDVI of wetland vegetation in the TP was relatively small and changed gently until May, generally between 0.1 and 0.2. After May, the surface vegetation in the region increased rapidly, reaching a maximum in July and August. Then, it gradually decreased and dropped below 0.2. It can be seen that the growing season of wetland vegetation in the TP was more consistent with the description of vegetation in this region starting to germinate and grow in May and dying off by mid-late October in other article (Ding et al., 2013), indicating that the NDVI reflection of plant growth is consistent with other observations. Comparing Figures 2A, B the month-by-month trend of NDVI was approximately the same, but during the vegetation growing season, the values of NDVI in the wetland were significantly higher than the overall regional NDVI values. This may be due to the fact that a large area of the TP is covered with grassland vegetation, and wetlands have relatively sufficient water compared to arid grassland ecosystems, which promotes the growth of vegetation in wetland (Piao et al., 2007).
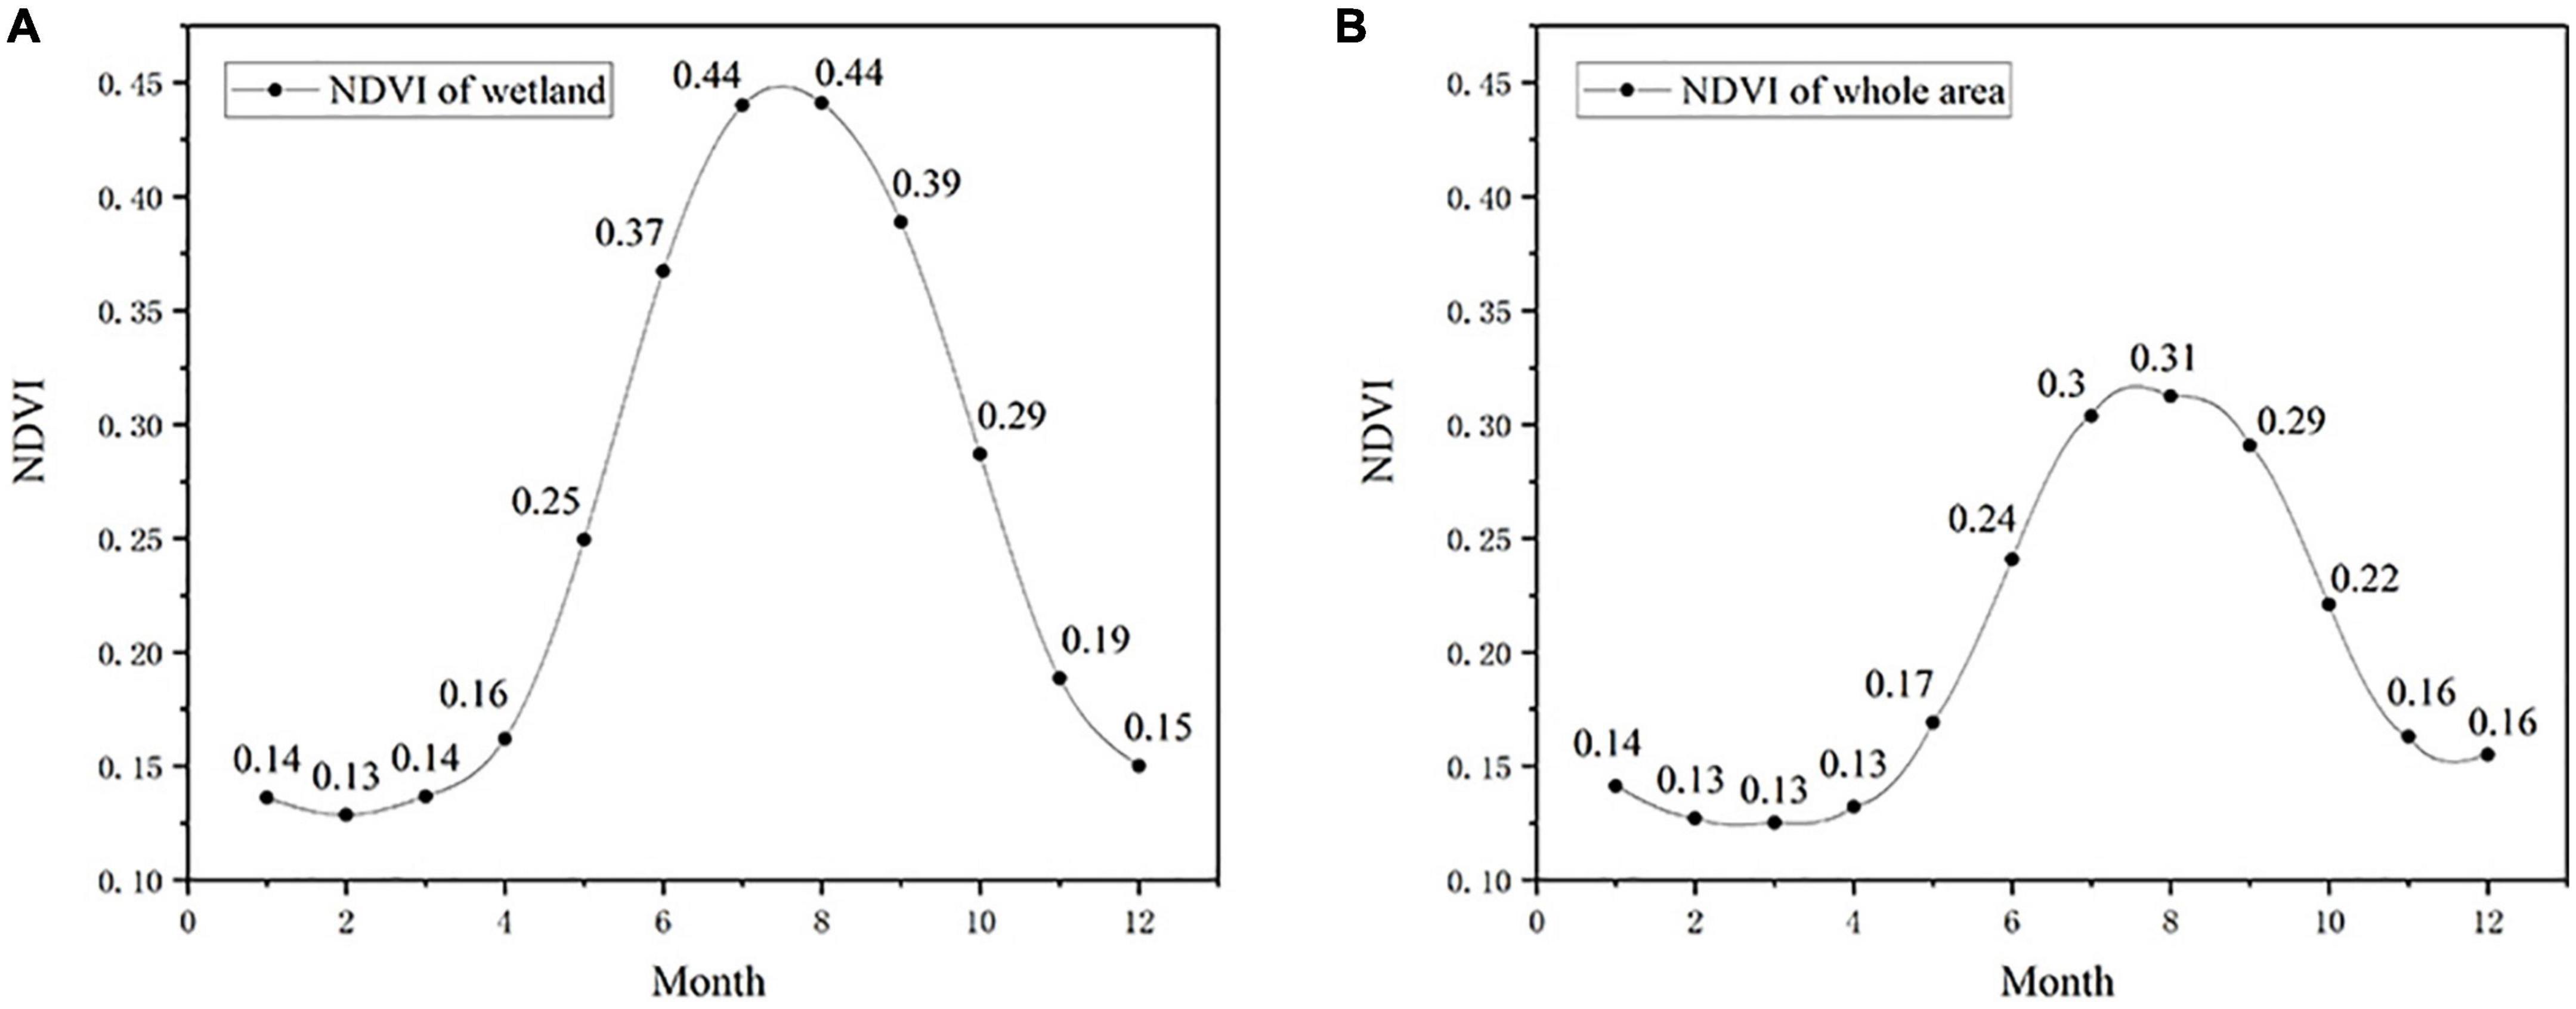
Figure 2. The multi-yearly seasonal variation for (A) averaged normalized difference vegetation index (NDVI) of wetland and (B) averaged NDVI in the TP.
For interannual variability, the study found that the area of wetlands was constantly undergoing changes, from 1,069.16 in 2000 to 1,100.49 km2 in 2015, increasing year by year. Not only the increase in wetland area, but also the increase of NDVI within the wetland area. The monthly NDVI values of wetlands in the TP from 2000 to 2015 were examined according to the BFAST model method, and in the overall time series analysis, the NDVI values showed an overall increasing trend. The trend was detected in the trend term, in which a tipping point was observed between 2013 and 2014 (Figure 3). Original time series (Yt) and seasonal component (St) showed cyclic regular changes, indicating that vegetation is suitable for long-term monitoring and research. The dashed line in Tt represents the times of abrupt change in NDVI in the trend components. There was one break, which was in 2013 with the largest magnitude (−0.013). Time of the biggest change detected in the trend component was 165th data, corresponding to September in 2013, and the broad time range was from February 2013 to January 2014.
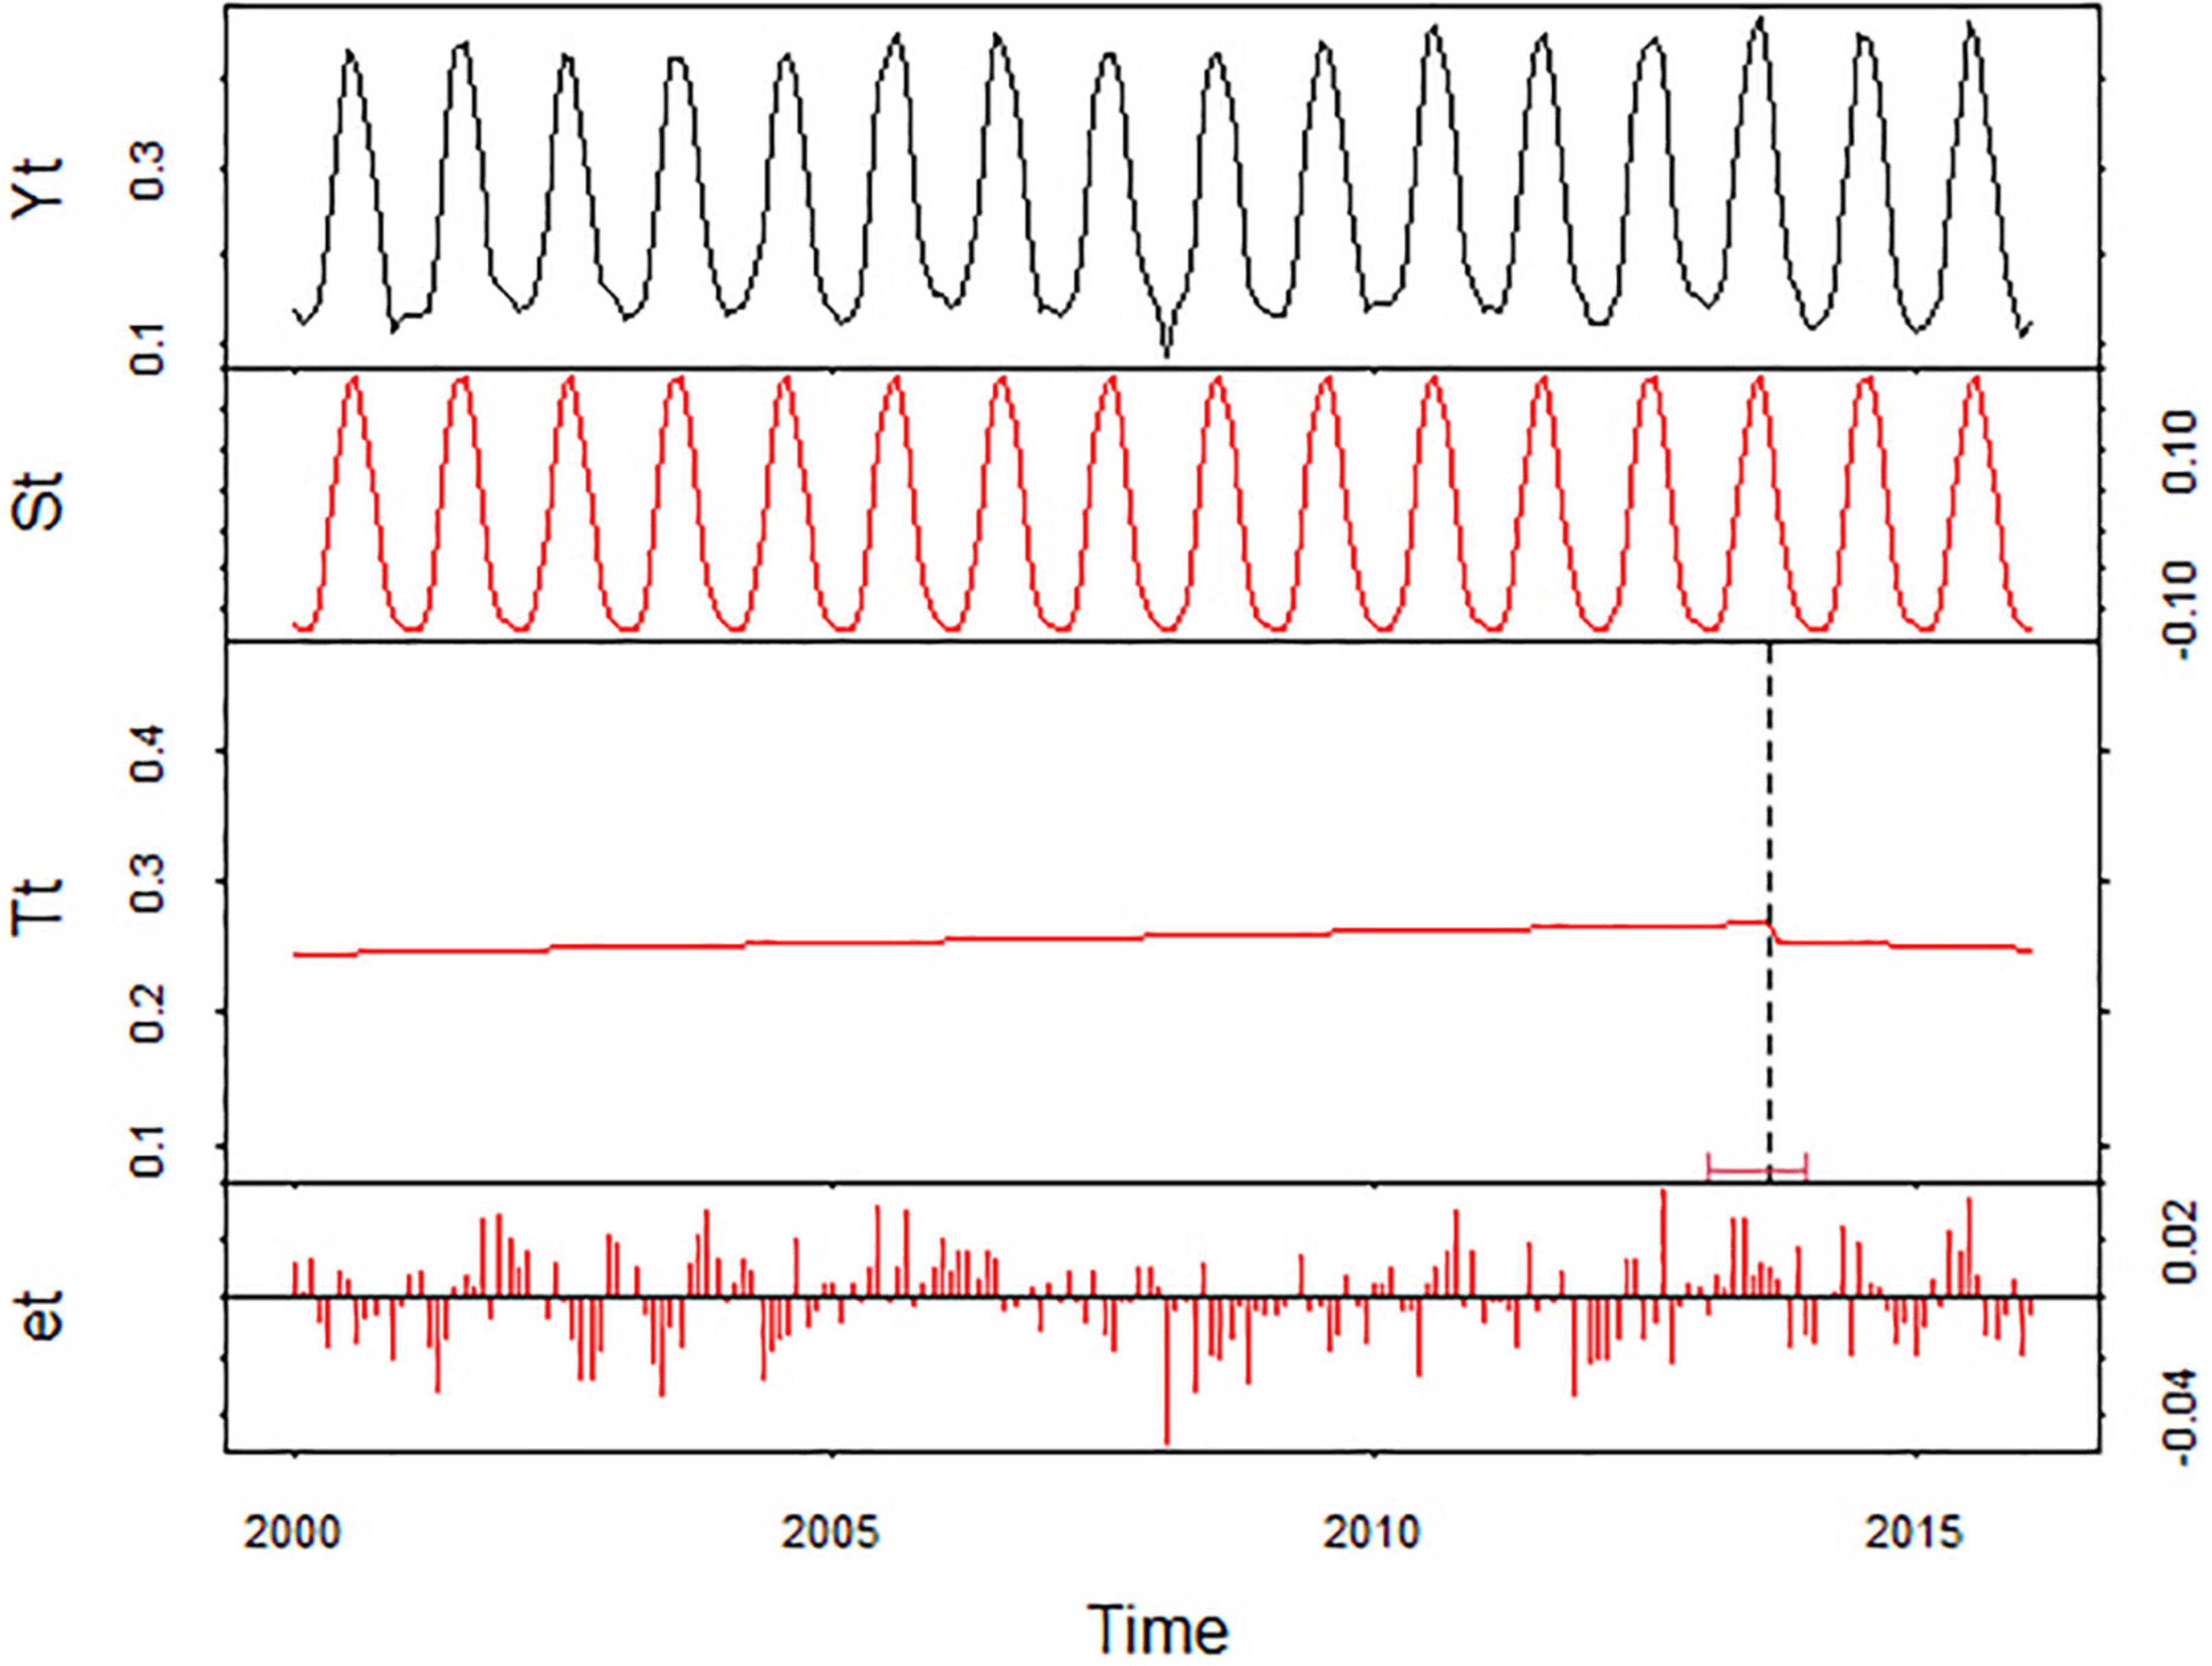
Figure 3. Breaks for additive seasonal and trend (BFAST) breakdown of normalized difference vegetation index (NDVI) time series for the 2000–2015 period for alpine wetland vegetation in TP.
It can be seen from Figure 4 that the annual mean NDVI of alpine wetland vegetation also showed a weak upward trend of 0.009/10a (P < 0.05). The mean NDVI in spring, summer and autumn also increased, on the contrary, the mean NDVI in winter showed a downward trend. This is also consistent with the NDVI change of the entire TP (Sun and Qin, 2016). The mean NDVI in autumn and winter varied greatly with R squared values of 0.01573 and 0.07625, respectively, and p values of 0.6435 and 0.3005, respectively. The mean NDVI values in spring (P < 0.01) were smaller than those in summer (P < 0.01), implying that the response of vegetation to climate may not be as pronounced. Summer is in the vegetation growing season, therefore, the reliability of this paper in studying the relationship between climatic factors and NDVI by using the vegetation growing season is further verified.
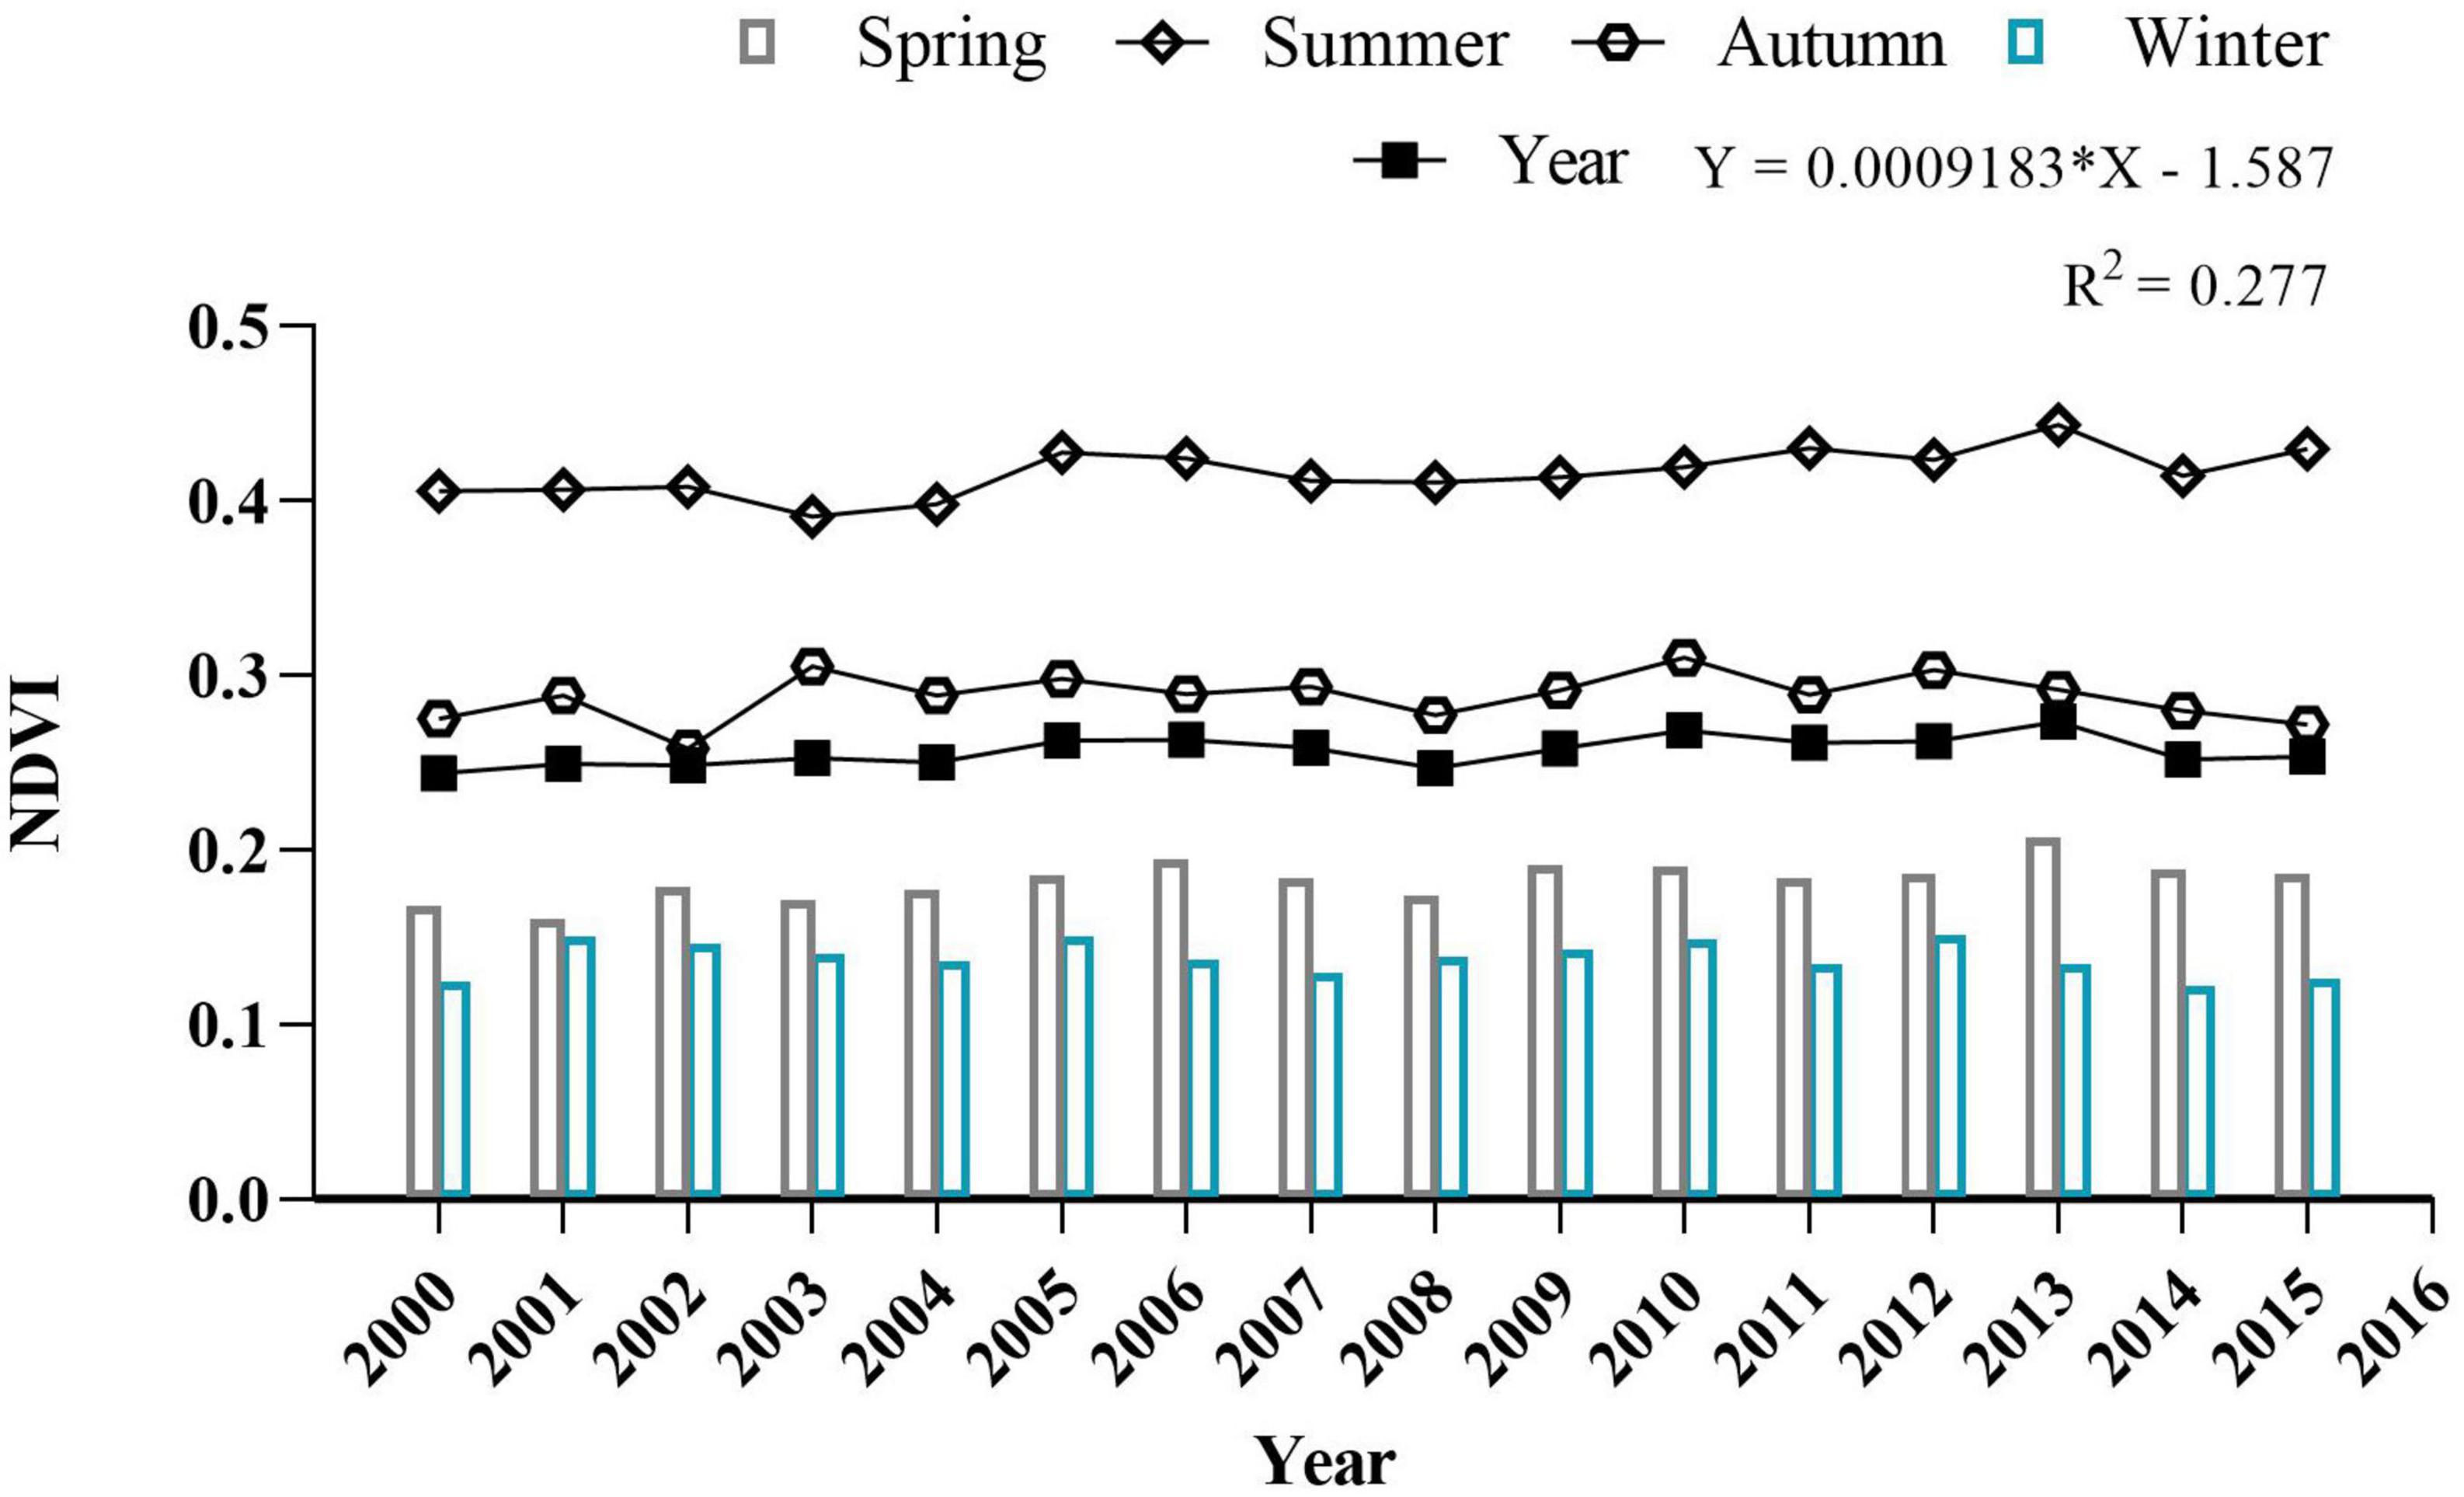
Figure 4. The change trend of normalized difference vegetation index (NDVI) of alpine wetland vegetation from 2000 to 2015.
3.2. Analysis of climate change characteristics
There is no doubt that the climate in the TP has changed under the condition of global warming. The interannual and seasonal trends of temperature, precipitation and solar radiation in the wetlands of the TP from 2000 to 2015 are shown in Figure 5, and Table 1 shows the statistical interannual and seasonal climate tendency rates of these meteorological elements.
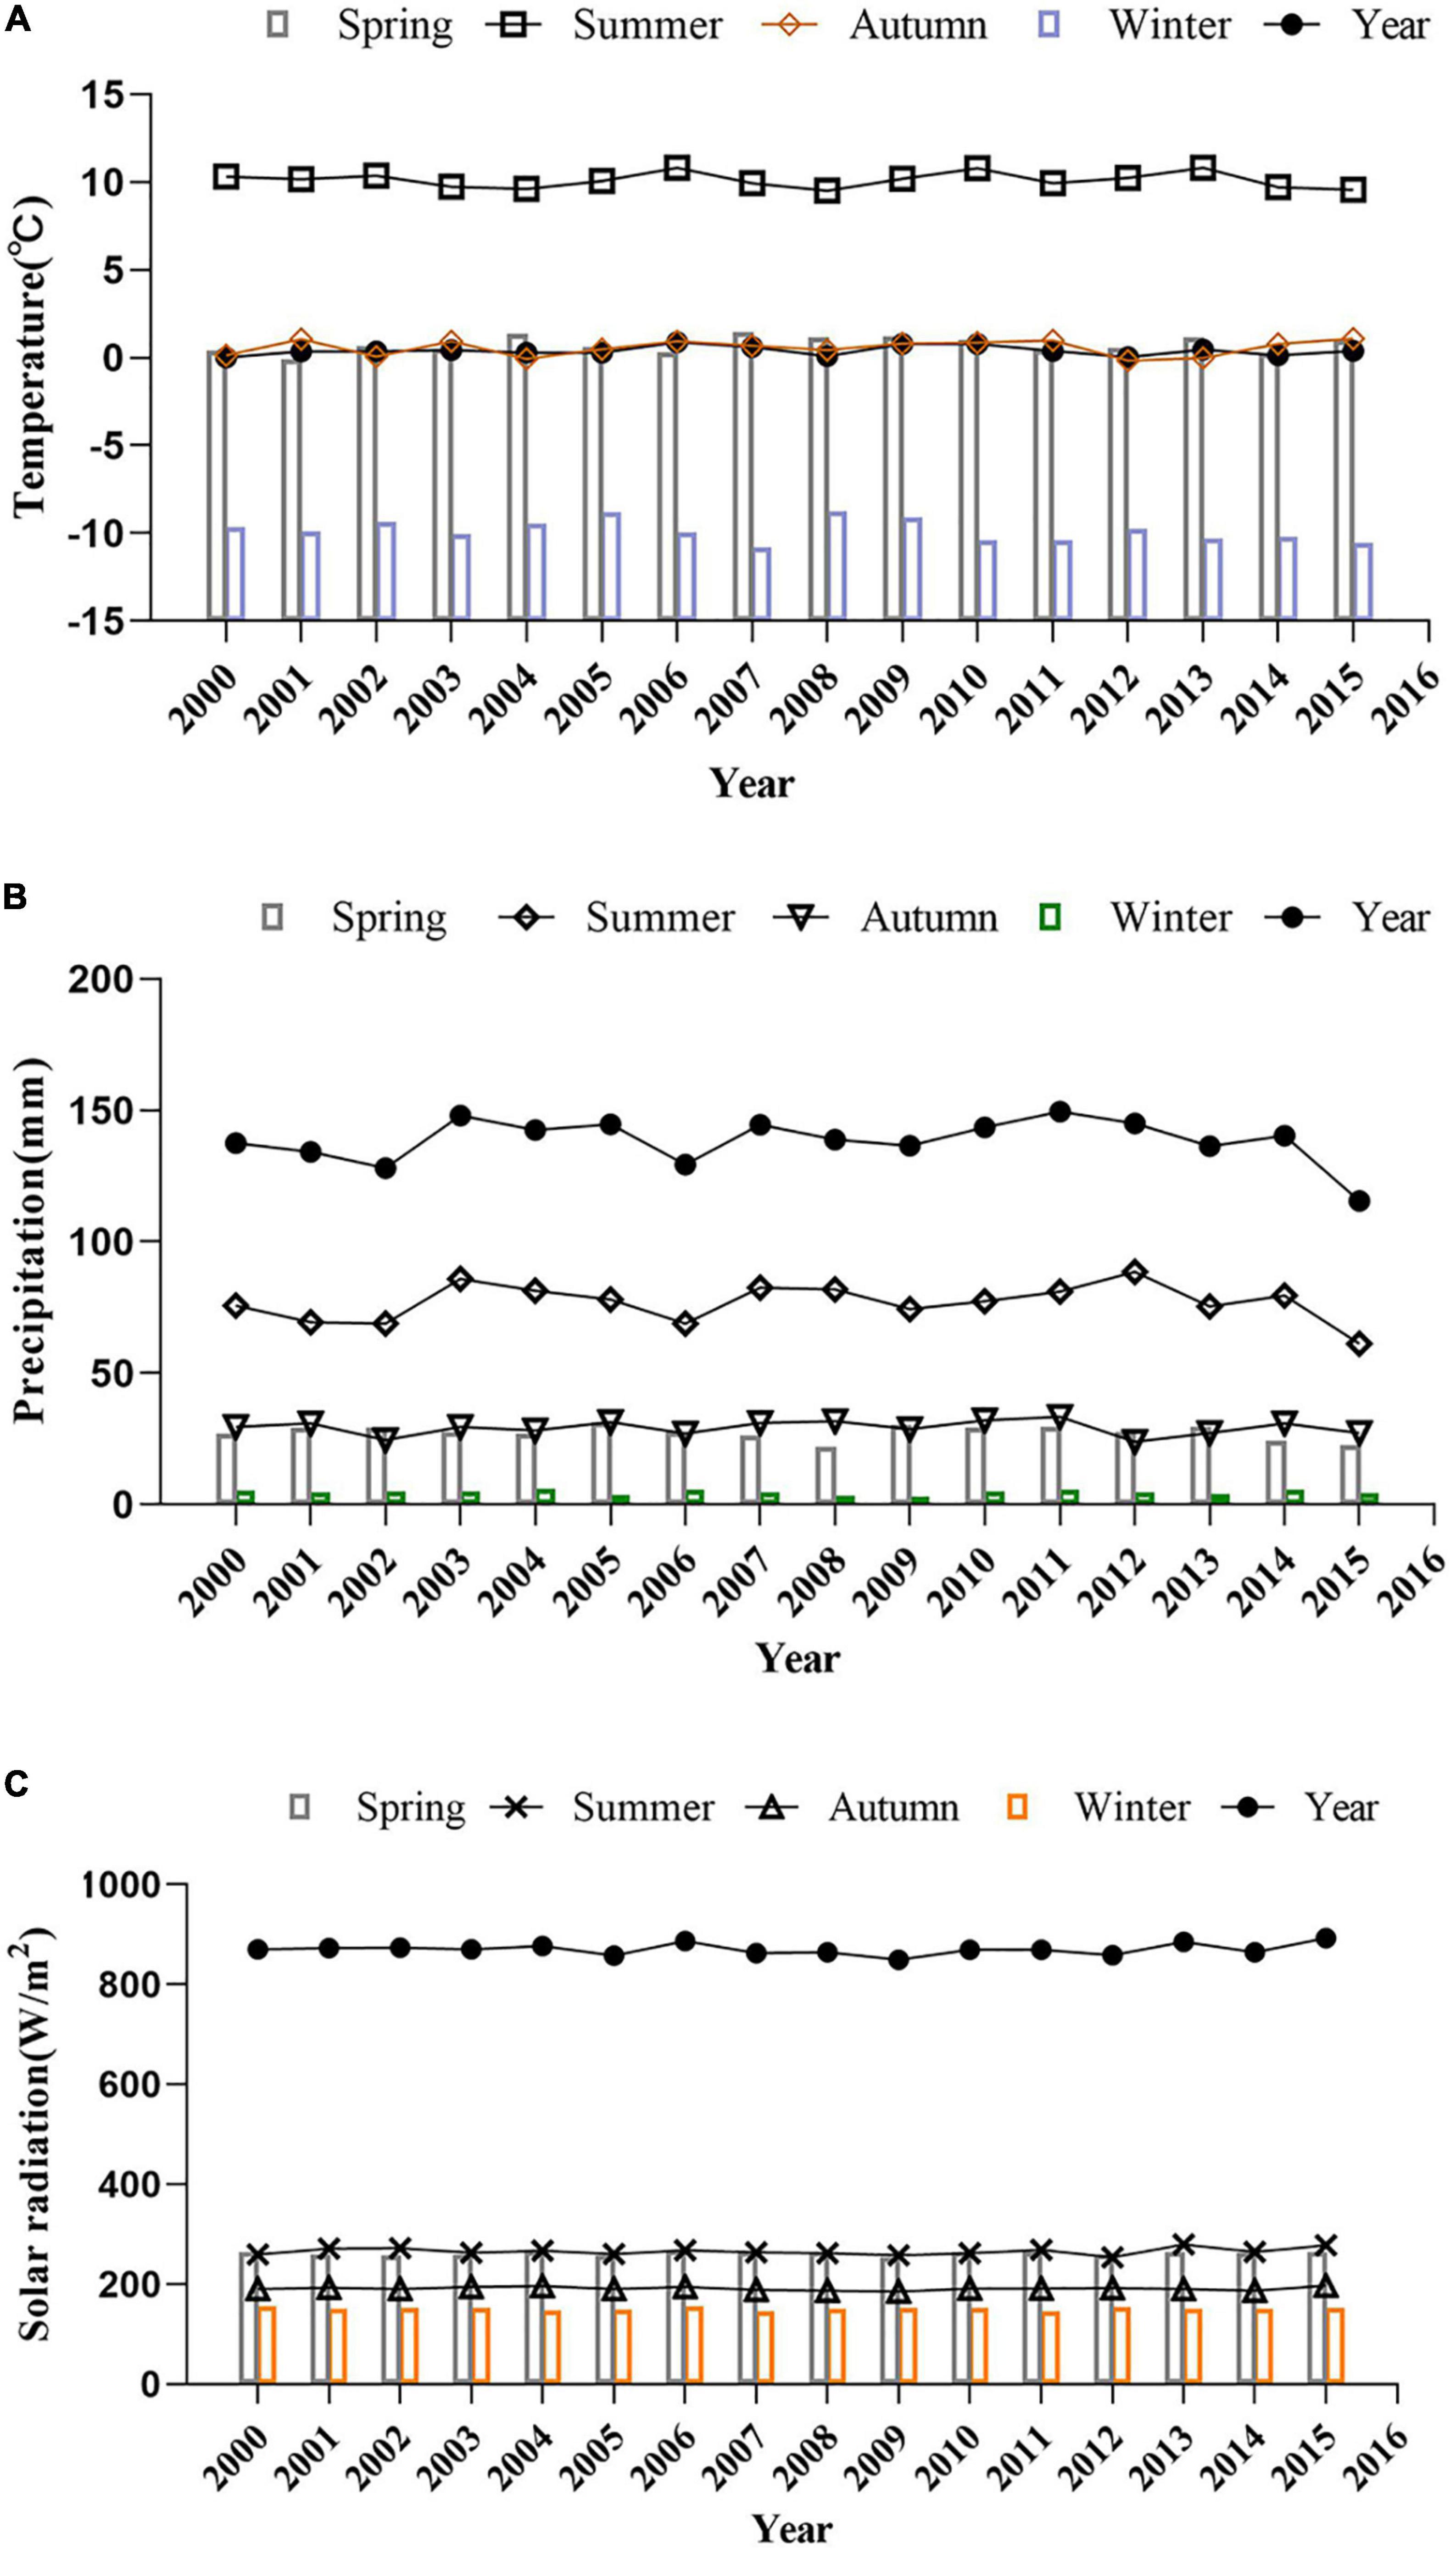
Figure 5. The change trend of (A) temperature, (B) precipitation, and (C) solar radiation from 2000 to 2015.
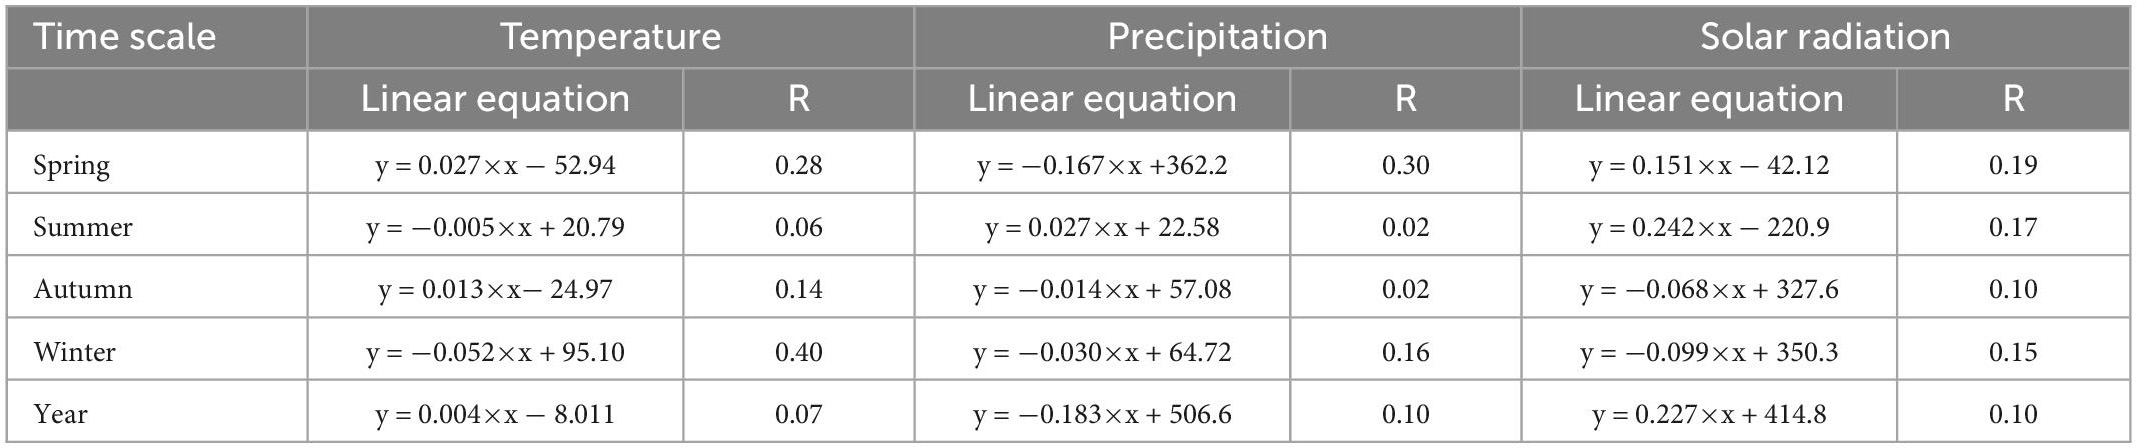
Table 1. The climate tendency rate statistical results of climate factor from 2000 to 2015.
The annual mean temperature of the wetlands was similar to the spring and autumn mean temperatures (all of them were around 0°C), displaying an increasing trend with a climatic tendency rate of 0.04, 0.27, and 0.13°C/10a, respectively. In contrast, the mean temperature in summer and winter showed a decreasing trend with a faster decrease in winter (−0.52°C/10a). In general, the warming in spring and autumn contributed more to the annual mean temperature change, giving a slightly increasing trend.
Precipitation was less in 2002, 2006, and 2015, not exceeding 130 mm, with more pronounced fluctuations. In general, it represented a decreasing trend with a climatic tendency rate of about −1.83 mm/10a. Except for summer, seasonal changes in precipitation could be seen as an overall decreasing trend, only with slightly different magnitudes, with the fastest decrease in spring (−1.67 mm/10a) and the slowest decrease in autumn (−0.14 mm/10a). Rainfall in winter was scarce, with a multi-year average of 4.75 mm, and also showed a decreasing trend (−0.3 mm/10a). Summer showed a slightly increasing trend with a climatic tendency rate of 0.27 mm/10a. Although precipitation in summer was an increasing trend, the increase was small and much less than the decrease in precipitation in other seasons. It is worth mentioning that the variation in precipitation was greater than the variation in temperature in each season, which may be due to changes in the monsoon system in East Asia (Wang et al., 2011).
Solar radiation displayed an increasing trend with a climatic tendency rate of about 2.27 W/m2/10a. Unlike the seasonal overall decreasing trend in precipitation, the seasonal differences in solar radiation were more pronounced. There was a decreasing trend in autumn (−0.68 W/m2/10a) and winter (−0.99 W/m2/10a). Solar radiation exceeded 250 W/m2 in both spring (1.51 W/m2/10a) and summer (2.42 W/m2/10a), and contributed more to the annual solar radiation variation.
In summary, the trends of the three meteorological elements show that climate change in the alpine wetlands of the TP had a tendency to develop toward dryness and heat.
3.3. Correlation analysis of NDVI and climatic factors
There is a correlation between climate and NDVI, which may be due to a certain degree of lag of vegetation growth on climate environment. For example, in case of heavy snowfall in winter or extreme drought in summer, the climate change in 1 month might affect the vegetation growth in the next month. The study found that the monthly average temperature, precipitation, and solar radiation of the wetlands in the TP from 2000 to 2015 were correlated with the monthly NDVI, and the results are shown in Table 2.
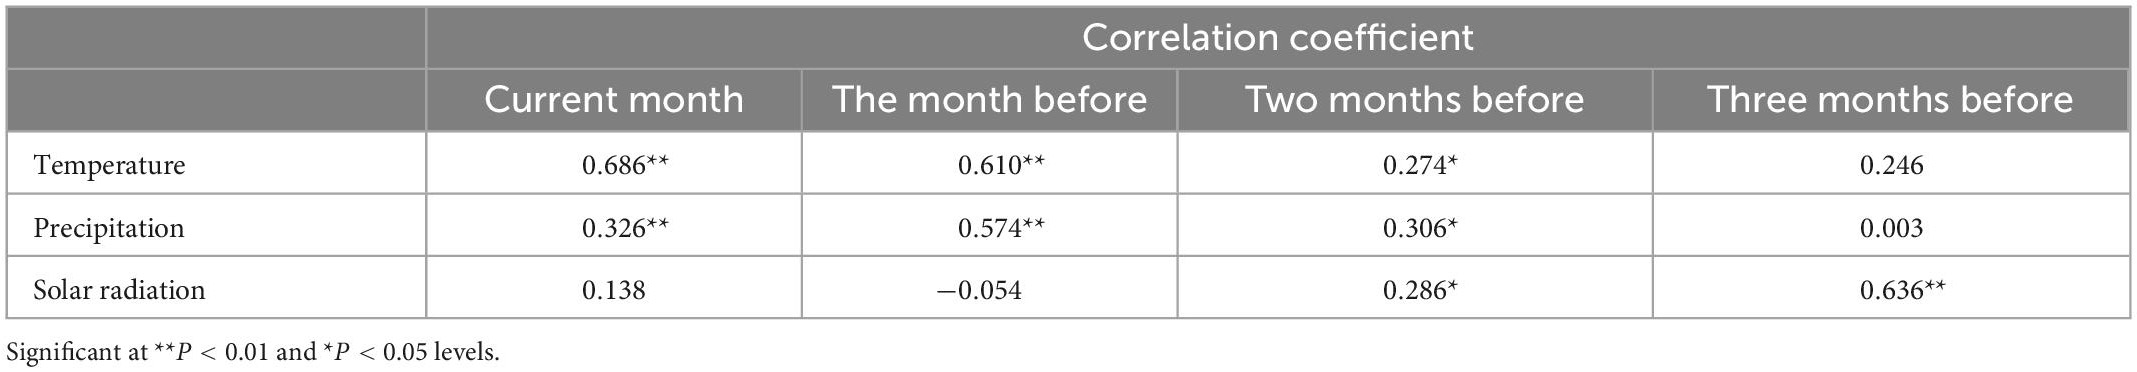
Table 2. Lag analysis of climate factors in different months on normalized difference vegetation index (NDVI).
As seen in Table 2, the NDVI of alpine wetland vegetation in the TP was more influenced by the temperature factor, with the highest correlation coefficient of 0.686 (P < 0.01). The temperature of the current month and the temperature of the previous month were both strongly correlated with the NDVI of the growing season month. For correlation coefficients ranging from 0.6 to 0.8, it indicated that the recent temperature factor of the vegetation growing season positively influenced the NDVI. And from Figure 6, we can get that the value of the real NDVI was higher than the value of linear regression when the temperature of the month before the growing season is higher than 10°C or lower than 8°C.
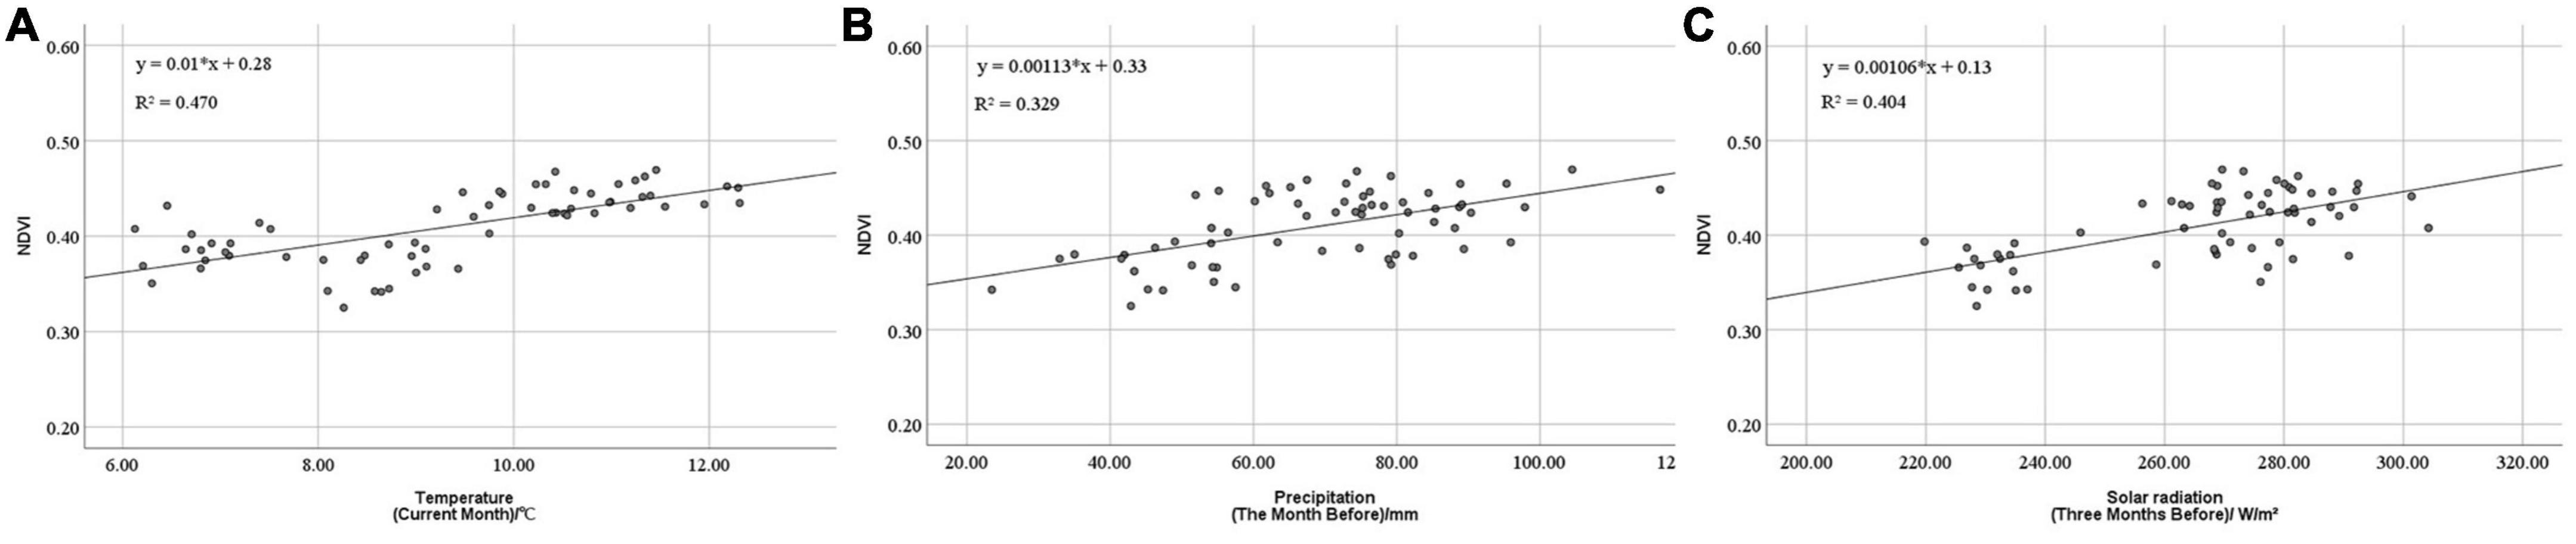
Figure 6. Relationship between the growing season normalized difference vegetation index (NDVI) of wetlands and climate in the TP from 2000 to 2015: (A) normalized difference vegetation index (NDVI) and temperature (the current month); (B) NDVI and precipitation (the month before); (C) NDVI and solar radiation (the 3 months before).
In contrast to the temperature factor which was greatly affected by the current month, the effect of solar radiation on vegetation was greater as time goes forward. The effect of solar radiation on NDVI was greater in the third month ahead than in the other times, reaching 0.636 (P < 0.01), which was a positive correlation (Figure 6C). The effect of solar radiation on NDVI was weaker or even uncorrelated at other times.
Precipitation in the month prior to the growing season had a greater effect on NDVI than precipitation in the current month, but the influence was not as strong as temperature and solar radiation, reaching only 0.574 (P < 0.01), which is a moderate correlation. This is consistent with Wang et al.’s (2011) study, where the correlation of mean temperature influenced the variation of NDVI on a long time scale. It can be seen from the relationship between NDVI in the growing season and the precipitation of the previous month (Figure 6B) that the higher the precipitation, the better the vegetation growth.
The relationship between precipitation, temperature, solar radiation factors, and wetland NDVI on the TP shows that all three climatic factors have a positive effect on NDVI, and there is a degree of lag between vegetation growth and changes in the climatic environment. The tipping points in vegetation NDVI between 2013 and 2014 may be due to abnormal weather in the first few months of the vegetation growing season.
3.4. Analysis of the impact of human activities on NDVI
Residual analysis calculated the trend of human activities by the difference between the real NDVI and the regression-predicted NDVI. Figure 7 plots the distribution of the residuals sorted by time. The statistical results demonstrate that there is an unclear positive trend. Before 2008, the residuals were mostly negative, indicating that human activities might have a negative impact on vegetation. Conversely, human activities gradually had a positive impact on vegetation after this period, but this impact was relatively minor. In general, the anthropogenic influence showed a continuing positive trend, while the wetland vegetation on the TP might still be mainly influenced by climate.
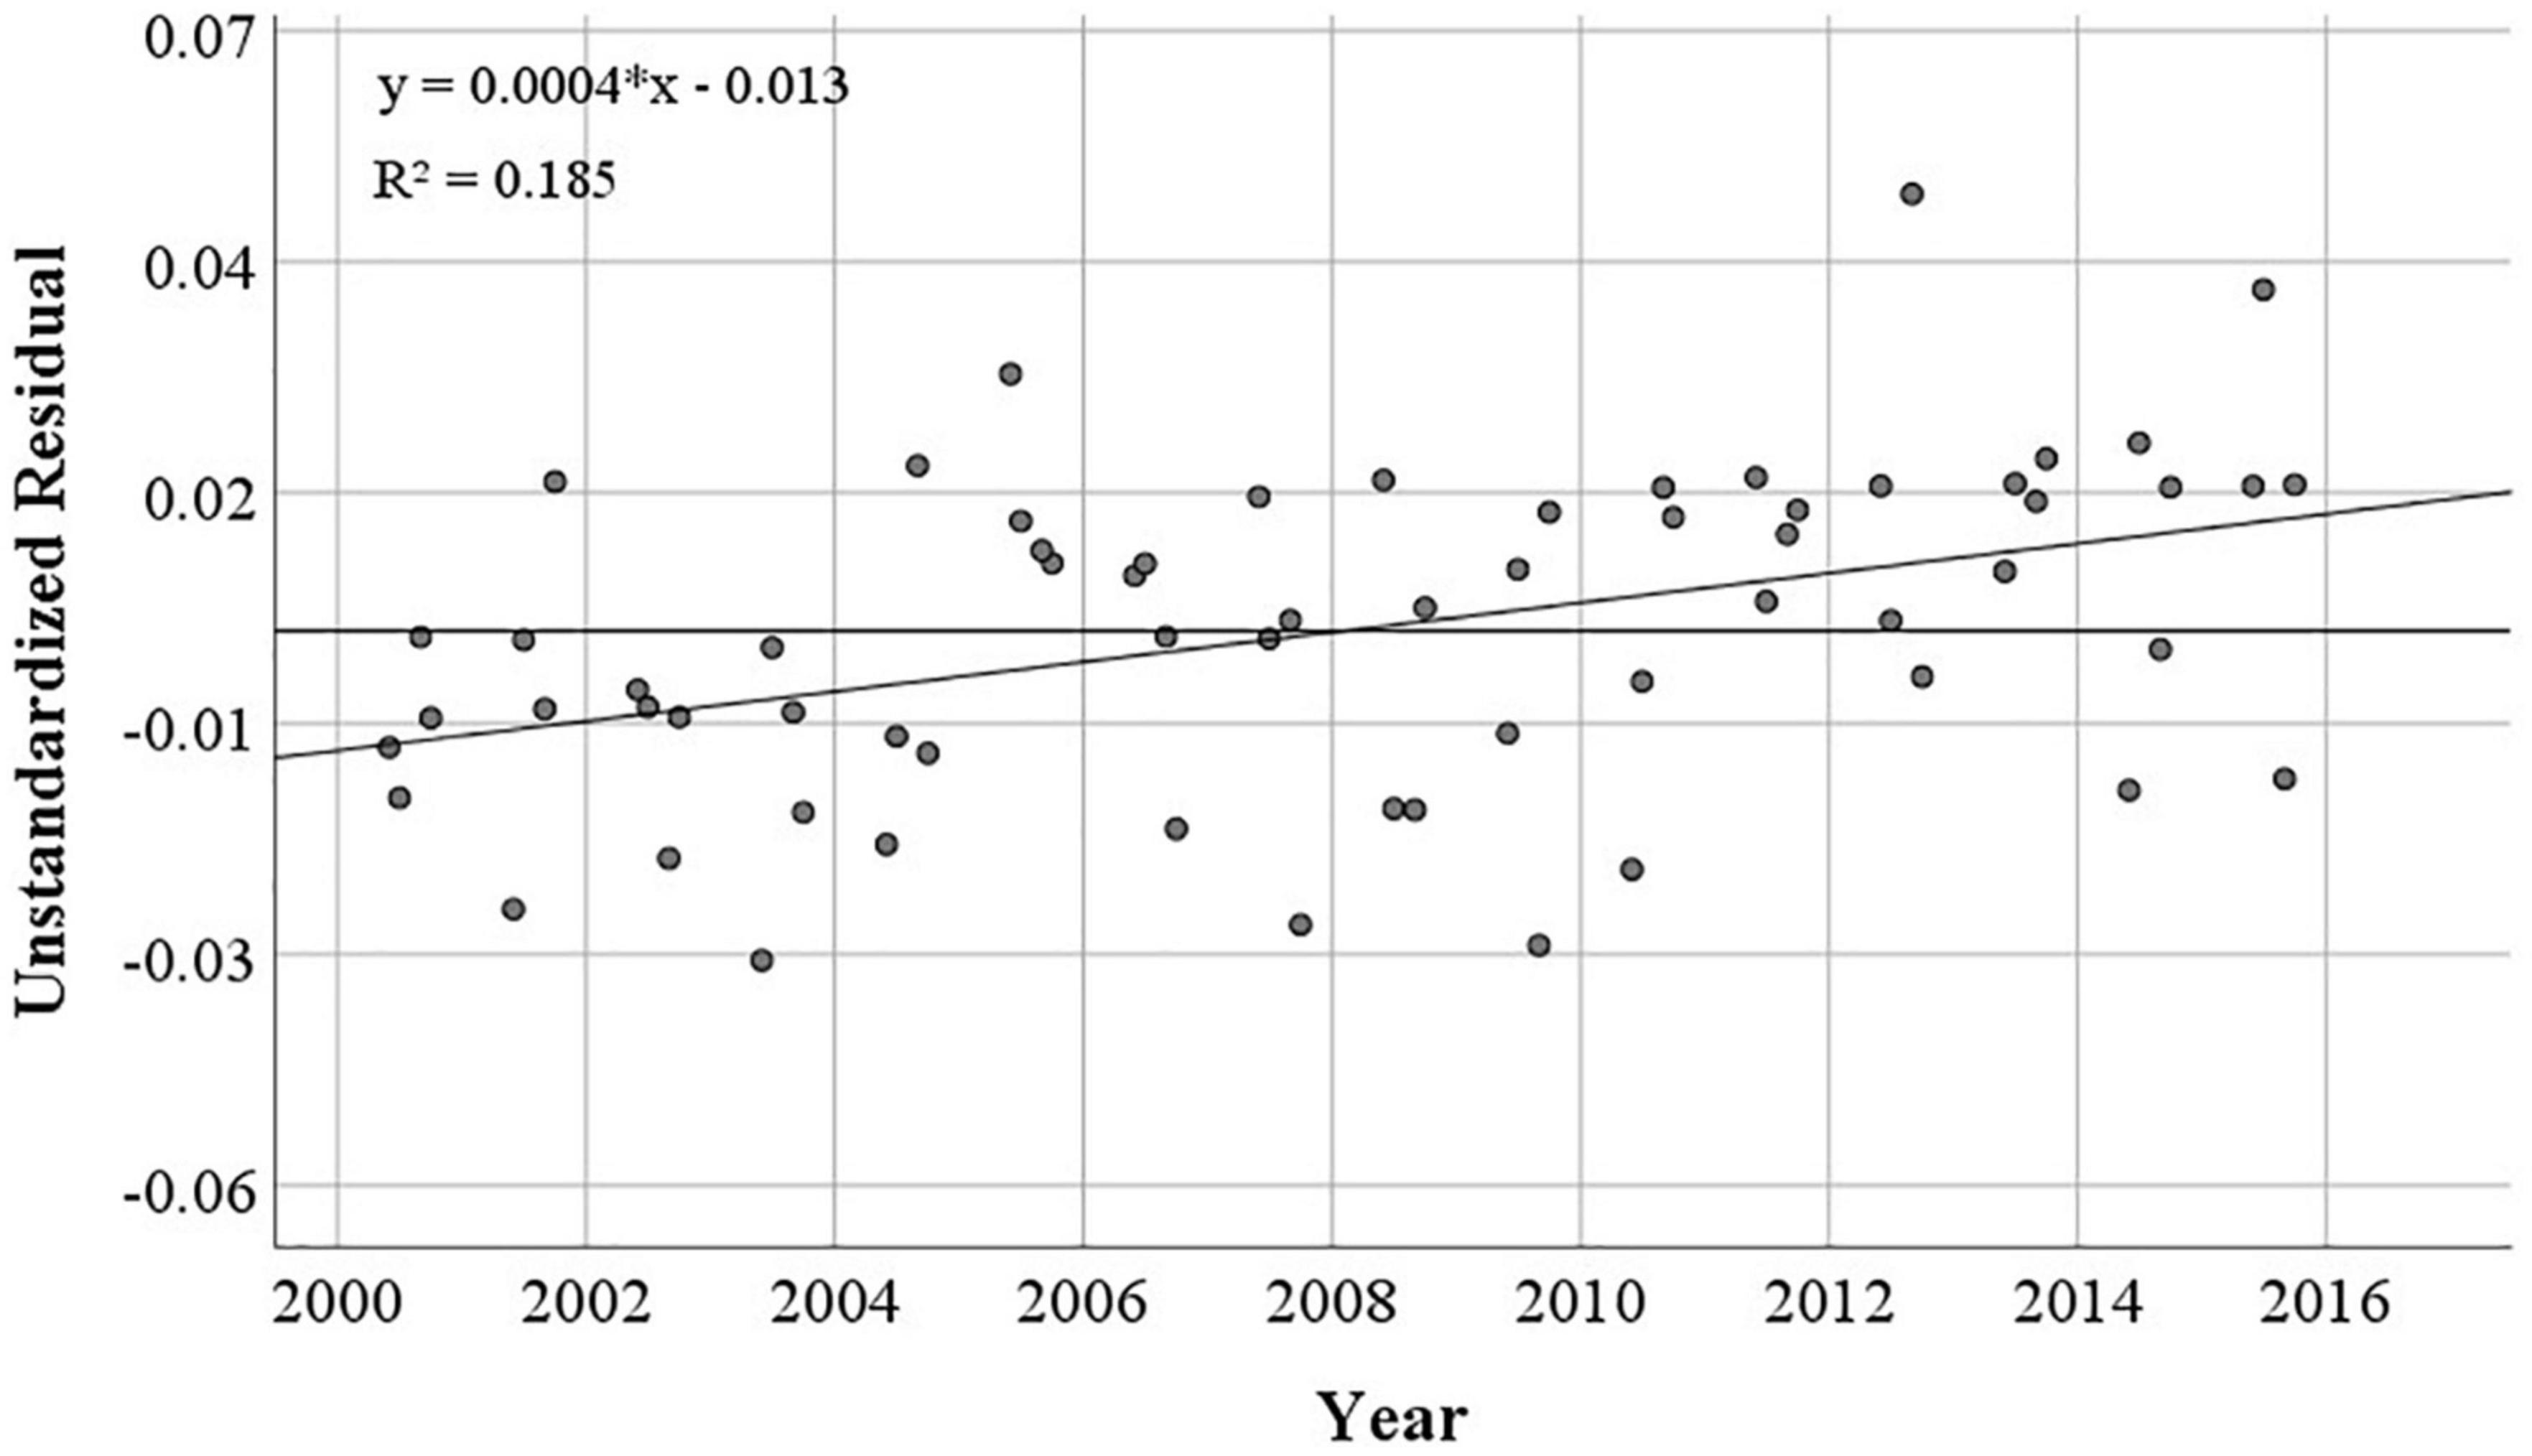
Figure 7. The temporal trend of unstandardized residuals.
4. Discussion
4.1. Responses of vegetation to climate
It was found that the annual mean NDVI increased from 2000 to 2015, and the mean NDVI in spring, summer and autumn also showed an increasing trend (Figure 4). The annual average temperature increased, precipitation decreased, and solar radiation increased (Table 1). Based on the analysis, the ecological environment of the TP developed toward a favorable direction under the positive impact of climate change, which is in accordance with the previous study (Wang and Han, 2012).
Surprisingly, we found that various scholars had different findings about the trend of precipitation on the TP. Some scholars found that the average annual precipitation had a decreasing trend (Wang and Han, 2012; Zhang et al., 2016; Tang et al., 2018; Zhe and Zhang, 2021) while others believed that the TP was showing warm and humid development (Sun and Qin, 2016; Shen et al., 2022). There may be three possible reasons for this phenomenon: (1) Spatial differences. The whole TP was warm and humid overall (Sun and Qin, 2016), but there were rainfall differences in different regions. (2) Temporal differences. Some scholars revealed a decline in precipitation by 2008 (Wang and Han, 2012; Zhang et al., 2016), while others found an increase by 2020 (Shen et al., 2022). (3) Vegetation species differences. Different types of vegetation may produce different sensitivities to climatic change. For example, from 2000 to 2017, the growing season precipitation of herbaceous marshes and seasonal brackish marshes on the TP showed an overall upward trend, while marshy meadows and inland salt marshes had a downward trend (Kun et al., 2020). Therefore, the present study area is the wetland area of the TP with a trend of dry heat development from 2000 to 2015.
Mutations may be associated with phenology, long term changes and a “remainder” component related to irregular short-term variations or noise (e.g., clouds or atmospheric scatter) (Lambert et al., 2015). The annual as well as the spring, the summer average NDVI reached the highest value within 16 years in 2013 (Figure 4). The tipping point of NDVI was at this time. In 2013, the temperature was at a high value at the corresponding time and the vegetation growth was good due to the positive correlation between temperature and vegetation growth. The precipitation in spring was also at a high value, providing a good base for vegetation growth. The average monthly solar radiation in spring reached the second highest value within 15 years (264.77 W/m2) and the highest value in summer (279.34 W/m2). Adequate light ensured lush vegetation growth. In the following 2 years, the precipitation and temperature decreased to a certain extent (Figures 5A, B), which may also lead to the vegetation growth being worse than that in 2013. Therefore, in BFAST detection, NDVI after 2013 has a downward trend.
The results of Mann–Kendall mutation test (Figure 8) showed that the changes in vegetation were approximately in line with the changes in meteorology. All three meteorological statistics had changes in 2013 (abrupt changes occurred when the UF and UB curves intersected). Among them, temperature and precipitation showed an increasing trend after a period of stability, with a trend of change after 2013, which was able to verify the abrupt change point of vegetation in 2013. For solar radiation, the UF and UB curves clearly intersected after 2013. Thus, the vegetation growth status changed equally when meteorological changes occurred, further proving that vegetation responds to climate.
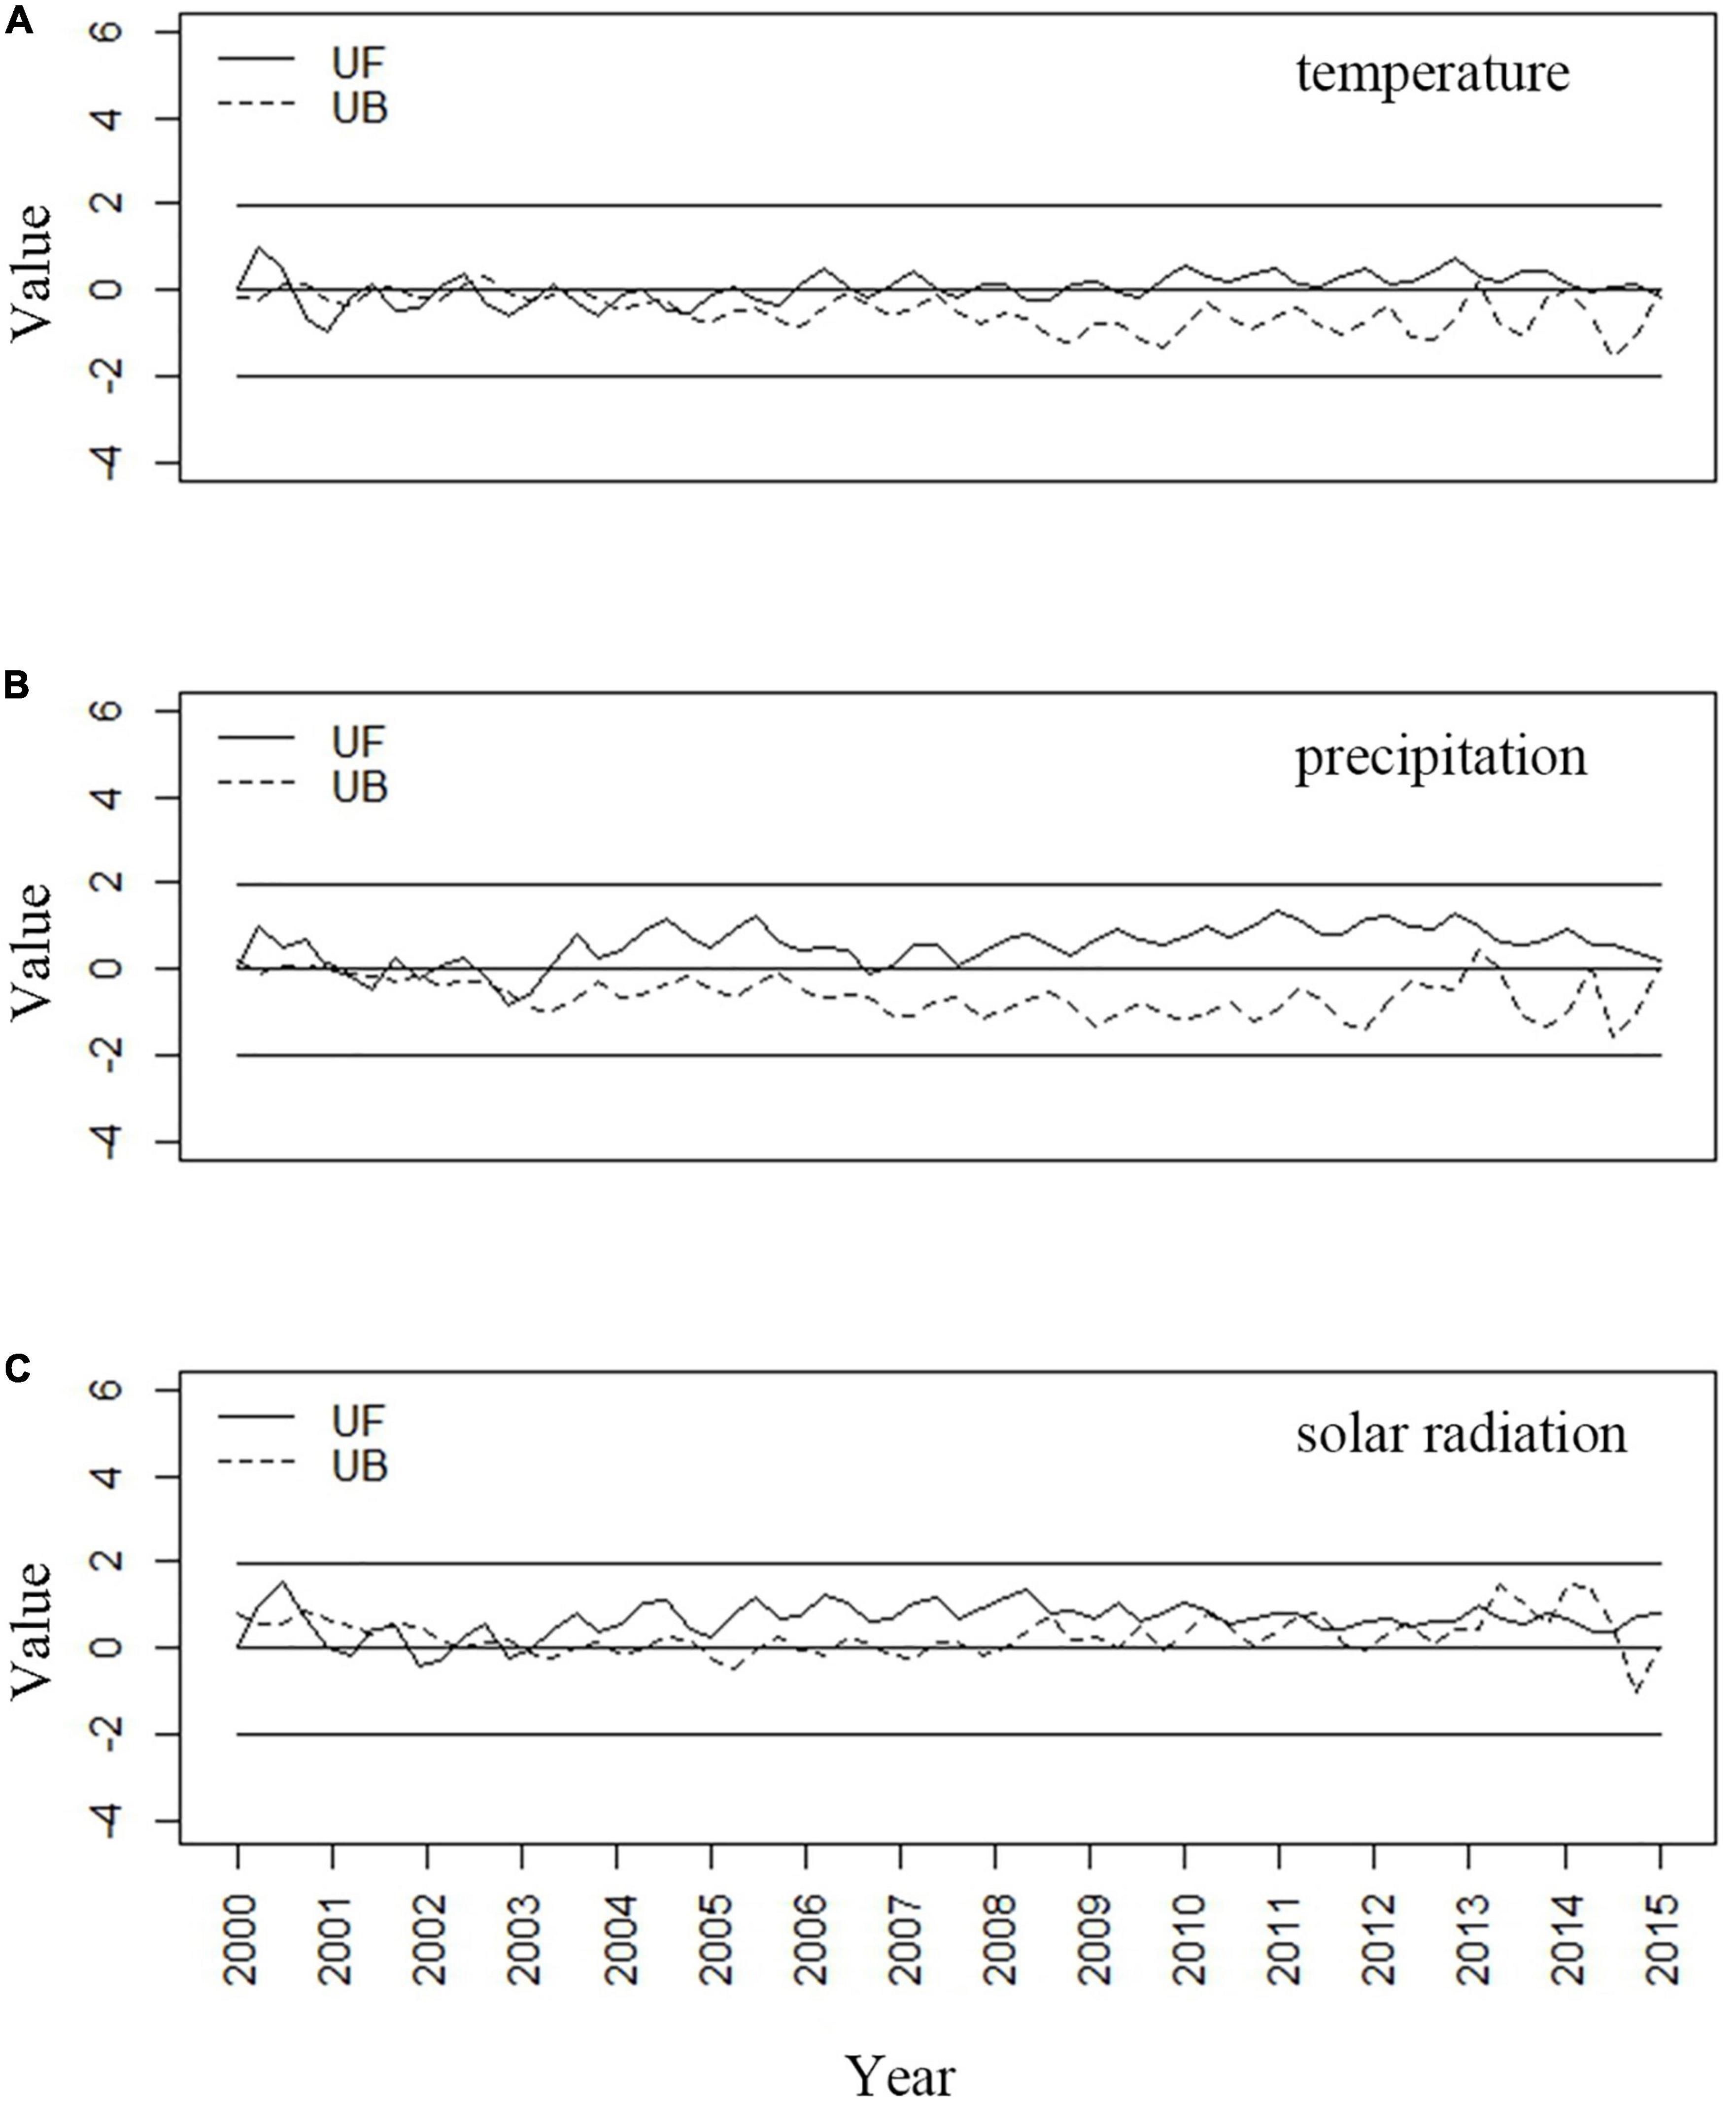
Figure 8. Mann–Kendall statistic curve of climate in vegetation growing season: (A) temperature (the current month); (B) precipitation (the month before); (C) solar radiation (the 3 months before).
4.2. Effect on vegetation greenness
The time lag effects of the vegetation responses to climates (Table 2) show significantly different lag effects of vegetation responses to different climatic factors. Consequently, there was a significant correlation (P < 0.01) between the temperature and the growing season NDVI of the wetland. The inapparent time lag effect of air temperature may be due to a fact: it is a natural law that air temperature varies seasonally. During the plant growing season, air temperature is a key trigger for certain vegetation growth periods, and vegetation follows the change of air temperature into different growth periods (Duo et al., 2017). Thus, there is an inconspicuous time lag effect of air temperature on plant growth at the monthly scale. At the same time, we found that NDVI of wetland on the TP was more sensitive to temperature, which is consistent with the findings of Shen et al. (2014), Sun and Qin (2016), and Wang et al. (2020). Without water shortage, the temperature was the primary factor limiting vegetation growth, and the influence of precipitation on vegetation growth was less important.
Precipitation and solar radiation have a time-lag effect on NDVI. The time lag of the vegetation responses to precipitation in wetlands is approximately 1 month. In line with the findings of Zhe and Zhang (2021), NDVI values were most correlated with the cumulative climate values of the current and previous months. The difference is that we found that the precipitation of the previous month has a higher correlation with NDVI. For solar radiation, the more forward the time is, the higher the correlation is. The time lag to solar radiation is 3 months which matches the observed in earlier studies (Wu et al., 2015). Possibly because the solar radiation in spring and summer is relatively consistent, so compared with other regions, vegetation on the TP is exposed to sufficient solar radiation earlier for photosynthesis.
The NDVI of wetland vegetation on the TP shows an overall upward trend, indicating that the vegetation is growing more luxuriantly. The major climate-driven factors for vegetation growth are diverse and are closely related to vegetation characteristics and climatic conditions. For the wetland areas of the Tibetan Plateau, the temperature is the primary factor that drives vegetation growth. Within a certain temperature range, the higher the temperature, the better the vegetation growth condition. Higher temperatures and more rain can promote photosynthesis, maintaining the role of wetlands as carbon sinks (Salimi et al., 2021). It should be noted that enhanced evapotranspiration and permafrost degradation might create an imbalance in soil temperature, moisture, and nutrients, limiting the growth of alpine vegetation (Yi et al., 2014; Wang et al., 2016).
Meanwhile, The result of NDVI residual (Figure 7) indicates that human activities have little positive impact. This study confirms that the TP is relatively undisturbed by human activities (Li et al., 2022). Wetlands were degraded and reduced in size from 1967 to 2004 (Zhang et al., 2011), however, they have since grown in size, which may be caused by human activities. In terms of vegetation growth, we believe that it is mainly affected by climate.
Overall, this study provides a theoretical basis for revealing the time-lag effects of alpine wetland vegetation responses to climate, and the results hold significant value for the climate-based prediction of variations in vegetation growth in the future.
4.3. Limitations and future work
The current study in this paper may have certain uncertainties and shortcomings. Firstly, the remote sensing data used in this study may be affected by clouds, atmosphere, solar altitude angle, and other factors, so the uncertainty of the data itself may affect the research results of this paper. Secondly, the climate of the TP is complex. It is a debatable issue whether the wetlands on the TP are developing warm and humid or dry and hot. Our next plan anticipates expanding the study time to discuss climate change over a longer time scale. In addition, wetland vegetation species are diverse and the growth periods are not identical, and the meteorological effects on different wetland vegetation need to be further revealed. In order to more accurately reveal wetland vegetation changes and their mechanisms on the TP, future studies need to be further supported by more precise data and research methods.
5. Conclusion
Taking alpine wetlands in the TP as an example, this research used mutation detection, correlation analysis and residual analysis to study the relationship between climate change, human activities and vegetation. The conclusion are divided into four specific sections.
(1) The NDVI of wetlands on the TP showed a slight upward trend from 2000 to 2015, indicating an increase in vegetation greenness. The abrupt change in NDVI occurred between 2013 and 2014, and the NDVI values increased before the abrupt change and decreased after the abrupt change.
(2) Temperature (0.04°C/10a) and solar radiation (2.27 W/m2/10a) increased and precipitation (−1.83 mm/10a) decreased, which means the wetlands of the TP showed a trend of dry-heating. Climate change varies widely from season to season.
(3) NDVI of alpine wetland vegetation on the TP was strongly influenced by temperature factors. Precipitation in the first month before and solar radiation in the 3 months before were higher correlated with the NDVI of the vegetation growing season, reflecting the time-lag effect.
(4) NDVI residual values were both positive and negative, with an overall slight upward trend with time. Human activities may have little positive impact on wetland vegetation in the TP.
Data availability statement
Publicly available datasets were analyzed in this study. This data can be found here: http://www.resdc.cn and http://data.tpdc.ac.cn/zh-hans/.
Author contributions
YC and JW: conceptualization. YC, LS, and JX: methodology, formal analysis, and investigation. YC and JX: software. YC: validation, data curation, writing—original draft preparation, and visualization. YC and LS: resources. BL, LS, and JW: writing—review and editing. JW, BL, and NX: supervision. JW: project administration and funding acquisition. All authors have read and agreed to the published version of the manuscript.
Funding
This research was funded by The Second Tibetan Plateau Scientific Exploration (grant no. 2019QZKK0608) and National Natural Science Foundation of China (grant nos. 42171329 and 42077454).
Acknowledgments
This is a short text to acknowledge the contributions of specific colleagues, institutions, or agencies that aided the efforts of the authors.
Conflict of interest
The authors declare that the research was conducted in the absence of any commercial or financial relationships that could be construed as a potential conflict of interest.
Publisher’s note
All claims expressed in this article are solely those of the authors and do not necessarily represent those of their affiliated organizations, or those of the publisher, the editors and the reviewers. Any product that may be evaluated in this article, or claim that may be made by its manufacturer, is not guaranteed or endorsed by the publisher.
Footnotes
References
Bao, G., Qin, Z., Bao, Y., Zhou, Y., Li, W., and Sanjjav, A. (2014). NDVI-based long-term vegetation dynamics and its response to climatic change in the Mongolian Plateau. Remote Sens. 6, 8337–8358. doi: 10.3390/rs6098337
Chen, X., Wang, X., Feng, X., Zhang, X., and Luo, G. (2021). Ecosystem service trade-off and synergy on Qinghai-Tibet Plateau. Geogr. Res 40, 18–34. doi: 10.1016/j.jenvman.2021.112447
Chu, H., Venevsky, S., Wu, C., and Wang, M. (2019). NDVI-based vegetation dynamics and its response to climate changes at Amur-Heilongjiang River Basin from 1982 to 2015. Sci. Total Environ. 650, 2051–2062. doi: 10.1016/j.scitotenv.2018.09.115
Colak, I., Sagiroglu, S., Demirtas, M., and Yesilbudak, M. (2013). A data mining approach: Analyzing wind speed and insolation period data in Turkey for installations of wind and solar power plants. Energy Conv. Manag. 65, 185–197. doi: 10.1016/j.enconman.2012.07.011
Dakhil, M. A., Xiong, Q., Farahat, E. A., Zhang, L., Pan, K., Pandey, B., et al. (2019). Past and future climatic indicators for distribution patterns and conservation planning of temperate coniferous forests in southwestern China. Ecol. Indic. 107:105559. doi: 10.1016/j.ecolind.2019.105559
Diao, C., Liu, Y., Zhao, L., Zhuo, G., and Zhang, Y. (2021). Regional-scale vegetation-climate interactions on the Qinghai-Tibet Plateau. Ecol. Inform. 65:101413. doi: 10.1016/j.ecoinf.2021.101413
Ding, M., Zhang, Y., Sun, X., Liu, L., Wang, Z., and Bai, W. (2013). Spatiotemporal variation in alpine grassland phenology in the Qinghai-Tibetan Plateau from 1999 to 2009. Chin. Sci. Bull. 58, 396–405. doi: 10.1007/s11434-012-5407-5
Duo, A., Zhao, W., Gong, Z., Zhang, M., and Fan, Y. (2017). Temporal analysis of climate change and its relationship with vegetation cover on the north china plain from 1981 to 2013. Acta Ecol. Sin. 37, 576–592. doi: 10.5846/stxb201507301600
Evans, J., and Geerken, R. (2004). Discrimination between climate and human-induced dryland degradation. J. Arid Environ. 57, 535–554. doi: 10.3390/s18113676
Fang, X., Zhu, Q., Ren, L., Chen, H., Wang, K., and Peng, C. (2018). Large-scale detection of vegetation dynamics and their potential drivers using MODIS images and BFAST: A case study in Quebec, Canada. Remote Sens. Environ. 206, 391–402. doi: 10.1016/j.rse.2017.11.017
Feng, F., and Wang, K. (2020). High spatial resolution (10km) surface solar radiation dataset with by merging sunshine hours over China China (1983-2017). Beijing: National Tibetan Plateau Data Center.
Fernández-Giménez, M. E., Venable, N. H., Angerer, J., Fassnacht, S. R., Reid, R. S., and Khishigbayar, J. (2017). Exploring linked ecological and cultural tipping points in Mongolia. Anthropocene 17, 46–69. doi: 10.1016/j.ancene.2017.01.003
Gholamnia, M., Khandan, R., Bonafoni, S., and Sadeghi, A. (2019). Spatiotemporal analysis of MODIS NDVI in the semi-arid region of Kurdistan (Iran). Remote Sens. 11:1723. doi: 10.3390/rs11141723
Goodwin, M. J., Zald, H. S., North, M. P., and Hurteau, M. D. (2021). Climate-driven tree mortality and fuel aridity increase wildfire’s potential heat flux. Geophys. Res. Lett. 48:e2021GL094954. doi: 10.1029/2021GL094954
Guo, B., Zhou, Y., Wang, S.-X., and Tao, H.-P. (2014). The relationship between normalized difference vegetation index (NDVI) and climate factors in the semiarid region: A case study in Yalu Tsangpo River basin of Qinghai-Tibet Plateau. J. Mountain Sci. 11, 926–940. doi: 10.1007/s11629-013-2902-3
Herrmann, S. M., Anyamba, A., and Tucker, C. J. (2005). Recent trends in vegetation dynamics in the African Sahel and their relationship to climate. Glob. Environ. Change 15, 394–404. doi: 10.1016/j.gloenvcha.2005.08.004
Higginbottom, T. P., and Symeonakis, E. (2014). Assessing land degradation and desertification using vegetation index data: Current frameworks and future directions. Remote Sens. 6, 9552–9575. doi: 10.3390/rs6109552
Holben, B. N. (1986). Characteristics of maximum-value composite images from temporal AVHRR data. Int. J. Remote Sens. 7, 1417–1434. doi: 10.1080/01431168608948945
Jiang, L., Bao, A., Guo, H., and Ndayisaba, F. (2017). Vegetation dynamics and responses to climate change and human activities in Central Asia. Sci. Total Environ. 599, 967–980. doi: 10.1016/j.scitotenv.2017.05.012
Kendall, M. G. (1938). A new measure of rank correlation. Biometrika 30, 81–93. doi: 10.1093/biomet/30.1-2.81
Kirillin, G. B., Shatwell, T., and Wen, L. (2021). Ice-Covered lakes of tibetan plateau as solar heat collectors. Geophys. Res. Lett. 48:e2021GL093429. doi: 10.1029/2021GL093429
Kraaijenbrink, P. D., Bierkens, M., Lutz, A., and Immerzeel, W. (2017). Impact of a global temperature rise of 1.5 degrees Celsius on Asia’s glaciers. Nature 549, 257–260. doi: 10.1038/nature23878
Kun, X., Zhang, J., and Lv, X. (2020). Spatio-temporal change ofmarshes NDVI and its response to climate change in the Qinghai-Tibet Plateau. Acta Ecol. Sin. 40, 6259–6268.
Lambert, J., Denux, J.-P., Verbesselt, J., Balent, G., and Cheret, V. (2015). Detecting clear-cuts and decreases in forest vitality using MODIS NDVI time series. Remote Sens. 7, 3588–3612. doi: 10.3390/rs70403588
Lenton, T. M. (2013). Environmental tipping points. Ann. Rev. Environ. Resour. 38, 1–29. doi: 10.1146/annurev-environ-102511-084654
Li, X., Long, D., Scanlon, B. R., Mann, M. E., Li, X., Tian, F., et al. (2022). Climate change threatens terrestrial water storage over the Tibetan Plateau. Nat. Clim. Change 12, 801–807. doi: 10.1038/s41558-022-01443-0
Mitsch, W. J., Gosselink, J. G., Zhang, L., and Anderson, C. J. (2009). Wetland ecosystems. New York, NY: John Wiley & Sons.
Peng, S. (2019). 1-km Monthly Mean Temperature Dataset for China (1901–2017). Beijing: National Tibetan Plateau Data Center.
Peng, S. (2020). 1-km Monthly Precipitation Dataset for China (1901–2017). Beijing: National Tibetan Plateau Data Center. doi: 10.5194/essd-2019-145
Piao, S., Friedlingstein, P., Ciais, P., Viovy, N., and Demarty, J. (2007). Growing season extension and its impact on terrestrial carbon cycle in the Northern Hemisphere over the past 2 decades. Glob. Biogeochem. Cycles 21:B3018. doi: 10.1029/2006GB002888
Xu, X. C., Li, B. J., Liu, X. P., Li, X., and Shi, Q. (2021). Mapping annual global land cover changes at a 30 m resolution from 2000 to 2015. Natl. Remote Sens. Bull. 25, 1896–1916. doi: 10.11834/jrs.20211261
Rezaei, A., and Gurdak, J. J. (2020). Large-scale climate variability controls on climate, vegetation coverage, lake and groundwater storage in the Lake Urmia watershed using SSA and wavelet analysis. Sci. Total Environ. 724:138273. doi: 10.1016/j.scitotenv.2020.138273
Richard, Y., and Poccard, I. (1998). A statistical study of NDVI sensitivity to seasonal and interannual rainfall variations in Southern Africa. Int. J. Remote Sens. 19, 2907–2920. doi: 10.1080/014311698214343
Salick, J., Ghimire, S. K., Fang, Z., Dema, S., and Konchar, K. M. (2014). Himalayan alpine vegetation, climate change and mitigation. J. Ethnobiol. 34, 276–293. doi: 10.2993/0278-0771-34.3.276
Salimi, S., Almuktar, S. A., and Scholz, M. (2021). Impact of climate change on wetland ecosystems: A critical review of experimental wetlands. J. Environ. Manag. 286:112160. doi: 10.1016/j.jenvman.2021.112160
Shadmani, M., Marofi, S., and Roknian, M. (2012). Trend analysis in reference evapotranspiration using Mann-Kendall and Spearman’s Rho tests in arid regions of Iran. Water Resour. Manag. 26, 211–224. doi: 10.1007/s11269-011-9913-z
Shen, X., Liu, Y., Zhang, J., Wang, Y., Ma, R., Liu, B., et al. (2022). Asymmetric impacts of diurnal warming on vegetation carbon sequestration of marshes in the Qinghai Tibet Plateau. Glob. Biogeochem. Cycles 36:e2022GB007396. doi: 10.1029/2022GB007396
Shen, Z., Fu, G., Yu, C., Sun, W., and Zhang, X. (2014). Relationship between the growing season maximum enhanced vegetation index and climatic factors on the Tibetan Plateau. Remote Sens. 6, 6765–6789. doi: 10.3390/rs6086765
Sun, J., and Qin, X. (2016). Precipitation and temperature regulate the seasonal changes of NDVI across the Tibetan Plateau. Environ. Earth Sci. 75, 1–9. doi: 10.1111/gcb.13081
Sun, J., Qin, X., and Yang, J. (2016). The response of vegetation dynamics of the different alpine grassland types to temperature and precipitation on the Tibetan Plateau. Environ. Monit. Assess. 188, 1–11. doi: 10.1007/s10661-015-5014-4
Tang, Z., Sun, G., Zhang, N., He, J., and Wu, N. (2018). Impacts of land-use and climate change on ecosystem service in Eastern Tibetan Plateau, China. Sustainability 10:467. doi: 10.3390/su10020467
Timoney, K. P., Mamet, S. D., Cheng, R., Lee, P., Robinson, A. L., Downing, D., et al. (2019). Tree cover response to climate change in the forest-tundra of north-central Canada: fire-driven decline, not northward advance. Écoscience 26, 133–148. doi: 10.1080/11956860.2018.1532868
Verbesselt, J., Hyndman, R., Newnham, G., and Culvenor, D. (2010a). Detecting trend and seasonal changes in satellite image time series. Remote Sens. Environ. 114, 106–115. doi: 10.1016/j.rse.2009.08.014
Verbesselt, J., Hyndman, R., Zeileis, A., and Culvenor, D. (2010b). Phenological change detection while accounting for abrupt and gradual trends in satellite image time series. Remote Sens. Environ. 114, 2970–2980. doi: 10.1016/j.rse.2010.08.003
Wang, F., Zhao, G., Mu, X., Gao, P., and Sun, W. (2014). Regime shift identification of runoff and sediment loads in the Yellow River Basin, China. Water 6, 3012–3032. doi: 10.3390/w6103012
Wang, G., Bai, W., Li, N., and Hu, H. (2011). Climate changes and its impact on tundra ecosystem in Qinghai-Tibet Plateau, China. Clim. Change 106, 463–482. doi: 10.1007/s10584-010-9952-0
Wang, G., and Han, L. (2012). “The vegetation NDVI variation trend in Qinghai-Tibet Plateau and its response to climate change,” in Proceedings of the 2012 2nd International Conference on Remote Sensing, Environment and Transportation Engineering, (Manhattan, NY: IEEE), 1–4.
Wang, Q., and Qiu, H.-N. (2009). Situation and outlook of solar energy utilization in Tibet, China. Renew. Sustain. Energy Rev. 13, 2181–2186. doi: 10.1016/j.rser.2009.03.011
Wang, R., He, M., and Niu, Z. (2020). Responses of alpine wetlands to climate changes on the Qinghai-Tibetan Plateau based on remote sensing. Chin. Geograph. Sci. 30, 189–201. doi: 10.1007/s11769-020-1107-2
Wang, X., Yi, S., Wu, Q., Yang, K., and Ding, Y. (2016). The role of permafrost and soil water in distribution of alpine grassland and its NDVI dynamics on the Qinghai-Tibetan Plateau. Glob. Planet. Change 147, 40–53. doi: 10.1016/j.gloplacha.2016.10.014
Wang, Y., Shen, X., Jiang, M., Tong, S., and Lu, X. (2021). Spatiotemporal change of aboveground biomass and its response to climate change in marshes of the Tibetan Plateau. Int. J. Appl. Earth Observ. Geoinform. 102:102385. doi: 10.1016/j.jag.2021.102385
Watts, L. M., and Laffan, S. W. (2014). Effectiveness of the BFAST algorithm for detecting vegetation response patterns in a semi-arid region. Remote Sens. Environ. 154, 234–245. doi: 10.1016/j.rse.2014.08.023
Wei, X., and Wu, P. (2021). Responses of soil insect communities to alpine wetland degradation on the eastern Qinghai-Tibetan Plateau, China. Eur. J. Soil Biol. 103:103276. doi: 10.1016/j.ejsobi.2020.103276
Wen, Y., Liu, X., Yang, J., Lin, K., and Du, G. (2019). NDVI indicated inter-seasonal non-uniform time-lag responses of terrestrial vegetation growth to daily maximum and minimum temperature. Glob. Planet. Change 177, 27–38. doi: 10.1016/j.gloplacha.2019.03.010
Wu, D., Zhao, X., Liang, S., Zhou, T., Huang, K., Tang, B., et al. (2015). Time-lag effects of global vegetation responses to climate change. Glob. Change Biol. 21, 3520–3531. doi: 10.1111/gcb.12945
Xin, Z., Xu, J., and Zheng, W. (2008). Spatiotemporal variations of vegetation cover on the Chinese Loess Plateau (1981–2006): Impacts of climate changes and human activities. Sci. China Ser. D 51, 67–78. doi: 10.1007/s11430-007-0137-2
Xiong, Q., Xiao, Y., Halmy, M. W. A., Dakhil, M. A., Liang, P., Liu, C., et al. (2019). Monitoring the impact of climate change and human activities on grassland vegetation dynamics in the northeastern Qinghai-Tibet Plateau of China during 2000–2015. J. Arid Land 11, 637–651. doi: 10.1007/s40333-019-0061-2
Xu, X. (2018). China annual vegetation index (NDVI) spatial distribution dataset. Chin. Acad. Sci. 10:2018060601.
Xue, Z., Lyu, X., Chen, Z., Zhang, Z., Jiang, M., Zhang, K., et al. (2018). Spatial and temporal changes of wetlands on the Qinghai-Tibetan Plateau from the 1970s to 2010s. Chin. Geograph. Sci. 28, 935–945. doi: 10.1007/s11769-018-1003-1
Yaghoubi, M., and Sabzevari, A. (1996). Further data on solar radiation in Shiraz, Iran. Renew. Energy 7, 393–399.
Yao, T., Bolch, T., Chen, D., Gao, J., Immerzeel, W., Piao, S., et al. (2022). The imbalance of the Asian water tower. Nat. Rev. Earth Environ. 3, 618–632. doi: 10.1038/s43017-022-00299-4
Yi, S., Wang, X., Qin, Y., Xiang, B., and Ding, Y. (2014). Responses of alpine grassland on Qinghai–Tibetan plateau to climate warming and permafrost degradation: a modeling perspective. Environ. Res. Lett. 9:074014. doi: 10.1088/1748-9326/9/7/074014
Yu, H., Xu, J., Okuto, E., and Luedeling, E. (2012). Seasonal response of grasslands to climate change on the Tibetan Plateau. PLoS One 7:e49230. doi: 10.1371/journal.pone.0049230
Yuan, Y., Si, G., Wang, J., Luo, T., and Zhang, G. (2014). Bacterial community in alpine grasslands along an altitudinal gradient on the Tibetan Plateau. FEMS Microbiol. Ecol. 87, 121–132. doi: 10.1111/1574-6941.12197
Yue, C.-D., and Huang, G.-R. (2011). An evaluation of domestic solar energy potential in Taiwan incorporating land use analysis. Energy Policy 39, 7988–8002. doi: 10.1016/j.enpol.2011.09.054
Zhang, D., Fengquan, L., and Jianmin, B. (2000). Eco-environmental effects of the Qinghai-Tibet Plateau uplift during the Quaternary in China. Environ. Geol. 39, 1352–1358. doi: 10.1007/s002540000174
Zhang, G., Nan, Z., Yin, Z., and Zhao, L. (2021). Isolating the contributions of seasonal climate warming to permafrost thermal responses over the Qinghai-Tibet Plateau. J. Geophys. Res. 126:e2021JD035218. doi: 10.1029/2021JD035218
Zhang, W., Yi, Y., Song, K., Kimball, J. S., and Lu, Q. (2016). Hydrological response of alpine wetlands to climate warming in the eastern Tibetan Plateau. Remote Sens. 8:336. doi: 10.3390/rs8040336
Zhang, Y., Wang, G., and Wang, Y. (2011). Changes in alpine wetland ecosystems of the Qinghai–Tibetan plateau from 1967 to 2004. Environ. Monit. Assess. 180, 189–199. doi: 10.1007/s10661-010-1781-0
Zhe, M., and Zhang, X. (2021). Time-lag effects of NDVI responses to climate change in the Yamzhog Yumco Basin, South Tibet. Ecol. Indic. 124:107431. doi: 10.1016/j.ecolind.2021.107431
Zhou, X., Wang, F., Fan, J., and Ochieng, R. M. (2010). Performance of solar chimney power plant in Qinghai-Tibet Plateau. Renew. Sustain. Energy Rev. 14, 2249–2255. doi: 10.1016/j.rser.2010.04.017
Keywords: NDVI, climate change, human activities, the Tibetan Plateau, BFAST, correlation analysis
Citation: Chen Y, Sun L, Xu J, Liang B, Wang J and Xiong N (2023) Wetland vegetation changes in response to climate change and human activities on the Tibetan Plateau during 2000–2015. Front. Ecol. Evol. 11:1113802. doi: 10.3389/fevo.2023.1113802
Received: 01 December 2022; Accepted: 04 January 2023;
Published: 19 January 2023.
Edited by:
Zhongqing Yan, Chinese Academy of Forestry, ChinaReviewed by:
Dehua Mao, Northeast Institute of Geography and Agroecology (CAS), ChinaLie Yang, Wuhan University of Technology, China
Copyright © 2023 Chen, Sun, Xu, Liang, Wang and Xiong. This is an open-access article distributed under the terms of the Creative Commons Attribution License (CC BY). The use, distribution or reproduction in other forums is permitted, provided the original author(s) and the copyright owner(s) are credited and that the original publication in this journal is cited, in accordance with accepted academic practice. No use, distribution or reproduction is permitted which does not comply with these terms.
*Correspondence: Jia Wang,  wangjia2009@bjfu.edu.cn