 Lilei Zhou
 Dongjie Guan
 Lingli Sun2,3
- 1School of Civil Engineering, Chongqing Jiaotong University, Chongqing, China
- 2School of Smart City, Chongqing Jiaotong University, Chongqing, China
- 3Chongqing Municipal Research Institute of Design, Chongqing, China
- 4Faculty of Environment Engineering, The University of Kitakyushu, Kitakyushu, Japan
The relationships between ecosystem services and farmers’ livelihoods are important for ecological and livelihood sustainability. In this paper, Chongqing was picked up as a case to elucidate the contribution of ecosystem services to farmers’ livelihoods. First, we constructed a DPSIR (driver, pressure, state, impact and response) framework of ecosystem services and farmers’ livelihoods through participatory farmers’ livelihoods surveys and empirical data from the literature. Then, a 48-node Bayesian network model were used to explore the explicit and implicit impacts of both ecosystem services and farmers’ livelihoods, and to determine the key factors. Finally, we analyzed the contribution of ecosystem services to different types of farmers’ livelihoods. The results showed that ecosystem services have a significant impact on the farmers’ livelihoods. The probabilities of high state for ecosystem services and livelihood outcomes were 17.6% and 30.7%, respectively. While the probabilities of medium state were 51.2% and 45.4%, respectively. Particularly for low-income farmers, the impact on them increased with the increasing of ecosystem services (such as esthetic landscapes and food production). For different types of farming households, the most important contributor of ecosystem services-related income were pure farming households, part-time farming households and nonfarming households, accounting for 77.3%, 36.3%, and 14.8% of the total average annual household income, respectively. Our findings suggested that in promoting sustainable management of ecosystems, the contribution of ecosystem services to farmers’ livelihoods and their impact on farm income and the ecosystem services value should be considered.
1. Introduction
Humans are fully dependent on earth’s ecosystems and the services that they provide [Millennium Ecosystem Assessment (MEA), 2005]. In almost all settings, low-income rural households are more directly dependent on ecosystem services (ESs) than average households (Hansen et al., 2015; Adger et al., 2018). However, the degradation of ecosystems such as forests, agricultural lands and wetlands, caused by human activities, can seriously threaten people’s livelihoods at a local or larger scale (van Dam et al., 2013). Therefore, understanding rural farmers’ livelihoods and ES dependencies and their interrelationships can help reduce and prevent livelihood stresses caused by ecological resource degradation in the context of social development.
ESs not only are essential for maintaining ecological balance but also provide enormous economic benefits to human society (Orchard et al., 2016; Robinson et al., 2019). People living in rural areas, especially in developing countries, are highly dependent on the environmental resources and services provided by natural ecosystems (Huq et al., 2020; Sarkodie and Adams, 2020). The environmental resources of different ecosystems and associated income-generating activities are an important source of livelihoods for farming households (Walelign and Jiao, 2017). For example, the region’s forest ecosystems act as a primary livelihood source, acting as a safety net for its farming households facing poverty and livelihood stress (Pouliot et al., 2012). ESs are important for alleviating poverty and improving the well-being of farming households in rural areas, but as urbanization progresses, an increasing number of people rely directly on ESs for their livelihoods.
Rural livelihoods are spatially and temporally diverse, and populations depend on more than one ES for their income. ESs often appear as a group of services that recur together so that some services (e.g., provisioning services) are more intuitively available than other service groups (Adams et al., 2018, 2020). Different ESs provide multiple services to different farmers, and the use of these resources can be influenced by government policies. In rural areas, the demand for agricultural land as the population increases, combined with a high dependence on local natural resources, can result in the conversion of regional ecological resources, such as changes in forest and cropland, and the conversion of “wasteland” that needs to be “reclaimed” (Tripathi et al., 2019; Zhu et al., 2021). To sustain livelihoods and ecologically sustainable management, there is a need to understand the linkages between ecosystem user livelihoods and ESs.
Current studies related to ESs and human well-being have yielded rich results, but the following three essential aspects have been less commonly studied over the long term: (1) The research on the explicit/implicit relationship of ESs and farming household livelihoods is insufficient. Provisioning and cultural services directly provide benefits to farming households (defined as explicit relationship), while supporting and regulating services indirectly affect farming household-related income through delayed effects (defined as implicit relationship; Rahman, 2010). However, few studies have examined the impact of ecosystem services on farmers’ livelihoods in terms of explicit and implicit relationships. (2) The difference in the contribution of ESs to the livelihoods of different types of farming households is understudied. The collection and exploitation of ES products by low-income households in rural areas is an important source of income and means of livelihood (Nguyen et al., 2015; Walelign and Jiao, 2017), and understanding the contribution of ESs to farming households based on the farming household level can reveal the variability in the extent of ecosystem use by different farming households. (3) Few studies have examined the mechanisms of ESs and farming household livelihood impacts. Exploring the impact mechanisms of ESs and farming household, livelihoods can enhance the potential for household livelihood growth in rural areas and provide corresponding suggestions and responses for ecological management.
Against this background, this paper explores the following research questions: (1) How to quantify the explicit/implicit relationships between ESs and farmers’ livelihoods; (2) how to measure the contributions of ESs to farms’ livelihoods; (3) and how to reveal the impact mechanism between ESs and livelihoods. To answer these questions, first, we analyzed the socio-demographic characteristics of different types of farming households by using a sample of 517 household questionnaires collected within the Chongqing municipality area. Second, we introduced a DPSIR (driver, pressure, state, impact, and response) conceptual model of ecosystem services and farmers’ livelihoods, and further developed the Bayesian network (BN) models to quantify the explicit/implicit relationships between ESs and farmers’ livelihoods. Third, we determined the key factors of the impacts of ESs and farmers’ livelihoods and explores the contributions of ESs to the livelihoods of different types of farming households by using relative Kuznets ratio and absolute Kuznets ratio. Finally, we discussed and analyzed the differences between ESs and farmers’ livelihoods in different regions, and households at different income levels, to better understand the complex linkages between ESs and livelihoods.
2. Materials and methods
2.1. Study area
Chongqing is located in southwestern China at longitude 105°11′–110°11′ E and latitude 28°10′–32°13′ N. The city has 26 districts, 8 counties, and 4 ethnic autonomous counties, which can be divided into the main urban area, the western area, the northeastern area, and the southeastern area (Figure 1). As seen from Chongqing Municipal Statistical Bulletin data in 2019,1 the rural population of Chongqing reached 10.3733 million, and the per capita disposable income of rural residents was 15,133 CNY, an increase of 9.8% over that of the previous year. Among the levels of disposable income, that in the main urban areas of Chongqing is higher than the average level, and the economic development of the districts and counties is uneven. Urban areas are densely populated, and rural areas are sparsely populated, with a resident population urbanization rate of 66.8% (see Footnote 1). According to the implementation of the poverty eradication strategy, the city’s rural population living in poverty is 24,000, which is down 115,000 from that at the end of the previous year, with a poverty incidence rate of 0.12%, which is 0.58% down from that in the previous year (see Footnote 1). The per capita disposable income of rural residents in poor areas is 13,832 CNY, an increase of 10.9% over that of the previous year (see Footnote 1).
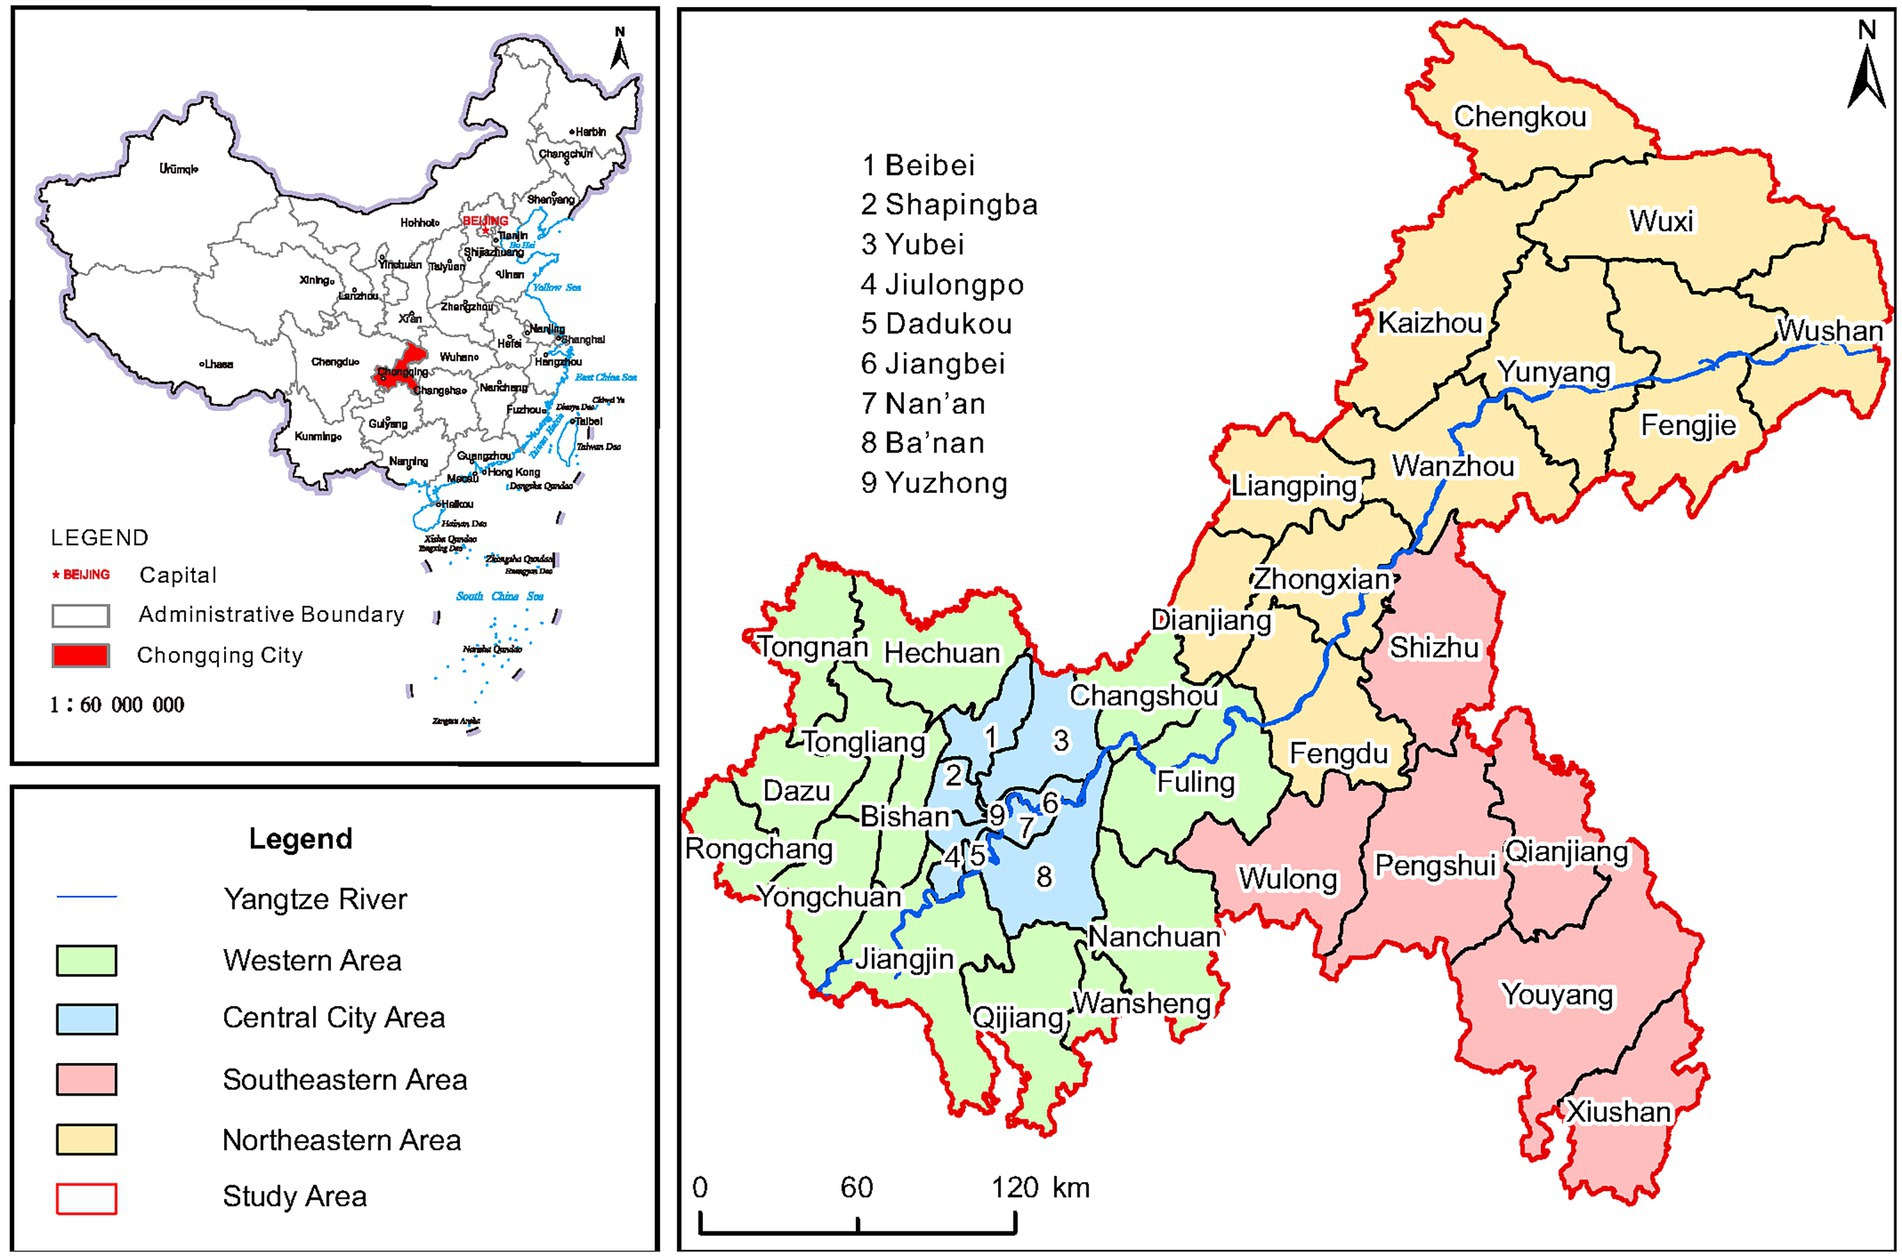
Figure 1. Location of Chongqing, China.
There are 58 nature reserves in Chongqing, including 7 national-level nature reserves. The study area is rich in biodiversity, with the Ta-pa Mountains in northeastern Chongqing and the Wuling Mountains in southeastern Chongqing being key areas of biodiversity with global conservation significance. At the same time, the Chongqing region provides important resources on which surrounding communities depend, and cultural services related to recreation and nature tourism activities are also highly influential in the local economy, making Chongqing an important study area for assessing the impact of ESs on farmers’ livelihoods.
2.2. Data sources
In this paper, we collected farming household research data from some districts and counties in Chongqing and selected a number of villages, such as Xinghua Village, Xiongzhu Village, Yanghe Village, Daxing Village and Ziping Village in Xiuqi Township, Chengkou County; Jianguo Village, Wenxi Village, Dawanhe Village, Guihua Village and Xiangjiawan Village in Gaojia Township, Fengdu County; Yuxi Village, Linjiang Village and Nanzhu Village in Longkong Township. By combining questionnaires and fieldwork, we selected statistically representative households to collect socioeconomic and behavioral data. To ensure the representativeness of the survey data, we had to collect at least 440 questionnaires (Yamane, 1967; Odhiambo et al., 2019). A total of 517 valid questionnaires were obtained after eliminating incomplete questionnaires, including 102 valid questionnaires through face-to-face interviews and 415 valid questionnaires through online questionnaires.
We conducted surveys in all four functional areas in Chongqing (Figure 1), and the number of questionnaires administered was proportional to the population (Table 1). Data were collected on categories such as household demographics, income sources, various livelihood assets, and perceived feelings of farmers related to ESs. Household survey data were obtained and supplemented with in-depth discussions with selected individuals to determine the ecosystem use status based on farmers’ income. These discussions contributed to the understanding of the impact of farmers’ livelihoods on ESs, including key factors and linkages among changes in key household livelihoods and ESs.
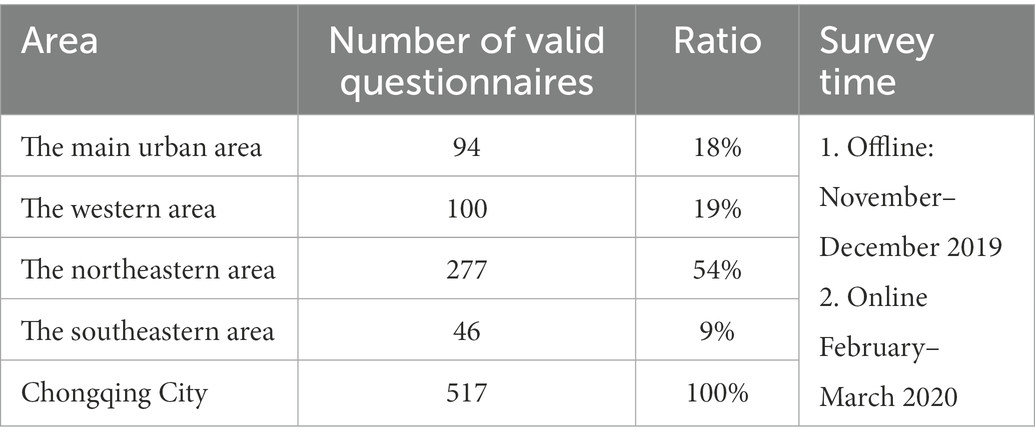
Table 1. Details of questionnaires in all four functional areas in Chongqing.
2.3. Methodology
2.3.1. Farmer questionnaire design
The complexity of the relationship between farmers’ livelihoods and ESs requires the use of a combination of research methods. In this paper, qualitative and quantitative methodologies were used to conduct the study. Data from statistical bulletins and statistical yearbooks of Chongqing city districts and counties were queried and analyzed to provide a pre-research base of information on farmers’ livelihoods and ESs and a structural background for the questionnaire design. Livelihoods can be defined as natural, physical, human, financial, and social capital activities and access to these resources that together determine the standard of living obtained by individuals or households (Angelsen et al., 2014; Hansen et al., 2015), and household income is considered to be a proxy for livelihoods that directly measures and reflects livelihood outcomes. We classified ESs into 11 categories based on Xie et al. (2017), which based on Costanza et al. (1997) and modified according to the characteristics of Chinese ecosystems, and is more applicable to China. The details please refer to the Appendix B for the specific questionnaire.
The questionnaire design was divided into four sections: basic information, livelihood assets, livelihood income contribution, and farmers’ perceptions of ESs. Each section was measured by multiple variables. (1) Basic information includes the sociodemographic characteristics of households, which were used to describe the impact of basic household characteristics on livelihood activities. (2) Livelihood assets include mainly natural, physical, human, financial, and social capital activities of rural households, and these livelihood asset variables allow a more accurate assessment of farming household differences in livelihoods. (3) Livelihood income contribution mainly includes forest, crop, and livestock income as ES income, plus other income, and this information provides a detailed understanding of rural household demographic-related income. (4) Farming households’ perception of ESs involved stakeholders’ knowledge of ecosystems and their perception of ES provision. Please refer to the Appendix B for the specific questionnaire.
Before conducting the survey, we conducted a pre-survey and then evaluated the reliability and validity of the questionnaire by using SPSS 26.0. (1) Reliability testing. Excluding objective variables that are not suitable for reliability testing (e.g., occupation, source of household income), the reliability statistics of the questionnaire in this paper, with a Cronbach’ s α coefficient of 0.791, indicating that the questionnaire has a good level of reliability. (2) Validity testing. The KMO value for the questionnaire was 0.796 and the p-value was 0.000, indicated that the results of the questionnaire’s items accurately reflect the purpose of the study.
When conducting the survey, household respondents selected members who were well aware of the household situation, mainly the head of the household or spouse, to provide household information data. The purpose of the farming household survey was to collect detailed data related to all livelihoods of each farming household and to obtain a side-by-side comparison what each farming household perceives as ESs as a relevant user of ESs.
2.3.2. BN model establishment
The BN as a machine learning language, proposed by Pearl (1988), is a graphical, multivariate, statistical model based on probabilistic reasoning. a BN model based on the relationship between ESs and farmers’ livelihoods was constructed in this paper by using Netica software,2 including the following three main steps: identification of ESs and farmers’ livelihood-related ESs; analysis of the DPSIR (driver, pressure, state, impact, and response) framework between ESs and farmers’ livelihoods; and BN model implementation based on ESs and farmers’ livelihoods.
2.3.2.1. Identification of ESs and farmers’ livelihood-related ESs
We analyzed ESs that contributed to farmers’ livelihoods in Chongqing, where agricultural and forest ecosystems are the main sources of farmers’ livelihoods, i.e., supply services generating raw material production and food and water supply. Agricultural or forest ecosystems also provide cultural services to humans (e.g., as an esthetic landscape or the generation of crop diversity). In addition to support services, humans do not directly benefit from soil formation and conservation services, but such changes affect people indirectly through their impact on other regulating or provisioning services. As shown in Figure 2, these tangible and intangible ESs directly or indirectly impact human well-being and survival.
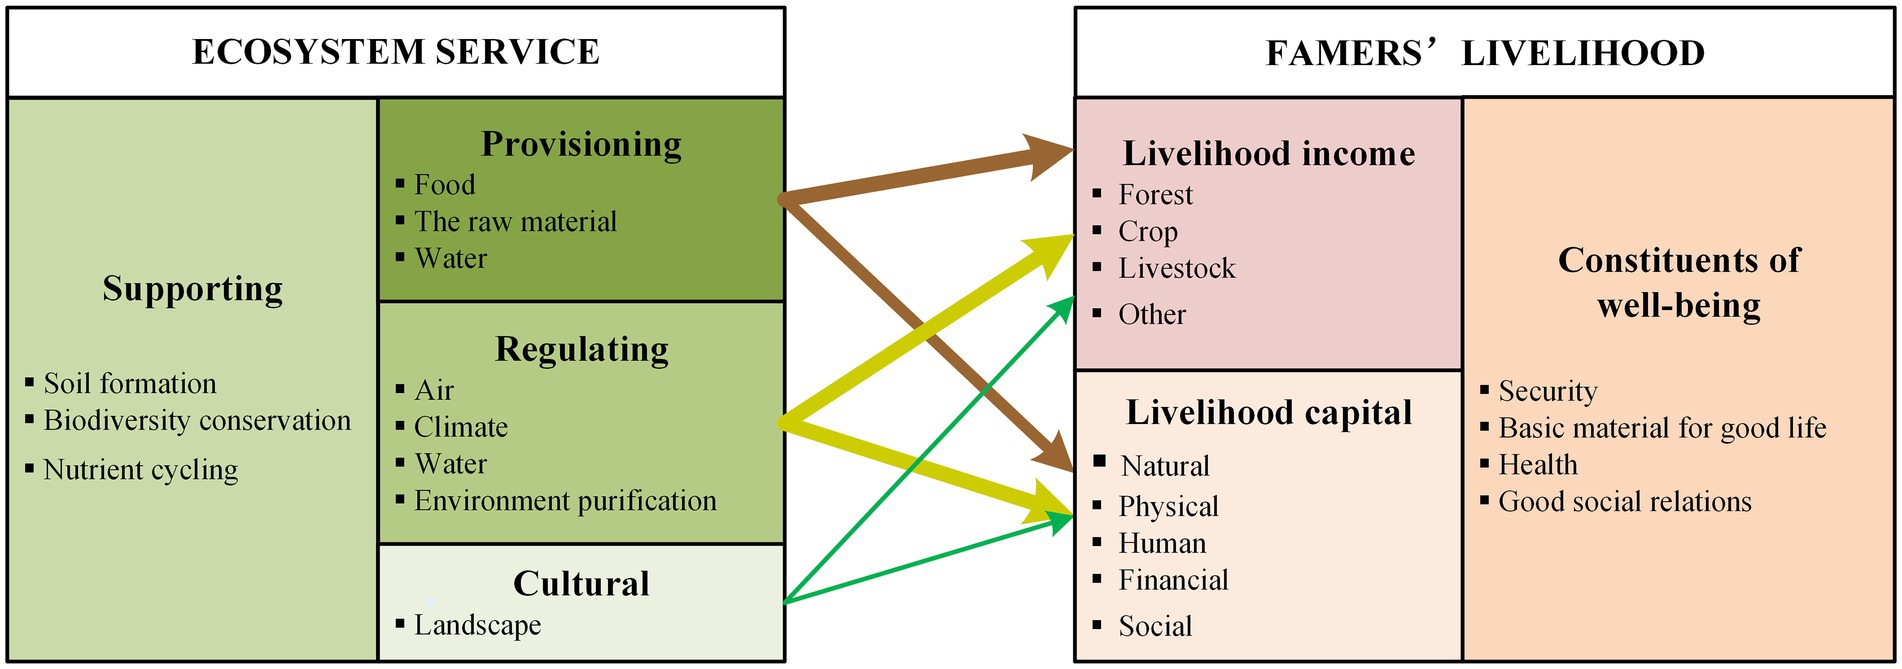
Figure 2. Identifying ecosystem services relevant to farmers’ livelihoods.
2.3.2.2. DPSIR framework for ESs and farmers’ livelihoods
We embedded the DPSIR framework to consider the explicit and implicit impacts of ESs on farmers’ livelihoods to establish the basis for a BN structure. The most important DPSIR chains of ESs and farmers’ livelihoods were constructed through a literature review and comparison and research study (Lewison et al., 2016; Ahmed et al., 2021).
Farmers’ livelihood indicators were selected based on survey. The main causes of changes in ESs include household demographic changes, land use changes, and pollution from rural and agricultural development, of which agriculture is considered the most influential (Kuldna et al., 2009; Lewison et al., 2016). In this paper, the drivers of ESs were divided into direct and indirect drivers. Indirect drivers originated from the population, economy, social policy, culture, religion, science, and technology. Direct drivers directly affect ecosystem conditions and directly change the provision of ESs. Such drivers mainly included land use change (influenced by urbanization), overexploitation of natural resources and emissions of various pollutants, which were closely related to farmers’ livelihood activities. Therefore, in Figure 3, an integrated framework combining ESs with farmers’ livelihoods and the DPSIR model was developed as the theoretical basis for the analysis.
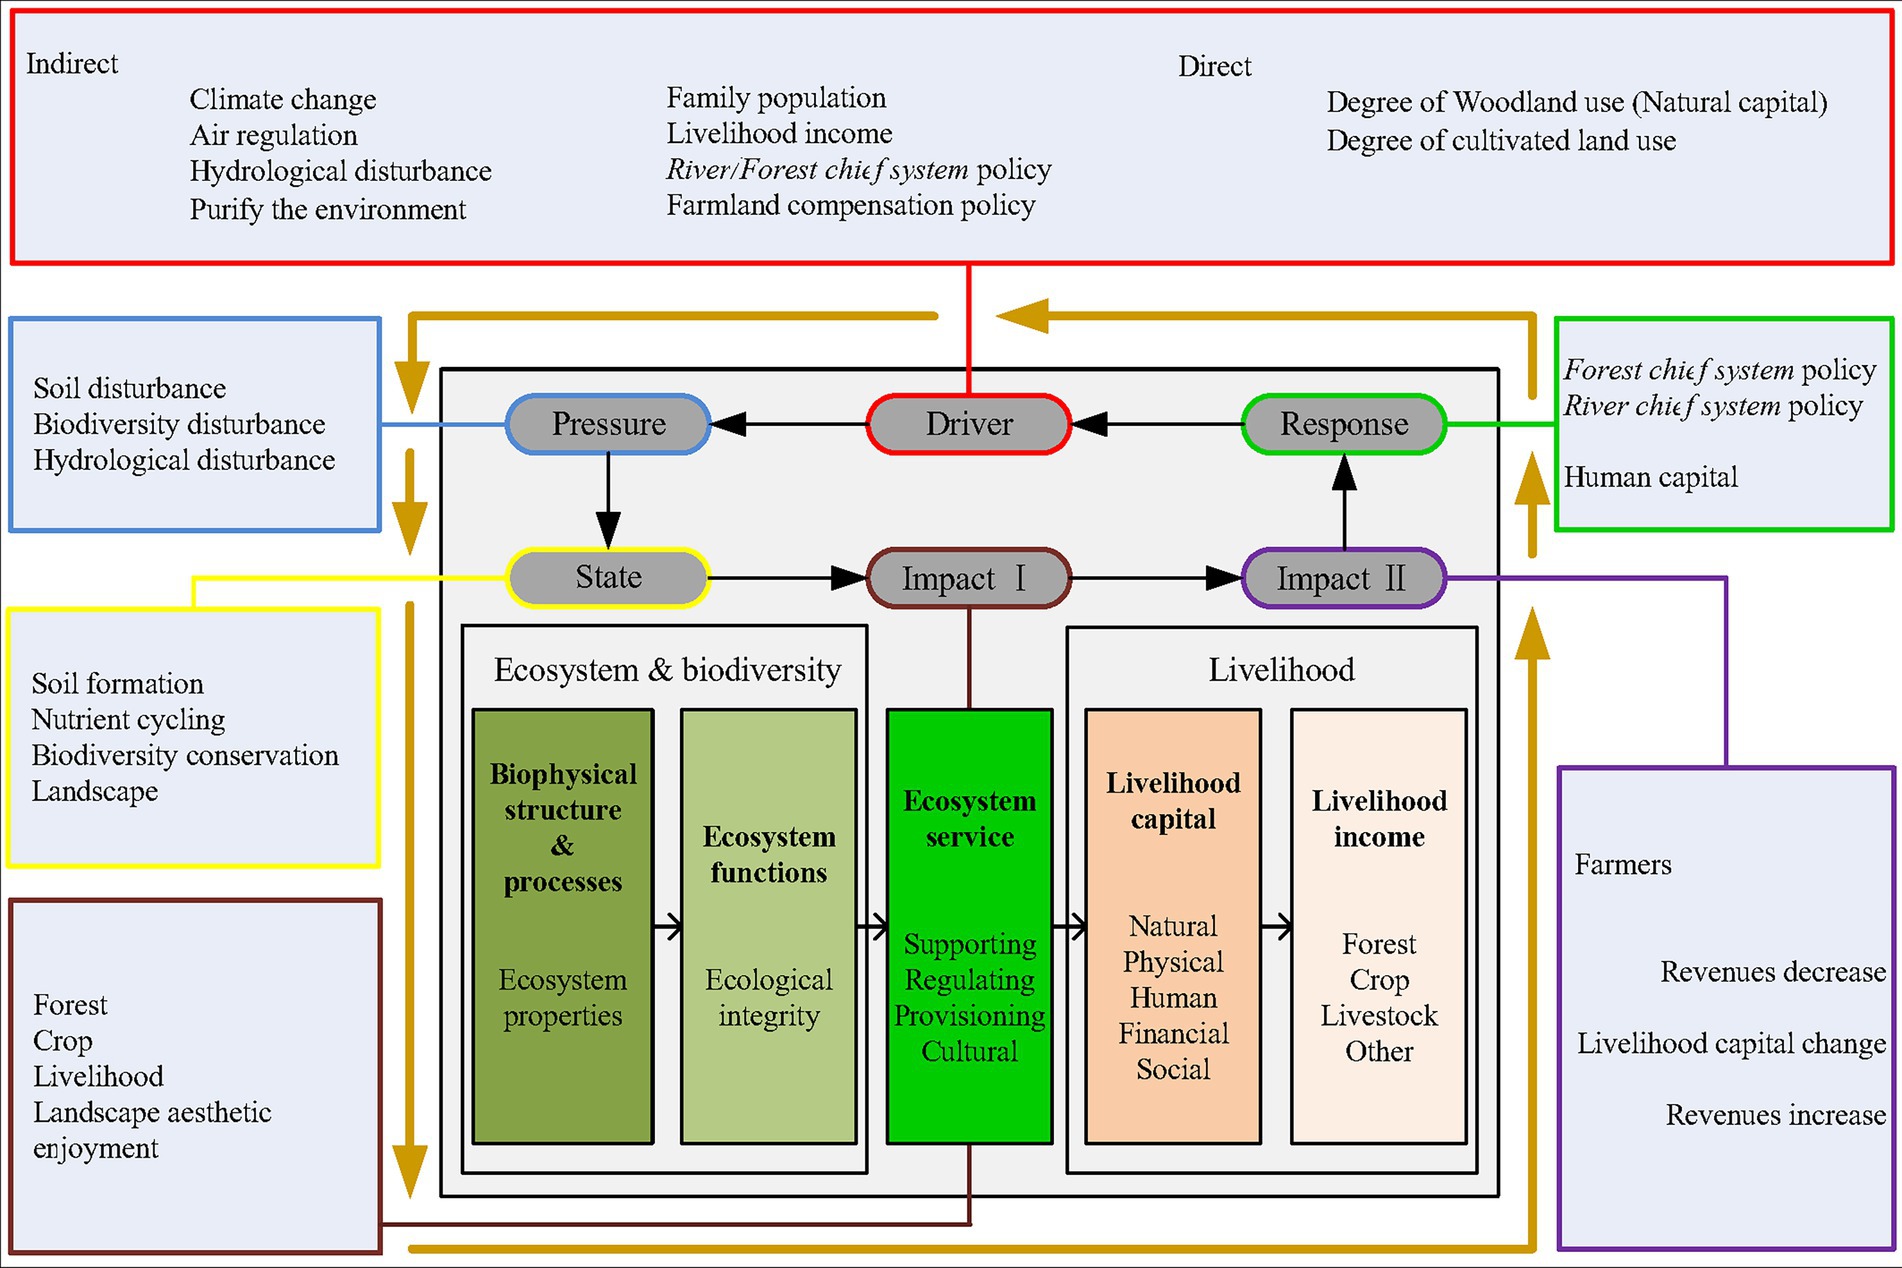
Figure 3. DPSIR framework based on ecosystem services and farmers’ livelihoods.
2.3.2.3. BN model
1. Identification of node variables. The causal chains of individual ESs and farmers’ livelihoods provided the context for how causes are interrelated and influence each other. Structural learning was performed by forcing or hindering selected links and directions in the learning process through the constructed DPSIR chains as nodes and networks of the model. We selected 48 node variables to construct the BN model of ESs to farmers’ livelihoods relationships.
2. State classification of node variables. The nodal variables include both discrete and continuous data. The meaning of each node is shown in Supplementary Table S1, and for each node, a qualitative or quantitative indicator was defined. The collected quantitative data and qualitative evidence were used to populate the BN model.
3. Model accuracy testing and sensitivity analysis. The conditional probability tables were elicited for evaluation. Model evaluation tools included mainly qualitative assessments (e.g., participatory feedback from experts or stakeholders) and quantitative validation (assessing accuracy by obtaining data or other data for comparison) as well as sensitivity analysis. The K-fold cross-validation approach was used to test the accuracy of the BN model. We divided 517 questionnaires into 8 equal sample subsets, and then the eight subsets are traversed in turn to train and test the model. The overall accuracy was 84.6%. In this paper, sensitivity analysis was used to determine which variables had an impact on the highly sensitive target variables. Sensitivity analysis was performed by applying “sensitivity to findings” to the “ecosystem services” and “livelihood outcomes” nodes.
2.3.3. Measuring the contribution of ESs to farmers’ livelihoods
To measure the contribution of ESs to farmers’ livelihoods, we calculated the relative Kuznets ratio (RKR) between total farming household income and ecosystem services-related income based on the following three steps. After first ranking farming households according to their surveyed household income, farming households were then grouped into quintiles (Angelsen et al., 2014; Pontarollo and Mendieta Muñoz, 2020), and finally the ratio of ESs-related income between the highest income (top 20%) and the two lowest income quintile (bottom 40%) was obtained (Angelsen et al., 2011, 2014). A value of RKR < 1 indicates that low-income households have a higher share of ESs-related income. A similar calculation for absolute ESs-related income, which we call the absolute Kuznets ratio (AKR).
3. Results
3.1. Farmers’ livelihood questionnaire results
Referring existing research results on the classification of farming households (Liu, 2021; Waruingi et al., 2021), we classified farming household livelihoods type into pure farming households, part-time farming households, and nonfarming households based on the direction of household labor input. The survey results were shown in Figure 4, the sample data available for pure farming households were minimal, accounting for 7.2% of the total sample size, while part-time farming households accounted for 48.7% of the sample; the size of rural households was generally 4–5 persons, but the household labor force was generally only 2–3 persons.
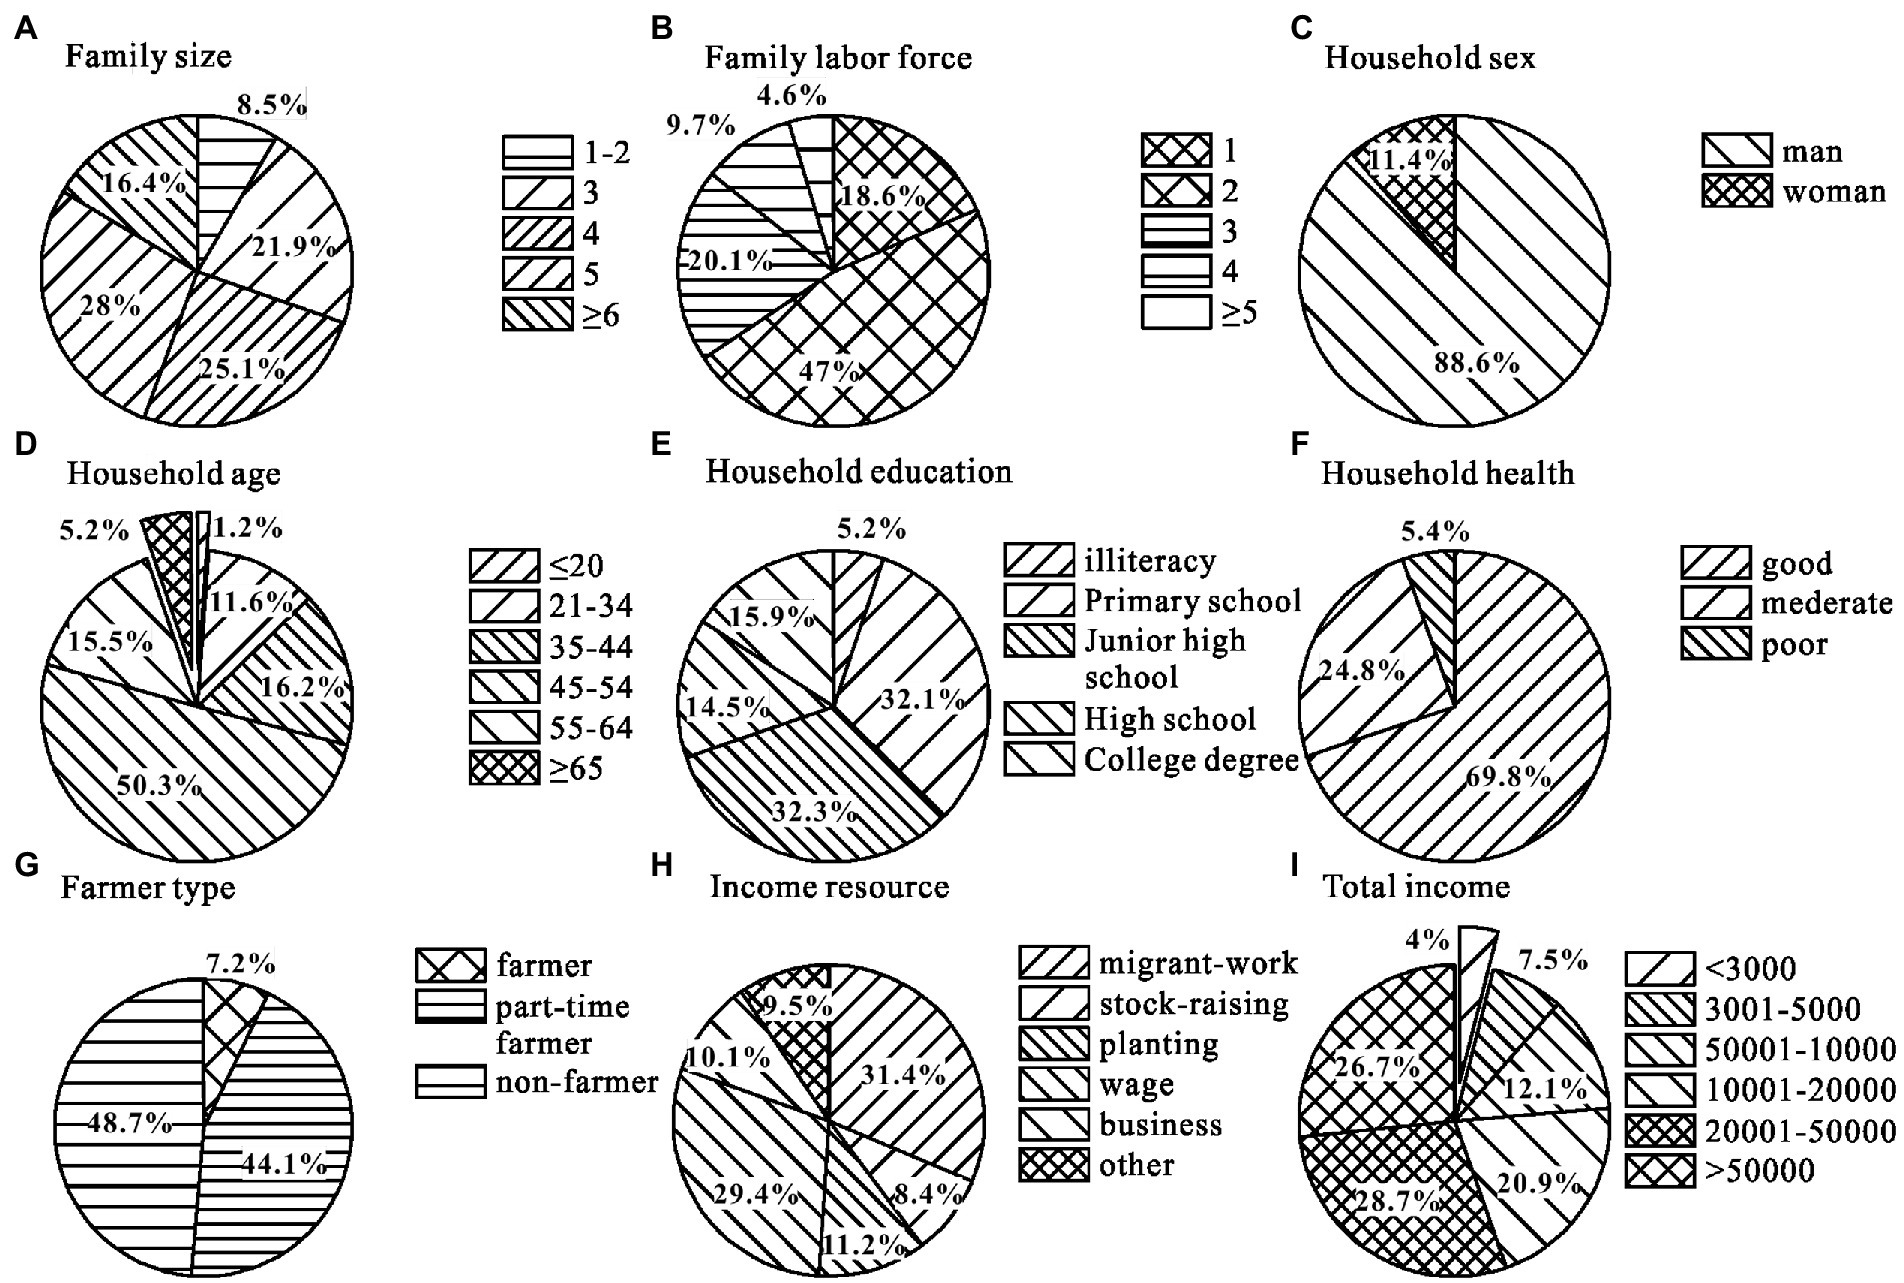
Figure 4. Farmers’ livelihood survey results. (A) Family size; (B) Family labor force; (C) Household Sex; (D) Household age; (E) Household education; (F) Household health; (G) Farmer type; (H) Income resource; (I) Total income.
For 88.6% of households, the head of the household is male and predominantly young and middle-aged and in good health. Rural households have an increasingly wide range of livelihood options, with 8.4% and 11.2% of households engaged in farming and cultivation, respectively, but only 7.2% of households relied on agriculture alone for their livelihoods (Figure 4). Among them, the arable land area of the pure farming household was 3–6 acres, while the highest farming household reached more than 21 acres to grow orchards and forests for subsistence income. In addition, a high proportion of 31.4% farming households worked outside the home (Figure 4), with the main family labor force working outside the home while the remaining family members farming at home. The family expenses were mainly maintained by planting crops and raising poultry, and additional expenses were maintained by labor income. In addition, the average annual total income of farming households was 20,000–50,000 CNY (Figure 4), and we found that the overall income of farming households was increasing year by year with the increasing proportion of non-farm employment.
3.2. Analysis of explicit/implicit relationships between ESs and farmers’ livelihoods
3.2.1. Explicit relationships analysis
As shown in Figure 5, the probabilities of “high” and “medium” states for “ecosystem services” and “livelihood outcomes” are 17.6% and 30.7%, and 51.2% and 45.4%, respectively. The impact on low-income farmers increased when the level of ESs increased. We found that the capital of a farmer’s livelihood determined the relative magnitude of different livelihood incomes. In detail, forest income refers the extent to which farmers use forests and consume forest products, depending on the production of raw materials, climate regulation and the biodiversity of the ecosystem; crop income refers the extent to which farmers cultivate their land to obtain products, depending on the food supply and hydrological regulation of the ecosystem by different crops; livestock income reflects the use of grassland and the consumption of aquatic products by farmers, depending on ecosystem soil formation and protection, water supply and environmental purification, while cultural services are reflected in the remaining amount of a farmer’s income.
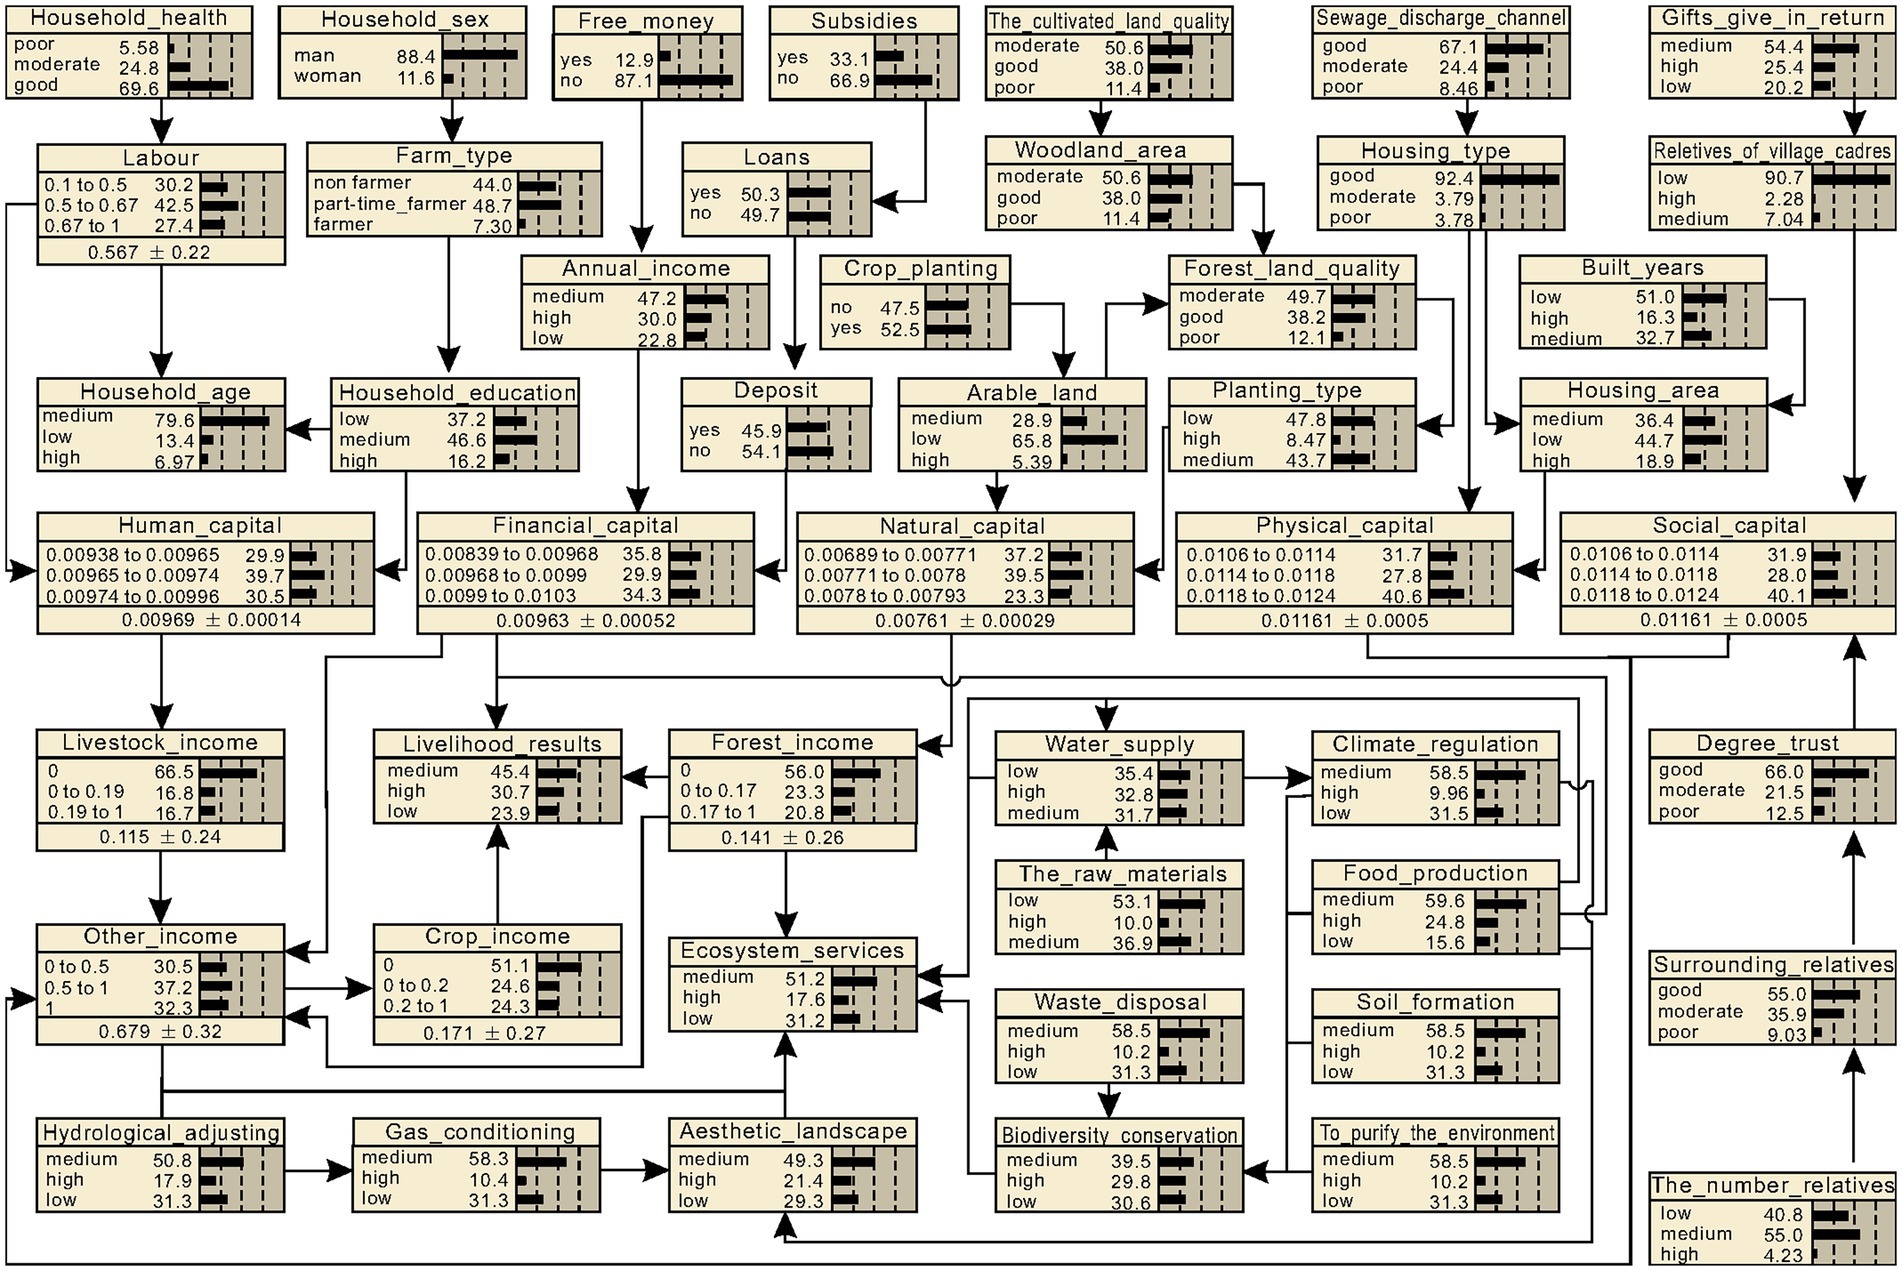
Figure 5. Bayesian network model of ecosystem services and farmers’ livelihoods.
The results of a sensitivity analysis using “ecosystem services” as target variables were shown in Figure 6. Visually, the length of the orange bar corresponding to each sensitivity variable in the graph is a measure of the influence of that variable on the target variable. The larger the value of the mutual information, the more sensitive the influence variable is to the target variable. We found that the most sensitive target node for “ecosystem services” is the value of services provided by esthetic landscapes in recreation culture, with a mutual entropy value of 0.41 (Figure 6), which is sensitive to climate, gas, hydrological regulation, and biodiversity, and it is fairly simple to explain the sensitivity of these variables. The main direct driver of ecosystem change is subsistence activities, and Chongqing is a mountainous ecosystem with high esthetic value that provides many recreational opportunities and habitat for rare species and contributes to climate regulation.
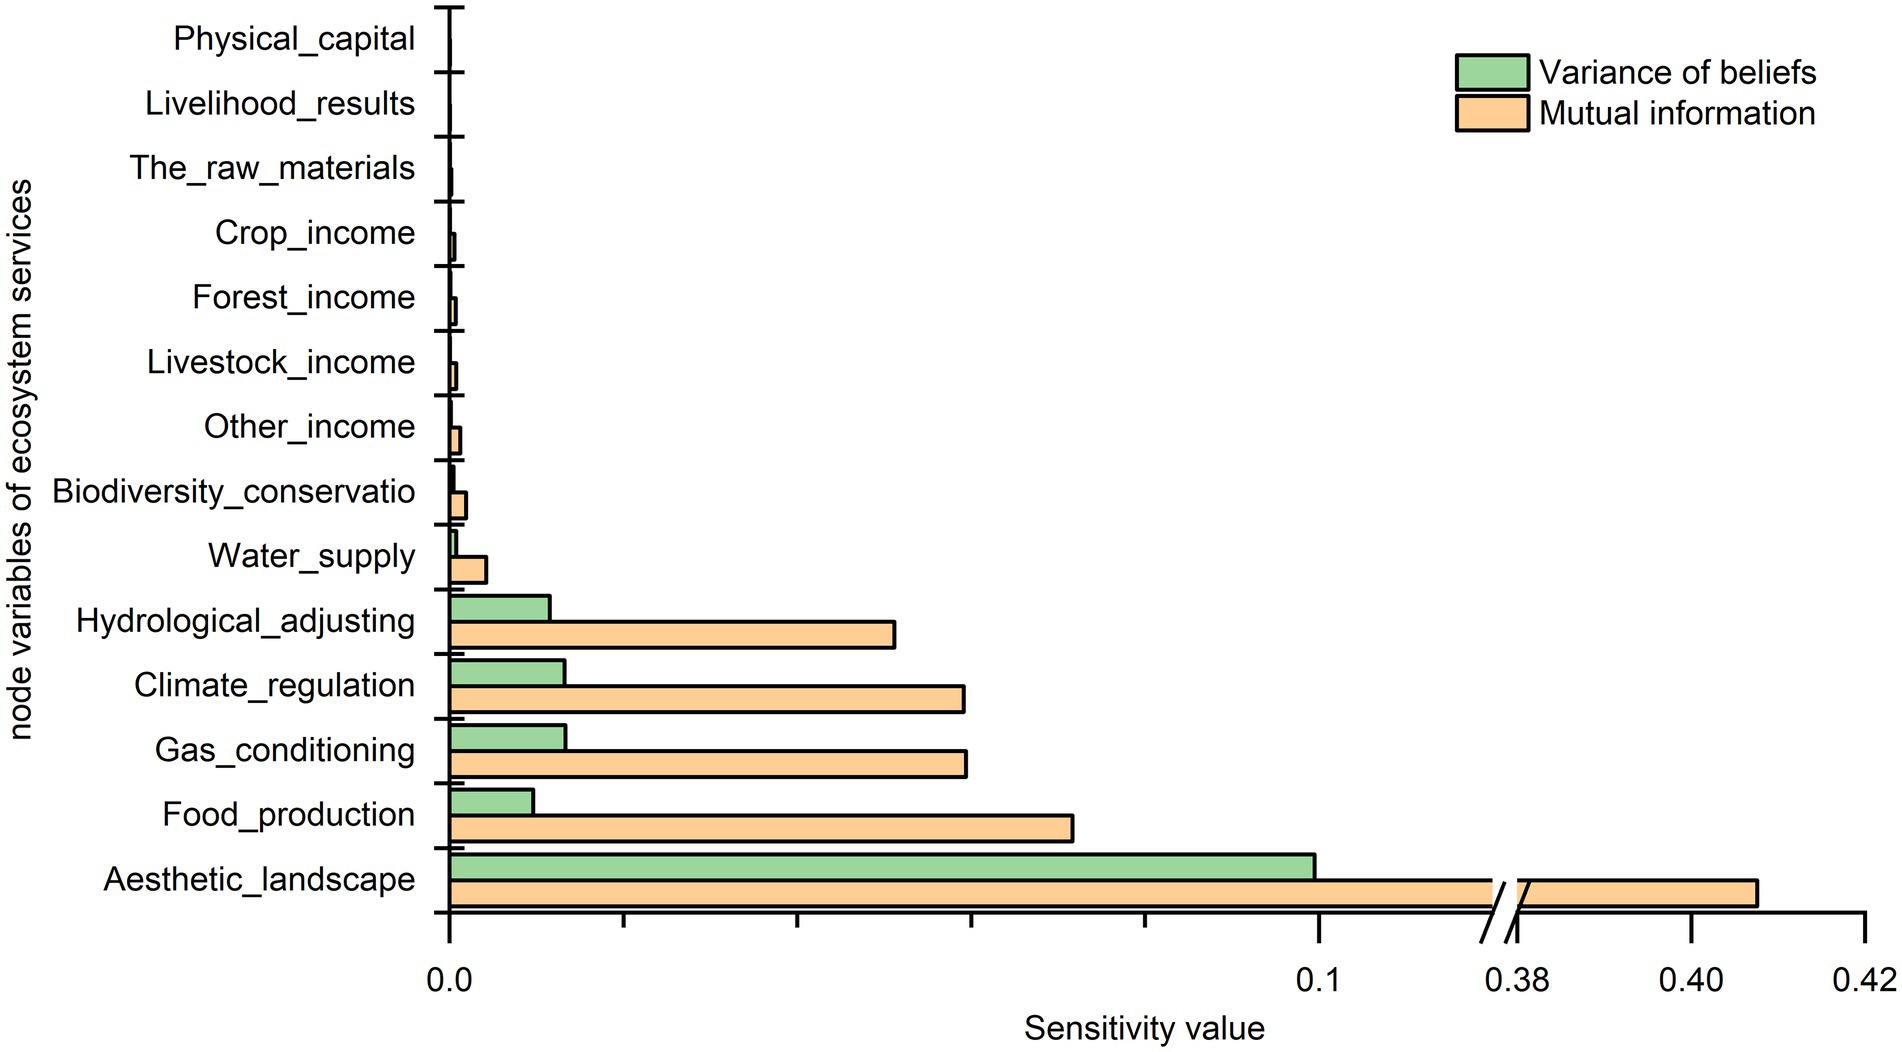
Figure 6. Ecosystem service node sensitivity analysis.
The second is the value of the services provided by food production in provisioning services (Figure 6). Farmers’ livelihood activities are closely related to ESs, and when ESs change, farmers’ livelihoods will be affected. The sources of farmers’ livelihood activities include forest income (consumption of forest products, etc.), crop income (food production, etc.), livestock income (pasture to provide food for livestock), and other incomes, which benefit from harvesting ES products (mainly provisioning services). Changes in crop cultivation, quantity of forest products and grassland degradation in dry and rainy seasons will affect the income of farmers from forest and other ESs. The ESs of raw material production and food production have a positive impact on forest income, and have a smaller impact on overall farmer’s livelihood. When the value of food production increases, farmers receive more products from the environment, resulting in an increase in income. In an explicit relationship, the area of forest, cultivated land, grassland and water area owned by farmers and the degree of utilization of ecosystems jointly determine the contribution of ESs to the farmer’s livelihood. Among natural capital types, the area of arable land and the area of forestland have a greater impact on the contribution of ESs. In particular, food production, raw material production and water supply have a significant role.
3.2.2. Implicit relationship analysis
The results of a sensitivity analysis using “livelihood outcomes” as target variables were shown in Figure 7. We found that other incomes of farmers are the most sensitive variable affecting livelihood outcomes, with a mutual entropy value of 0.5, followed by crop incomes, livestock incomes, forest incomes, climate regulation and waste disposal variables. The indirect driving force of ES changes mainly include the use and intervention of farmers in agriculture and forestry. Excessive deforestation and exploitation of forests, inappropriate cultivation of arable land, and excessive fishing of aquatic products cause ecosystems to self-regulate out of control, and these ecosystems will be degraded daily. For farming households, 61.1% of them have ESs-related income. Especially for rural households in poverty, poverty increases dependence on ecosystem-related products and services, forcing them to exploit more ecological resources, thus creating a vicious circle. In addition, access to local raw ecosystem materials and the use of local ESs are important drivers of farmers’ livelihood, and the more products accessed, the more their households’ absolute income increases. At the same time, farmers’ access to ES products promotes the nutrient export from the soil, which plays an important role in soil conservation and waste recycling.
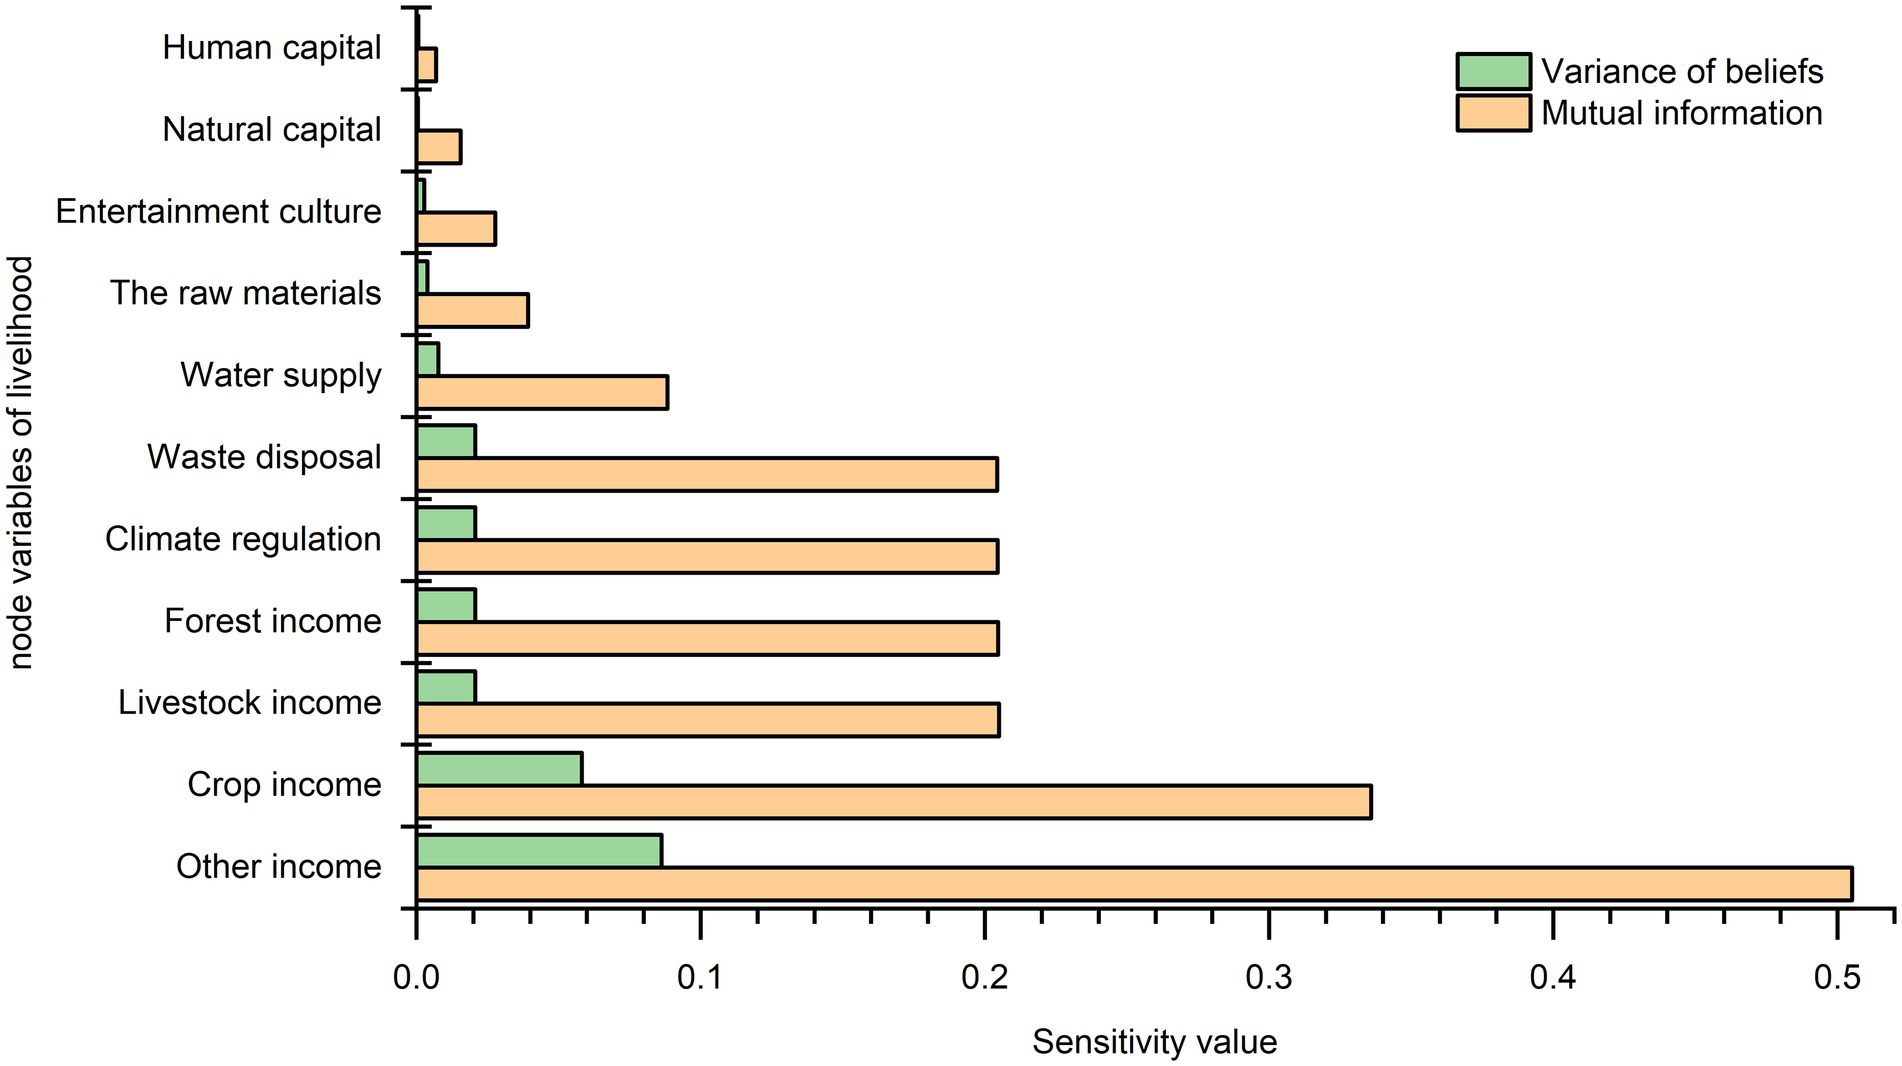
Figure 7. Sensitivity analysis of the nodes of the biometric results.
In the indirect drivers of changes in ESs, the agricultural and forestry livelihood activities of farming households, which affect livelihood income and indirectly affect the use of ecosystems. We found that when the proportion of other incomes in farmers’ income is high, the proportion of farmers whose livelihood results in a low level will increase. In the context of climate change and urbanization, the number of farmers engaged in mono-agricultural activities has been decreasing, leading to an increase in abandoned land and the productivity of forests and grasslands. These may have a positive effect on ecosystem regulating services and supporting services. For example, it increases carbon sequestration in soils, enhances soil formation and retention, enhances environmental purification, and promotes nutrient cycling. At the same time, farmers’ livelihood activities alter the heterogeneity of regional landscape and affect biodiversity. Thus, there is an implicit impact of the ES level on farmers’ livelihoods. In general, income related to ESs in farmers’ livelihood is influenced by climate and land use change.
3.3. Results of measuring the contribution of ESs to farmers’ livelihoods
The absolute and relative incomes of different types of farmers and different regions in Chongqing based on the questionnaire were shown in Table 2. In terms of absolute income, the average annual household income for Chongqing city is 2,250.5 CNY for forest-related income, 2,740.8 CNY for crop-related income, and 2,805.6 CNY for livestock-related income. For different farming household types, the main income of pure farming households is obtained through livestock farming, with an average annual absolute income of 10,297.3 CNY, followed by crop income of 5,202.7 CNY. There is little difference between the various ES-related incomes of part-time farming households, while nonfarming households have a smaller share of ES-related incomes, with the lowest being income from livestock at 820.2 CNY. There are significant differences in farmers’ livelihoods in four functional areas of Chongqing, with the average annual household income from livestock in the main urban area of Chongqing being 781.9 CNY, compared to 3852.0 CNY in the northeastern area of Chongqing.
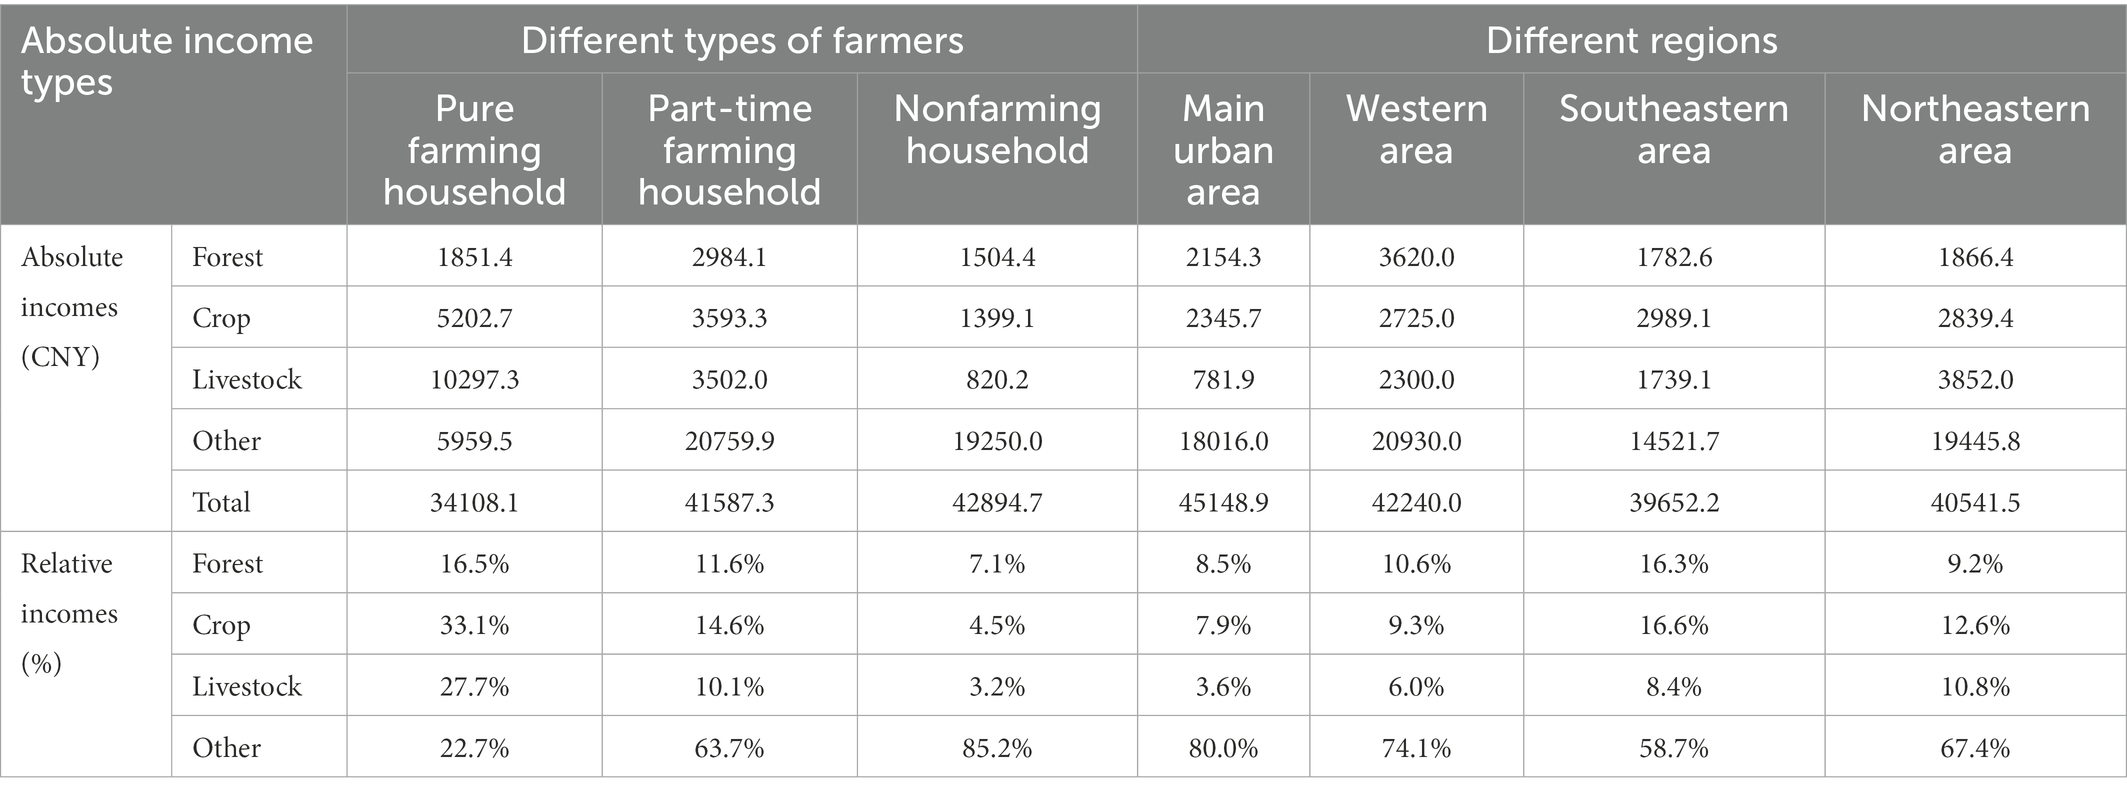
Table 2. Absolute incomes and relative incomes of different types of farmers and different regions.
We conducted comparisons among relative incomes and found that the percentages of forest, crop, and livestock incomes are higher for pure farming households than for part-time farming and nonfarming households, with a decreasing trend. The share of forest incomes in total incomes is 16.5% for pure farming households, 11.6% for part-time farming households, and 7.1% for nonfarming households. In addition, the share of forest income of farmers in all four functional areas of Chongqing varies greatly. The highest dependence on forest for farmers’ livelihoods was found in the southeastern area of Chongqing, where 16.3% of the average annual household income from forests and 16.6% from crop cultivation. The lowest forest income is in the main city area of Chongqing, with 8.5% (Table 2).
We also found that the ESs provided by forests, croplands and grasslands play an important role in farmers’ livelihoods. The relative income from ESs contributed the most to pure farming households at 77.3%, and to part-time farming and nonfarming households at 36.3% and 14.8%, respectively. The relative income ranking of each type was consistent across the four functional areas of Chongqing, with the southeastern areas of Chongqing being the highest, followed by northeastern area of Chongqing, the western area of Chongqing, and finally the main urban area of Chongqing. We conclude that the contribution of ESs to farmers’ livelihoods was lowest in the main urban area of Chongqing at 20.0%, followed by western area of Chongqing at 25.9%, northeastern area of Chongqing at 32.6% and southeastern area of Chongqing at 41.3% (Table 2).
We present the composition of ESs-related forest, crop and livestock incomes in Table 3. Wood income such as that from natural forests and plantation forests account for a larger share of forest income for pure farming households than the other types of farming households at 31.5% and 32.1%, respectively. In this paper, cash income from returning farmland to forest/grass and financial income from occupations related to forest cultivation or forest protection are also included in forest income, and part-time farming households’ income in these two components accounts for 21.6% of forest income, which is higher than that for pure farming households and nonfarming households. Forest by products such as various wild plants, mullein, resin, and rattan are also important sources of subsistence for farming households. For example, in Chengkou County, the survey area, there were many sampled households earn cash income through the collection and cultivation of wild herbal plants. The main urban area of Chongqing has a high proportion of natural forest income at 43.4%, and although the main urban area of Chongqing has a small area of forestland, the income obtained within the unit is more than that of the remaining area.
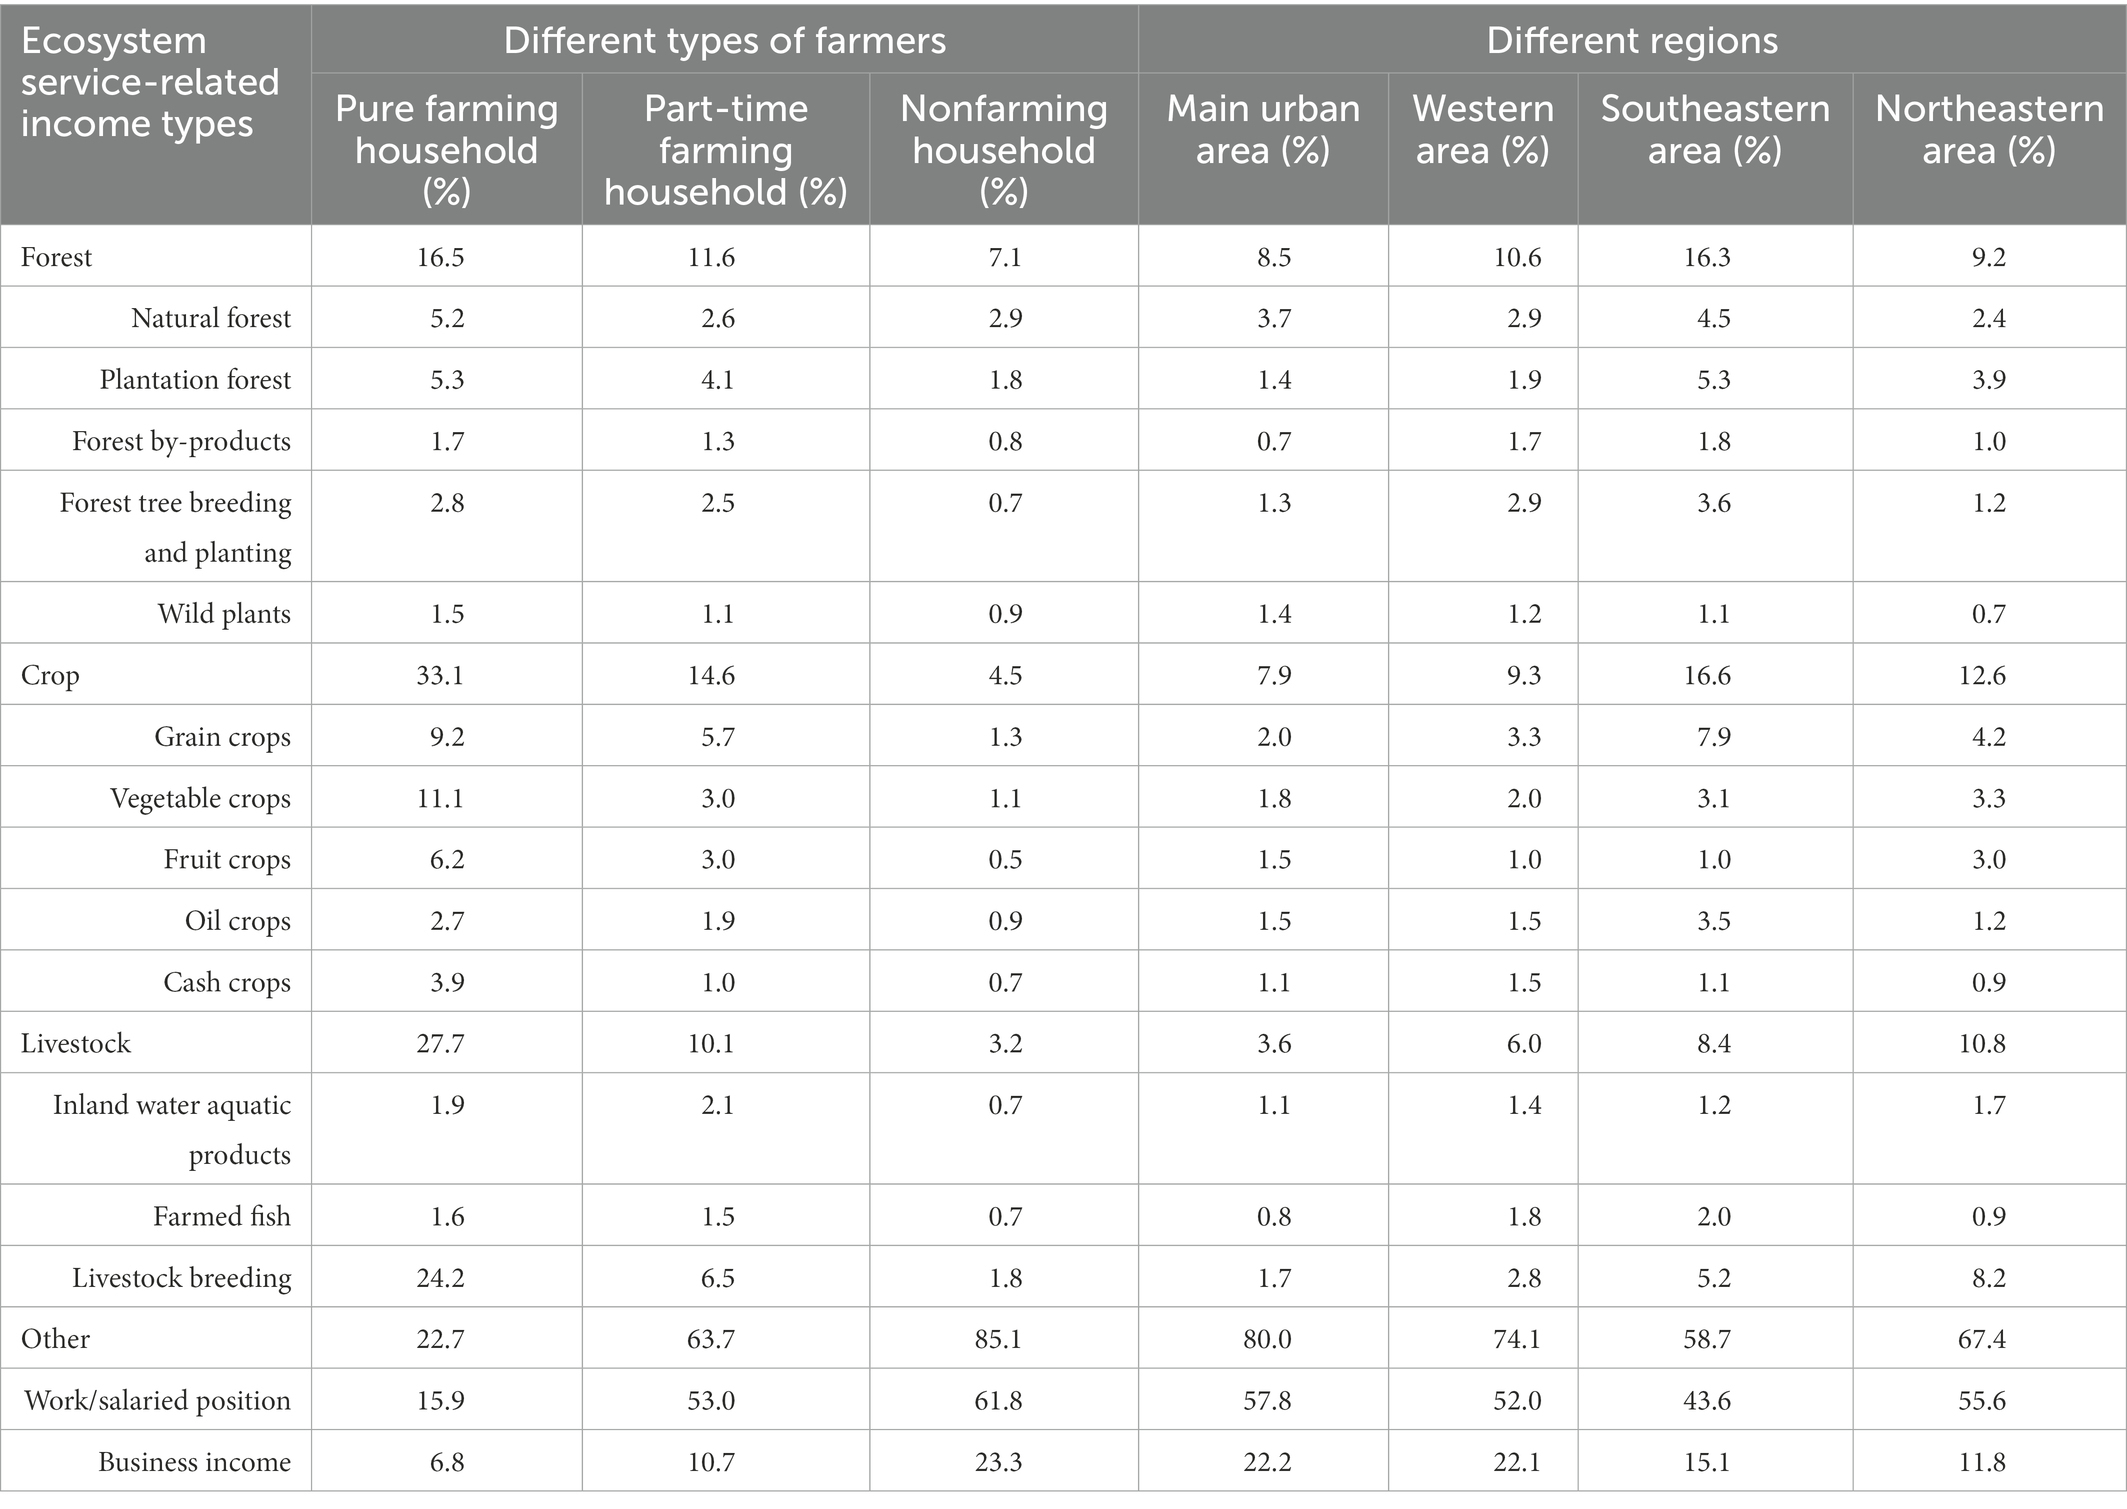
Table 3. Components of incomes related to ecosystem services.
Crop income is the main source of farmers’ livelihoods, accounting for 33.1% of the total household income of pure farming households, and it includes food, vegetables, fruits, oil crops and cash crops, with vegetables accounting for the highest proportion of crop income for pure farming households. In comparison to that of pure farming households, the crop income of part-time farming households and nonfarming households accounts for a higher proportion of food production, at 38.9% and 28.6%, respectively. Grain crop income (47.5%) was the highest in the southeastern area, and this type of income mainly including rice, corn and bean products. The Northeast area of Chongqing has the highest income from vegetables (26.5%) and melon and fruit (23.4%) crops, and the special crops are Konjac and potatoes; livestock rearing (76.0%), including cattle, sheep, pigs and poultry, and egg and milk products, are the dominant proportion of the income in this area. The income from farmed fish and inland water products in the northeastern area of Chongqing is lower than that in the main city and the western and southeastern parts of Chongqing.
Table 4 shows the RKR for ESs-related income from forests and crops. For all the Chongqing sample data, the RKR of the ESs is 0.34. In comparison to forest income (RKR = 0.88), livestock income (RKR = 0.77) is more closely related to farmers’ livelihoods. There are varied nuances across farming household types. In comparison to nonfarming households, pure farming and part-time farming households have higher ESs-related income among low-income households, and the difference between nonfarming households’ RKR and the remaining farming households is not significant. Livestock income, on the other hand, causes more income disparity among farming households, with a more pronounced gap between RKR of 4.04 for part-time farming and RKR of 1.35 nonfarming households with higher incomes.
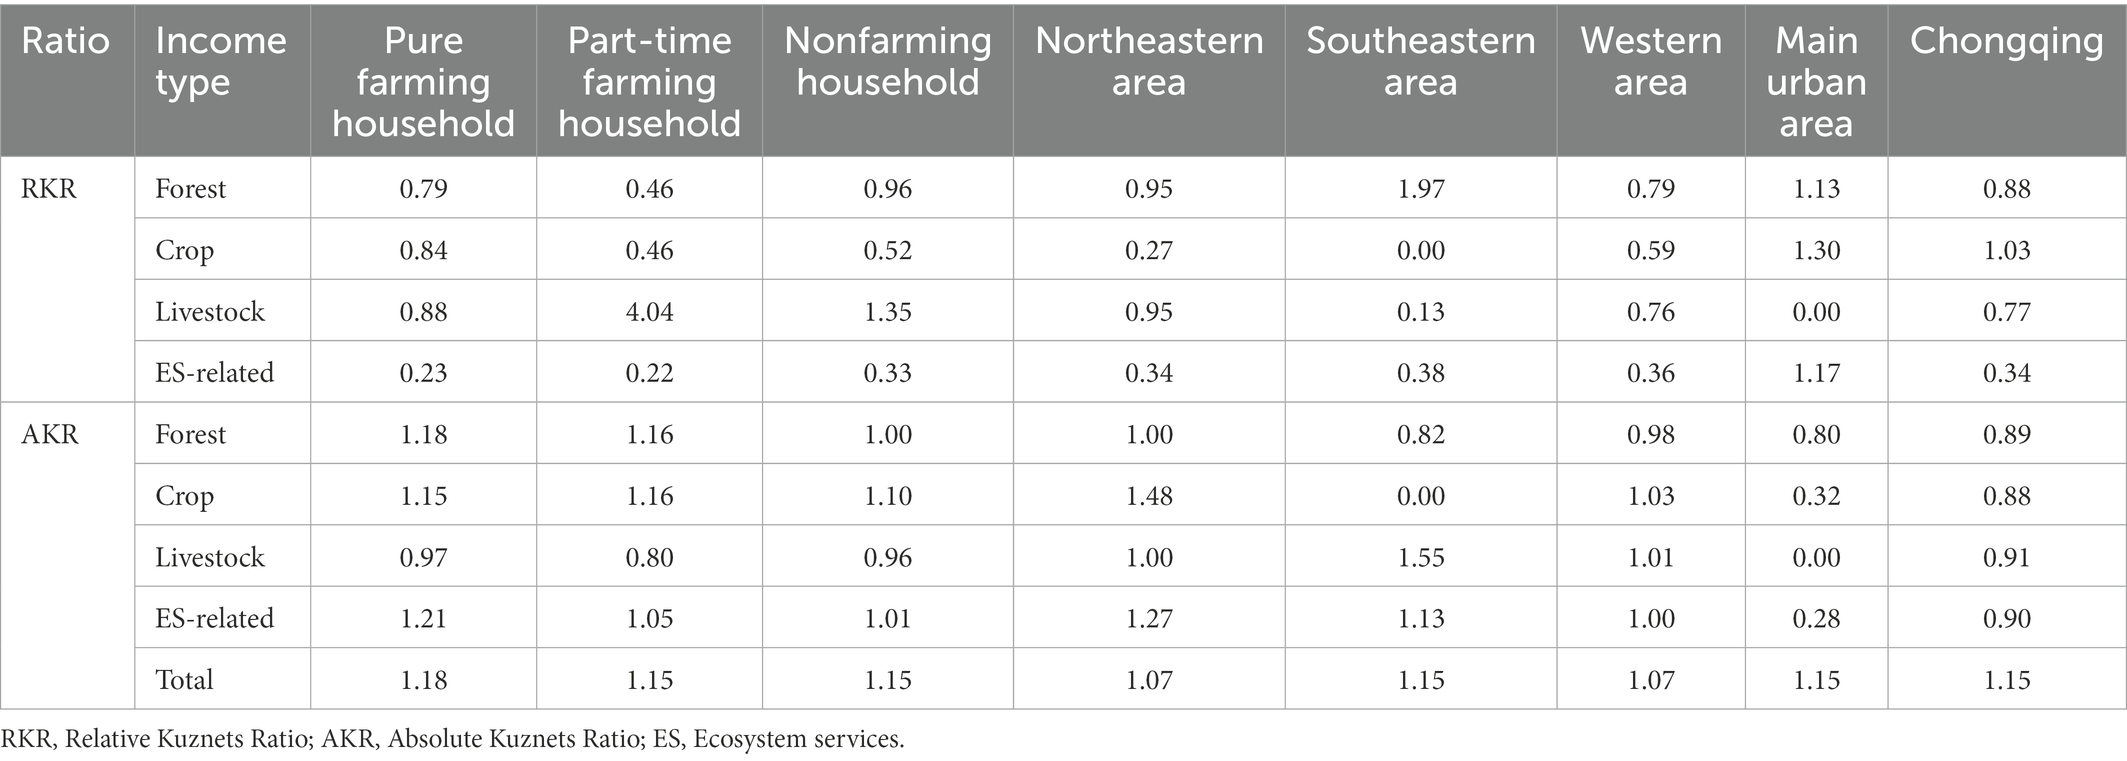
Table 4. Relative Kuznets ratio and absolute Kuznets ratio.
For the four functional areas, we observed less variation in the RKR of ESs in each region. In the southeast area, the RKR values of forest, crop, and livestock differed more than those from the remaining regions, probably due to the small sample data size and significant disparity among the households in the southeastern area of Chongqing, making the RKR of 1.97 for forest being large. In the main urban area of Chongqing, the share of ESs-related income is slightly higher for the top 20% of households than for the remaining households with an RKR of 1.17. What’s more, compared to RAR, ESs-related AKR shown different characteristics (Table 4). We found that the difference between the ESs-related income of the richest quintile of households and the poorest households was not significant, and the income gap was mainly reflected in total income.
4. Discussion
4.1. Analysis of the mechanism of the coupling relationship between ESs and farmers’ livelihoods
There is a clear explicit and implicit relationship between ESs and farmers’ livelihoods (Figure 8). For ESs, rural areas have important hydrological and ecological functions, especially provisioning services and cultural services, which have a significant explicit impact on different types of farming households. While the regulating services, supporting services and cultural services have an implicit impact on different types of farming households. For example, crops and forests provide habitats for the biodiversity of large invertebrates, mammals and birds. If the land is fertilized and cultivated, the nutrients in the land will be maintained, but the harvested crops may promote the output of nutrients. The development of agriculture will also affect soil productivity. Agriculture can maximize the use of short-term food supply services provided by land ecosystems, but it will reduce the ability of wetlands to provide long-term ecosystem services. However, different farmers depend on the ecosystem differently, resulting in the contribution rate of ESs to farmers’ livelihood is different.
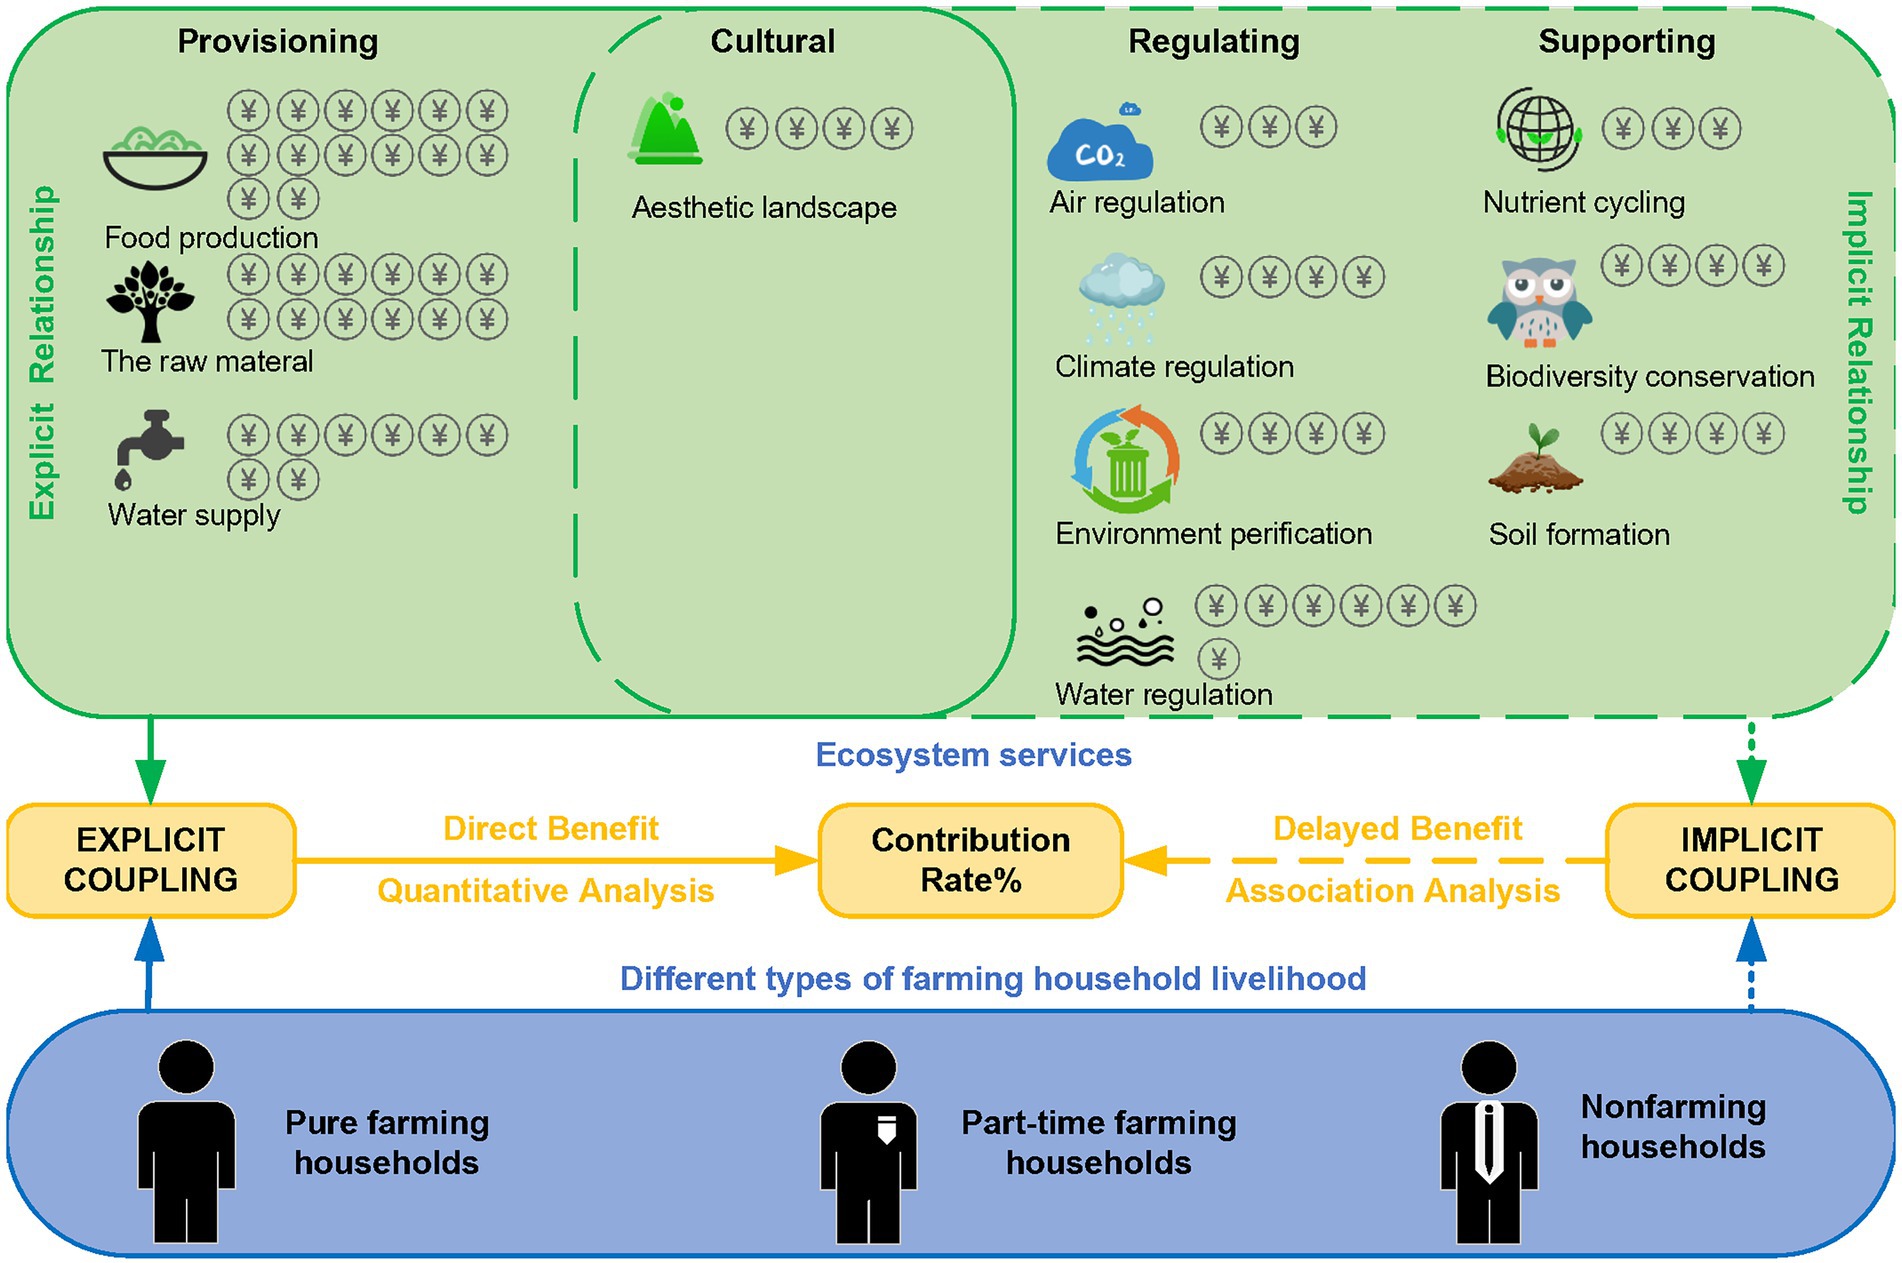
Figure 8. The mechanism of the coupling relationship between ecosystem services and farmers’ livelihoods.
We present the results of the five regression models in Table 5. The size of ESs-related income is more significantly affected by the health of the household head, which is negatively correlated. This means that the better the health of the household head, the lower the household’s ESs-related income and the more likely they are to engage in other labor production (working outside the home, etc.). In addition, as the head of household gets older his or her total household income increases, but reduces forest income. The higher the level of education of the household head, the relatively lower the forest income and the relatively higher the rest of the income of his or her household, while the impact on crop and livestock income is smaller.
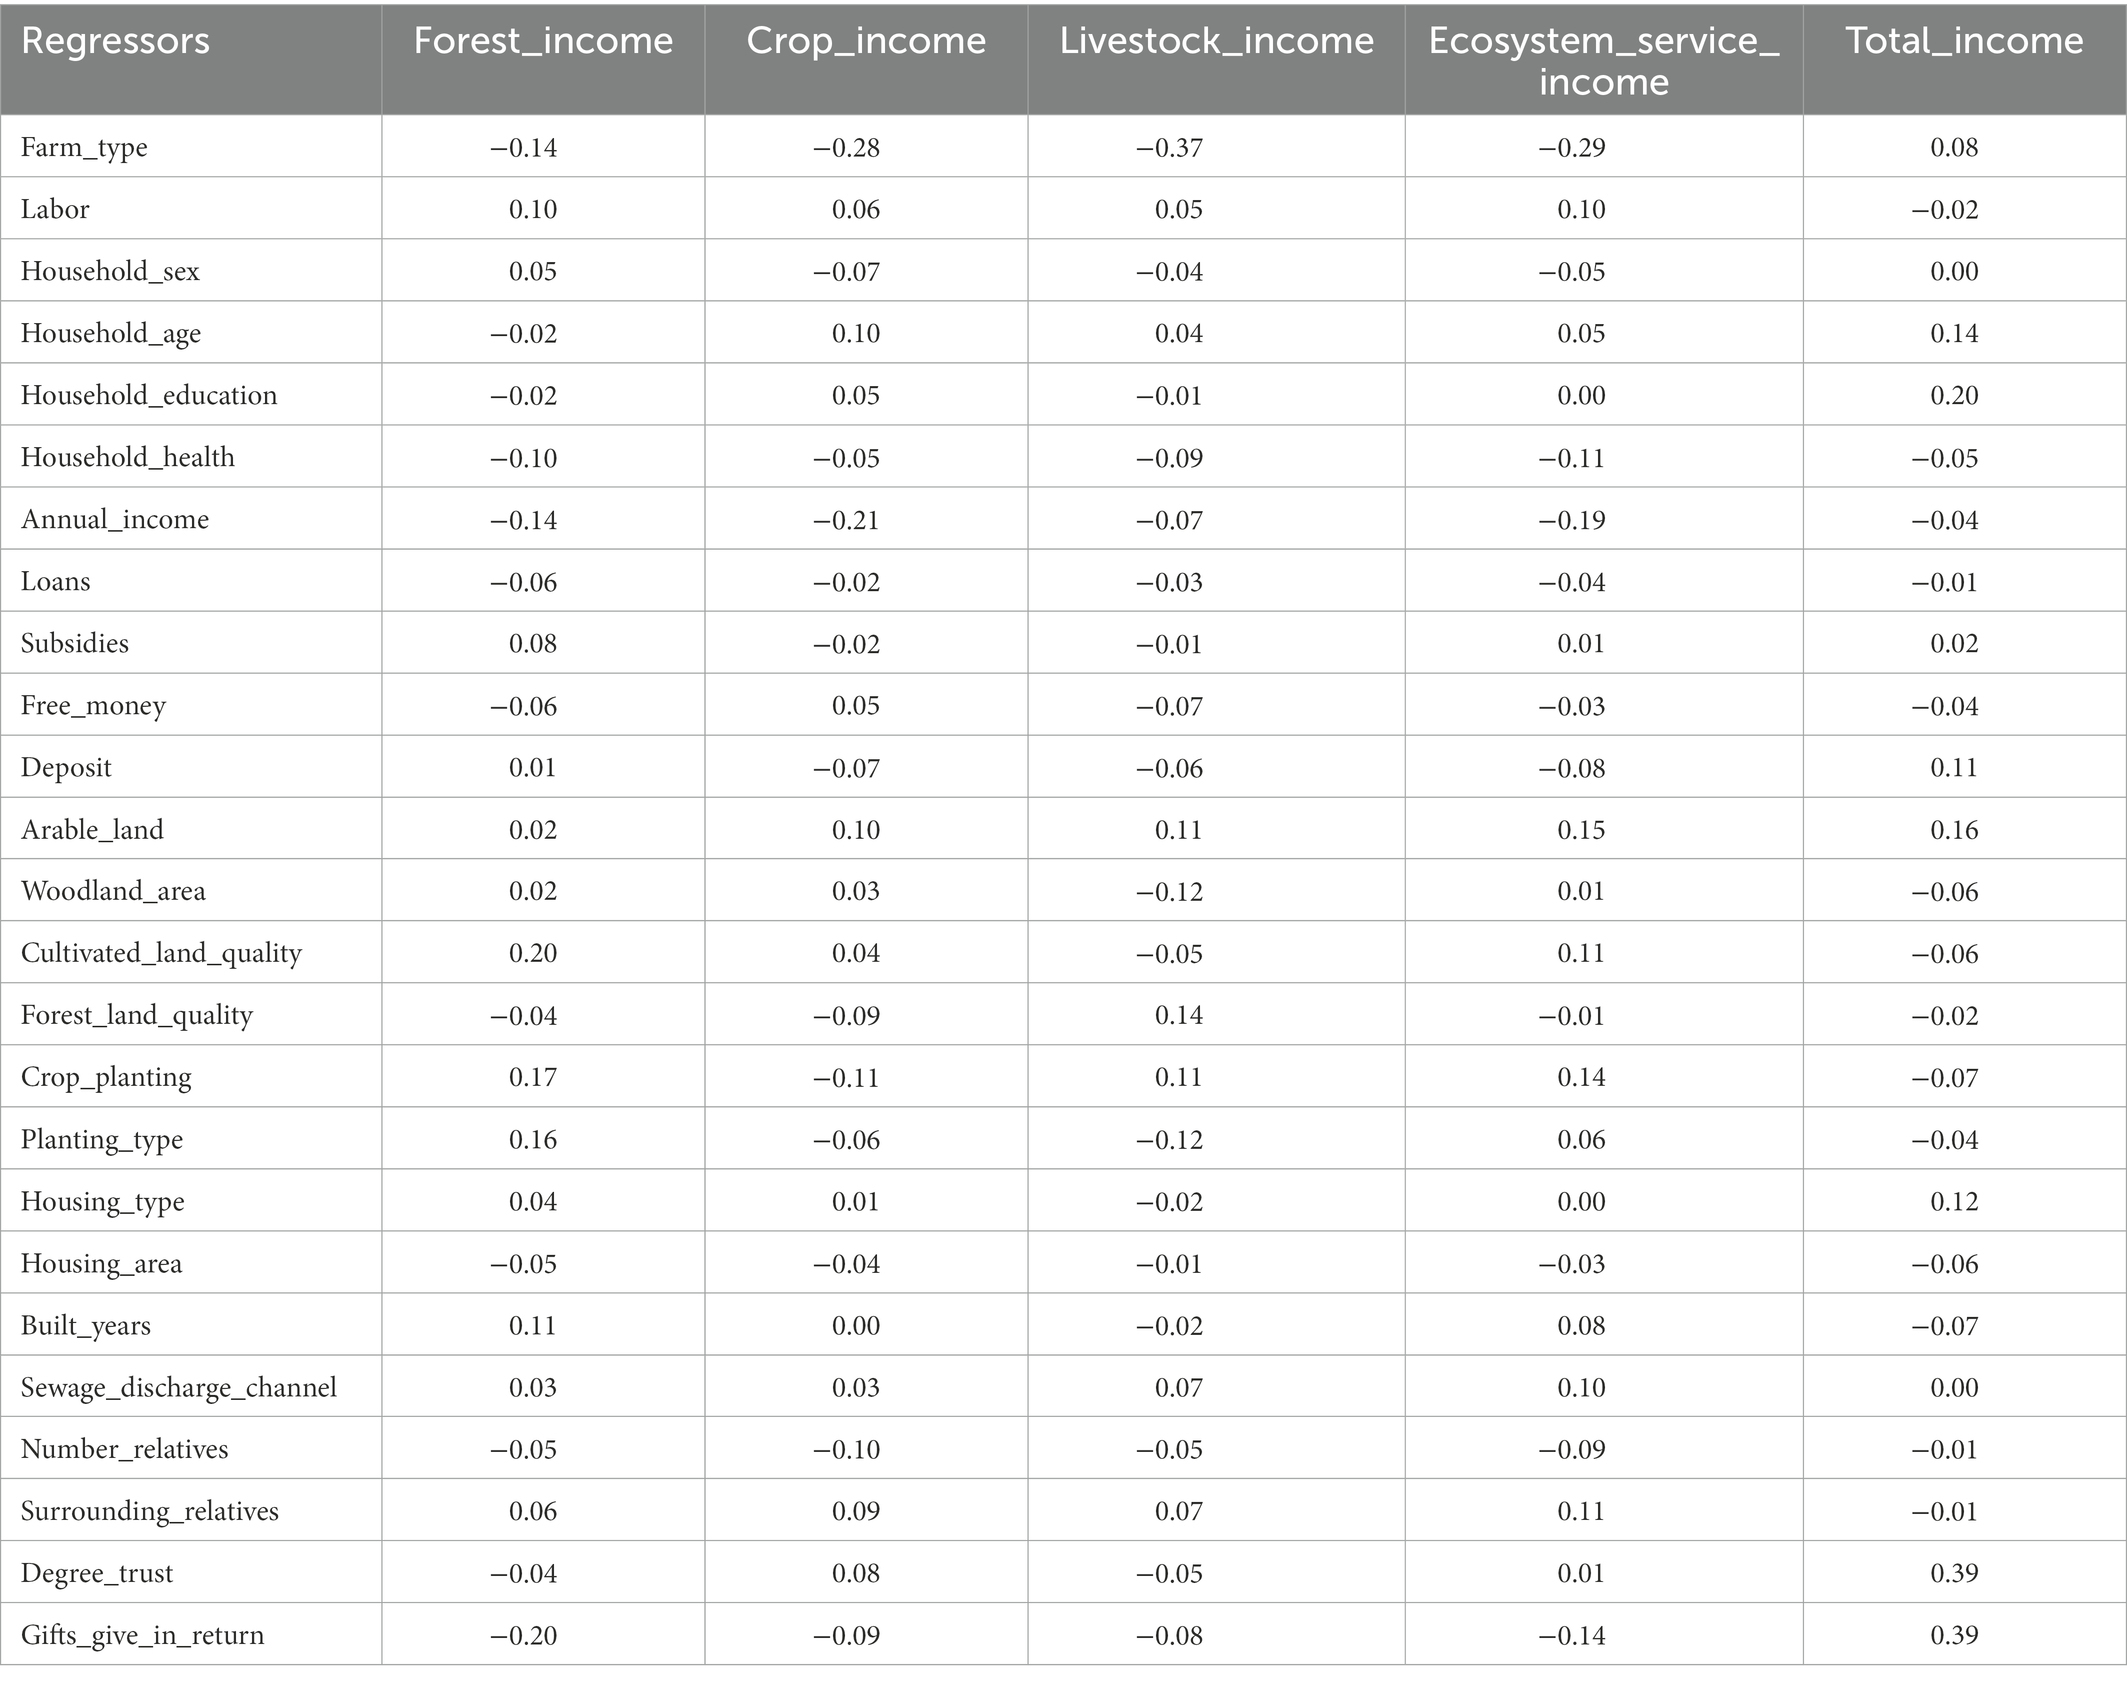
Table 5. Regression model results for livelihood assets on ecosystem service-related income.
Each type of capital in the regression model is an indicator of household wealth, and financial capital such as household savings and loan status has little effect on ES income. In contrast, the quality of arable land and forestland area, crop cultivation and ESs in natural capital are positively correlated, and dependence on ecosystems is more significant and has the greatest impact on farming household income from ESs. Land is the key productive capital of farming households, and in comparison, the area and quality of arable land have a greater impact on the crop income and livestock income of farming households. We found a small effect of physical capital (such as the age of house construction area and the situation of sewage discharge) and social capital on each income type, indicating its low correlation with ESs.
4.2. Comparative analysis of differences in the contribution of ESs to farmers’ livelihoods
4.2.1. Contribution of ESs to the livelihoods of different types of farming households
Access to forest products, crop harvests, and livestock demand for grassland are all important sources of ES provision. For pure farming households, their overall absolute household income is low, and households are poorer. Pure farming households rely on forests primarily for natural and planted forest income, which is relatively low. And by engaging in forest activities, they can contribute to diversifying their household income sources. In communities within the forest reserves of Ghana, 73% of the respondents rely on the forest to some extent for their livelihoods (Derkyi et al., 2013). Pure farming households are engaged in forest cultivation, planting and protection more than other farm types, mainly because Chongqing city is a mountainous city, most rural areas live by mountains and surrounding areas, and land resources are abundant. Thus, most pure farming households rely on forests, cultivated land and grasslands to sustain their livelihoods. The main crops grown in this area are vegetables and grains, and in addition to farmers’ self-sufficiency, they also obtain their livelihood by selling their products; for example, in the surveyed town of Xiuqi, Chengkou County, Chongqing, local farmers rely on the export of potatoes to increase their household income. In addition, 27.7% of livestock income, such as that from poultry and aquaculture, is also an important source of pure farming household income, while these households are rely on inland watershed areas to gain income by salvaging aquatic products. In contrast, since the beginning of the decade-long fishing ban in the Yangtze River basin area, fishermen have shifted to the other parts of the industry, and the income from water ESs has decreased and contributed to low farming household incomes. Part-time farming households rely on crop income (14.6%) and livestock income (10.1%) for a low percentage of their livelihood incomes. This is especially true for nonfarming households. The difference between different types of farming households is mainly related to the extent of land use, with more access to forest, cropland, and grassland resulting in a greater contribution of ESs to farming households.
In comparison to male-headed households, female-headed households (approximately 11.4% of the sample size) have lower absolute incomes in all categories and lower relative income from ESs by 4.9%, but the relative income from forests is 3.0% higher for female-headed households than for male-headed households, suggesting that in comparison to crop and livestock incomes, forest income is more attractive to female-headed households. Other studies have also shown that female-headed households use a wider variety of forest resources, often for subsistence, while men tend to collect higher-value forest products (Senganimalunje et al., 2016).
The dependence on ESs-related income varies widely among income groups. In rural households, a small proportion of farmers rely on forest products for subsistence, and most households use forest products (fungus/bark/resin/rattan/wild mushrooms) for their own consumption. Products for cooking food, such as fuel wood, and consumption of wild products highlight the importance of forest ecosystems to the livelihoods of farming households in terms of maintaining household nutrition and survival. Crop income is dominated by the cultivation of food crops, with rice, soybean, and maize contributing to the income of farming households as an economic supplement. In contrast, the staple foods and vegetables in people’s diet are agricultural products, which are important components of human nutritional intake. Second, analyzing the income differences among households in Chongqing, in comparison to the highest income quintile, the lowest income quintile relies more on the services provided by the ecosystem, but its absolute income average is 1.5 times higher than that of the lowest income quintile. That is, poorer groups derive a much larger share of their income from ecosystems. However, wealthy households are equally dependent on ecosystems (Kabubo-Mariara, 2013), and their income related to ESs increases in absolute terms as the household’s total annual income increases. Wealthy households may have the financial and physical capital needed to produce and market high-value products. Products such as wood, building materials, or thatch in rural households are also important products provided by ecosystems, and this ecosystem resource enables farming households to play an important role in building houses and furniture, among others.
4.2.2. Contribution of ESs to farmers’ livelihoods in different regions
Farmers’ access to forests, forest by-products, crops and livestock products is also different among geographical locations. In terms of the different regions of Chongqing, the western area and main urban areas of Chongqing are at a lower elevation than the southeastern and northeastern areas of Chongqing, with a slightly flatter terrain and relatively lower forest cover, thus reducing farmers’ consumption of forest products. Distance to forest areas and arable land ownership are closely related to farmers’ access to products and utilization of resources. For example, in Chengkou District and County, located in the northern part of Chongqing, farmers live around the mountains, and poultry are raised by enclosing locations near their households, which increases the demand for ESs from forests and grasslands. The supply of forest products is more accessible to households closer to forest areas than to those far from forests (Senganimalunje et al., 2016; Bakkegaard et al., 2017).
The average overall farming household income from forests in Chongqing about 8.4% is relatively low compared to the results that determined in forest livelihood surveys for rural households in developing countries (22.2%), where the share of forest income reached 20.1% and 21.4% in Asia and Africa, respectively (Angelsen et al., 2014); this difference possibly occurs because farming households mainly calculate their income from the direct value of forests and the source of their indirect income is underestimated. In contrast, income from ESs-related products accounted for 29.1% of household income in Chongqing overall, but these data do not fully reflect the contribution of this income source to farming household livelihoods. Farming households do not account for intrahousehold consumption components when determining their income from corresponding products. Therefore, the contribution of ESs should be higher.
In this paper, 59.2% of the households surveyed in the 517 samples have direct ESs-related product contributions to their livelihoods. In different regional comparisons, more farming households are dependent on agriculture for their livelihoods, and the development of agriculture may affect the income of forestry, an aspect that can be determined by observing at the overall combined income level, mainly for agriculture and forestry, and more specifically in terms of land use, with a greater ecosystem contribution.
4.3. Policy implications and limitations
This paper puts forward the following suggestions to further optimize the relationships between ESs and famers’ livelihood. Firstly, Chongqing needs to continue its forest protection policy and broaden the market for forest by-products to steadily increase the income of pure farmers. Secondly, emergency policies need to be developed to deal with extreme weather outbreaks. The stability of the climate directly affects the ecosystem supply and farmers’ livelihoods. The extreme weather over 40°C occurred in Chongqing in 2022, which lasted for over 2 months, had a huge impact on farming households who rely on ESs for their livelihoods. In this context, dynamic ecological compensation policies for forests, skills training for farmers and some other policies. May be effective approaches to maintains the stability of farmers’ livelihoods. Finally, it is important to develop site-specific sustainable management policies on a reginal basis and to implement dynamic and differentiated regional management policies for increasing the contribution of ESs to farmers’ livelihoods in different regions.
This paper describes the explicit and implicit relationships of between ESs and farmers’ livelihoods by the BN model based on DPSIR framework. Previous research has found that traditional ES valuation is unable to combine tangible and intangible ESs (Fisher et al., 2009), and therefore is even less able to confirm the impact of ESs on farmers’ livelihoods. With the development of machine learning, related researches have confirmed under the DPSIR framework, various qualitative and quantitative indicators of ESs and farmers’ livelihoods may be coupled into one model by using BN, thus making the model more realistic and sufficiently permeable (van Dam et al., 2013; Barton et al., 2016; Höfer et al., 2020). The research framework presented in this study is generalizable to other regions as long as the driving forces, pressures, states, influences and response factors in the study area are identified. However, due to the impact of the COVID-19, our questionnaire does not cover every county, and more face-to-face questionnaires are needed to better understand the perception of ESs on farmers’ livelihoods. The relationship between ESs and farmers’ livelihood in Chongqing under multi-scenario simulation should be explored in future research.
5. Conclusion
This paper analyzed the DPSIR framework between ESs and farmers’ livelihoods and proposed the implementation of a BN model based on ESs and farmers’ livelihoods in Chongqing. The main conclusions obtained are as follows:
1. Among the explicit relationships between ESs and farmers’ livelihoods in Chongqing, esthetic landscape value services and food production services have a direct and significant impact on farmers’ livelihoods.
2. There is an implicit impact of the ESs on farmers’ livelihoods. The supply of ESs required for farmers’ livelihood income is influenced by climate and land use change.
3. ESs-related income was the most important contributor to total annual household income for pure farming households in Chongqing, accounting for 77.3%. While the ESs-related income only accounted for 36.3% and 14.8% of the total annual income of part-time farming households and nonfarming households, respectively.
4. The RKR of the ESs-related incomes in Chongqing was 0.34, which means that in comparison to high-income households, low-income households derive a much larger share of income from ecosystems. The AKR of the total incomes in Chongqing was 1.15, which indicated that although low-income households are more dependent on ESs, the gap between their income from ESs and that of wealthier households was not significant.
Data availability statement
The original contributions presented in the study are included in the article/Supplementary material, further inquiries can be directed to the corresponding author.
Author contributions
LilZ: conceptualization, methodology, investigation, project administration, supervision, validation, and writing–original draft, review, and editing. DG: conceptualization, methodology, data curation, funding acquisition, investigation, formal analysis, software, validation, visualization, and writing–original draft, review, and editing. LS: conceptualization, methodology, investigation, formal analysis, and writing–review and editing. XH and MC: data curation and investigation. YZ: investigation, supervision, and writing–review and editing. LiaZ: investigation, supervision, and writing–review and editing. All authors contributed to the article and approved the submitted version.
Funding
This work was funded by the National Natural Science Foundation of China (Grant numbers 42171298 and 42201333), Natural Science Foundation of Chongqing in China (Grant number cstc2020jcyj-jqX0004), the Ministry of education of Humanities and Social Science project (Grant number 20YJA790016), and China Postdoctoral Science Foundation (Grant number 2021MD703914).
Acknowledgments
We wish to thank the households who participated in the survey. The work was supported by the Engineering Research Center of Eco-Mechanical Desertification Control and Ecosystem Carbon Sink, Ministry of Education, and the Engineering Research Center of Eco-Mechanical Desertification Control and Ecosystem Carbon Sink, High-level Research and Innovation Platform for Universities in Chongqing.
Conflict of interest
The authors declare that the research was conducted in the absence of any commercial or financial relationships that could be construed as a potential conflict of interest.
Publisher’s note
All claims expressed in this article are solely those of the authors and do not necessarily represent those of their affiliated organizations, or those of the publisher, the editors and the reviewers. Any product that may be evaluated in this article, or claim that may be made by its manufacturer, is not guaranteed or endorsed by the publisher.
Supplementary material
The Supplementary material for this article can be found online at: https://www.frontiersin.org/articles/10.3389/fevo.2023.1106167/full#supplementary-material
Footnotes
1. ^The data come from the Chongqing Municipal Statistical Bulletin data in 2019. http://tjj.cq.gov.cn/zwgk_233/fdzdgknr/tjxx/sjzl_55471/tjgb_55472/202003/t20200330_6686410.html
References
Adams, H., Adger, W. N., Ahmad, S., Ahmed, A., Begum, D., Matthews, Z., et al. (2020). Multi-dimensional well-being associated with economic dependence on ecosystem services in deltaic social-ecological systems of Bangladesh. Reg. Environ. Chang. 20:42. doi: 10.1007/s10113-020-01620-x
Adams, H., Adger, W. N., and Nicholls, R. J. (2018). Ecosystem Services Linked to Livelihoods and Well-Being in the Ganges-Brahmaputra-Meghna Delta. In: Nicholls, R., Hutton, C., Adger, W., Hanson, S., Rahman, M., Salehin, M. (eds) Ecosystem Services for Well-Being in Deltas. Switzerland: Palgrave Macmillan, Cham. doi: 10.1007/978-3-319-71093-8_2
Adger, W. N., Adams, H., Kay, S., Nicholls, R. J., and Salehin, M. (2018). Ecosystem Services, Well-Being and Deltas: Current Knowledge and Understanding. in:Nicholls, R., Hutton, C., Adger, W., Hanson, S., Rahman, M., Salehin, M. (eds) Ecosystem Services for Well-Being in Deltas. Switzerland: Palgrave Macmillan, Cham. doi: 10.1007/978-3-319-71093-8_1
Ahmed, A., Mahmud, H., and Sohel, M. (2021). DPSIR framework to analyze anthropogenic factors influence on provisioning and cultural ecosystem services of Sundarbans east reserve Forest, Bangladesh. Reg. Stud. Mar. Sci. 48:102042. doi: 10.1016/j.rsma.2021.102042
Angelsen, A., Jagger, P., Babigumira, R., Belcher, B., Hogarth, N. J., Bauch, S., et al. (2014). Environmental income and rural livelihoods: a global-comparative analysis. World Dev. 64, S12–S28. doi: 10.1016/j.worlddev.2014.03.006
Angelsen, A., Larsen, H. O., Lund, J. F., Smith-Hall, C., and Wunder, S. (2011). Measuring livelihoods and environmental dependence: methods for research and fieldwork Center for International Forestry Research (CIFOR). Bogor, Indonesia.
Bakkegaard, R. K., Hogarth, N. J., Bong, I. W., Bosselmann, A. S., and Wunder, S. (2017). Measuring forest and wild product contributions to household welfare: testing a scalable household survey instrument in Indonesia. Forest Policy Econ. 84, 20–28. doi: 10.1016/j.forpol.2016.10.005
Barton, D. N., Benjamin, T., Cerdán, C. R., DeClerck, F., Madsen, A. L., Rusch, G. M., et al. (2016). Assessing ecosystem services from multifunctional trees in pastures using Bayesian belief networks. Ecosyst. Serv. 18, 165–174. doi: 10.1016/j.ecoser.2016.03.002
Costanza, R., d'Arge, R., de Groot, R., Farber, S., Grasso, M., Hannon, B., et al. (1997). The value of the world’s ecosystem services and natural capital. Nature 387, 253–260. doi: 10.1038/387253a0
Derkyi, M., Ros-Tonen, M., Kyereh, B., and Dietz, T. (2013). Emerging forest regimes and livelihoods in the Tano Offin Forest reserve, Ghana: implications for social safeguards. Forest Policy Econ. 32, 49–56. doi: 10.1016/j.forpol.2013.03.005
Fisher, B., Turner, R. K., and Morling, P. (2009). Defining and classifying ecosystem services for decision making. Ecol. Econ. 68, 643–653. doi: 10.1016/j.ecolecon.2008.09.014
Hansen, C. P., Pouliot, M., Marfo, E., Obiri, B. D., and Treue, T. (2015). Forests, timber and rural livelihoods: implications for social safeguards in the Ghana-EU voluntary partnership agreement. Small-Scale For. 14, 401–422. doi: 10.1007/s11842-015-9295-9
Höfer, S., Ziemba, A., and El Serafy, G. (2020). A Bayesian approach to ecosystem service trade-off analysis utilizing expert knowledge. Environ. Syst. Decisions 40, 67–83. doi: 10.1007/s10669-019-09742-2
Huq, N., Pedroso, R., Bruns, A., Ribbe, L., and Huq, S. (2020). Changing dynamics of livelihood dependence on ecosystem services at temporal and spatial scales: an assessment in the southern wetland areas of Bangladesh. Ecol. Indic. 110:105855. doi: 10.1007/s10669-019-09742-2
Kabubo-Mariara, J. (2013). Forest-poverty nexus: exploring the contribution of forests to rural livelihoods in Kenya. Nat. Resour. Forum 37, 177–188. doi: 10.1111/1477-8947.12003
Kuldna, P., Peterson, K., Poltime, H., and Luig, J. (2009). An application of DPSIR framework to identify issues of pollinator loss. Ecol. Econ. 69, 32–42. doi: 10.1016/j.ecolecon.2009.01.005
Lewison, R. L., Rudd, M. A., Al-Hayek, W., Baldwin, C., Beger, M., Lieske, S. N., et al. (2016). How the DPSIR framework can be used for structuring problems and facilitating empirical research in coastal systems. Environ. Sci. Policy 56, 110–119. doi: 10.1016/j.envsci.2015.11.001
Liu, Y. (2021). Household livelihood choices under the different eco-environment in the karst area: a case study of Anshun City, southwest of China. Environ. Res. 197:111171. doi: 10.1016/j.envres.2021.111171
Millennium Ecosystem Assessment (MEA). (2005). Ecosystems and human well-being: Synthesis., millennium ecosystem assessment. Washington DC: World Resources Institute.
Nguyen, T. T., Do, T. L., Buehler, D., Hartje, R., and Grote, U. (2015). Rural livelihoods and environmental resource dependence in Cambodia. Ecol. Econ. 120, 282–295. doi: 10.1016/j.ecolecon.2015.11.001
Odhiambo, C. O., Wasike, C. B., and Ogindo, H. O. (2019). Effect of socio-demographic characteristics on Kenyan smallholder dairy farmers’ adaptive strategies to climate change effects. Atmos. Clim. Sci. 9, 583–599. doi: 10.4236/acs.2019.94037
Orchard, S. E., Stringer, L. C., and Quinn, C. H. (2016). Mangrove system dynamics in Southeast Asia: linking livelihoods and ecosystem services in Vietnam. Reg. Environ. Chang. 16, 865–879. doi: 10.1007/s10113-015-0802-5
Pearl, J. (1988). Probabilistic reasoning in intelligent systems: Networks of plausible inference. San Francisco, CA, United States, Morgan Kaufmann Publishers Inc.
Pontarollo, N., and Mendieta Muñoz, R. (2020). Land consumption and income in Ecuador: a case of an inverted environmental Kuznets curve. Ecol. Indic. 108:105699. doi: 10.1016/j.ecolind.2019.105699
Pouliot, M., Treue, T., Obiri, B. D., and Ouedraogo, B. (2012). Deforestation and the limited contribution of forests to rural livelihoods in West Africa: evidence from Burkina Faso and Ghana. Ambio 41, 738–750. doi: 10.1007/s13280-012-0292-3
Rahman, M. M. (2010). Balancing ecosystem services and livelihoods: A study of Nyando wetland, Kenya using a Bayesian probability network. MSc-thesis, UNESCO-IHE Institute for Water Education, Delft, The Netherlands, 86.
Robinson, B. E., Zheng, H., and Peng, W. (2019). Disaggregating livelihood dependence on ecosystem services to inform land management. Ecosyst. Serv. 36:100902. doi: 10.1016/j.ecoser.2019.100902
Sarkodie, S. A., and Adams, S. (2020). Electricity access and income inequality in South Africa: evidence from Bayesian and NARDL analyses. Energ. Strat. Rev. 29:100480. doi: 10.1016/j.esr.2020.100480
Senganimalunje, T. C., Chirwa, P. W., Babalola, F. D., and Graham, M. A. (2016). Does participatory forest management program lead to efficient forest resource use and improved rural livelihoods? Experiences from Mua-Livulezi Forest reserve, Malawi. Agrofor. Syst. 90, 691–710. doi: 10.1007/s10457-015-9826-6
Tripathi, R., Moharana, K. C., Nayak, A. D., Dhal, B., Shahid, M., Mondal, B., et al. (2019). Ecosystem services in different agro-climatic zones in eastern India: impact of land use and land cover change. Environ. Monit. Assess. 191, 98–113. doi: 10.1007/s10661-019-7224-7
van Dam, A. A., Kipkemboi, J., Rahman, M. M., and Gettel, G. M. (2013). Linking hydrology, ecosystem function, and livelihood outcomes in African papyrus wetlands using a Bayesian network model. Wetlands 33, 381–397. doi: 10.1007/s13157-013-0395-z
Walelign, S. Z., and Jiao, X. (2017). Dynamics of rural livelihoods and environmental reliance: empirical evidence from Nepal. Forest Policy Econ. 83, 199–209. doi: 10.1016/j.forpol.2017.04.008
Waruingi, E., Mbeche, R., and Ateka, J. (2021). Determinants of forest dependent household’s participation in payment for ecosystem services: evidence from plantation establishment livelihood improvement scheme (PELIS) in Kenya. Global Ecol. Conserv. 26:e01514. doi: 10.1016/j.gecco.2021.e01514
Xie, G., Zhang, C., Zhen, L., and Zhang, L. (2017). Dynamic changes in the value of China’s ecosystem services. Ecosyst. Serv. 26, 146–154. doi: 10.1016/j.ecoser.2017.06.010
Keywords: ecosystem services, farmers’ livelihoods, DPSIR framework, Bayesian network model, contribution rate, Chongqing
Citation: Zhou L, Guan D, Sun L, He X, Chen M, Zhang Y and Zhou L (2023) What is the relationship between ecosystem services and farmers’ livelihoods? Based on measuring the contribution of ecosystem services to farmers’ livelihoods. Front. Ecol. Evol. 11:1106167. doi: 10.3389/fevo.2023.1106167
Edited by:
Ümüt Halik, Xinjiang University, ChinaCopyright © 2023 Zhou, Guan, Sun, He, Chen, Zhang and Zhou. This is an open-access article distributed under the terms of the Creative Commons Attribution License (CC BY). The use, distribution or reproduction in other forums is permitted, provided the original author(s) and the copyright owner(s) are credited and that the original publication in this journal is cited, in accordance with accepted academic practice. No use, distribution or reproduction is permitted which does not comply with these terms.
*Correspondence: Dongjie Guan, ✉ Z3VhbmRvbmdqaWVfMjAwMEAxNjMuY29t