 Meibao Chen1
94% of researchers rate our articles as excellent or good
Learn more about the work of our research integrity team to safeguard the quality of each article we publish.
Find out more
ORIGINAL RESEARCH article
Front. Earth Sci., 27 December 2023
Sec. Geoinformatics
Volume 11 - 2023 | https://doi.org/10.3389/feart.2023.1297133
This article is part of the Research TopicSpatial Modelling and Failure Analysis of Natural and Engineering Disasters through Data-Based Methods,volume IIIView all 18 articles
The shale gas well station plays a critical role in the extraction of shale gas, and its safety status exerts significant influence not only on shale gas production but also on the ecological balance of the surrounding environment. To investigate the response characteristics of the shale gas well station under the impact of tailings dam failure debris flow, a comprehensive analysis was conducted using a combination of physical modeling and numerical simulation. The analysis focused on the dynamic inundation process and the impact siltation law caused by the downstream flow of tailings dam failure debris at the shale gas well station. The depth of inundation and the extent of siltation damage were employed as key parameters for characterization. Experimental findings revealed that the downstream mudflow inundation process could be divided into three distinct stages: rapid increase (0–60 s), steady increase (60–106 s), and slow advance (106–250 s). The pattern of mudflow siltation height variation at the well station exhibited an initial rise, followed by a subsequent decline and eventual stabilization. The highest siltation volumes recorded at measurement points A to D were 4.4, 4, 5.2, and 6 m, respectively. Additionally, by employing computational fluid dynamics, numerical calculations were performed under unprotected conditions, with the error between the calculated conclusions and the test results not exceeding 15%. Furthermore, the blocking effect of 8 and 16 m debris flow blocking dam on the debris flow was thoroughly investigated. The study demonstrated that the check dam with a height of 16 m yielded the most effective blockage, resulting in the highest sediment siltation height of 0.4 m. The research results provide some reference for the prevention and control of debris flow disasters.
Shale gas, as a distinct energy source characterized by properties such as low density, high pressure, volatility, flammability, and explosiveness, presents unique characteristics that set it apart from petroleum. The establishment and safe operation of shale gas well stations, serving as extraction platforms, are frequently accompanied by intricate mudslide disasters. These disasters pose a severe threat to both the operational integrity of the extraction platforms and the safety of personnel involved (Dong et al., 2012). The formidable impact inflicted by the mud-slide leads to extensive destruction of the wellsite’s infrastructure, resulting in significant casualties and imposing immense pressure on both the safety and production of the wellsite (Cristo et al., 2022). In 2015, a catastrophic dam failure occurred at the Fundão tailings pond in Brazil. This event resulted in a massive mudslide triggered by approximately 80% of the stored tailings being released. The mudslide directly impacted 806 downstream buildings, causing irreparable damage to these structures and the surrounding towns (Carmo et al., 2017). Moreover, the infiltration of mudflow and subsequent flooding of a shale gas well station would result in significant losses for the operating company. Therefore, investigating the mechanical response characteristics of shale gas well stations to mudslide disasters becomes an urgent and imperative task that demands immediate attention.
Scholars around the world have conducted extensive research on debris flow hazards formed after tailings dam breaches and have achieved many excellent results. Yu et al. (2020) introduced a novel approach to investigate the flow characteristics of outburst debris flow. They proposed a new method that combines 3D modeling with computational fluid dynamics (CFD) and applied it to a real-life scenario of dam-breaking debris flow. Wang et al. (2022) conducted a model test under intense rainfall conditions to investigate the formation conditions of tailings dam outburst debris flow. Through their study, they concluded that different rainfall amounts result in varying degrees of roof damage in tailings dams. Concha and Lall (2018) introduced a statistical model capable of predicting the distance of mudflow propagation based on the discharged volume of mudflow. This model serves as a theoretical reference for implementing downstream safety protection measures. Wang et al. (2018) conducted a study where they utilized satellite remote sensing Digital Surface Model (DSM) in combination with the meshless Smoothed Particle Hydrodynamics (SPH) method. They employed 3D spatially realistic numerical modeling tools to compare the computational findings with the observed evolutionary paths of mudslide downdrafts from physical modeling experiments and a real case of dam breakage. Jing et al. (2019a) performed a detailed analysis of dam failure through a model test, focusing on the failure width. They developed a prediction model for the width of tailings dam failure, considering the number of reinforcing layers. This model accurately predicted the discharge flow rate based on variations in the failure width. Wang et al. (2017) conducted a flood simulation test to predict underflow and investigate the impact of rainfall on the infiltration line. They also summarized the relationship between the infiltration line and dam failure, establishing its governing laws. Chen et al. (2022; 2023) conducted research on the reinforcement methods of tailings dams. They studied the changes in underflow flow patterns when the dam body breached and summarized the evolution process of the breach. Additionally, they derived a model to describe the changes in underflow mud and rock flow. Wu and Qin, (2018) conducted a comparative study on the effectiveness of protective measures by incorporating coarse particles into the downstream dam body. The results demonstrated that the addition of coarse particles to the downstream dam face effectively reduced the flow rate, size, inundation area, and tailings settlement associated with downstream debris flow. Jing et al. (2019b) analyzed and summarized the correlation between mud depth and tailings particle size at the breach section, considering tailings particle size as a variable. They predicted and derived the changes in the quantity of underflow mud and rock flow based on their findings. Pirulli et al. (2017) integrated the flow characteristics and rheo-logical properties of tailings dam outburst debris flows. They utilized novel rheological combinations to predict the evolution pattern of underflow debris flow. Li et al. (2022) employed a finite element coupled discrete element approach to predict the movement and downstream inundation range of mudflow following a tailings dam failure. Wei et al. (2017) conducted a study in which they considered the tailings slurry concentration, downstream slope, and breach morphology as variables. They investigated the flow characteristics of the debris flow formed after the breach on a square flat plate and summarized the governing flow patterns of the debris flow. Zhang et al. (2014) conducted a mechanical study on the causes of tailings dam damage at both the macro and fine scales by employing a coupling method of finite element and discrete element phases. Their research provided significant theoretical support for predicting outburst mudflow events. Wang et al. (2019) conducted experiments with different debris flow check dams and channel slope drop conditions. They investigated the blocking effects of various check dams and slope drops on the evolution of debris flow, as well as the patterns of energy loss associated with these factors. Li et al. (2020) summarized the three-dimensional spatial variation process of debris flow following a tailings pond failure. They also made predictions regarding the downstream impacts of debris flow resulting from dam failure. Yuan et al. (2016) conducted a study focusing on the composition of outburst mudflow. They analyzed the composition and, based on their findings, established a three-dimensional fluid model using Fluent software. With this model, they investigated the motion and pressure distribution characteristics of the outburst mudflow. Wang et al. (2021) developed an evaluation index for classifying the hazard level of downstream buildings in the event of a dam failure debris flow disaster. The evaluation conclusions derived from their study exhibited a strong alignment with the conclusions drawn from physical and numerical models. Yu et al. (2021) developed a method by integrating a hydrodynamic model into a virtual geographic environment system. This approach aimed to establish a more accurate simulation of the flow field of mud and rock during tailings pond breaches, particularly in complex landscapes. The authors conducted simulations of actual dam breach cases using this method. Ghahramani et al. (2020) developed a novel diversion system to redirect the evolution path of downstream debris flow resulting from tailings dam failure. They independently calculated the inundation area downstream of the tailings dam failure debris flow using remote sensing data. Additionally, they introduced a new database comprising 33 instances of dam failure.
The previous research primarily focused on analyzing the evolution process of individual tailing pond outburst mudflows, with limited studies on the mechanical response of downstream structures like shale gas well stations. To address this gap, this study takes a small-scale model based on a shale gas well station in Nanchuan, Chongqing, and investigates the extent of the disaster caused by the outburst mudflow on the shale gas well station. Additionally, the study aims to explore the mechanical response characteristics of the shale gas well station to the mudflow and examine the effectiveness of barricade dams in blocking the mudflow. The research findings presented in this study provide valuable insights for the prevention and mitigation of mudflow disasters impacting shale gas well stations and other structures. These findings serve as a valuable reference for the development and implementation of future mitigation measures.
The surrounding topography of the shale gas well station is replicated in a reduced scale within a physical model, ensuring a specified scale relationship. By employing the principles of similarity theory, adherence to the prescribed scale relationship between the prototype and physical model, in terms of their components and physical quantities, enables accurate representation of the prototype’s phenomena and essential characteristics during testing. Table 1 provides an overview of the selected similarity scale for the conducted experiments.

TABLE 1. Summary of similarity scales.
The test samples of tailing sand were obtained from a tailing pond located in Nanchuan, Chongqing, China. To analyze the particle size of the samples, a Winner 2008 laser particle sizer was utilized. Figure 1 presents the results of the grading analysis conducted on the tailings sand samples. In this test, the red mud exhibited a median particle size (d50) of 5.1 μm. Other characteristic particle sizes included 2.9 μm for d10, 3.6 μm for d30, 7.0 μm for d90, and 5.6 μm for d60. The coefficient of inhomogeneity (Cu) was measured as 1.76, while the coefficient of curvature (Cc) was found to be 0.79. In order to select the appropriate model sand, a final particle size analysis was performed to determine the average particle size (d50) as a reference.
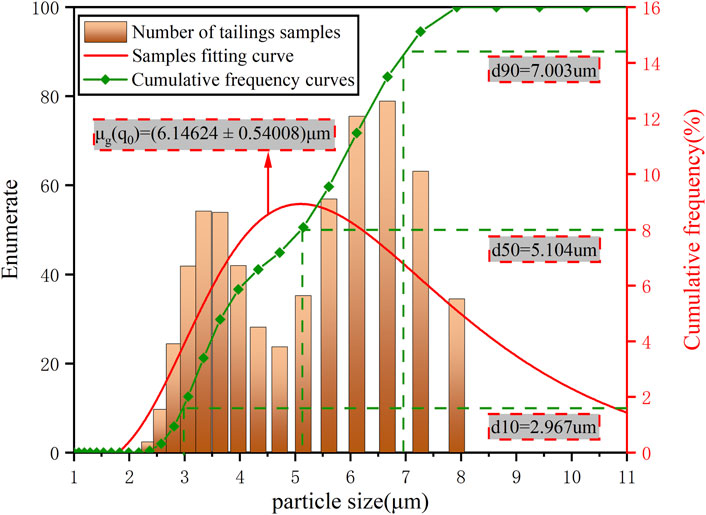
FIGURE 1. Tailings particle gradation curve.
The tailings reservoir in the study area, as shown in Figures 2A, B, is situated in a denuded valley within a medium-low mountainous region, exhibiting a relative height difference of 295 m between its highest and lowest points. The geographic location benefits from abundant precipitation, particularly during the rainy season from May to September, which accounts for approximately 78% of the annual rainfall. In the event of intense heavy rainfall, the tailings dam is highly vulnerable to overtopping, dam bursting disasters, and the consequent formation of mudslides that cascade downstream. The prototype well station platform and the model of the upstream tailings storage pile are depicted in Figure 2C. The actual dimensions of the terrain encompass an area of 800 m × 536 m (length × width). Scale modeling at 400:1 scale. The simulated test area takes the form of an ‘L’ shape, with the tailings storage area situated in the southeastern high-altitude region. The shale gas well station platform is positioned approximately 300 m north of the tailings storage area. In this test, the mudflow direction at the well station is southward. To facilitate measurements, four mud depth measuring scales are pre-buried vertically at the southern edge of the well station platform, as shown in Figure 2D. To ensure a com-parable surface roughness in the physical model, a layer of cement mortar, approximately 1–2 cm thick, is applied. Furthermore, anti-cracking agents are incorporated into the concrete mixture to prevent cracks. Following the application of the mortar, a maintenance period of 7 days is observed. This allows the cement mortar on the model’s surface to attain optimal strength properties and controls the occurrence of cracks.
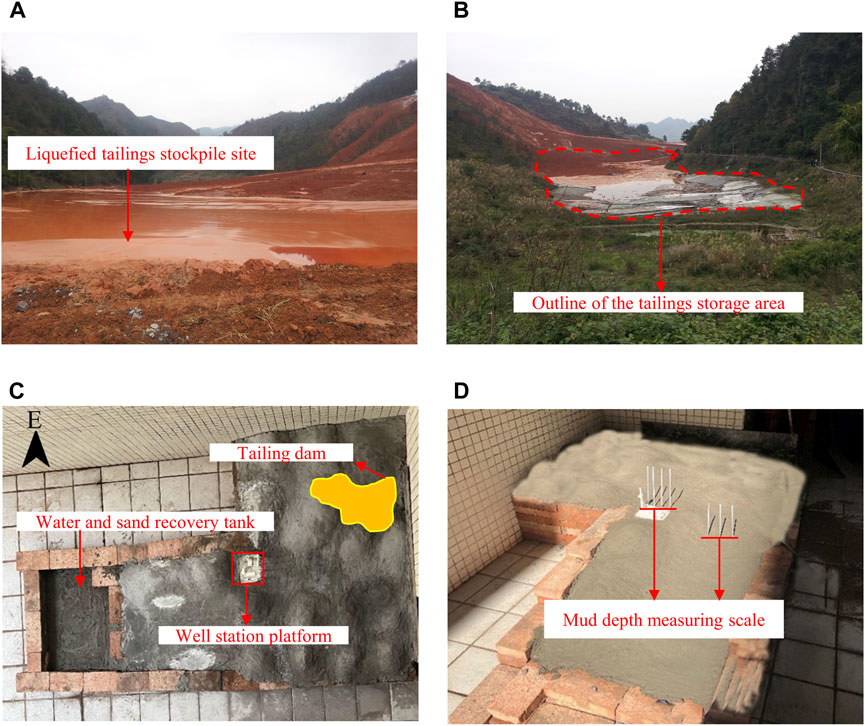
FIGURE 2. Physical Model Building. (A) Tailings liquefaction site within the tailings storage area in the study area, (B) Actual site topography of the tailings pond, (C) Tailings dam and schematic physical model of shale gas well station location, (D) Schematic of the mud depth measurement scale on the south side of the well station.
The test utilized fine fly ash as the chosen simulated sand due to its numerous advantages, including a wide range of raw material sources, stable physical and chemical properties, and the absence of particle suspension during the flow process. The dry bulk weight of the deposited ash samples varied between 7.1 and 9.9 kN/m3, remaining within the range of 6.2 kN/m3 to 11.8 kN/m3. Notably, the permeability coefficients of the majority of domestic fly ash and tailing sand were similar, with the fine fly ash exhibiting a permeability coefficient (k) of 10–4 cm/s (Jiang et al., 2007). The particle size gradation of the fine fly ash is illustrated in Figure 3. From the figure, it is evident that the median particle size of the fine fly ash in this test ranges from approximately 0.065 to 0.005 mm.
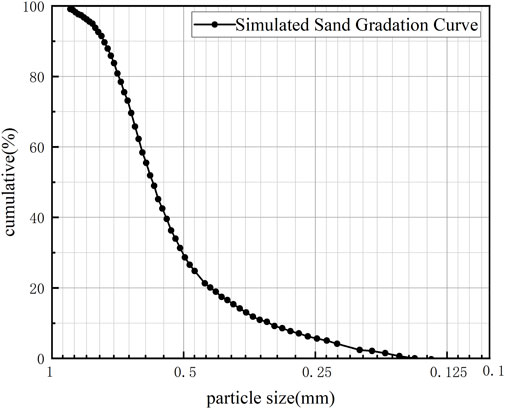
FIGURE 3. Fine fly ash particle gradation curve.
To facilitate a comprehensive comparison and validation of the experimental results, numerical computations utilizing computational fluid dynamics (CFD) methods were conducted to analyze the mudflows originating from tailing ponds and their subsequent impacts on downstream shale gas well stations. This approach aimed to enhance the accuracy of the conclusions drawn from the study. The numerical model consists of a total of 8.45 million grids, and the computational time is set to 240 s. As the experiment involves the coupling of water flow and sediment, four computational models, namely, gravity, scouring, viscous, and turbulence, are selected for the calculations. The average particle size of the tailing sand is determined through indoor testing, and the particle size analysis reveals that the median particle size (d50) of the red mud in this experiment is 0.0051 mm. According to the Design Code for Tailings Facilities (GB50863-2013), when the particle size of tailing sand exceeds 0.074 mm and constitutes more than 85% of the total weight, it is classified as tailing fine sand. The average accumulation dry density of the tailings is considered to be 1,450 kg/m3.
In this test, the primary objective is to analyze the trend of the inundation range of the debris flow as it reaches the well station. To facilitate this analysis, the inundation area of the well station in the model test is converted to a similar scale using ImageJ software. This conversion process involves repeated observations of the mudflow movement process within the model test well station. Meanwhile, For the modeling tests, the slurry concentration was referenced to the concentration of tailings slurry discharged from mining companies, and the slurry concentration was set at 50%.
As depicted in Figure 4 (see below), when the time (T) reaches 20 s, the entire downstream area becomes flooded, covering an area of 51,040 m2. As T reaches 35 s, the discharged mudflow rapidly descends and splits into three tributaries due to the low-lying terrain at the valley mouth in the southwest direction of the tailing pond. The mudflow in this direction exhibits the fastest evolution, and the first tributary to reach the shale gas well station is in the southeast direction. By the time T reaches 50 s, the mudflow in the northeast direction commences flooding the well station, engulfing most of its facilities and equipment. The total flooded area expands to 84,640 m2, with the well station alone covering 2,720 m2. At T=60 s, the mudflow at the well station merges with the river mudflow, causing a sudden increase in inundation. The flooded area in the downstream region reaches 89,920 m2, with the well station accounting for 4,320 m2. Continuing the progression, at T=106 s, the flooded area in the downstream region continues to expand, encompassing 108,000 m2, while the well station is inundated by 5,600 m2. The flow of mud ceases at T=250 s, resulting in a final inundation area of 112,042 m2, with the well station being submerged by 5,780 m2.
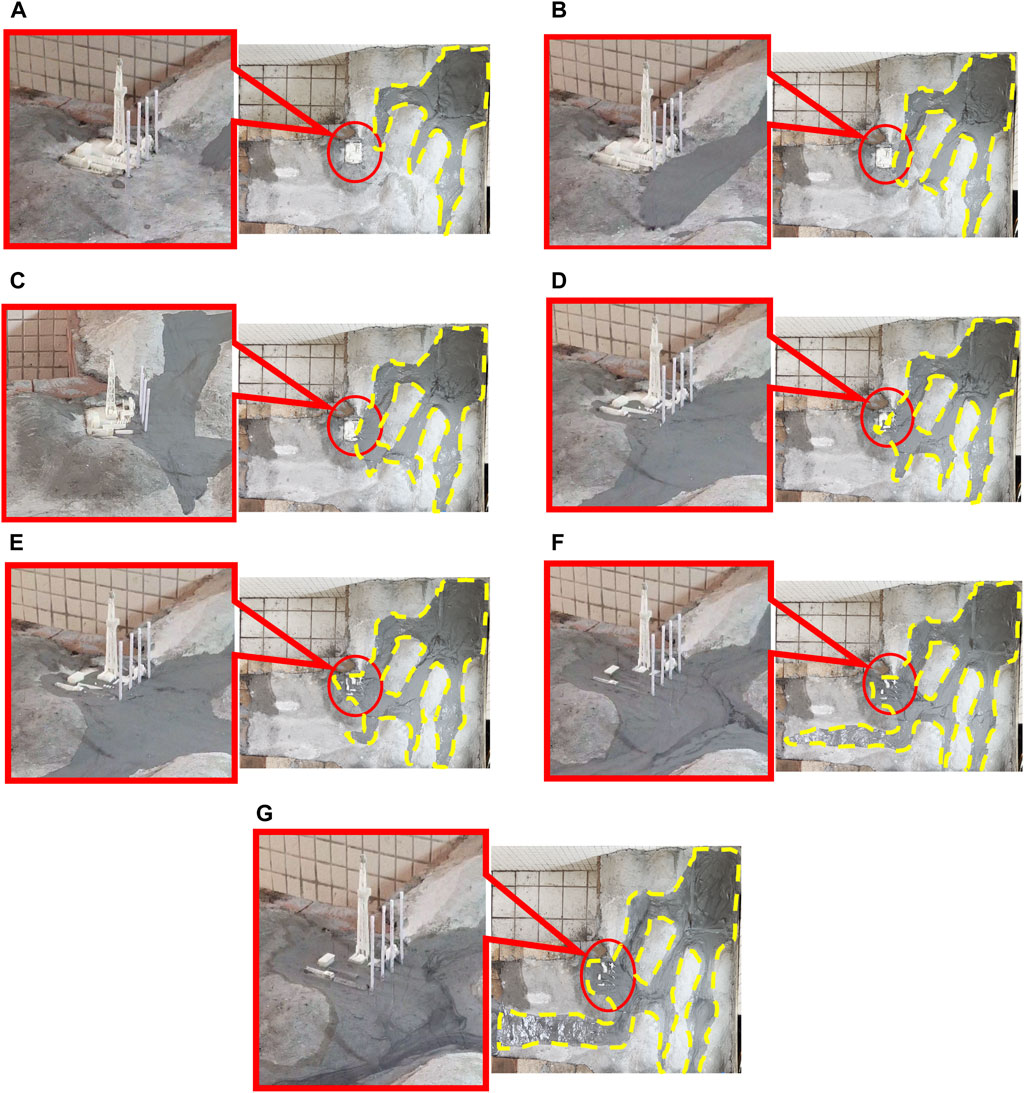
FIGURE 4. Experimental effects of inundation of well stations by outburst mudslides. (A) 20 s into the experiment, (B) 35 s into the experiment, (C) 40 s into the experiment, (D) 50 s into the experiment, (E) 60 s into the experiment, (F) 106 s into the experiment, (G) 250 s into the experiment.
As illustrated in Figure 5 (refer to the figure below), the process of mudflow scouring the well station downstream can be divided into three stages. During the initial stage (0–60 s), the inundation range of the mudflow experiences a rapid increase. This can be attributed to the high potential energy of the mudflow itself, which quickly transforms into a destructive force. Additionally, the unique geomorphological features of the region contribute to the mudflow’s strong discharge capacity. The second stage (60–106 s) is characterized by a steady increase in the inundation range of the mudflow. This can be attributed to the relatively flat topography of the shale gas well station, allowing for greater flow through the cross-section and resulting in the spread of the mudflow. Factors such as internal resistance and energy loss within the mudflow, coupled with reduced discharge from the reservoir during the first wave of the flood peak, contribute to insufficient energy replenishment. The third stage (106–250 s) is the slow flow stage of the mudflow inundation area. During this stage, the presence of the drilling platform and well station impedes the evolution of the mudflow, causing the downstream tailings to accumulate around the well station, thereby reducing the movement speed of the mudflow. Additionally, the depletion of mudflow sources in the upstream tailings reservoir leads to a cessation of impact from the majority of the mudflow downstream, resulting in a stabilized inundation area and ultimately bringing the impact to a halt. By comparing and verifying the numerical calculation results at various time points, the obtained conclusions align more closely with the model test.
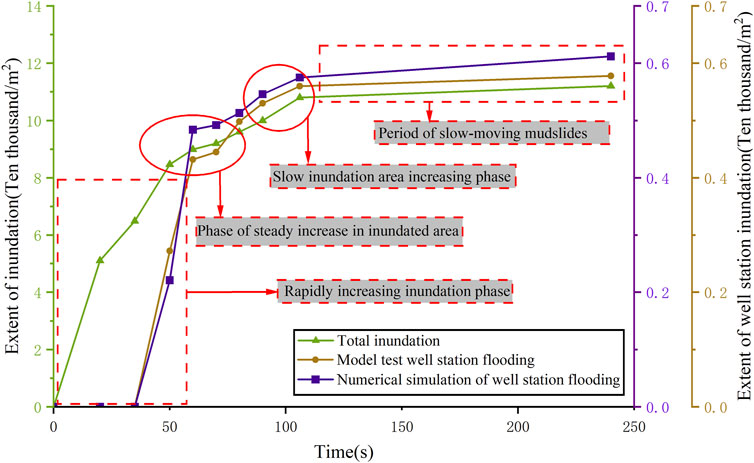
FIGURE 5. Time-varying curves of inundation extent of outburst mudslides.
The test involved the measurement of the variation in inundation depth caused by the debris flow reaching the well station. This was achieved through the utilization of a pre-embedded mud depth collection column and a high-speed camera. Figure 6 presents the recorded data of the inundation depth (it should be noted that the data in the figure were not converted using the similarity ratio). The initial measurement point, corresponding to the arrival of the mudflow at the well station, was observed at the 35th second following the failure of the tailing dam.
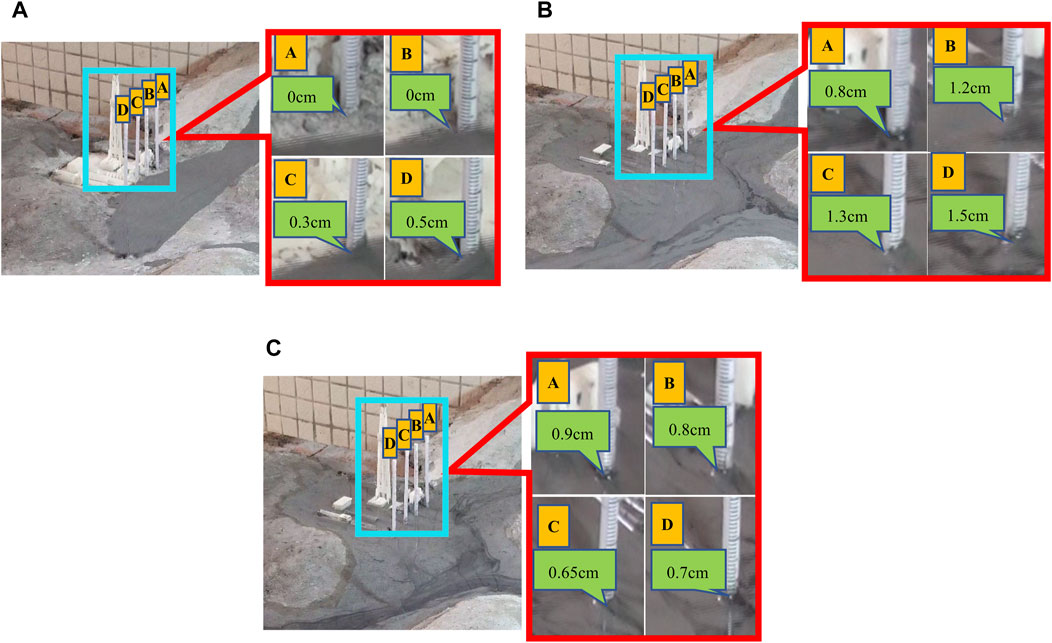
FIGURE 6. Mudslide siltation height test at well station gauging points. (A) 35 s into the experiment, (B) 85 s into the experiment, (C) 135 s into the experiment.
As depicted in Figure 7, significant fluctuations in the mudflow sediment depth over time were observed at four measuring points (A, B, C, and D) near the downstream shale gas well station.
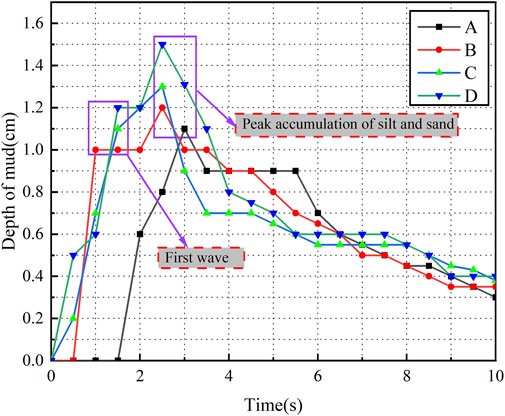
FIGURE 7. Mud depth variation curves at well station monitoring points.
Measuring Point A: Located in the direction of the well station leaning against the mountain and closest to the reservoir area, this point has a steeper slope. When the mudflow reaches measuring point A at the 67th second, the siltation rapidly rises, reaching a maximum depth of 4.4 m at the 84th second. Subsequently, the mudflow at measuring point A maintains a peak flow rate until approximately the 146th second. Afterward, the siltation height gradually decreases but maintains a slow downward trend.
Measuring Point B: The mud and gravel flow reaches its first peak at the 46th second, resulting in an instant increase in sediment siltation height at measuring point B. The siltation depth reaches 4 m by the 53rd second. Following this, the siltation height stabilizes to some extent. However, due to the well station’s obstruction of the mud and gravel flow, continuous accumulation occurs, leading to a second peak of 4.8 m at the 74th second.
Measuring Points C and D: These points exhibit a similar pattern of water level distribution as measuring point B. At the 40th second, both measuring points reach a maximum value of 5.2 m and 6 m, respectively. Afterwards, the water levels rapidly decrease to 2.8 m and 3 m and continue to gradually decrease until they stabilize.
The variation in mud depth at the measurement point of the well station can be divided into two distinct phases. The first phase is characterized by a rapid increase in the siltation height, primarily attributed to the substantial volume of discharged mudflow and its high flow velocity. The second phase represents a gradual decline in the discharged mudflow volume over time. The topography and presence of the well station act as obstacles, resulting in a gradual reduction in sediment deposition. The final submerged depth of the debris flow at each measuring point following the collapse exhibits considerable randomness and non-uniformity. This can be attributed to variations in terrain features, valley morphology, slope characteristics, and cross-sectional area along the path of mudflow discharge. These factors contribute to variations in the velocity and direction of the mudflow, which continues to descend after passing the well station situated on the hillside. Furthermore, the sediment-carrying nature of the mudflow and its discharge velocity play crucial roles in determining the distribution of tailing sand. The distribution of tailing sand significantly impacts the overall scenario and its implications in the study.
The test was conducted using an instantaneous routing mode, wherein the flow of the mudflow is constrained by the total volume of mudflow after routing. As a result, as the flow velocity decreases, the mudflow gradually dissipates its kinetic energy, resulting in a reduction of its potential impact energy. This phenomenon subsequently leads to the deposition of sediment particles within the river channel.
Table 2, provided below, demonstrates the validation effect by comparing the results of the model test with the conclusions drawn from numerical simulation calculations. The errors at measuring points A, B, C, and D are 2%, 6%, 15%, and 11%, respectively. These results indicate a good similarity between the numerical simulation and the model test.

TABLE 2. Comparison of maximum inundation depth results for numerical simulations and model tests at characteristic moments.
Given the comprehensive coverage and significant impact of the debris flow on the well station, as revealed through the analysis conducted, it becomes imperative to implement preventive measures aimed at mitigating the effects of debris flow on the well station.
To mitigate the impact and inundation effects of mudflow on the well station, gravity check dams were implemented in conjunction with the actual engineering site. These dams were designed to intercept the discharged mudflow and allow the settling of tailing sand, thereby reducing the damage caused by the mudflow to the well station. Based on investigations, it was found that setting a debris flow blocking dam at the entrance of the downstream canyon can attenuate the potential energy impact of the mudflow to a certain extent (Banihabib and Forghani, 2017).
In the test area, the valley takes the form of a U-shaped open area. In consideration of safety, effectiveness, and construction costs, the design of the debris flow blocking dam incorporated two specific heights, namely, 8 and 16 m. In the absence of a dam, the well station experienced flooding from mudslides in the southeast and southwest directions. As a result, the No.1 dam was positioned 160 m southeast of the well station, and the No.2 dam was situated 200 m southwest of the reservoir at the valley mouth.
Two sets of working conditions were established for the test. In Working Condition 1, the first barrier dam had a height of 2 cm and a width of 6 cm (equivalent to an on-site height of 8 m and a width of 24 m), while the second barrier dam had a height of 2 cm and a width of 8 cm (equivalent to an on-site height of 8 m and a width of 32 m). In Case 2, the height of the barrier dams was increased to 4 cm (equivalent to an on-site height of 16 m). The barrier moldings were constructed using cement and secured to the ground with expansion bolts.
Table 3 provides information regarding the time delay observed at the well station’s measurement point after implementing the 8-m debris flow blocking dam. The presence of the blocking dam causes varying degrees of delay in the mudflow reaching the measurement point. A comparison between the no dam mode and the 8-m debris flow blocking dam mode reveals time differences in mudflow inundation at the well station. These time differences are 13, 4, 20, and 20 s for each respective measurement point. Furthermore, there is a 4-s time difference between the two modes in terms of mudflow movement to measurement point B. This time difference gradually increases, indicating that the dam not only slows down the mudflow from the tailing dam failure, but also delays its arrival at the measurement points.
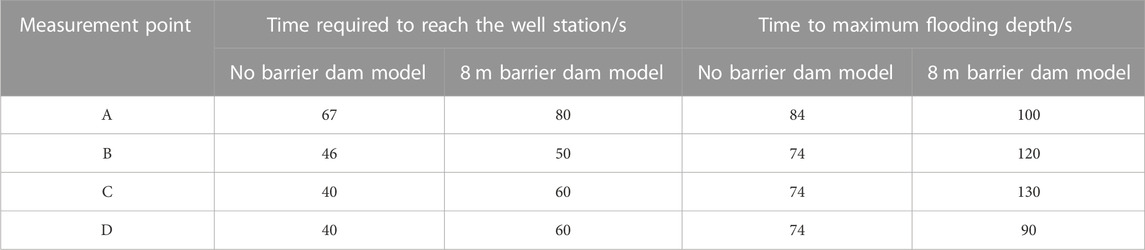
TABLE 3. Comparison of the time for the mudflow to reach the key measurement point at the well station in the two models.
The time of arrival at different measurement points is correspondingly slowed down in the presence of the debris flow blocking dam. Moreover, there is a significant difference in the time it takes for the mudflow to reach the highest inundation depth between the two modes. This difference amounts to 16, 46, 56, and 16 s for the respective measurement points. These findings demonstrate that the presence of the debris flow blocking dam significantly prolongs the time it takes for the mudflow to reach its peak depth.
Figure 8 illustrates the relationship between mud depth and time at the monitoring point of the 8-m debris flow blocking dam. The following observations can be made:
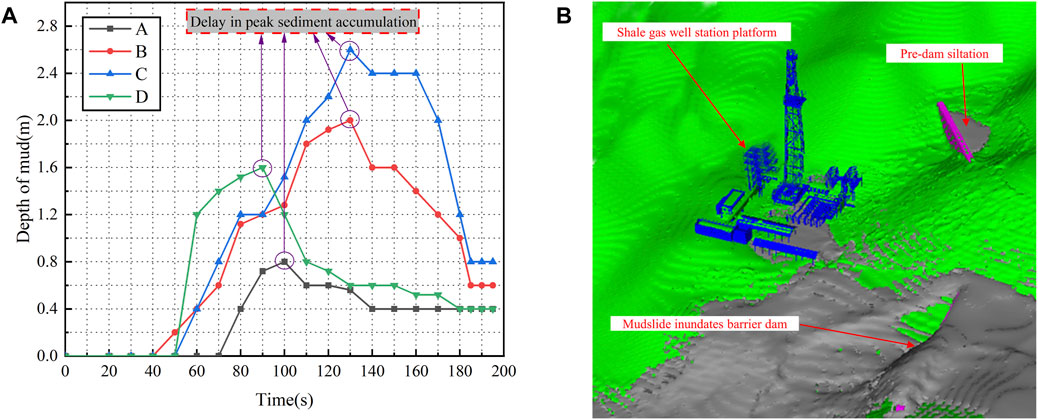
FIGURE 8. Mud depth at 8 m dam well station monitoring point and clogging effect. (A) Curve of mud depth change at monitoring point of well station under the action of 8m dam, (B) Sediment retention effect of 8 m dams.
At measuring point A, the mudflow reached the location at the 80th second. The water level rose rapidly, and the siltation height peaked at 0.72 m by the 100th second. Subsequently, the sediment siltation height gradually decreased and stabilized at 0.4 m.
Measuring point B experienced mudflow scouring starting from the 50th second. The sediment siltation height reached 4 m by the 120th second. Afterward, the mudflow depth slowly decreased and remained steady at 0.6 m by the 185th second.
Measuring point C reached its maximum sediment accumulation height of 2.6 m in the 130s. It then experienced a slight decrease in depth, rapidly dropping to 0.4 m by the 150th second. The depth remained stable thereafter.
Measuring point D exhibited a similar sediment distribution pattern to point C. The sediment depth reached a maximum of 1.6 m by the 90th second. It then rapidly decreased for a certain period of time, eventually stabilizing and decreasing slowly without further significant changes.
After the aforementioned stabilization periods, the mudflow depth continued to decrease gradually until no further changes were observed.
The numerical simulation of the mudflow inundation depth at the well station of the 8-m debris flow blocking dam was analyzed by considering the time as the zero moment from the occurrence of the tailings pond failure (T = 0 s). The results of the analysis are presented in Table 4.
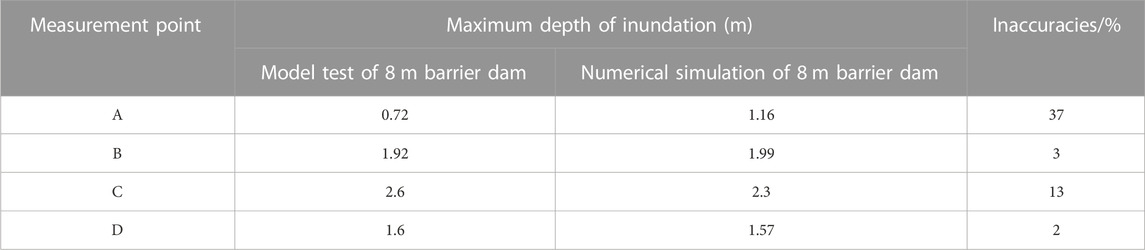
TABLE 4. Comparison of maximum inundation depth results for numerical simulations and model tests at characteristic moments.
The table shows the errors in the numerical simulation of the highest inundation depths, expressed as percentages. The errors were found to be 37%, 3%, 13%, and 2% for each respective measurement point. These errors indicate the deviation between the experimental and simulated results. However, overall, the similarity between the experimental and simulation results was good.
Table 5 presents a comparison of the time taken for the mudflow to reach the measurement point of the well station in two scenarios: without a debris flow blocking dam (no dam) and with a 16-m debris flow blocking dam. However, no data were collected at measurement point D because no mudflow overflow was observed at that location after increasing the height of the debris flow blocking dam.
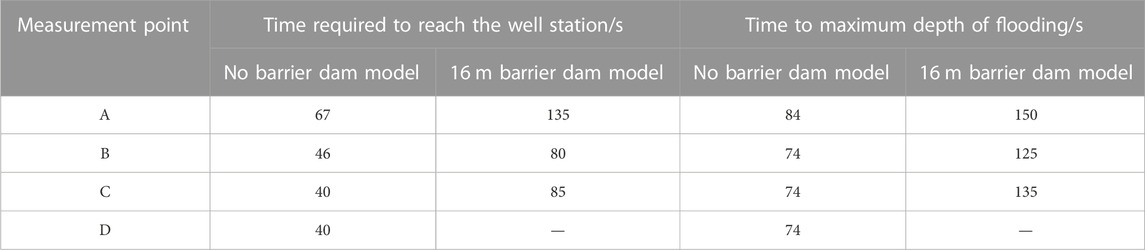
TABLE 5. Comparison of the time for the mudflow to reach the key measurement point at the well station in the two models.
After raising the dam height to 16 m, the dam’s effect becomes more significant. In terms of the time taken for the mudflow to reach the downstream well station, there is a difference between the no dam mode and the 16-m dam mode. The time differences between these two modes are 68, 34, and 45 s for each respective measurement point.
It can be observed that as the dam height increases, the time required for the mudflow to reach the same measuring point at the downstream well station and the maximum inundation depth at that point also increase. Additionally, the maximum siltation height decreases.
This phenomenon can be attributed to several factors. After the mudflow passes through the debris flow blocking dam, the velocity of the flow decreases, resulting in a reduction in mud content and sediment volume. Consequently, at the same measurement point downstream, the volume of sediment decreases.
Figure 9 illustrates the relationship between mud depth and time at the monitoring point of the well station with a 16-m debris flow blocking dam. The following observations can be made based on the figure:
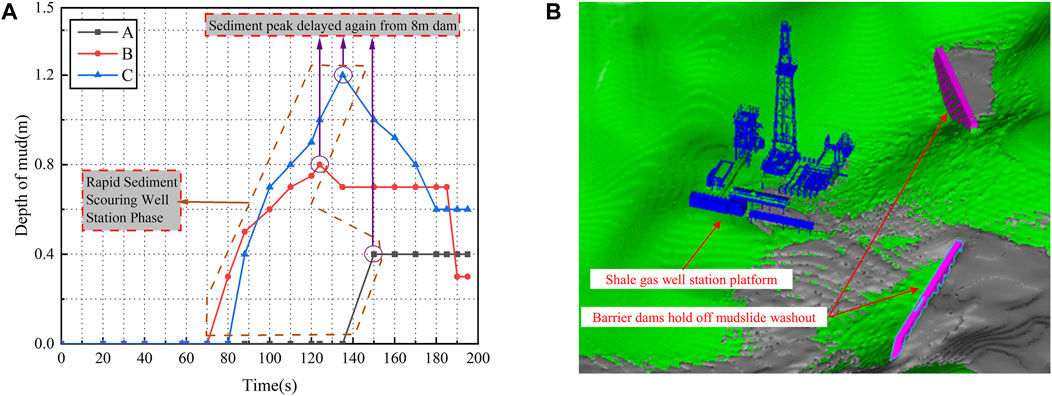
FIGURE 9. Mud depth at 16 m dam well station monitoring point and clogging effect. (A) Curve of mud depth change at monitoring point of well station under the action of 16 m dam, (B) Sediment retention effect of 16 m dams.
The mudflow reached the A measuring point at the 135th second after the initiation of mudflow discharge. Subsequently, the height of sediment deposition remained constant at 0.4 m until the movement ceased.
In comparison to the scenario without a dam, the mud depth at the well station measuring point exhibits a smoother trend after the 16-m debris flow blocking dam is set. This can be attributed to the longer and more gradual movement of the mudflow after it reaches the well station. The presence of the debris flow blocking dam slows down the forward motion of the mudflow, causing a delay in the peak sediment depth. As the mudflow progresses, the sediment depth gradually decreases and eventually stabilizes.
The arrangement of a barrier dam downstream of the tailings storage in the canyon has a significant protective effect on the well station area. By implementing an appropriate blocking method, the damage caused by the mudflow to the well station area can be effectively prevented. This approach maximizes the protection of well station facilities and equipment.
The numerical simulation analysis of the debris flow inundation depth at the well station of the 16-m debris flow blocking dam was performed with the time recorded as 0 s from the start of the downward discharge of the outburst debris flow (T = 0 s).
Table 6 presents the results of the numerical simulation, indicating the errors in the highest inundation depth as a percentage for each measurement point. The errors are found to be 25%, 26%, 34%, and 2% for the respective measurement points. These error values help validate the conclusions drawn from the model test, demonstrating the effectiveness of the numerical simulation.

TABLE 6. Comparison of maximum inundation depth results for numerical simulations and model tests at characteristic moments.
This study centers on a shale gas well station situated in Chongqing, with the primary objective of investigating the effects of mudflow on the well station during a transient full depression event in an upstream tailings pond. To achieve this objective, a series of mudflow impact tests were conducted on the well station. Furthermore, computational fluid dynamics (CFD) methods were employed to perform numerical calculations at a 1:1 scale, simulating the scenario. The simulation results were subsequently validated by comparing them with the results obtained from the physical model tests. The key findings derived from this study are as follows.
(1) The scouring process induced by mudslides can be classified into three distinct phases: a rapid growth phase (0–60 s), a steady growth phase (60–106 s), and a slow advance phase (106–250 s). The variation in mud depth at the shale gas well station exhibited an initial rapid increase, followed by a gradual decrease, ultimately reaching a stabilized state. The highest recorded siltation heights at the four measuring points (A, B, C, and D) were 4.4, 4, 5.2, and 6 m, respectively.
(2) Gravity debris flow dam exhibit notable effectiveness in reducing the scouring depth and inundation range caused by mudslides on the platform of the well station. Consequently, the effects of an 8 m debris flow blocking dam and a 16 m blocking dam were examined and compared. The experimental findings clearly demonstrated that, at measurement point A, the 16 m blocking dam effectively prolonged the mudflow scouring by 53 s in comparison to the 8 m blocking dam. Moreover, the peak sediment siltation height at this particular point was reduced by 0.32 m. These results highlight the superior performance of the 16 m blocking dam compared to the 8 m blocking dam in terms of delaying mudflow scouring.
(3) Through a comparative analysis of the model test and numerical simulation, conclusions regarding the evolution pattern, inundation range, and depth of the mudflow impact on the oil and gas well station were drawn. The study reveals that the numerical simulation results for the highest sediment deposition height of the 8 m check dam deviated by 0.07 m from the test conclusion, while the highest sediment deposition height of the 16 m check dam differed by 0.29 m from the test conclusion. The calculated error falls within an acceptable range, indicating that both testing methods effectively capture the response characteristics of the shale gas well station to the mudflow impact.
The original contributions presented in the study are included in the article/Supplementary Material, further inquiries can be directed to the corresponding author.
MC: Conceptualization, Validation, Writing–review and editing. JM: Writing–original draft, Writing–review and editing. YL: Conceptualization, Writing–review and editing. XJ: Methodology, Writing–original draft.
The author(s) declare financial support was received for the research, authorship, and/or publication of this article. This research was funded by the National Natural Science Foundation of China (No. 51974051; No. 51804051) and Supported by Major Project of Science and Technology Research Program of Chongqing Education Commission of China (KJZD-K202301506).
Author MC was employed by Chongqing Safety Science and Technology Co., Ltd. Author YL was employed by Sichuan Shale Gas Exploration and Development Limited Company.
The remaining authors declare that the research was conducted in the absence of any commercial or financial relationships that could be construed as a potential conflict of interest.
All claims expressed in this article are solely those of the authors and do not necessarily represent those of their affiliated organizations, or those of the publisher, the editors and the reviewers. Any product that may be evaluated in this article, or claim that may be made by its manufacturer, is not guaranteed or endorsed by the publisher.
Banihabib, M., and Forghani, A. (2017). An assessment framework for the mitigation effects of check dams on debris flow. Catena 152, 277–284. doi:10.1016/j.catena.2017.01.018
Carmo, F., Kamino, L., Junior, R., De Campos, I., Carmo, F. F., Silvino, G., et al. (2017). Fundão tailings dam failures: the environment tragedy of the largest technological disaster of Brazilian mining in global context. Perspect. Ecol. conservation 15 (3), 145–151. doi:10.1016/j.pecon.2017.06.002
Chen, M., Jing, X., Liu, X., Huang, X., and Nie, W. (2022). Multiscale investigations of overtopping erosion in reinforced tailings dam induced by mud-water mixture over-flow. Geofluids 2022, 1–12. doi:10.1155/2022/7209176
Chen, M., Jing, X., Xie, D., Li, X., Zhang, Y., and Liu, X. (2023). Prediction model investigations of the reinforced fine-grained tailings dam overtopping failure. Front. Earth Sci. 2023 (10), 1–9. doi:10.3389/feart.2022.1075588
Concha, L., and Lall, U. (2018). Tailings dams failures: updated statistical model for discharge volume and runout. Environ 5 (2), 1–10. doi:10.3390/environments5020028
Cristo, C., Fecarotta, O., Iervolino, M., and Vacca, A. (2022). Impact dynamics of mud flows against rigid walls. J. Hydrology 612, 1–10. doi:10.1016/j.jhydrol.2022.128221
Dong, D., Zou, C., Yang, H., Wang, Y., Li, X., and Chen, G. (2012). Progress and prospects of shale gas exploration and development in China. ActaPetroleiSinica 33 (s1), 107–114. doi:10.7623/syxb2012S1013
Ghahramani, N., Mitchell, A., Rana, N., McDougall, S., Evans, S., and Take, W. (2020). Tailings-flow runout analysis: examining the applicability of a semi-physical area–volume relationship using a novel database. Nat. Hazards Earth Syst. Sci. 20 (12), 3425–3438. doi:10.5194/nhess-20-3425-2020
Jiang, J., Xu, X., Wang, J., Yang, S., and Zhang, Y. (2007). Investigation of basic properties of fly ash from urban waste incinerators in China. J. Environ. Sci. 19 (4), 458–463. doi:10.1016/S1001-0742(07)60076-X
Jing, X., Chen, Y., Williams, D., Serna, M., and Zheng, H. (2019a). Overtopping failure of a reinforced tailings dam:laboratory investigation and forecasting model of dam failure. Water 11 (2), 315–330. doi:10.3390/w11020315
Jing, X., Chen, Y., Xie, D., Williams, D., Wu, S., Wang, W., et al. (2019b). The effect of grain size on the hydrodynamics of mudflow surge from a tailings dam-break. Appl. Sci. 9 (12), 2474–2479. doi:10.3390/app9122474
Li, Q., Zhang, H., Wei, J., and Zhao, Z. (2022). Numerical simulation on the evolution of tailings pond dam failure based on GDEM method. Front. Earth Sci. 10, 1–12. doi:10.3389/feart.2022.901904
Li, S., Yuan, L., Yang, H., An, H., and Wang, G. (2020). Tailings dam safety monitoring and early warning based on spatial evolution process of mud-sand flow. Saf. Sci. 124, 104579–9. doi:10.1016/j.ssci.2019.104579
Pirulli, M., Barbero, M., Marchelli, M., and Scavia, C. (2017). The failure of the Stava Valley tailings dams (Northern Italy): numerical analysis of the flow dynamics and rheological properties. Geoenvironmental Disasters 4, 3–15. doi:10.1186/s40677-016-0066-5
Wang, G., Kang, J., Du, C., Tang, Y., and Kong, X. (2017). Study on tailings dam over-topping failure model test and break mechanism under the rainfall condition. Teh. Vjesn. 24 (6), 1897–1904. doi:10.17559/TV-20170619031221
Wang, G., Tian, S., Hu, B., Chen, J., and Kong, X. (2021). Regional hazard degree evaluation and prediction for disaster induced by discharged tailings flow from dam failure. Geotechnical Geol. Eng. 39, 2051–2063. doi:10.1007/s10706-020-01606-w
Wang, G., Tian, S., Hu, B., Xu, Z., Chen, J., and Kong, X. (2019). Evolution pattern of tailings flow from dam failure and the buffering effect of debris blocking dams. Water 11 (11), 2388–2413. doi:10.3390/w11112388
Wang, G., Zhao, B., Lan, R., Liu, D., Wu, B. S., Li, Y. J., et al. (2022). Experimental study on failure model of tailing dam overtopping under heavy rainfall. Lithosphere 2022, 1–14. doi:10.2113/2022/5922501
Wang, K., Yang, P., Hudson-Edwards, K., Lyu, W., Yang, C., and Jing, X. (2018). Integration of DSM and SPH to model tailings dam failure run-out slurry routing across 3D real terrain. Water 10 (8), 1087–1115. doi:10.3390/w10081087
Wei, Y., Xu, K., Xiong, L., and Li, M. (2017). Model experiment research on flow characteristcs and regularity of tailing flow due to tailings dam-break. China Saf. Sci. J. 27 (4), 122–126. doi:10.16265/j.cnki.issn1003-3033.2017.04.022
Wu, T., and Qin, J. (2018). Experimental study of a tailings impoundment dam failure due to overtopping. Mine Water Environ. 37 (2), 272–280. doi:10.1007/s10230-018-0529-x
Yu, D., Tang, L., and Chen, C. (2020). Three-dimensional numerical simulation of mud flow from a tailing dam failure across complex terrain. Nat. Hazards Earth Syst. Sci. 20 (3), 727–741. doi:10.5194/nhess-20-727-2020
Yu, D., Tang, L., Ye, F., and Chen, C. (2021). A virtual geographic environment for dynamic simulation and analysis of tailings dam failure. Int. J. Digital Earth 14 (9), 1194–1212. doi:10.1080/17538947.2021.1945151
Yuan, L., Zhu, N., Li, S., and Chen, Y. (2016). Three-dimensional numerical modeling study on the failure evolution of tailing dam. J. Comput. Theor. Nanosci. 13 (4), 2300–2305. doi:10.1166/jctn.2016.4577
Keywords: shale gas well station, tailings dam break, debris flow, dynamic submerged process, shock response law
Citation: Chen M, Mao J, Li Y and Jing X (2023) Study on the impact of debris flow from tailings dam failure on shale gas well station. Front. Earth Sci. 11:1297133. doi: 10.3389/feart.2023.1297133
Received: 19 September 2023; Accepted: 03 November 2023;
Published: 27 December 2023.
Edited by:
Faming Huang, Nanchang University, ChinaReviewed by:
Deshan Cui, China University of Geosciences Wuhan, ChinaCopyright © 2023 Chen, Mao, Li and Jing. This is an open-access article distributed under the terms of the Creative Commons Attribution License (CC BY). The use, distribution or reproduction in other forums is permitted, provided the original author(s) and the copyright owner(s) are credited and that the original publication in this journal is cited, in accordance with accepted academic practice. No use, distribution or reproduction is permitted which does not comply with these terms.
*Correspondence: Jingxin Mao, jxMao_7476@163.com
Disclaimer: All claims expressed in this article are solely those of the authors and do not necessarily represent those of their affiliated organizations, or those of the publisher, the editors and the reviewers. Any product that may be evaluated in this article or claim that may be made by its manufacturer is not guaranteed or endorsed by the publisher.
Research integrity at Frontiers
Learn more about the work of our research integrity team to safeguard the quality of each article we publish.