 Yuanxiang Yang
 Yuguang Zhang1*
- 1Guizhou Transportation Planning Survey and Design Academe Co, Ltd., Guiyang, China
- 2School of Civil and Resource Engineering, University of Science and Technology Beijing, Beijing, China
High-altitude rockfalls, as one of the major geological disasters in mountains, is highly concerned about the study of failure mechanisms and disaster prevention and mitigation. In August 2020, the Babaoshan cliff in Yanhe County, Guizhou collapsed and falling rocks hit agricultural vehicles on the road and damaged residents’ houses below. Based on on-site investigation, three rockfall types of tension-rotating, tension-shear-falling, compression-shear exist in the study area, and the compression-shear rockfall can conform to the chain law of rockfall. The paper used the dynamic analysis software Rocpro-3D to simulate and invert the movement characteristics and impact range of rockfall at Babaoshan cliff. The results show that: 1) the hazardous zone, which is about 95 m wide and 175 m long, was formed by the rockfall at R1 and covered localized roads and houses below, with the covered probability of 20%, 17% respectively; 2) the terrains on the rockfall paths in two rockfall disaster events are mainly characterized by stepped shape and overall flat angle respectively, and the behaviors are mainly characterized by ejection and rolling respectively, meanwhile, the times to reach the road and houses were 17 s and 24.3 s, respectively, in addition, the protruding rock mass below the rockfall location gives the falling rock horizontal velocity and good movement space, which will make the falling rock move further away; 3) the different rockfall directions reflect different terrain combinations, simulation inversions reveal that different terrain combinations have significant control over the distance and shape of the rockfall trajectories. And, it was found that the more times a falling rock is rebounded, the greater the energy obtained; 4) the probabilities of falling rocks at H1, H2, H3 invading residential areas are respectively 8.67%, 20%, 19.33%, meanwhile invading road zone are respectively 10.67%, 15.33%, 9.33%. At least one point or several points stopped within the zone of the affected houses in the rockfall disaster event 2 in three prediction of the rockfall impact range, which indicates that there is a great risk that this house will continue to be affected by disasters after rockfalls occur within the steep cliff area above.
1 Introduction
High-altitude rockfalls are common geo-hazards in canyon areas. It is a dynamic geological process in which high-altitude unstable rock masses suddenly detach from cliff through sliding, toppling, falling, or other failure modes due to gravity, earthquake or construction, and then rolling, jumping, sliding along the slope, finally stoping and accumulating at the slope toe (Hungr et al., 2014; Shen et al., 2020). Due to its wide distribution, high burstiness and serious destructiveness, it has become another major mountain geological hazard after landslide, debris flow, etc. (Zhang and Yang, 2004; Pei et al., 2011; Crosta et al., 2015; Asteriou and Tsiambaos, 2016; Han et al., 2017; Feng et al., 2023). The canyon areas in southwest China (include Yunnan Province, Guizhou Province, Sichuan Province, Tibet and Chongqing City) are characterized by high-steep terrains, complex rockmass structures, intense seismotectonics activities, frequent rainfalls and seasonal freezing-thawings, which lead to frequent occurrence of rockfalls (Chen et al., 2016; Luo et al., 2022). Falling rocks can destroy roads, houses, and other structures through impacting, smashing and burialing, which causing significant casualties and economic losses. For example, on 25 July 2009, the 8# pier of Chediguan bridge in the Dujiangyan-Wenchuan Highway was smashed and broken by a boulder, resulting in 3 deaths, 12 injuries, and 7 vehicle damage (He et al., 2013). Another example, on 7 September 2012, a 5.7 magnitude earthquake occurred in Yiliang County, Yunnan Province, which triggering multiple and multi-scale rockfall disasters, resulting in many residents being hit and killed by rolling stones (Wang et al., 2013). Extensive researches have been conducted on the rockfall hazards prevention and mitigation. These researches mainly focus on the early identification (Li et al., 2019; Xu et al., 2019; Dong et al., 2020; Xu, 2020), influencing factors and failure mechanisms (Zheng et al., 2016; Pan et al., 2017; Chen and Qin, 2020), movement trajectory simulation (Li et al., 2022), collision and disintegration theory (Hu et al., 2019), structure dynamic response (Shen et al., 2020), stability and risk assessment (Pappalardo et al., 2014), and disaster prevention and mitigation measures (Zhang et al., 2017). Xu et al. (2019) believe that the evolution processes of rockfalls in the canyon areas are most closely related to geological structures. Firstly, the formation and evolution of terrains are strictly constrained by geological structures, on the other hand, the degree of weathering, unloading and failure modes of rockmass depend on the discontinuous planes formed by geological structure and gravity deformation (Wang et al., 2020). In recent years, scholars have revealed the failure mechanisms from the perspectives of damage mechanics and fracture mechanics, believing that it is a mechanical process about rock damage, deformation and failure, consisting of secondary crack propagation, primary discontinuities shearing, and rock bridge brittle shearing. Moreover, the existence of rock bridges has significantly changed the stress and failure characteristics of the rockmass, leading to stress concentration at the end of the structural plane (Liang et al., 2014). The movement trajectories of rockfalls are extremely important for predicting the hazard range caused by collapse and selecting the location and layout of blocking engineering. Huang et al. (2009a), Ye et al. (2011) conducted experiments to simulate the influence of terrain on the movement of falling rocks, and found that micro landforms (slopes, platforms, ridges, valleys, and scarps) significantly affect the movement modes of falling rocks, the distribution of translational and rotational energy during motion, and the trajectory deviation after collision with the ground.
In August 2020, the Babaoshan cliff in Yanhe County, Guizhou, collapsed and falling rocks invaded residential areas, seriously affecting residents and buildings, but the movement characteristics and hazardous zone of the high-altitude rockfall in Babao mountain is unclear. In order to carry out disaster prevention and mitigation more accurately, the kinetic behaviors and characteristics of rockfall in the study area need to be revealed. At present, in the studies of rockfall kinematic, Rocfall software is mostly used for kinematic calculation. However, only two-dimensional section in a certain direction can be selected as the specific rockfall path, and the rockfall direction is artificially controlled (Li et al., 2022). 3-D simulation software, such as Rocpro 3D, can simulate the kinematic characteristics of rockfalls in 3D space, and based on high-precision DEM models, the results are more in line with reality. Rocpro-3D considered the variations in the shape of falling block, soil characteristics and terrain irregularities by probabilistic approach (RocPro3D, 2014), as a very user-friendly and robust tool to simulate and invert rockfall events (Akin et al., 2021). Therefore, on the basis of on-site investigation, the paper used the dynamic analysis software Rocpro 3D to invert the movement characteristics of rockfall in Babaoshan, and carried out disaster prediction of hidden huzard points, providing a basis for geological hazard risk assessment in the Babaoshan area.
2 Rockfall geological disaster conditions in the study area
2.1 Terrain conditions of rockfall
Babaoshan mountain is located on the west bank of the Wujiang River, the west side of the Yanhe county urban area. The steep cliff connects to the rocky slope. Based on on-site investigation, the gradient of cliff ranges from 70° to 80°, making it the best terrain for rockfall. The rocky slope provides convenient rolling and ejection conditions for rockfalls. In addition, the subtropical monsoon climate prevails in the area, with simultaneous rainfall and heat, abundant rainfalls, dense vegetation, and unstable rocks are very easy to collapse and cause disasters due to rainfall and root splitting. There are three potential collapse points (H1, H2, H3) and a rockfall point on the steep cliff, and there is a cement road on the slope and much of residential buildings in the valley below the slope (Figure 1B). Once a rockfall occurs, falling rocks invade residential areas, seriously affecting residents and buildings.
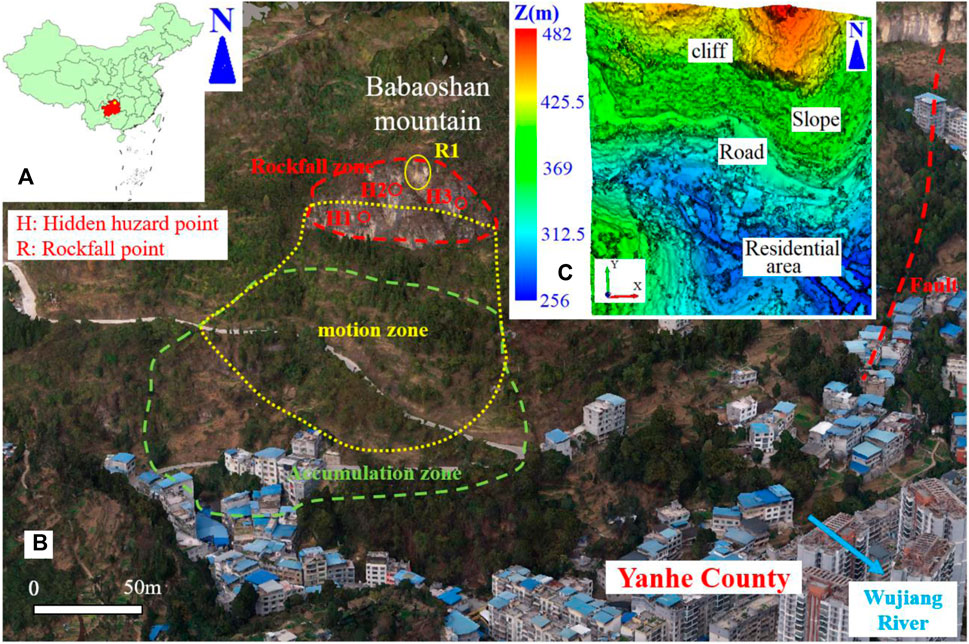
FIGURE 1. Terrain conditions in the study area, (A) administrative map of China, (B) image map of the study area, (C) the digital surface model of the study area.
2.2 Unstable rockmass characteristics
The lithology in the area is Ordovician middle-upper series (O2-3) hard limestone, and the rockmass has poor integrity due to early compression, tension, fault and other tectonic movements, intense rainfall and weathering. There are four groups of joints in the rock masses: joint one (J1): 253°∠70°, joint two (J2): 120° ∠75°, and joint three (J3): 150° ∠80°; joint four (J4): 323°∠15° (Figure 2A). The joint J1 and joint J2 intersect to form an “X” shape, and when combined with the gentle bedding joint J4, the unstable rock can detach from the cliff and form a rockfall disaster. Once subjected to earthquakes, rainfall, or engineering disturbances, the original static equilibrium is broken, and rockfalls are imminent.
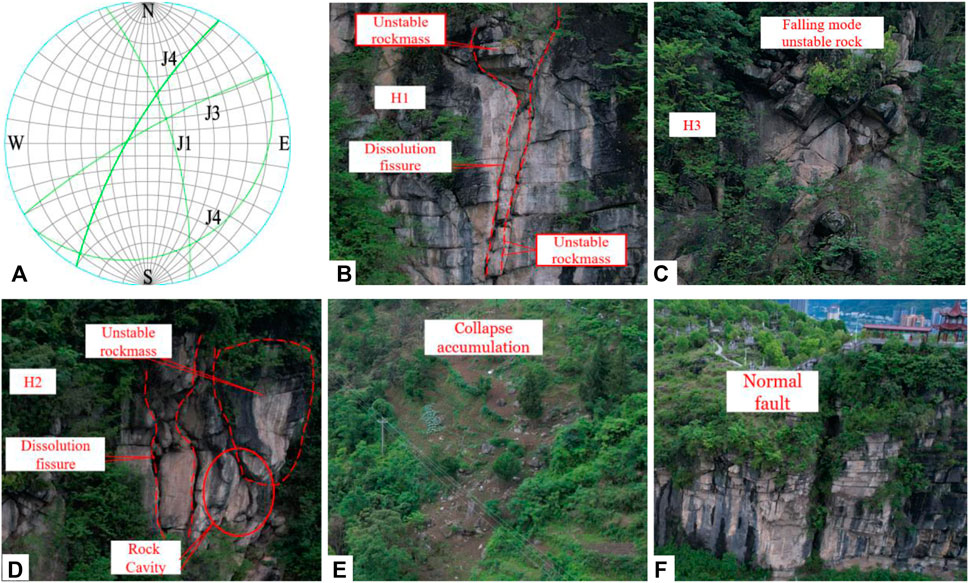
FIGURE 2. Structural characteristics of unstable rockmass in the study area, (A) stereographic projection of the discontinuous surface of the unstable rocks, (B) tension-rotating modal unstable rocks (upper part) and compression-shear modal unstable rocks (lower part) at H1, (C) tension-shear-falling modal unstable rocks at H3, (D) dissolution cracks form independent unstable rocks, and there is rock cavity under large unstable rocks at H2, (E) collapse accumulation zone of falling rocks, (F) normal faults near the study area.
2.3 Rockfall tpyes on the steep cliff
There are three rockfall types on the steep cliff in the study area: tension-rotating, tension-shear-falling, compression-shear. The tension-toppling modal rockfall is characterized by unstable rock and stable mountain is separated by vertical structural plane, and there is grooves at the root of the unstable rock, and unstable rock is creeps, tensions, rotates and falls under their own weight (Figure 2B; Figure 3A). The tension-shear-falling modal rockfall is characterized by that its rear generally have a large angle structural plane, and its top have a nearly horizontal structural plane, and the unstabe rock will fall after breaking contact with the upper and lateral mountain by gravity (Figure 2C; Figure 3B). The compression-shear modal rockfall refers to a type where the lowest rockmass first collapses and causes independent rock blocks stacked solely by gravity above it to collapse gradually after losing their lower support. The prominent feature of this mode is the existence of vertical through joints between the unstable rock masses and the mountain, which cut the outer rock masses from the mountain to form unstable rocks (Figure 2B; Figure 2D; Figure 3C). The unstable rock masses are cut into multiple blocks by horizontal and vertical joints, and the blocks lose contact with each other or have low bonding strength. Stacked together solely by gravity, supported by the rock bridge has not yet been sheared at the root of the rock mass in the lowest layer. Once the rock bridge at the root of the rock masses in the lowest layer undergoes brittle shear failure under the action of gravity on the upper layer, rainwater erosion, seismic force, and unloading fissure water pressure stacked, resulting in the rockfall, the rock masses on the upper layer stacked solely by gravity will gradually collapse after losing its lower support (Figures 3D, E). This type conforms to the chain law of rockfall, and the rockfall at R1 is in this type.
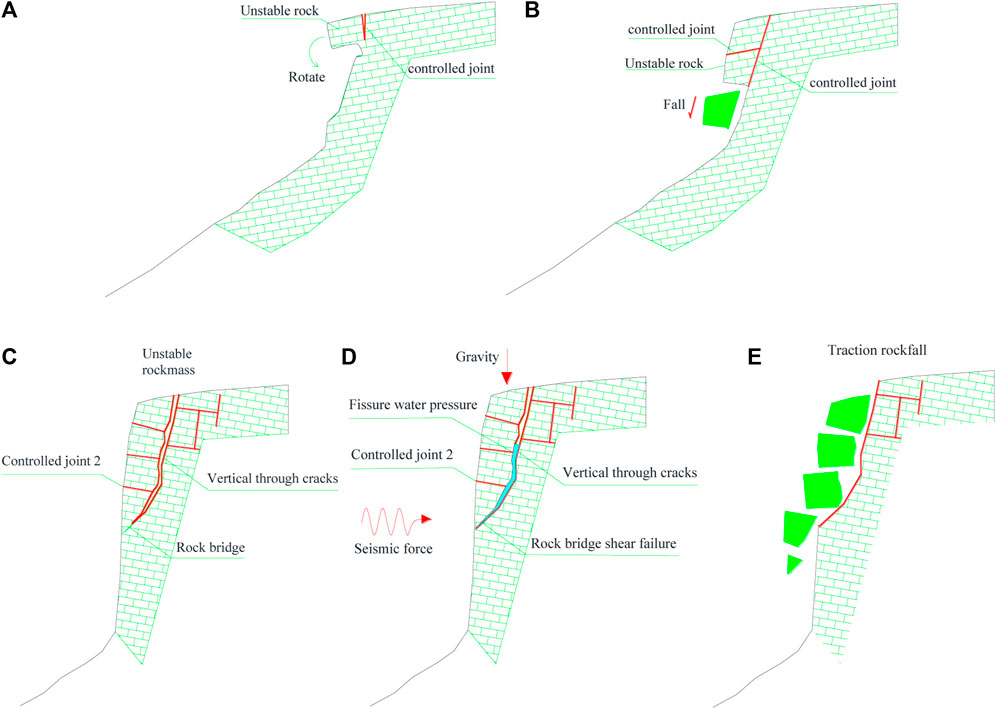
FIGURE 3. Rockfall modes in the study area, (A) tension-rotating mode, (B) tension-shear-falling mode, (C–E) compression-shear mode.
3 Simulation and inversion of rockfall
3.1 Rocpro-3D ballistics theories
The rockfall trajectory is a sequence of oblique throws. The lumped mass theories must know this the position of the rock’s center of mass for a series of successive impacts. Most problems related to the single-point methods due to incorrect path lengths are minimized by offsetting the points to the center mass of the rock projectiles. The velocities of an impact point b are preceded by an impact point a and followed by an impact point c as in Figure 4, which is given by Eqs. 1, 2 as follows:
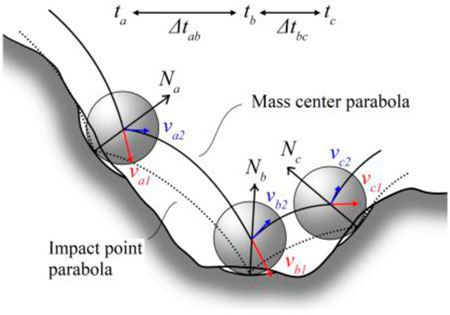
FIGURE 4. Impact configurations for the mass center parabolas.
The total kinetic energy is given by Eq. 3 as follows:
where, m is the mass of the falling rock, v is the velocity of the falling rock, I is the rotational inertia of the falling rock, and
The movement of falling rocks in three-dimensional space may have lateral deviation (Figure 5). Here, the lateral deviation
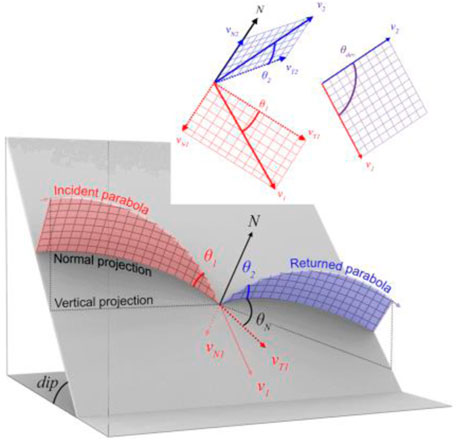
FIGURE 5. Geometric configuration at impact of the velocity vectors and the related angles.
The lateral deviation making
where
3.2 Simulation and inversion of R1 rockfall
3.2.1 3-D rockfall modeling
Rocpro-3D allows the choice of a rigid block to integrate the block mass and rotation in the computation or a lumped-mass formulation. All rockfall computations in this study were executed using the rigid body model. 3-D probabilistic rockfall analyses were carried out using Rocpro-3D on a triangulated irregular network (TIN) constructed by a simplified point cloud data having a resolution of 100 cm due to the triangulation capacity of the rockfall code. The digital surface model of the study area constructed in Rocpro 3D utilizing triangulated irregular network (TIN) is presented in Figure 1C.
The altitude in the study area varies between 256 m and 482 m. The altitude of the unstable hard limestone rockmasses, which constitutes the rockfall source zone and presents a steep topography (>80°), is between 395 m and 482 m. The unstable rocks mostly fall from the upper section of the cliff as seen in Figures 2B–D. It is possible to define different geological units on the digital surface model where rockfall is modeled and dissimilar restitution and friction coefficients can be assigned to different lithological units. In the study area, a total of four main geological units with distinct characteristics were differentiated during field observations. Accordingly, rockfall source zone spreads over between 395 m and 482 m, and the slope surface in this area is mainly manifested as wide unstable hard rocks (zone I). Rockfall movement zone spreads over between 325 m and 395 m, and this area is mainly manifested as highly weathered slope covered with thin soil, excepting for road (zone II). Rockfall accumulation zone spreads over between 256 m and 325 m, and the this area is mainly manifested as brick-concrete structure buildings (zone III). The road zone is made of cement pavement (zone IV). As shown in Figure 6.
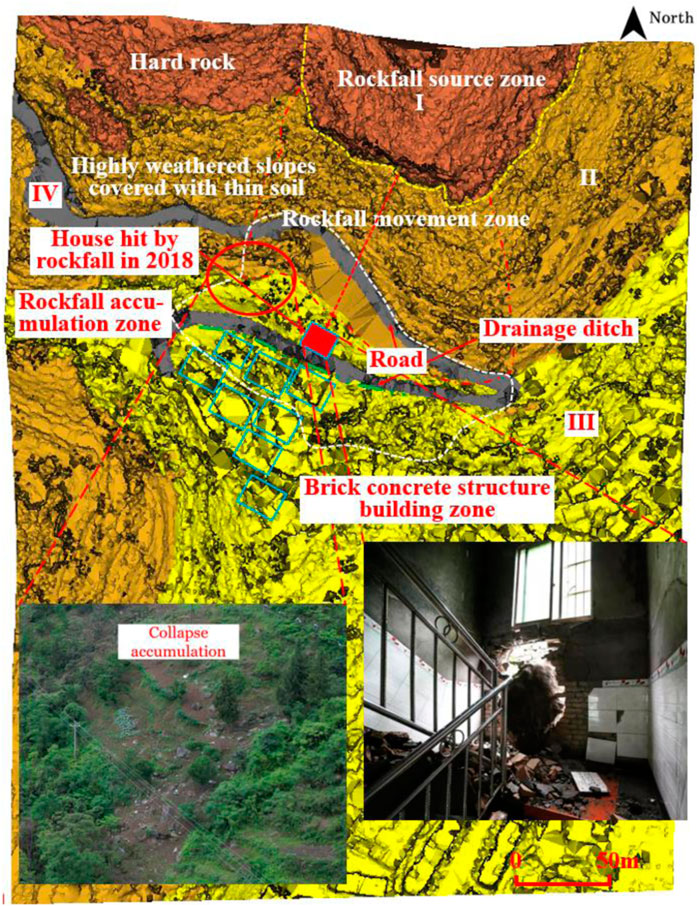
FIGURE 6. Terrain modeling and parameter assignment.
Determine the physical parameters of the unstable rocks in the study area based on the collapse rocks and their shape on site, and take the average value to assign parameters. Falling rocks are defined as a cylinder with a diameter of 1 m and a height of 1m, with the density of 2700 kg/m3. Restitution and friction coefficients considered in 3D rockfall analyses were selected with respect to the back analyses of previously fallen rocks in a close site with similar characteristics (Dinçer et al., 2016). According to the “Specification for Engineering Investigation of Rock Falls and Collapses” (T/CAGHP 011–2020), the range of slope parameters in four zones is determined, and the final slope parameters need to be determined by trial calculation. The results of trial calculation need to be compared with the accumulation and distribution of falling rocks. Eventually, slope parameter values are summarized in Table 1.
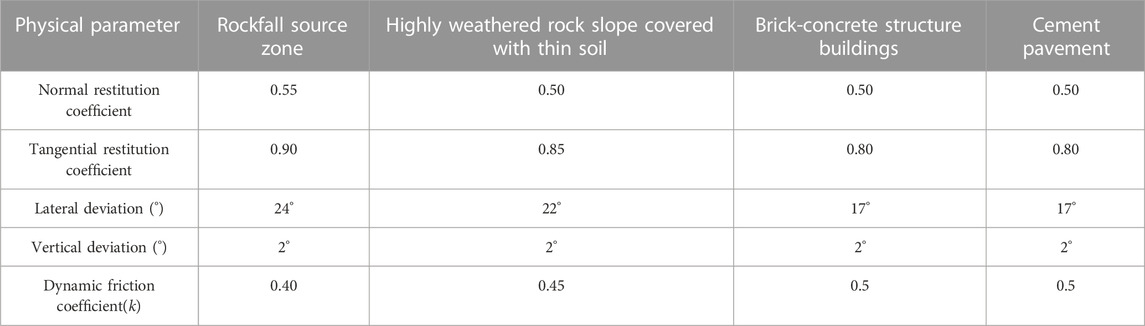
TABLE 1. Physical parameters of slope surface.
3.2.2 Simulation inversion results of R1 rockfall
According to Figure 4, the vertical distance from the center of the falling rock to the slope surface is at least 0.5 m. Based on the above dynamic theories, the simulation results of R1 are shown in Figure 7. The minimum movement distance of the falling rock is 33.14 m, and it stops on the platform under the cliff. The farthest movement distance reaches 174.5 m, and it has already invaded the roads and residential areas (Figure 7A). According to the density map of falling points, the probability of falling rocks stopping in residential areas is about 17%, and the probability of stopping on roads is about 20% (Figure 7B). Although the probability of invading roads and residential areas is not high, it can be fatal if it occurs. The formation of these motion trajectories is the result of a combination of X direction and Y direction motion of the falling rock. Based on simulation inversion, the hazardous zone, which is about 95 m wide and 175 m long, was formed by the R1 rockfall and covered localized roads and houses below (Figure 7A). Based on on-site investigation, the simulation results are relatively close to the actual situation. In a recent on-site investigation, placoid falling stones on the road side and in the drainage ditch in front of residential houses can be discovered, which indicates that after the collapse of the unstable rocks, the roads and residential houses below the cliff inevitably become the targets of attack (Figures 7C, G). The more favorable evidence for the simulation results is that two rockfall disaster events that occurred in the study area in 2020, once was falling rocks hit passing agricultural vehicles, another time is falling rocks damaged residents’ houses (Figures 7D–F). Although two rockfalls did not cause any fatalities, it was sufficient to indicate that the unstable rocks in the study area pose a serious threat to the residents’ lives and travel safety.
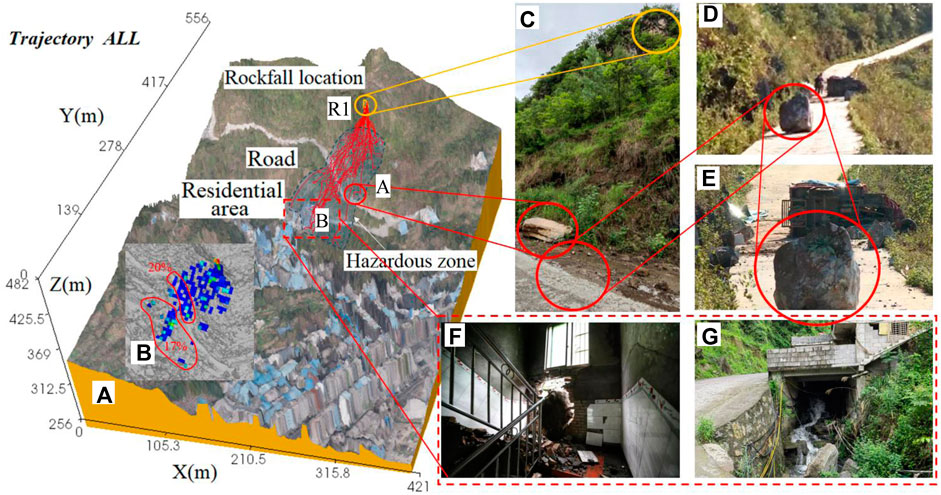
FIGURE 7. Comparison between simulated inversion and actual rockfall events. (A) simulated inversion results by Rocpro 3D; (B) the density map of falling points; (C) placoid falling stones on the roadside; (D), (E) rockfall disaster event 1 that occurred in the study area in 2020: falling rocks hit passing agricultural vehicles on the road; (F) rockfall disaster event 2 that occurred in the study area in 2020: falling rocks damaged residents’ houses; (G) falling rocks in the drainage ditch in front of residential houses.
Based on the energy map, it reflects the movement characteristics of falling rocks in two collapse disasters that occurred in the study area in 2020. Based on observation, it can be observed that the terrain of falling rock in event 1 is mainly characterized by stepped shape, while in event 2, the terrain of falling rock is mainly characterized by overall flat angle (Figure 8). And the behavior of falling rock in event 1 is mainly characterized by ejection, while in event 2, the behavior of falling rock is mainly characterized by rolling. In rockfall event 1, the movement distance of the falling rock was 107.7 m, the time to reach the road was 17 s, and the maximum height from the ground was 23.2 m. In rockfall event 2, the movement distance of the falling rock was 139.2 m, the time to reach the road was 24.3 s, and the maximum height from the ground was 18.3 m.
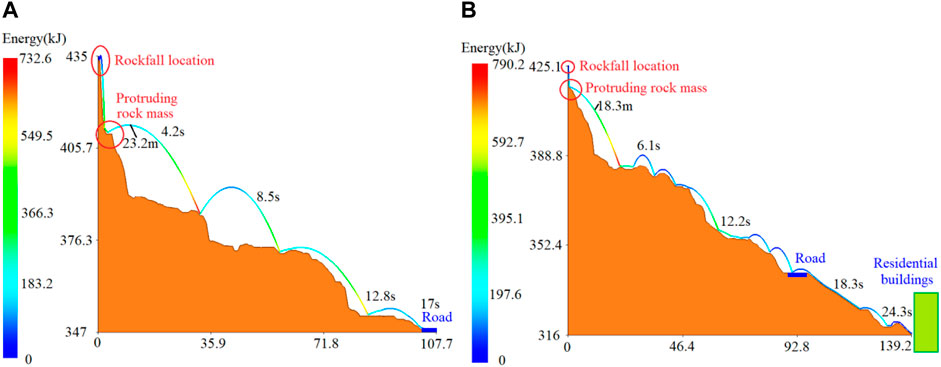
FIGURE 8. Movement trajectories inversion of two rockfall disaster events that occurred in the study area in 2020, (A) rockfall disaster event 1 that occurred in the study area in 2020: falling rocks hit passing agricultural vehicles on the road, (B) rockfall disaster event 2 that occurred in the study area in 2020: falling rocks damaged residents’ houses.
It is also worth mentioning that the protruding rock mass below the rockfall location gives the falling rock horizontal velocity and good movement space, which will make the falling rock move further away. This phenomenon can be explained by using rocfall 2D to perform rockfall calculations on simple terrain. When there is a smooth cliff below the rockfall location and do not have protruding rock mass, falling rocks reach the ground through free fall, as shown in A-type trajectories in Figure 9. But when there is a protruding rock mass below the falling rock, the falling rock rebounds after hitting the protruding rock mass and obtains horizontal acceleration, resulting in a longer movement distance, as shown in the B-type trajectories in Figure 9.
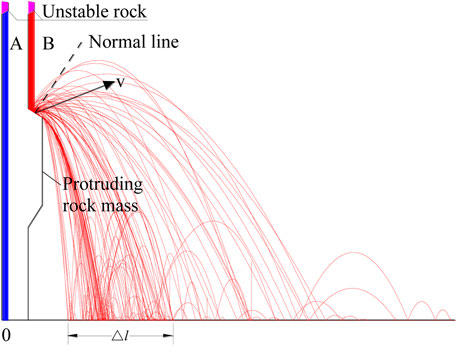
FIGURE 9. The influence of protruding rock mass below the collapse location on the collapse trajectories.
4 Analysis of terrain and rockfall trajectories
From the above analysis, it can be seen that the shape of the trajectory varies depending on the terrain that the rockfall path passes through. The different rockfall directions reflects different terrain combinations, and different terrain combinations form different types of rockfall trajectories. The continuous changes in slope result in different combinations of rolling and ejection. Simulation inversions reveal that different terrain combinations have significant control over the distance and shape of the rockfall trajectories. Several typical rockfall paths are selected for elaboration as follow:
4.1 10#, 11# trajectories and obtuse angle terrain
The 10# trajectory reveals a type of terrain that a steep cliff connects horizontal or approximately horizontal ground with obtuse angle (Figure 10A). The 11# trajectory reveals a type of terrain that a steep cliff connects gentle slope ground with obtuse angle (Figure 10B). The rock in 10# trajectory falls about 37 m from the cliff to the first bounce point and obtains about 625 kJ of kinetic energy. After touching the platform, the kinetic energy is instantly released and lost, with a loss rate of approximately 50%. The severe loss of kinetic energy leads to a decrease in the falling rock speed of forward movement (Figure 10C). The rock in 11# trajectory falls about 35 m from the cliff to the first bounce point, obtaining approximately 620 kJ of kinetic energy, after touching the ground, the falling rock rebounds and is thrown upwards diagonally, with a kinetic energy of approximately 240 kJ (Figure 10D). 10# trajectory indicates that controlled by this cliff connects to platform terrain, there is a relatively high vertical distance from the collapse location to the first bounce point and the relatively large kinetic energy. Affected by the kinetic energy of falling rock and terrain change, the vertical distance from the starting location to the first bounce point (the first bounce distance) is the longest, and the horizontal motion distance from the first bounce point to the second bounce point (the second bounce distance) is the longest (Figure 10C). The terrain overall flat but locally concave and convex is not only cannot continuously supply the kinetic energy of the falling rock, but also hinders their progress, resulting in a shortest movement distance. Huang et al. (2009b) designed a platform resistent effect test, Based on stopping and accumulation effects of experiments of platform on rolling rock blocks, the stopping location and the average resistance coefficient of rock blocks on platform are analyzed by using the multivariate nonlinear regression model. It indicates that platform has a good function to baffle dangerous rock masses movement after falling. Unlike 10# trajectory, although there is a significant loss of kinetic energy, the gentle slope ahead can provide a new drop for the bouncing stone, thereby increasing kinetic energy in 11# trajectory. The increase in kinetic energy and the improvement of spatial conditions make the distance of rockfall longer than that of near right angle terrain. Affected by the kinetic energy of rockfall and terrain changes, there is a longer vertical distance from the collapse location to the first bounce point. From the first bounce point to the second bounce point, and from the second to the third bounce point
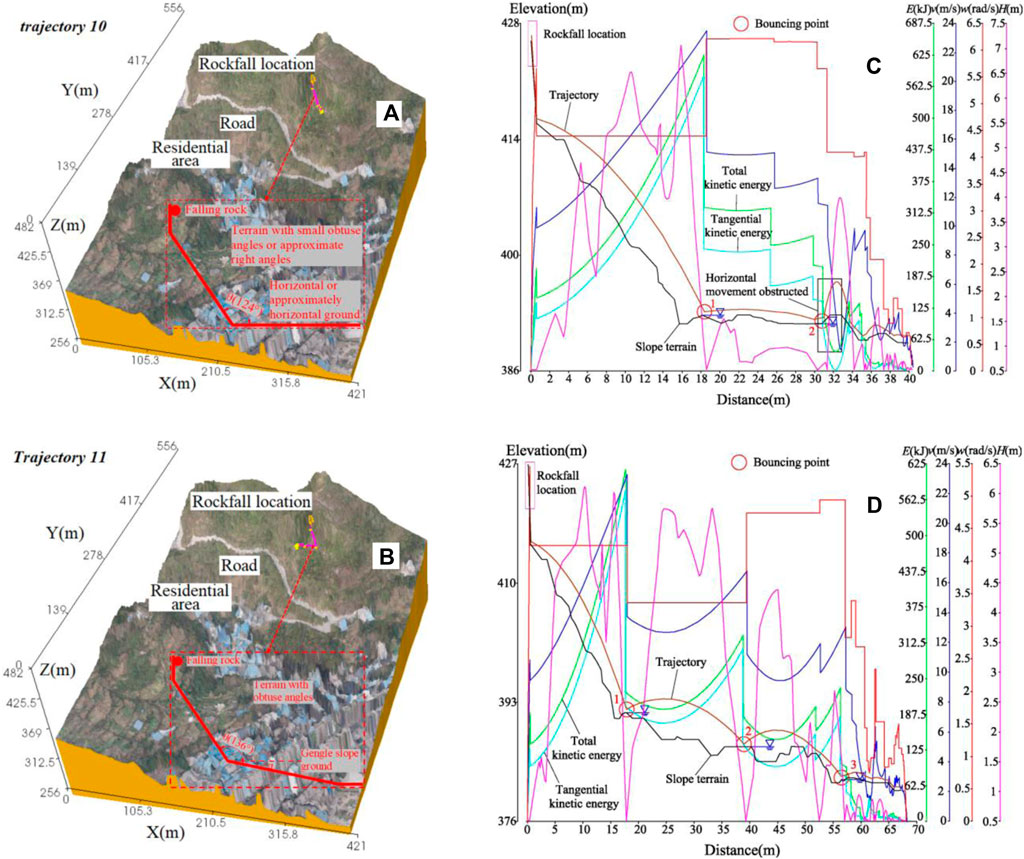
FIGURE 10. 10#, 11# trajectoris and obtuse angles terrain, (A) 10# trajectory, (B) 11# trajectory, (C) kinematic parameters in 10# trajectory, (D) kinematic parameters in 11# trajectory.
4.2 14#, 38# trajectories and overall flat angle terrain
Some terrains can be considered as overall flat angle terrains (Figures 11A, B). These terrain is characterized by low cliffs and little fluctuation in slope surface. Controlled by such nearly flat angle terrain, the kinetic energy after rockfall from a low cliff is not sufficient to cause it to bounce after the first contact with the slope surface. The kinetic energy obtained by the rockfall in 14# and 38# trajectories falling about 20 m from the rockfall location to the first bounce point (low cliff) cannot allow the rockfall to be bounced far enough, resulting in a smaller span between two adjacent bounce points or causing the fall rock to roll directly along the slope (Figures 11C, D). The kinetic energy of a rolling stone can only be provided by the difference between its gravitational component and frictional resistance of the slope surface. Although these terrains can be considered as an overall flat angle terrain, the actual slope surfaces are uneven. In such terrain, if the slope surface is not undulating, the falling stone moves in a rolling manner, and if there are undulations on the slope, the falling rocks move in a span jumping rolling manner, until it stops due to obstruction.
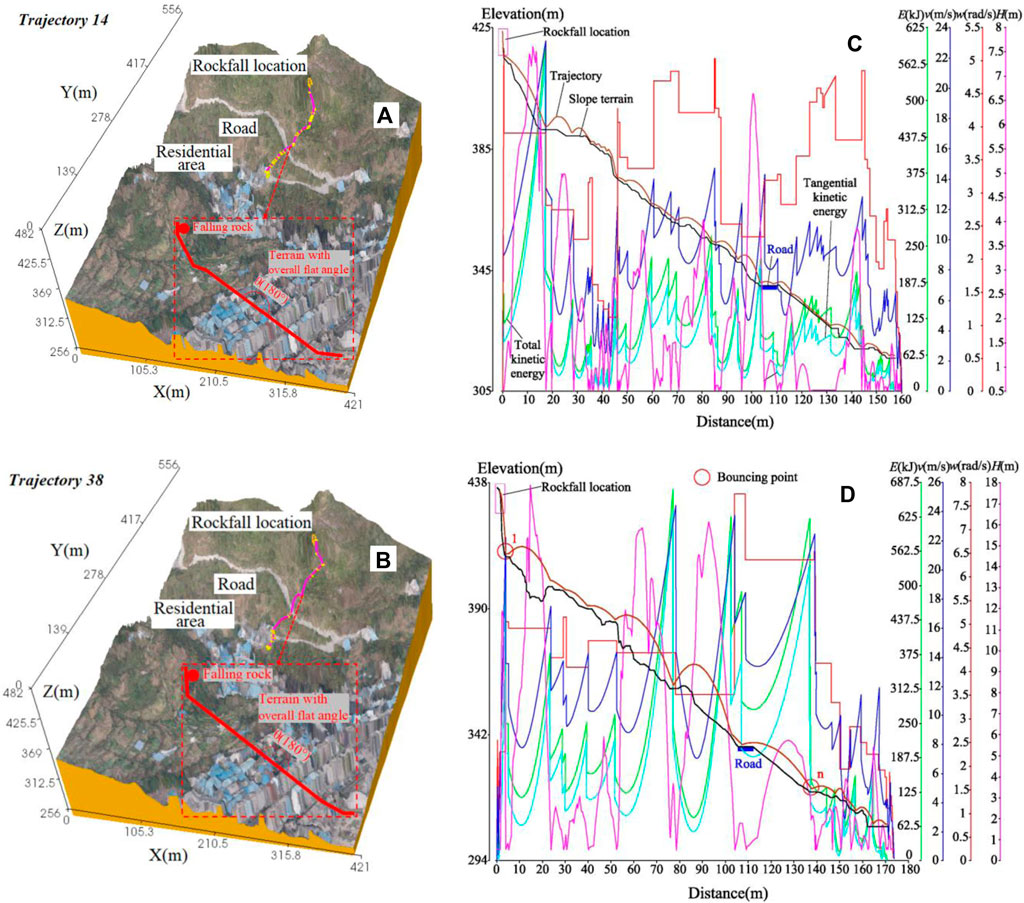
FIGURE 11. 14#, 38# trajectoris and obtuse angles terrain, (A) 14# trajectory, (B) 38# trajectory, (C) kinematic parameters in 14# trajectory, (D) kinematic parameters in 38# trajectory.
4.3 18# trajectory and stepped terrain
There are one or several platforms on the slopes connected by cliff, and the slope toe is a flat, forming a stepped terrain, as shown in Figure 12A. Controlled by such terrain, The form of motion of a rolling stone depends on its collision location: If it falls on a sloping surface, it moves forward with rolling or indefinite span bounce, and If it falls on the platform, it will experience flat or upward oblique throwing motion due to inertia (Figure 12B). Through longitudinal comparison, it was found that the more times a falling stone is rebounded, the greater the energy obtained.
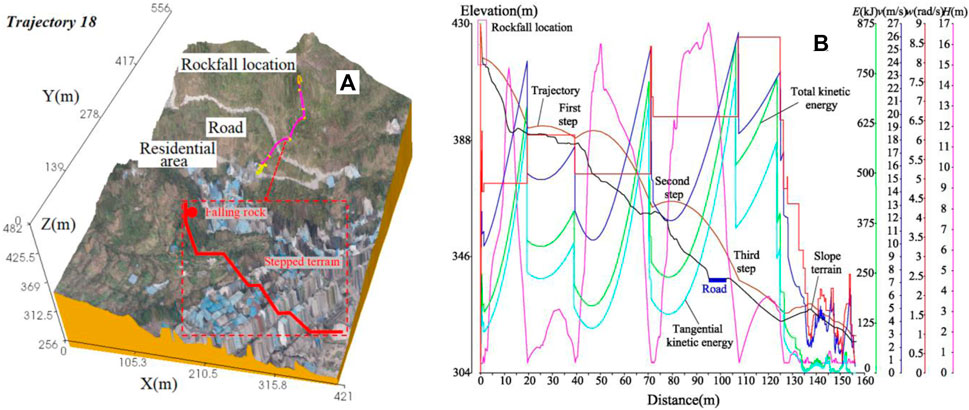
FIGURE 12. 18# trajectoris and obtuse angles terrain, (A) 18# trajectory, (B) kinematic parameters in 18# trajectory.
5 Coverage prediction of hidden huzard points
Apart from R1, there are still three hidden huzard points (H1, H2, H3) that may collapse in the future. Based on the above parameters, the impact range and hazard coefficient of these three hidden huzard points after collapse are predicted, as shown in Figure 13. Set 150 falling points, hidden huzard point 1(H1) after rockfall, the impact range is the widest (Figures 13A–C). Hidden huzard point 1 (H1) after rockfall, there are 13 points stop in the residential area, meanwhile 16 points stop on the road. The probability of falling rocks invading residential areas is 8.67%, meanwhile invading road zone is 10.67%. Hidden huzard point 2 (H2) after rockfall, there are 30 points stop in the residential area, meanwhile 23 points stop on the road. The probability of falling rocks invading residential areas is 20%, meanwhile invading road zone is 15.33%. Hidden huzard point 3 (H3) after rockfall, there are 29 points stop in the residential area, meanwhile 14 points stop on the road. The probability of falling rocks invading residential areas is 19.33%, meanwhile invading road zone is 9.33% (Figures 13D–F). It is worth noting that in the prediction of the rockfall impact range of the three hidden huzard points, at least one point or several points stopped within the zone of the affected houses in the rockfall disaster event 2. This indicates that there is a great risk that this house will continue to be affected by disasters after rockfalls occur within the steep cliff area above. Therefore, it is recommended that in the new round of urban planning and shantytown renovation projects in Yanhe County, the residents in the areas delineated in the figure should be relocated in a timely manner.
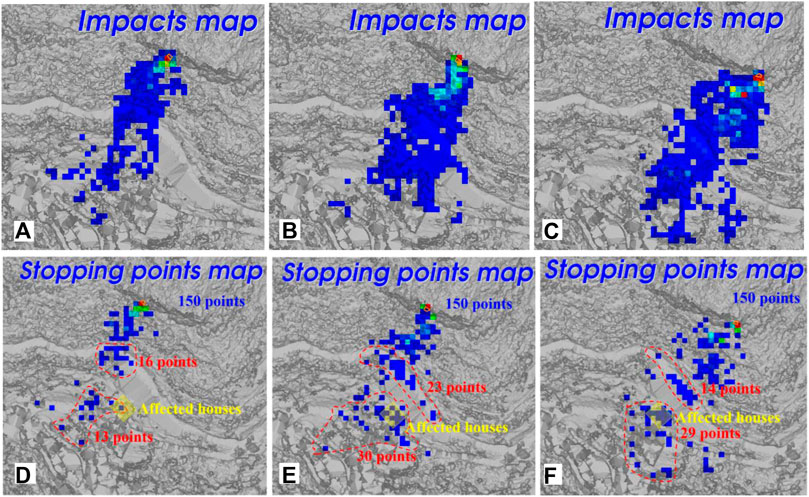
FIGURE 13. A prediction of impact range stopping point location about hidden huzard points, (A) impact range of H1, (B) impact range of H2, (C) impact range of H3, (D) stopping point location of H1, (E) stopping point location of H2, (F) stopping point location of H3.
6 Conclusion
On the basis of on-site investigation, the paper used the dynamic analysis software Rocpro 3D to invert the movement characteristics of falling rocks at the R1 and predict in impact range of hidden huzard points after rockfall in Babaoshan cliff, the main conclusions are as follow:
1) There are three rockfall types in the study area: tension-rotating, tension-shear-falling, compression-shear. Wherein, the compression-shear rockfall refers to a type where the lowest rockmass first collapses and causes independent rock blocks stacked solely by gravity above it to collapse gradually after losing their lower support. This type conforms to the chain law of rockfall, and the rockfall at R1 is in this type. And the collapse geological hazards conditions are very complete, residential areas at the slope toe are dangerous. There were two rockfall disaster events that occurred in the study area in 2020.
2) Based on simulation inversion results, the minimum movement distance of the falling rock is 33.14 m, and it stops on the platform under the cliff. The farthest movement distance reaches 174.5 m The hazardous zone, which is about 95 m wide and 175 m long, was formed by the R1 rockfall and covered localized roads and houses below. The probability of falling rocks stopping in residential areas is about 17%, and the probability of stopping on roads is about 20%. Although the probability of invading roads and residential areas is not high, it can be fatal if it occurs.
3) The terrain of falling rock in event 1 is mainly characterized by stepped shape, while in event 2, overall flat angle. And the behavior of falling rock in event 1 is mainly characterized by ejection, while in event 2, rolling. In rockfall event 1, the movement distance of the falling rock was 107.7 m, the time to reach the road was 17s, and the maximum height from the ground was 23.2 m. In rockfall event 2, the movement distance of the falling rock was 139.2 m, the time to reach the road was 24.3s, and the maximum height from the ground was 18.3 m. It is also worth mentioning that the protruding rock mass below the rockfall location gives the falling rock horizontal velocity and good movement space, which will make the falling rock move further away.
4) The shape of the trajectory varies depending on the terrain that the rockfall path passes through. The different rockfall directions reflects different terrain combinations, and different terrain combinations form different types of rockfall trajectories. The continuous changes in slope result in different combinations of rolling and ejection. Simulation inversions reveal that different terrain combinations have significant control over the distance and shape of the rockfall trajectories. And, it was found that the more times a falling stone is rebounded, the greater the energy obtained.
5) The probability of falling rocks at H1, H2, H3 invading residential areas is respectively 8.67%, 20%, 19.33%, meanwhile invading road zone is respectively 10.67%, 15.33%, 9.33%. It is worth noting that in the prediction of the rockfall impact range of the three hidden huzard points, at least one point or several points stopped within the zone of the affected houses in the rockfall disaster event 2. This indicates that there is a great risk that this house will continue to be affected by disasters after rockfalls occur within the steep cliff area above. Therefore, it is recommended that in the new round of urban planning and shantytown renovation projects in Yanhe County, the residents in the areas delineated in the figure should be relocated in a timely manner.
Data availability statement
The original contributions presented in the study are included in the article/supplementary material, further inquiries can be directed to the corresponding author.
Author contributions
YY: Methodology, Writing–original draft. YZ: Conceptualization, Funding acquisition, Resources, Writing–review and editing. ZT: Validation, Writing–original draft. PL: Validation, Writing–original draft. LQ: Investigation, Writing–original draft.
Funding
The author(s) declare financial support was received for the research, authorship, and/or publication of this article. The research reported in this manuscript is funded by the National Natural Science Foundation of China (Grant No. 42277143).
Conflict of interest
Authors YY, YZ, ZT, and PL were employed by Guizhou Transportation Planning Survey and Design Academe Co, Ltd.
The remaining author declares that the research was conducted in the absence of any commercial or financial relationships that could be construed as a potential conflict of interest.
Publisher’s note
All claims expressed in this article are solely those of the authors and do not necessarily represent those of their affiliated organizations, or those of the publisher, the editors and the reviewers. Any product that may be evaluated in this article, or claim that may be made by its manufacturer, is not guaranteed or endorsed by the publisher.
References
Akin, M., Dinçer, I., Ali Ӧzgün, Ok, Orhan, A., Akin, M. K., and Topal, T. (2021). Assessment of the effectiveness of a rockfall ditch through 3-D probabilistic rockfall simulations and automated image processing. Eng. Geol. 283, 106001. doi:10.1016/j.enggeo.2021.106001
Asteriou, P., and Tsiambaos, G. (2016). Empirical model for predicting rockfall trajectory direction. Rock Mech. Rock Eng. 49 (3), 927–941. doi:10.1007/s00603-015-0798-7
Chen, G., Zhao, C., Liu, H., et al. (2016). Acoustic emission characteristics of rock bridge test under different stress paths. Chin. J. Rock Mech. Eng. 35 (9), 1792–1804. doi:10.13722/j.cnki.jrme.2016.0286
Chen, H., and Qin, X. (2020). Status quo and trend of unstable rock stability analysis. J. chongqing Jiaot. Univ. Sci. 37 (10), 49–60. doi:10.3969/j.issn.1674-0696.2020.10.09
Crosta, G. B., Agliardi, F., Frattini, P., et al. (2015). Key issues in rock fall modeling,Hazard and risk assessment for rockfall protection. Eng. Geol. Soc. Territ. 2, 43–58. doi:10.1007/978-3-319-09057-3.4
Dinçer, İ., Orhan, A., Frattini, P., and Crosta, G. B. (2016). Rockfall at the heritage site of the tatlarin underground city (cappadocia, Turkey). Nat. Hazards 82 (2), 1075–1098. doi:10.1007/s11069-016-2234-z
Dong, X., Xu, Q., She, J., et al. (2020) Preliminary study on interpretation of geological hazards in Jiuzhaigou based on multi⁃source remote sensing data. 45(3): 432–441. doi:10.13203/j.whugis20190076
Feng, G.-L., Yoshida, S., and Lacidogna, G. (2023). Special issue on new advances in acoustic emission and microseismic monitoring technologies in civil engineering. Appl. Sci. 13, 969. doi:10.3390/app13020969
Han, Z., Chen, X., Wang, X., et al. (2017). Risk assessment for luojiaqinggangling rockfall. J. Eng. Geo. 25 (02), 520–530. doi:10.13544/j.cnki.jeg.2017.02.032
He, S., Zhuang, W., Zhang, X., et al. (2013). Research on rockfall impact prevention of Chediguan bridge pier, Duwhen road. Chin. J. Rock Mech. Eng. 32 (S2), 3421–3427.
Hu, X., Mei, X., Yang, Y., et al. (2019). Dynamic response of pile-plate rock retaining wall under impact of rockfall. J. Eng. Geol. 27 (1), 123–133. doi:10.13544/j.cnki.jeg.2019-004
Huang, R., and Liu, W. (2009a). In-situ test sduty of characteristics of rolling rock blocks based on orthogonal design. Chin. J. Rock Mech. Eng. 28 (5), 882–891.
Huang, R., and Liu, W. (2009b). Platform resistent test on rolling rock blocks. Chin. J. Rock Mech. Eng. 28 (3), 516–524.
Hungr, O., Lerousil, S., and Picarelli, L. (2014). The varnes classification of landslide types, an Update. Landslides 11 (2), 167–194. doi:10.1007/s10346-013-0436-y
Li, H., Li, X., Li, W., Zhang, S. l., and Zhou, J. w. (2019). Quantitative assessment for the rockfall hazard in a post-earthquake high rock slope using terrestrial laser scanning. Eng. Geol. 248, 1–13. doi:10.1016/j.enggeo.2018.11.003
Li, Y., He, K., Hu, X., et al. (2022). Formation characteristics and kinematics 3D simulation of rockfall evolved from shattered mountain—case study of Sanguanmiao Village rockfall in Wenchuan County. J. Eng. Geol. 30 (2), 542–552. doi:10.13544/j.cnki.jeg.2021-0014
Liang, Z., Xiao, D., Li, C., et al. (2014). Numerical study on strength and failure modes of rock mass with discontinuous joints. Chin. J. Geotechnical Eng. 36 (11), 2086–2095. doi:10.11779/CJGE201411015
Luo, G., Cheng, Q., Shen, W., Ling, S., Zhang, X., Zou, P., et al. (2022). Research status and development trend of the high-altitude extremely-energetic rockfalls. Earth Sci. 47 (3), 913–934. doi:10.3799/dqkx.2021.133
Pan, X., Sun, H., Wu, Z., and Lü, Q. (2017). Study of the failure mechanism and progressive failure process of intact rock patches of rock slope with weak surfaces. Rock Mech. Rock Eng. 50 (4), 951–966. doi:10.1007/s00603-016-1143-5
Pappalardo, G., Mineo, S., and Rapisarda, F. (2014). Rockfall hazard assessment along a road on the peloritani mountains (Northeastern Sicily, Italy). Nat. Haz⁃ards Earth Syst. Sci. 14 (10), 2735–2748. doi:10.5194/nhess-14-2735-2014
Pei, X., Huang, R., Pei, Z., et al. (2011). Analysis on the movement charateristics of rolling rock on slope caused by intensitive earthquake. J. Eng. Geol. 19 (04), 498–504.
RocPro3D, (2014). RocPro3D software. http://www.rocpro3d.com/rocpro3d_en.php.
Rocscience, (2020). RocFall 6.0 manual- statistical analysis of rockfalls. https://www.rocscience.com/downloads/rocfall/RocFall%20Tutorial.pdf.
Shen, W., Zhao, T., Tang, C., et al. (2020). Loading rate dependency of impact induced rock fragmentation during rockfall. Adv. Eng. Sci. 50 (1), 43–50. doi:10.15961/j.jsuese.201700208
Wang, D., He, S., Ge, S., et al. (2013). Mountain hazards induced by the earthquake of Sep 07, 2012 in Yiliang and the suggestions of disaster reduction. J. Mt. Sci. 31 (1), 101–107.
Wang, Y. F., Cheng, Q. G., Lin, Q. W., Li, K., and Yang, H. F. (2020). Insights into the kinematics and dynamics of the luanshibao rock avalanche (Tibetan plateau, China) based on its complex surface landforms. Geomorphology 317, 170–183. doi:10.1016/j.geomorph.2018.05.025
Xu, Q. (2020). Understanding and consideration of related issues in early identification of potential geohazards. Geomatics Inf. Sci. Wuhan Univ. 45 (11), 1651–1659. doi:10.13203/j.whugis20200043
Xu, Q., Dong, X., and Li, W. (2019). Integrated space-air-ground early detection, monitoring and warning system for potential catastrophic geohazards. Geomatics Inf. Sci. Wuhan Univ. 44 (7), 957–966. doi:10.13203/j.whugis20190088
Ye, S., Chen, H., and Xu, J. (2011). Rockfalls movement mode and movement features by field tests. J. Civ. Archit. Environ. Eng. 33 (2), 957–966.
Zhang, G., Tang, H., Lv, Q., et al. (2017). Research on slope rockfall. Beijing, China: Science Press.
Zhang, L., and Yang, Z. (2004). Risk analysis of encountering rockfalls on a highway—a case study. Chin. J. Rock Mech. Eng. 23 (21), 3700–3708.
Keywords: high-altitude rockfalls, rocpro-3D, movement characteristics, numerical simulation, terrain correlation
Citation: Yang Y, Zhang Y, Teng Z, Liu P and Qiao L (2023) Study on movement characteristics and numerical simulation of high-altitude rockfall in babao mountain in China. Front. Earth Sci. 11:1281364. doi: 10.3389/feart.2023.1281364
Received: 22 August 2023; Accepted: 23 October 2023;
Published: 27 December 2023.
Edited by:
Faming Huang, Nanchang University, ChinaReviewed by:
Wenjing Niu, Guangxi University, ChinaQiu Enxi, Southwest Petroleum University, China
Guo-Feng LIU, Chang’an University, China
Copyright © 2023 Yang, Zhang, Teng, Liu and Qiao. This is an open-access article distributed under the terms of the Creative Commons Attribution License (CC BY). The use, distribution or reproduction in other forums is permitted, provided the original author(s) and the copyright owner(s) are credited and that the original publication in this journal is cited, in accordance with accepted academic practice. No use, distribution or reproduction is permitted which does not comply with these terms.
*Correspondence: Yuanxiang Yang, eWFuZ3l1YW54aWFuZzE5OTVAMTYzLmNvbQ==; Yuguang Zhang, emhhbmd5Z0Bnemp0c2p5LmNvbQ==