 Yuxuan Zhang
 Tianyu Zhang
 Wenqi Shen
 Zijing Ou1
95% of researchers rate our articles as excellent or good
Learn more about the work of our research integrity team to safeguard the quality of each article we publish.
Find out more
ORIGINAL RESEARCH article
Front. Earth Sci. , 27 December 2023
Sec. Geohazards and Georisks
Volume 11 - 2023 | https://doi.org/10.3389/feart.2023.1258524
In the context of global climate warming and rising sea levels, the frequency of tropical cyclones in the South China Sea region has shown a significant upward trend in recent years. Consequently, the coastal areas of the South China Sea are increasingly vulnerable to storm surge disasters induced by typhoon, posing severe challenges to disaster prevention and mitigation in affected cities. Therefore, establishing a multi-indicator assessment system for typhoon storm surges is crucial to provide scientific references for effective defense measures against disasters in the region. This study examines 25 sets of typhoon storm surge data from the South China Sea spanning the years 1989–2020. A comprehensive assessment system was constructed to evaluate the damages caused by storm surges by incorporating the maximum wind speed of typhoons. To reduce redundancy among multiple indicators in the assessment system and enhance the stability and operational efficiency of the storm surge-induced disaster loss model, the entropy method and bootstrap toolbox were employed to process post-disaster data. Furthermore, the genetic simulated annealing algorithm was utilized to optimize a backpropagation neural network intelligent model (GSA-BP), enabling pre-assessment of the risks associated with storm surge disasters induced by typhoon and related economic losses. The results indicate that the GSA-BP model outperforms the genetic algorithm optimized BP model (GA-BP) and the simulated annealing algorithm-optimized BP model (SA-BP) in terms of predicting direct economic losses caused by storm surges. The GSA-BP model exhibits higher prediction accuracy, shorter computation time, and faster convergence speed. It offers a new approach to predicting storm surge losses in coastal cities along the South China Sea.
Typhoon storm surges are characterized by intense atmospheric disturbances, which can induce abnormal water level rise in coastal areas, when combined with other factors, such as climate change-induced rising sea levels. They pose significant threats due to their ferocity, speed, and destructive power (Nicholls, 2004; Mcgranahan et al., 2007), which have been responsible for the most damage in marine disasters (Berz and Islam, 2016; OIbert, A. I et al., 2017). The damages caused by storm surges, including dike breaches, inundation of farmland, loss of fisheries, housing collapses, and destruction of fishing vessels, have a profound impact on the daily lives of coastal residents and the local ecological environment. Coastal nations worldwide have experienced the onslaught of typhoon storm surges, leading to severe consequences in affected regions (Dasgupta et al., 2011). For example, in March 2019, Typhoon IDAI made landfall in the coastal city of Beira in central Mozambique, subsequently affecting neighboring countries, Zimbabwe and Malawi. The storm surge and heavy rainfall brought by typhoon IDAI affected over 3 million people, caused more than 700 deaths, and incurred economic losses exceeding $1 billion in East Africa. In August 2021, Typhoon IDA made landfall in New Orleans, Louisiana, United States, and then continued its path in the southern and northeastern regions of the country, causing disastrous weather conditions, such as strong winds, heavy rain, and storm surges. This typhoon IDA caused at least 88 deaths, impacted millions of people, and resulted in infrastructure damage, widespread power outages, water supply deficiencies, fuel shortages, and economic losses exceeding $95 billion (NOAA, 2022). Against the backdrop of global warming and rising sea levels, the frequency of tropical cyclones is increasing (Singh et al., 2021), which is triggering a growing chain of typhoon storm surge events and escalating risks of associated disasters for countries worldwide. The unique marine conditions in the South China Sea have made it a hotspot for typhoon occurrences and their rapid intensification (Lin et al., 2009; Pan et al., 2017), thereby, increasing the vulnerability of coastal cities in this region. Additionally, the current status of economic development and the diverse economic structures of coastal cities in this region render them more susceptible to disaster-associated risks. Consequently, the assessment of storm surge hazards is of utmost importance for the comprehensive development of coastal cities, particularly in the South China Sea region.
Various methods have been employed to assess losses due to typhoon storm surges, including statistical simulation-based assessments (Shepard et al., 2012; Lin and Shullma, 2017; Hsu et al., 2018), numerical simulation-based assessments (Jelesnianski et al., 1992; Zerger, 2002; Lin et al., 2010; Krien et al., 2013), and machine learning-based assessments (Zhao et al., 2015; Jiang and Liu, 2020); Zhang and Jiang, 2022; Lockwood et al., 2022). Since the establishment of the Sea, Lake, and Overland Surges from Hurricanes (SLOSH) model in the United States in 1992, researchers have shifted their focus toward comprehensive risk assessment of storm surge disasters (Jelesnianski et al., 1992). In 2010, Lin et al. (2010) improved the Advanced Circulation Model for Oceanic, Coastal, and Estuarine Waters (ADCIRC), making it more suitable for evaluating storm surge risks in coastal areas influenced by climate change (Lin et al., 2010). Krien et al. (2013)proposed combining the Simulating Waves Nearshore (SWAN) model with ADCIRC to enhance spatial resolution and assess the typhoon storm surge hazard risks in Martinique, France, at the 2013 European Geosciences Union (EGU) conference (Krien et al., 2013). Gao et al. (2012) utilized storm surge numerical simulation models and techniques, such as inundation analysis and GIS overlay analysis, to produce high-resolution risk zoning maps of storm surge disasters induced by typhoon in the urban area of Taizhou City (Gao et al., 2012). Zhao et al. (2015) proposed a storm surge damage measurement method based on the rough set-support vector machine (RS-SVM) model, which utilized a constructed evaluation index system (Zhao et al., 2015). Ji et al. (2007) introduced a fuzzy comprehensive judgment method for the quantitative assessment of losses due to storm surges (Ji et al., 2007). Overall, previous studies have demonstrated the application of various scientific methods and models in predicting disaster losses due to storm surges. Building upon previous research, this study not only considers the causative factors of typhoon storm surge from the perspective of tidal levels, but also incorporates the relationship between typhoon intensity and wave conditions into the investigation of storm surge causative factors. After conducting a comparative study of multiple intelligent methods, we select the GSA-BP model to assess the direct economic losses caused by storm surges, marking the first application of this model in this field.
Prior to constructing a predictive model for disaster losses due to typhoon storm surges, it is essential to establish an assessment index system for damage caused by storm surges. This study considers four perspectives: causative factors, disaster-prone environment, vulnerability of exposed elements, and disaster prevention and mitigation capabilities; we select 13 disaster loss indicators to establish the assessment index system (see Figure 1).
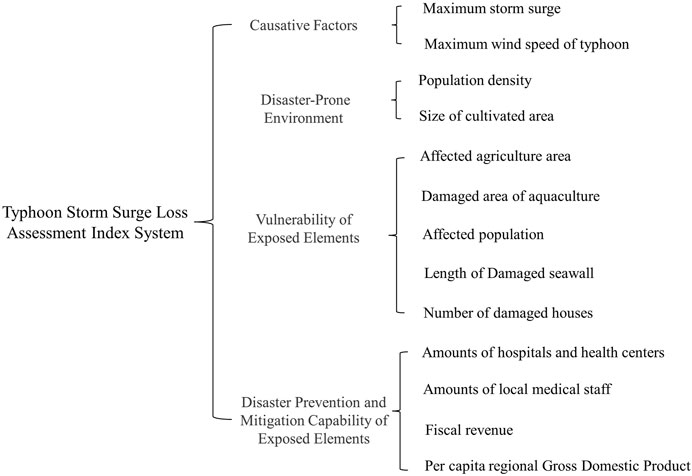
FIGURE 1. Typhoon storm surge loss assessment index system.
Disasters caused by typhoon storm surges can be broadly categorized as generalized or narrow-sense (Liu et al., 2018). The narrow-sense storm surge disasters typically refer to “storm surge”, a natural phenomenon where the sea level undergoes significant abnormal fluctuations due to sudden atmospheric pressure changes. This phenomenon leads to a rapid and substantial increase in tidal levels in coastal areas, surpassing normal levels. Generalized storm surge disasters refer to a process in which various factors, such as astronomical tides, meteorological conditions, strong winds, and cold waves, combine to affect coastal regions, causing significant losses of life and property, while incurring ecological damage. Previous studies have commonly utilized maximum storm surges and exceedance of the warning water levels as indicators of hazardous storm surges. Although these two indicators can directly reflect the sea level and water level changes caused by storm surges, considering only these aspects is not comprehensive enough to assess the severity of natural disasters caused by storm surges. The maximum wind speed of a typhoon is also one of the key factors contributing to the formation of storm surges. Additionally, Wang et al. (2022) discovered a linear relationship between the maximum wind speed of a typhoon, wave height, and storm surge. Specifically, as the maximum wind speed of a typhoon increases, so does the wave height and the impact range of the storm surge. Higher waves lead to rapid rise in water levels and stronger forces of impact, thereby, increasing the destructive potential of storm surges in coastal areas. Therefore, this study selects the maximum storm surge and wind speeds of a typhoon as causative factors in the assessment index system.
The occurrence and severity of storm surge disasters induced by typhoon are not only related to the intensity of the typhoon and astronomical tidal levels in the affected areas, but are also associated with geographical location and coastal characteristics. For instance, the slope and angle of the coastline determine the distance and speed at which the storm surges will penetrate inland. Moreover, coastal topography influences the interaction between storm surges and other hydrological factors, such as tides and waves, which can either amplify or counteract their effects (Phantuwongraj et al., 2013; Du et al., 2015). In the field of natural disaster theory, the disaster-prone environment of storm surges is divided into natural and human-induced factors. When storm surges of the same intensity occur, regions with higher population density and larger agricultural areas are more vulnerable to risks of compromised life safety and economic losses. Therefore, this study selects population density and size of the cultivated area as factors representing the impact of disaster-prone environments in the assessment index system.
The causative factors of natural disasters only lead to actual hazards when they affect exposed elements. Therefore, assessing disaster losses caused by storm surges requires the inclusion of not only causative factors but also the vulnerability of exposed elements (Chang et al., 2023). Storm surge disasters induced by typhoon predominantly occur in coastal areas, affecting five major exposed elements: human populations, fisheries, agriculture, buildings, and infrastructure. Indicators, such as the affected population, the damaged area of aquaculture, the affected agriculture area, the number of damaged houses, and the length of damaged seawalls, directly reflect the vulnerability of these exposed elements to storm surge disasters. Higher values of these indicators indicate a higher level of vulnerability and severity of storm surge disasters, while lower values suggest the opposite. Therefore, this study includes these five indicators as measures of the vulnerability of exposed elements in the assessment index system.
Turner et al. Coauthors. (2003) and Peilong and Fengman (2012) argue that disaster prevention and mitigation capabilities are essential components of societal resilience that are also considered significant aspects of generalized vulnerability. Tiwari (2015) defines disaster prevention and mitigation capabilities as the inherent capacity of exposed elements to mobilize various suitable resources in response to threats posed by disasters, thereby reducing direct disaster losses and facilitating the restoration of normal societal functions. In the context of constructing an assessment index system for disaster losses due to storm surges, it is crucial to consider the disaster prevention and mitigation capabilities of exposed elements. The swift recovery of a city after a disaster is closely related to its local medical conditions and economic status. Developed medical conditions require high economic levels. Thus, the number of hospitals, healthcare centers, and local medical staff; fiscal revenue; and per capita regional gross domestic product (GDP) can collectively indicate the passive defense capabilities of a region. Therefore, this study includes the number of hospitals and healthcare centers, hospital staff, fiscal revenue, and per capita regional GDP as indicators of the disaster prevention and mitigation capabilities of exposed elements.
By establishing a comprehensive assessment index system that encompasses a variety of causative factors and considers the disaster-prone environment, the vulnerability of exposed elements, and disaster prevention and mitigation capabilities, we can effectively evaluate the potential losses caused by typhoon storm surges. These assessment indices provide valuable insights into disaster preparedness and risk management, and thus, can inform the development of appropriate mitigation strategies.
Multiple indicators are included in the established storm surge loss assessment indicator system, and there is a certain degree of information overlap among these indicators. To reduce redundancy among related indicators and achieve high model stability, fast operational speed, and accurate evaluation results, this study uses the following methods.
The entropy method is an objective weighting method that determines the weights of different indicators based on the information provided by the magnitude of observed values for each indicator (Shannon and Weaver, 1949). In information theory, entropy is used to represent the measure of uncertainty, where information and uncertainty are inversely related. Specifically, larger information corresponds to smaller uncertainty and lower entropy, while lesser information corresponds to larger uncertainty and higher entropy. The algorithm follows the specific steps outlined below.
1) Data standardization:
For convenience, the standardized data is denoted as Xij.
2) Calculation of the weight of indicator Xij:
3) Calculation of the entropy value of the jth indicator:
4) Calculation of the coefficient of variation for the jth indicator:
5) Calculation of the weight for each indicator:
The genetic algorithm (GA) is a bio-inspired algorithm that originated from Darwin’s theory of evolution and Mendel’s theory of genetic variation (Holland, 1992). This algorithm utilizes computer simulation and transforms computational problem-solving into a process resembling biological evolution. Its objective is to find individuals who are the most well-adapted to the environment. Starting from a randomly generated initial population, the algorithm applies a series of genetic operations to produce new individuals that are better adapted. Through multiple iterations, the new population evolves toward the optimal region in the search space, eventually converging into a group of individuals that are most adapted to the environment, thereby yielding the optimal solution (Katoch et al., 2021).
The detailed process of the algorithm is illustrated in Figure 2. After initializing the parameters, the genetic algorithm generates an initial population consisting of several individual solutions. The fitness of each individual in the population is evaluated using a fitness function. Individuals with higher fitness participate in the next stage of operations, while those with lower fitness are eliminated. If the termination condition is not met, the individuals with higher fitness undergo selection, crossover, and mutation operations to form a new generation. The algorithm terminates when the fitness of the best individuals reaches a given threshold or when the fitness of the best individual and the population no longer improve.

FIGURE 2. Flow chart for the genetic algorithm.
The simulated annealing algorithm (SA) is a probability-based stochastic optimization algorithm that is based on the principles of solid-state annealing (Kirkpatrick et al., 1983). When the temperature of a solid is high, its internal particles are in a state of rapid disorderly motion due to higher energy. As the temperature gradually decreases, the internal energy of the solid decreases and the particles tend to move toward an ordered state. When the solid reaches room temperature, the internal energy reaches its minimum, indicating the most stable state of the particles. This algorithm starts with a relatively high initial temperature; as the temperature decreases, it randomly searches the solution space for the global optimal solution of the objective function based on the probability of energy changes (Hibat-Allah et al., 2021).
The detailed process of the algorithm is illustrated in Figure 3. The simulated annealing algorithm begins by initializing the temperature and selecting an arbitrary initial solution. Random perturbations are applied to the current solution within its neighborhood to generate a new solution. The change in the evaluation or fitness functions between the initial and new solutions is used as a criterion to accept or reject the new solution based on the Metropolis criterion. The algorithm continues until it reaches the maximum number of iterations or satisfies the termination condition, whereby several consecutive new solutions have not been accepted, indicating the algorithm’s convergence.
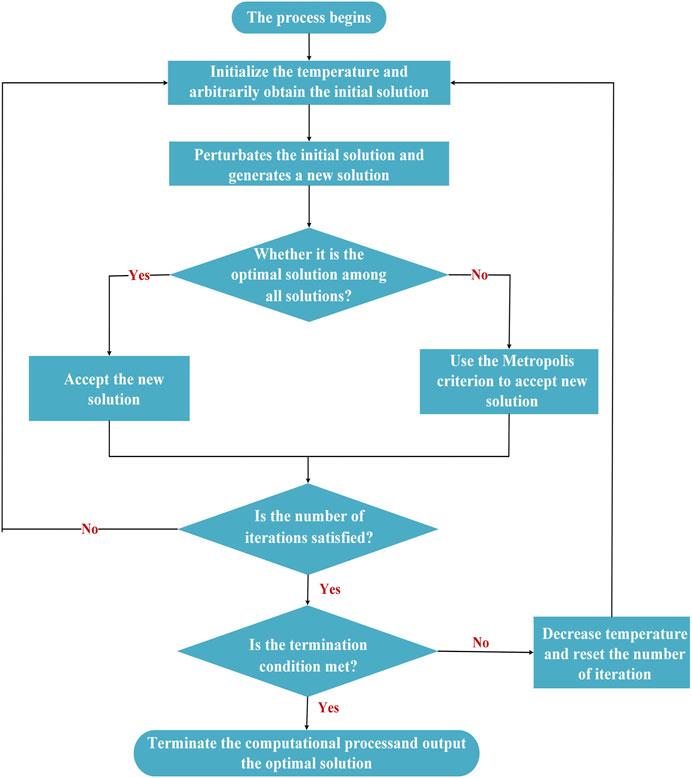
FIGURE 3. Flow chart for the simulated annealing algorithm.
The Backpropagation (BP) neural network is a multi-layer feedforward grid trained using the error backpropagation algorithm. It has found wide-ranging applications in information processing, pattern recognition, intelligent control, and system modeling (Rumelhart et al., 1986; Yang and Zhou, 2015; Amosov et al., 2020; Dewi et al., 2022). The main characteristics of this algorithm include forward signal propagation, backward error propagation, and the use of the gradient-descent learning rule to continuously adjust the thresholds and weights of the network, ultimately minimizing the sum of squared errors.
As shown in Figure 4, the BP neural network consists of an input layer, hidden layers, and an output layer. Its operation process can be divided into two stages. The first stage is forward propagation, where signals are passed from the input layer, processed through the hidden layer, and finally reach the output layer. The second stage is backward propagation of errors, where the error between the output layer and the target values are used to adjust the weights and thresholds of the neural network, it gradually reduces the error.
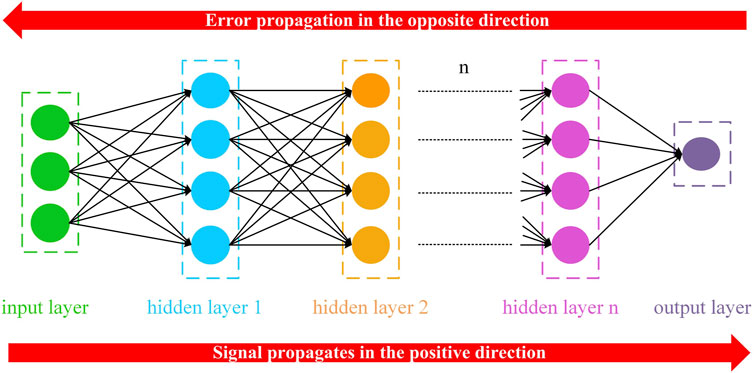
FIGURE 4. Flow chart for the backpropagation neural network.
Genetic algorithms, simulated annealing algorithms, and BP neural networks have matured in their respective domains. However, as their applications increase, their shortcomings and limitations have become evident. Genetic algorithms have a strong global optimization capability but are weak in local search, which renders pure genetic algorithms time-consuming and less efficient for analysis of late-stage evolution. These algorithms are also prone to premature convergence issues (Beg and Islam, 2016). Simulated annealing algorithms are point-search algorithms with weaker global optimization capabilities compared to swarm-search algorithms. The performance of these algorithms is also influenced by parameters, such as the cooling rate. If the cooling rate is slow, the search time will be longer, but it will potentially yield better solutions. Conversely, if the cooling rate is too fast, it may quickly skip the optimal solution (Correia et al., 2022). BP neural networks constitute local search optimization methods. The weights and thresholds of the network are adjusted gradually in the direction of a local improvement, making the algorithm susceptible to getting trapped in local minima and resulting in training failures. Furthermore, the computation process of BP neural networks is complex, leading to a significantly reduced convergence rate (Jin et al., 2000).
Given that the global optimization ability of the genetic algorithm is strong, while its local optimization ability is poor and the Simulated Annealing Algorithm has poor global optimization ability with strong local optimization ability, the two algorithms complement each other’s optimization deficiencies. At the same time, the simulated annealing algorithm meets the needs of optimizing the network gradient descent algorithm, which can improve the convergence speed and reduce the number of iterations to a certain extent. The genetic algorithm is a global search optimization algorithm, which can improve the problem of traditional neural networks falling into local optimal solutions, therefore, it improves the efficiency of the prediction model. Therefore, this paper uses a genetic algorithm and simulated annealing algorithm to form a genetic simulated annealing algorithm GSA to optimize the BP neural network.
The data on losses due to post-typhoon storm surges in the South China Sea region from 1989 to 2020, as reported in the “China Ocean Disaster Bulletin” and “Collection of Historical Materials on Storm Surge Disasters in China” (Yu et al., 2015), were used in this study. The maximum wind speed data for relevant typhoons were obtained from the International Best Track Archive for Climate Stewardship (IBTrACS) tropical cyclone observation data (Knapp et al., 2010). Economic and social development statistics of the coastal provinces in the South China Sea were collected from the statistical yearbooks of the respective provinces. These data have been authoritatively released by relevant departments of the National Natural Resources Ministry and the Meteorological Bureau. They have undergone rigorous quality control and verification, ensuring the reliability of the data. Figure 5 presents the 25 selected typhoon tracks and their maximum intensities, indicating that all these typhoons passed through coastal cities in the South China Sea region and reached the maximum typhoon strength. Among the initial 25 samples of the GSA-BP model, 20 samples were used for initial training, and 5 samples were used for initial testing.
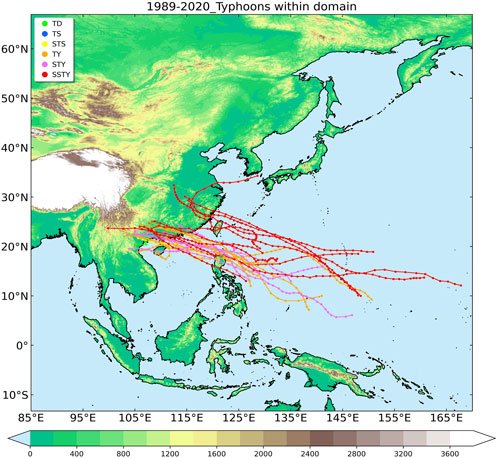
FIGURE 5. Maximum intensity and track of 25 selected typhoons.
In this study, the limited availability of post-storm surge loss samples poses a significant challenge due to the small sample size. Despite the limited number of samples, we have noted that many studies within this field have managed to produce reliable outcomes with small samples (Ye et al., 2014; Zhao et al., 2015; Wang and Liu, 2018; Zhao et al., 2018; Jia et al., 2022a; Jia et al., 2022b). To further enhance the robustness of our model, we have utilized the Bootstrap method (Härdle, 1995) to augment our training and testing samples. The fundamental premise of bootstrap is to augment the sample size by randomly resampling the original data. The advantage of this approach is that it obviates the need for any assumptions about the unknown distribution of the data and directly resamples the original data, thereby transforming a small sample into a larger one (Brad Efron et al., 1993; Zoubir A M et al., 1998). We employed the bootstrap toolbox to resample the initial data, expanding the original training data to 60 samples for the final training set. It is noteworthy that while bootstrap is efficacious in many scenarios, it does possess certain limitations. For instance, if there exists long-term dependencies or correlations among the original data, the bootstrap method might introduce biases (Tewes, 2018). However, in this study, our data consisted of independent observations regarding typhoon storm surge disaster losses, thus the limitations of the method did not significantly impact our research. By employing the bootstrap method, we were able to leverage the limited data more efficiently, enhancing the accuracy and stability of the model. In summary, given our research context and objectives, as well as the data challenges we faced, the use of the bootstrap method was a prudent and fitting decision. Additionally, to compare the regression prediction results from the GSA-BP model for losses due to post-storm surges with the results from the genetic algorithm-Back Propagation (GA-BP) model and the Simulated Annealing-Back Propagation (SA-BP) model; this study selected GA-BP and SA-BP models as control experimental models.
The establishment of the GSA-BP model involves several steps, which are depicted in Figure 6, outlining the model’s technical roadmap.
1) Input the test and training datasets and initialize the basic parameters of the algorithm in the model, such as the number of iterations, temperature cooling rate, and population size, along with the topology of the BP neural network.
2) Calculate the fitness of each individual in the population. Generate a new population through selection, crossover, and mutation operations for the selected individuals. Apply annealing operations for further optimized training of the new population.
3) Calculate the fitness of the annealed new population and determine if an individual with optimal fitness has been found. Compare the current fitness of each individual in the new population with their historical fitness. Retain the historical fitness if that is the best fit, otherwise, replace it with the current fitness. Repeat this process until an individual with the best fitness satisfying the termination condition is found, concluding the genetic simulated annealing algorithm.
4) Utilize the best individual as the initial weights and thresholds of the BP neural network.
5) Train and learn the BP neural network using the latest weights and thresholds obtained. If the error reaches a minimum value, thereby meeting the desired outcome, the training and learning of the BP network are concluded, and the optimal solution is obtained.
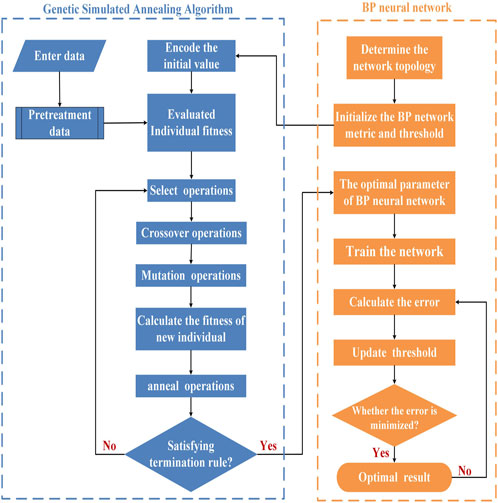
FIGURE 6. A technical roadmap of the GSA-BP model.
As the indicators in the typhoon storm surge loss assessment system established earlier had different scales and measurement units, a direct comparison without preprocessing was not feasible. To effectively address and mitigate the effect of the potential correlation and information redundancy among the indicators in the assessment system on the model’s predictive results, this study utilized the entropy method to assess the dispersion of the 13 indicators. As compared to subjective assignment methods, the entropy method not only reduces subjective errors, but also minimizes information loss, thereby improving the accuracy of the model. The calculation results are presented in Table 1. Based on the calculated results in Table 1, it can be observed that the weight of the maximum wind speed of a typhoon is the highest, indicating the least dispersion among the indicators. On the other hand, the weight of the damaged area in aquaculture is the lowest, implying the highest dispersion. To avoid interference from redundant information, the final selection of input variables for the model included the following 10 influencing indicators: maximum wind speed of typhoon, fiscal revenue, per capita GDP, population density, amounts of local medical staff, maximum storm surge, affected agricultural area, affected population, length of damaged seawall, and number of hospitals and healthcare centers.
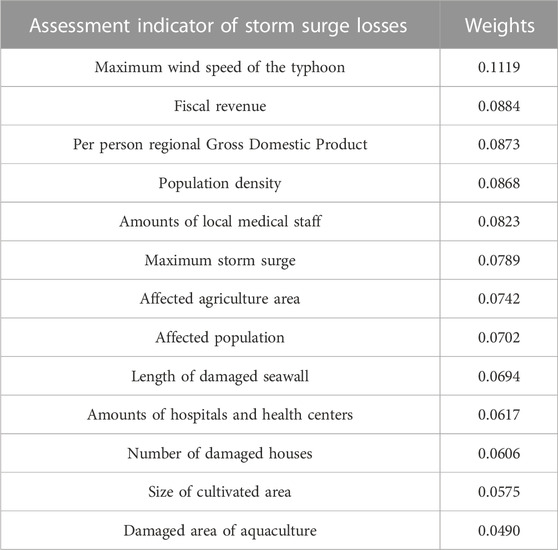
TABLE 1. Weights of each indicator.
In preparation for the assessment system of typhoon storm surge disaster losses, it is imperative to conduct a preprocessing phase. Similarly, prior to the initiation of the training phase, the GSA-BP model necessitates the determination of parameters. The GSA-BP model includes multiple hyperparameters, such as the number of hidden layer nodes, momentum coefficient, population size, and crossover probability, and these parameters need to be pre-set manually. Each set of hyperparameters produces a different model structure. To quickly find and optimize the best combination of hyperparameters, this study employed Bayesian optimization. Bayesian optimization stands as an efficacious method for global optimization, demonstrating particular aptitude in addressing high-dimensional and intricate optimization challenges, such as those encountered in neural network hyperparameter tuning (Snoek et al., 2012; Shahriari, B et al., 2015). The GSA-BP model contains multiple hyperparameters, including the hidden layers of the BP neural network, population size, mutation probability, and crossover probability, among others. These parameters need to be set in advance, and each different combination of hyperparameters results in a new model. Given the advantages of the Bayesian optimization method mentioned above, we employed this approach to swiftly obtain the optimal hyperparameter combination for the GSA-BP model. The optimized parameters are presented in Table 2. To address the potential for overfitting, we applied regularization techniques during the neural network training process. This approach helps the model to generalize better from the data provided.
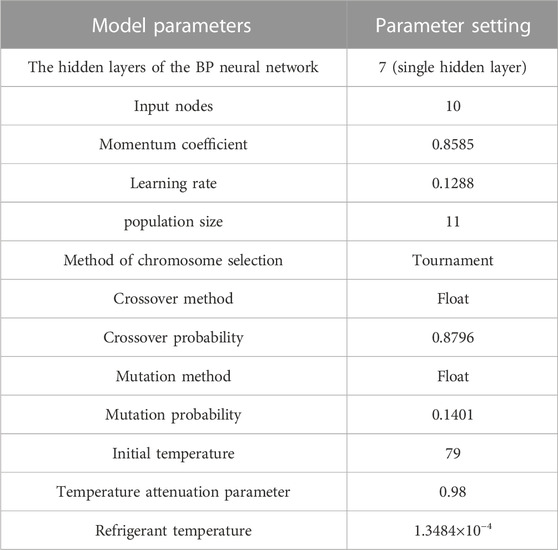
TABLE 2. Optimized parameters for the GSA-BP model.
The distribution trends of the predicted and observed values for the training samples with the GSA-BP, SA-BP, and GA-BP models are shown in Figure 7. The first 20 samples in the figure represent the initial training data, while the subsequent 40 markers represent the expanded samples generated using the bootstrap package. During the training process, we employed both R2 and R as regression evaluation metrics. These metrics were chosen for their relevance in assessing the correlation between predicted and actual values, highlighting the model’s predictive capability. It is evident that as compared to the GA-BP (Figure 7C) and SA-BP(Figure 7B) models, the GSA-BP (Figure 7A)model exhibits a closer distribution trend to the actual values. Additionally, the GSA-BP model has the highest number of overlaps between the predicted and actual values in the training samples. Table 3 presents a comparison of the results from the training samples with the three models. The GSA-BP model achieves higher goodness of fit (R2) and correlation coefficient (R) of 0.8011 and 0.8950, respectively, as compared to the SA-BP model with R2 of 0.1648 and R of 0.1284 and the GA-BP model with R2of 0.1615 and R of 0.1271. The higher correlation regression coefficient achieved with the GSA-BP model indicates a better fit and higher correlation with the observed values, resulting in smaller errors.
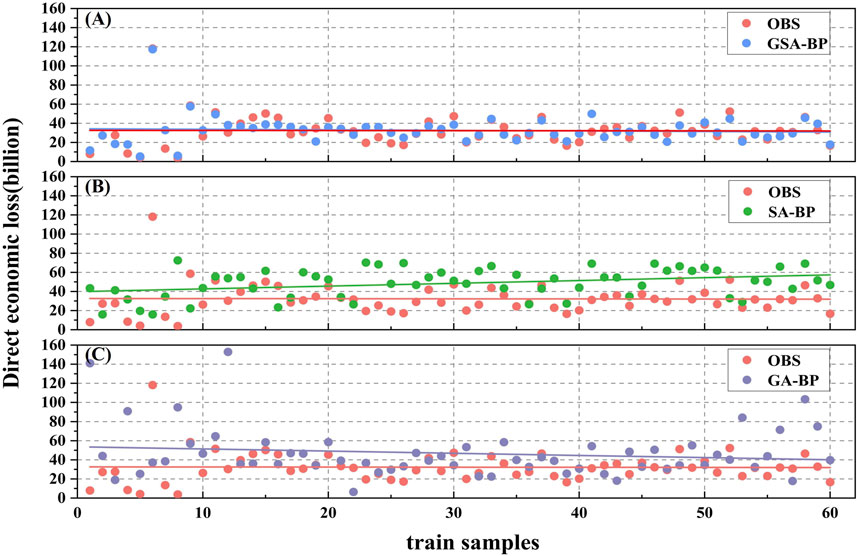
FIGURE 7. The distribution trend of predicted and observed values from the (A) GSA-BP, (B) SA-BP, and (C) GA-BP training samples.

TABLE 3. Comparison of results from applying the different models to the training samples.
Figure 8 illustrates the distribution trends of the predicted and observed values for the test samples with the GSA-BP, SA-BP, and GA-BP models. It can be observed that the SA-BP model shows an overall downward trend in its prediction quality, whereby the predictions deviate significantly from the upward trend of the actual values. Although the GA-BP model exhibits an upward trend, the slope and intercept of the trendline differ significantly from the actual values, indicating substantial deviations. In comparison, the GSA-BP model demonstrates a closer and nearly overlapping distribution trend with the actual values for the test samples, indicating a better alignment between the predicted and observed values. Table 4 presents a comparison of the results from the test samples with the three models. The GSA-BP model achieves a higher goodness of fit (R2) and correlation coefficient (R) of 0.9920 and 0.9960, respectively, compared to the SA-BP model with R2 of 0.1008 and R of 0.3176, and the GA-BP model with R2 of 0.0006 and R of 0.0231. The higher correlation regression coefficient achieved with the GSA-BP model indicates a better fit and a higher correlation with the actual values, resulting in smaller errors.
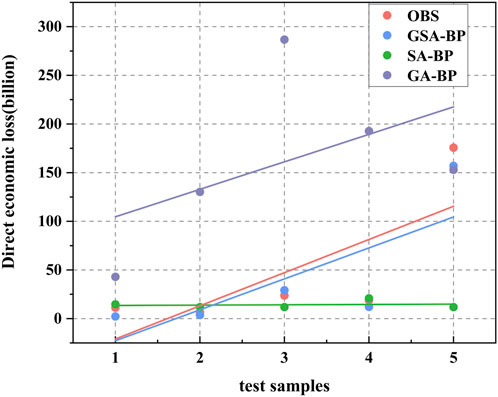
FIGURE 8. The distribution trend of predicted results and actual values from the GSA-BP, SA-BP, and GA-BP test samples.
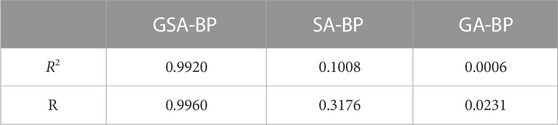
TABLE 4. Comparison of results from applying the different models to the test samples.
To further validate the advantages of the GSA-BP model in the assessment of disaster losses due to typhoon storm surges, boxplots depicting the absolute errors of the training (Figure 9A) and test samples (Figure 9B) for the three models (shown in Figure 9) were analyzed. In Figure 9, the GSA-BP model’s absolute error box height for both training and test samples is notably lower compared to the GA-BP and SA-BP models. And the outliers of the GSA-BP box (points outside the box) are significantly less than the other two models, suggesting that the GSA-BP model exhibits lower error fluctuations and has higher data stability. This leads to reduced absolute errors and a more accurate representation of the observations.
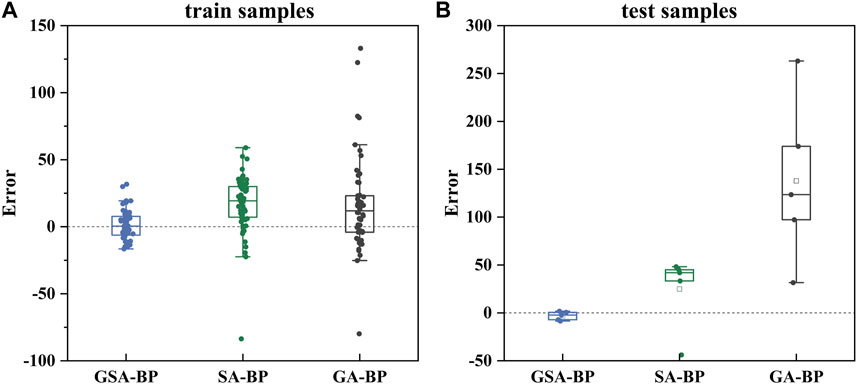
FIGURE 9. Boxplots of absolute error of the GSA-BP, SA-BP, and GA-BP (A) training samples and (B) test samples.
Figure 10 presents the fitness curves for the GSA-BP, SA-BP, and GA-BP models. According to Figure 10, the GSA-BP model converges and reaches the optimal solution in approximately 42 iterations with a best fitness value of ∼0.0344. The SA-BP model converges at ∼47 iterations with a best fitness value of approximately 0.037. It can be observed that the GSA-BP model converges faster and has a smaller fitness value as compared to the SA-BP model, indicating a higher convergence speed and better fitness. Although the GA-BP model generally achieves a smaller fitness value than the GSA-BP model, it can be seen from the graph that the GA-BP model requires approximately 60 iterations to converge, making it computationally more time-consuming compared to the GSA-BP model. Considering both the number of convergence iterations required and the best fitness value of the models, the GSA-BP model demonstrates superior efficiency as compared to the SA-BP and GA-BP models.
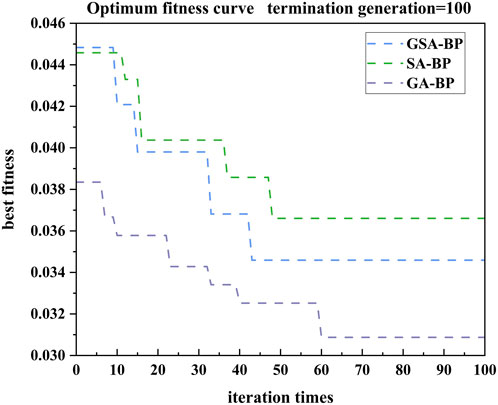
FIGURE 10. The optimum fitness curves for GA-BP, GSA-BP, and SA-BP models.
Establishing a comprehensive typhoon storm surge loss assessment index system is crucial for conducting related risk assessments. The system constructed in this study integrates assessment indicators from four distinct perspectives: causative factors, disaster-prone environment, vulnerability of exposed elements, and disaster prevention and mitigation capabilities. This provides a holistic framework for storm surge risk assessment. While our typhoon storm surge loss assessment index system is novel, the foundational concepts and methods for its construction have been validated in other related fields. For instance, Liu et al. (2022) employed a similar index system in their research to assess typhoon risks. They found that, compared to traditional risk assessment methods, their evaluation results were more accurate and closely aligned with actual loss data when disaster mitigation capabilities were taken into account. This finding further underscores the importance of establishing a multi-faceted assessment system, especially one that encompasses disaster prevention capabilities, in risk assessment.
Considering the above research findings, it is evident that the GSA-BP model, based on the index system mentioned in Section 2, not only operates at a high speed but also produces predictions for both the training and test sets that are closer to the corresponding actual values, yielding ideal fitting results. Given the backdrop of climate change and rising sea levels, which are leading to increased frequency and intensity of storm surges, we believe that the assessment system and GSA-BP model established in this study can be applied in fields such as disaster response and risk management. Relevant government departments can more accurately identify potential high-risk areas for storm surge disasters and based on this, formulate more rational disaster prevention and mitigation strategies.
In this study, a comprehensive assessment framework was developed to evaluate losses caused by typhoon storm surges by integrating loss data obtained from investigations of storm surge disaster induced by typhoon with observational data on tropical cyclones and storm surges. The assessment framework considered four aspects: causative factors, disaster-prone environment, vulnerability of exposed elements, and disaster prevention and mitigation capabilities. Furthermore, the maximum typhoon wind speed was incorporated into the disaster loss assessment framework. The genetic simulated annealing algorithm (GSA) was employed to optimize a backpropagation (BP) neural network model for the pre-assessment of 25 typhoon storm surge events in the South China Sea from 1989 to 2020. Additionally, the bootstrap method was used to augment the training sample data, which allowed an evaluation of the applicability of the GSA-BP model and enhanced the accuracy of storm surge loss predictions.
The results demonstrate that the GSA-BP model developed in this study provides a reasonably accurate pre-assessment of direct economic losses incurred by storm surges. It offers a novel approach to estimating the severity of storm surge disasters in coastal cities along the South China Sea. However, the accuracy and scientific validity of the prediction results from the GSA-BP model presented in this study can be improved due to the challenges associated with collecting complete post-disaster loss data for storm surges in this study. Therefore, future efforts should focus on strengthening the collection of data on post-disaster storm surge losses, thus providing robust support for the development of relevant disaster assessment frameworks.
Publicly available datasets were analyzed in this study. This data can be found here: The post-typhoon storm surge loss data in the South China Sea region from 1989 to 2020 that were used as training and testing data in this study were adopted from China Ocean Disaster Bulletin (via https://www.mnr.gov.cn/sj/sjfw/hy/gbgg/zghyzhgb/) and the Collection of Historical Materials on Storm Surge Disasters in China (Yu et al. 2015). The maximum wind speed data for relevant typhoons were obtained as the tropical cyclone observation data from the International Best Track Archive for Climate Stewardship (IBTrACS) (Knapp et al., 2010) via https://climatedataguide.ucar.edu/climate-data/ibtracs-tropical-cyclone-best-track-data.
YZ: Formal Analysis, Investigation, Validation, Visualization, Writing–original draft, Writing–review and editing. TZ: Funding acquisition, Methodology, Supervision, Writing–review and editing. WS: Software, Visualization, Writing–review and editing. ZO: Validation, Writing–review and editing. JZ: Validation, Writing–review and editing.
The authors declare financial support was received for the research, authorship, and/or publication of this article. This research was jointly funded by National Key Research and Development Program of China (Grant number 2021YFC3101801, 2022YFC3103104); Innovative Team Plan for Department of Education of Guangdong Province (No. 2023KCXTD015);Guangdong Science and Technology Plan Project (Observation of Tropical marine environment in Yuexi); Independent research project of Southern Ocean Laboratory (Grant number SML2022SP301); National Natural Science Foundation of China (Grant number 41976200); Guangdong Ocean University Scientific Research Program (Grant number 060302032106).
The authors declare that the research was conducted in the absence of any commercial or financial relationships that could be construed as a potential conflict of interest.
All claims expressed in this article are solely those of the authors and do not necessarily represent those of their affiliated organizations, or those of the publisher, the editors and the reviewers. Any product that may be evaluated in this article, or claim that may be made by its manufacturer, is not guaranteed or endorsed by the publisher.
Amosov, O. S., Amosova, S. G., Ivanov, Y. S., and Zhiganov, S. (2020). Using the deep neural networks for normal and abnormal situation recognition in the automatic access monitoring and control system of vehicles. Neural Comput. Appl. 32, 3069–3083. doi:10.1007/s00521-020-05170-5
Beg, A., and Islam, M. (2016). Advantages and limitations of genetic algorithms for clustering records, 2478–2483.
Benavente, J., Río, L. D., Gracia, F. J., and Martínez-Del-Pozo, J. A. (2006). Coastal flooding hazard related to storms and coastal evolution in Valdelagrana spit (Cadiz Bay Natural Park, SW Spain). Cont. Shelf Res. 26, 1061–1076. doi:10.1016/j.csr.2005.12.015
Chang, J., Yin, Z., Zhang, Z., Xu, X., and Zhao, M. (2023). Multi-disaster integrated risk assessment in city range—a case study of jinan, China. Int. J. Environ. Res. Public Health 20, 3483. doi:10.3390/ijerph20043483
China marine (2021). Ministry of natural resources of the people’s Republic of China. Available at: http://gi.mnr.gov.cn/202205/t20220507_2735508.html. China marine-disaster bulletin.
Correia, A. H. C., Worrall, D. E., and Bondesan, R. (2022). Neural simulated annealing. arXiv preprint arXiv:2203.02201.
Dasgupta, S., Laplante, B., Murray, S., Wheeler, D., and Jianping, H. (2011). Exposure of developing countries to sea-level rise and storm surges. Clim. Change 106, 567–579. doi:10.1007/s10584-010-9959-6
Dewi, C., Chen, R.-C., Jiang, X., and Yu, H. (2022). Deep convolutional neural network for enhancing traffic sign recognition developed on Yolo V4. Multimedia Tools Appl. 81, 37821–37845. doi:10.1007/s11042-022-12962-5
Du, X., Jin, X., Yang, X., Yang, X., Xiang, X., and Zhou, Y. (2015). Spatial-temporal pattern changes of main agriculture natural disasters in China during 1990–2011. J. Geogr. Sci. 25, 387–398. doi:10.1007/s11442-015-1175-x
Gao, Z., Yu, M., and Ding, Z. (2012). Typhoon storm surge risk assessment based on GlS: a case study of Taizhou. Mar. Environ. Sci. 31, 5. doi:10.3969/j.issn.1007-6336.2012.03.028
Härdle, W. (1995). An introduction to the bootstrap - B. Elfron; R. J. Tibshirani. Metr. 42, 267–268. doi:10.2307/2983304
Hibat-Allah, M., Inack, E. M., Wiersema, R., Melko, R. G., and Carrasquilla, J. (2021). Variational neural annealing. Nat. Mach. Intell. 3, 952–961. doi:10.1038/s42256-021-00401-3
Holland, J. H. (1992). Adaptation in natural and artificial systems: an introductory analysis with applications to biology, control, and artificial intelligence. China, MIT press.
Hsu, C. H., Olivera, F., and Irish, J. L. (2018). A hurricane surge risk assessment framework using the joint probability method and surge response functions. Nat. Hazards 91 (Suppl. 1), 7–28. doi:10.1007/s11069-017-3108-8
Jelesnianski, C. P., Chen, J., and Shaffer, W. A. (1992). SLOSH: sea, lake, and Overland surges from Hurricanes. U.S. Dep. Commer. https://repository.library.noaa.gov/view/noaa/7235.
Ji, Y., Xiong, Y., and Ma, R. (2007). Fuzzy synthetic method applied in assessment of storm tide disaster losses. Guangxi Water Resour. Hydropower 5.
Jia, B. H., Yang, S., and Ran, S. (2022b). A combined assessment model for storm surge disaster losses based on an improved SVR-GRNN. Beijing Surv. Mapp. 36 (01), 1–6. doi:10.19580/j.cnki.1007-3000.2022.01.001
Jia, B. H., Zhu, W. S., Wang, R. F., et al. (2022a). Assessment of storm surge disaster losses based on the SSA-BP neural network model. Mar. Forecast 39 (02), 50–58.
Jin, W., Li, Z. J., Wei, L. S., and Zhen, H. (2000). The improvements of BP neural network learning algorithm. 2000 - ICSP 2000. 2000 5th International Conference on Signal Processing Proceedings. 16th World Computer Congress,2000 5th, USA, WCC 3, 1647–1649. doi:10.1109/ICOSP.2000.893417
Katoch, S., Chauhan, S. S., and Kumar, V. (2021). A review on genetic algorithm: past, present, and future. Multimedia Tools Appl. 80, 8091–8126. doi:10.1007/s11042-020-10139-6
Kirkpatrick, S., Gelatt, C., and Vecchi, M. (1983). Optimization by simulated annealing. Science 220, 671–680. doi:10.1126/science.220.4598.671
Knapp, K. R., Kruk, M. C., Levinson, D. H., Diamond, H. J., and Neumann, C. J. (2010). The international best track archive for climate stewardship (IBTrACS): unifying tropical cyclone best track data. Bull. Am. Meteorological Soc. 91, 363–376. doi:10.1175/2009BAMS2755.1
Krien, Y., Dudon, B., Sansorgne, E., Roger, J., Zahibo, N., and Roquelaure, S. (2013). Probabilistic storm surge hazard assessment in Martinique, 5265.
Li, K., and Li, G. S. (2011). Vulnerability assessment of storm surges in the coastal area of Guangdong Province. China, Natural Hazards and Earth System Sciences.
Lin, I. I., Pun, I. F., and Wu, C. C. (2009). Upper-Ocean thermal structure and the western north pacific category 5 typhoons. Part II: dependence on translation speed. Mon. Weather Rev. 137, 3744–3757. doi:10.1175/2009mwr2713.1
Lin, N., and Shullman, E. (2017). Dealing with hurricane surge flooding in a changing environment: part I. Risk assessment considering storm climatology change, sea level rise, and coastal development.
Lin, N., Vanmarcke, E., and Emanuel, K. (2010). Hurricane risk assessment: wind damage and storm surge (invited). America, AGU Fall Meeting Abstracts.
Liu, F., Xu, E., and Zhang, H. (2022). An improved typhoon risk model coupled with mitigation capacity and its relationship to disaster losses. J. Clean. Prod. (Jul.10), 357. doi:10.1016/j.jclepro.2022.131913
Liu, Q., Ruan, C., Zhong, S., Li, J., Yin, Z., and Lian, X. (2018). Risk assessment of storm surge disaster based on numerical models and remote sensing. Int. J. Appl. Earth Observation Geoinformation 68, 20–30. doi:10.1016/j.jag.2018.01.016
Liu, Z., and He, Y. (2021). Hai nan statistical yearbook—2021. 刘自更 and 何永东. China, China Statistics Press, 564.
Lockwood, J. W., Lin, N., Oppenheimer, M., and Lai, C.-Y. (2022). Using neural networks to predict hurricane storm surge and to assess the sensitivity of surge to storm characteristics. J. Geophys. Res. Atmos. 127, e2022JD037617. doi:10.1029/2022JD037617
Mcgranahan, G., Balk, D., and Anderson, B. (2007). The rising tide: assessing the risks of climate change and human settlements in low elevation coastal zones. Environ. Urbanization 19, 17–37. doi:10.1177/0956247807076960
Ministry of Natural (2022). Ministry of natural resources of the people’s Republic of China. Available at: http://gi.mnr.gov.cn/202304/t20230412_2781112.html. China marine-disaster bulletin.
Ministry of Natural Resources (2019). Ministry of natural resources of the people’s Republic of China. Available at: http://gi.mnr.gov.cn/202004/t20200430_2510979.html.China marine-disaster bulletin.
Nicholls, R. J. (2004). Coastal flooding and wetland loss in the 21st century: changes under the SRES climate and socio-economic scenarios. Glob. Environ. Change 14, 69–86. doi:10.1016/j.gloenvcha.2003.10.007
NOAA (2022). Costliest U.S. tropical cyclones. Available at: https://www.ncdc.noaa.gov/billions/dcmi.pdf.
Pan, G., Chai, F., Tang, D., and Wang, D. (2017). Marine phytoplankton biomass responses to typhoon events in the South China Sea based on physical-biogeochemical model. Ecol. Model. 356, 38–47. doi:10.1016/j.ecolmodel.2017.04.013
Peilong, J., and Fengman, F. (2012). Progress in research on vulnerability of natural disasters. inst. disaster prev. 20 (2), 131–137. doi:10.3724/SP.J.1011.2011.00468
Phantuwongraj, S., Choowong, M., Nanayama, F., Hisada, K.-I., Charusiri, P., Chutakositkanon, V., et al. (2013). Coastal geomorphic conditions and styles of storm surge washover deposits from Southern Thailand. Geomorphology 192, 43–58. doi:10.1016/j.geomorph.2013.03.016
Rumelhart, D. E., Hinton, G. E., and Williams, R. J. (1986). Learning representations by back-propagating errors. Nature 323, 533–536. doi:10.1038/323533a0
Shahriari, B., Bouchard-Côté, A., and Freitas, N. D. (2015). Unbounded bayesian optimization via regularization in International conference on artificial intelligence and statistics.
Shannon, C. E., and Weaver, W. (1949). The mathematical theory of communication. vi: University of Illinois Press, 117.
Shepard, C. C., Agostini, V. N., Gilmer, B., Allen, T., Stone, J., Brooks, W., et al. (2012). Assessing future risk: quantifying the effects of sea level rise on storm surge risk for the southern shores of Long Island, New York. Nat. Hazards 60, 727–745. doi:10.1007/s11069-011-0046-8
Singh, V. K., Roxy, M. K., and Deshpande, M. (2021). Role of warm ocean conditions and the MJO in the genesis and intensification of extremely severe cyclone Fani. Sci. Rep. 11, 3607. doi:10.1038/s41598-021-82680-9
Si-qi, J., and Liu, Q. (2020). The BP neural network optimized by beetle antenna search algorithm for storm surge prediction, Paper presented at the the 30th international ocean and polar engineering conference. Virtual.
Snoek, J., Larochelle, H., and Adams, R. P. (2012). Practical bayesian optimization of machine learning algorithms.
Statistics Bureau. Of Guangdong province, and national bureau of statistics, 2021: Guangdong statistical yearbook. Yearbook, 4. –5. doi:10.39327/y.cnki.ygdtj.2021.000001
Tewes, J. (2018). Block bootstrap for the empirical process of long-range dependent data. J. Time Ser. Analysis 39, 28–53. doi:10.1111/jtsa.12256
Tiwari, A. (2015). The Capacity Crisis in Disaster Risk Management: why disaster management capacity remains low in developing countries and what can be done. Germany, Springer.
Tsunami&Storm Surge Research Association (2003). Tsunami&Storm surge manual. Germany, The Cabinet Office.
Turner, B. L., Kasperson, R. E., Matson, P. A., McCarthy, J. J., Corell, R. W., Christensen, L., et al. (2003). A framework for vulnerability analysis in sustainability science. Proc. Natl. Acad. Sci. 100, 8074–8079. doi:10.1073/pnas.1231335100
Van, P., and Aarts, E. (1987). Simulated annealing: theory and applications. Simulated annealing: theory and applications.
Wang, J., Mo, D., Hou, Y., Li, S., Li, J., Du, M., et al. (2022). The impact of typhoon intensity on wave height and storm surge in the northern East China sea: a comparative case study of typhoon muifa and typhoon lekima. J. Mar. Sci. Eng. 10, 192. doi:10.3390/jmse10020192
Wang, K., Yang, Y., Reniers, G., and Huang, Q. (2021). Understanding spatiotemporal patterns of typhoon storm surge disasters based on their tropical cyclone track clusters in China. Geomatics, Nat. Hazards Risk 12, 2736–2754. doi:10.1080/19475705.2021.1973120
Wang, T., and Liu, Q. (2018). Prediction of storm surge disaster loss based on the BAS-BP model. Mar. Environ. Sci. 37 (03), 457–463. doi:10.13634/j.cnki.mes.2018.03.023
Yang, W.-A., and Zhou, W. (2015). Autoregressive coefficient-invariant control chart pattern recognition in autocorrelated manufacturing processes using neural network ensemble. J. Intelligent Manuf. 26 (6), 1161–1180. doi:10.1007/s10845-013-0847-6
Ye, X. L., Liang, W., and Deng, H. (2014). Prediction of typhoon disaster losses in Zhejiang Province based on principal component analysis and RBF neural network. Bull. Sci. Technol. 30 (09), 13–19. doi:10.13774/j.cnki.kjtb.2014.09.005
Yu, F., Dong, J., and Ye, L. (2015). Collection of storm surge disasters historical data in China 1949-2009 Historical materials collection of storm surge disasters in China. China, IEEE,
Zerger, A. (2002). Examining GIS decision utility for natural hazard risk modelling. Environ. Model. Softw. 17, 287–294. doi:10.1016/S1364-8152(01)00071-8
Zhang, X., and Jiang, S. (2022). Study on the application of BP neural network optimized based on various optimization algorithms in storm surge prediction. Proc. Institution Mech. Eng. Part M J. Eng. Marit. Environ. 236 (3), 539–552. doi:10.1177/14750902211069551
Zhao, L., and Bian, C. (2012). Research on the classification standards for comprehensive loss levels of storm surge disasters. Chin. Fish. Econ. 30, 8. doi:10.3969/j.issn.1009-590X.2012.03.007
Zhao, X., Wang, B., and Zheng, H. (2015). The assessment of storm surge disaster loss based on RS-SVM model. Mar. Environ. Sci. 34, 5. doi:10.13634/j.cnki.mes20150422
Zhao, X., Wang, X. H., and Zheng, H. (2018). Calculation of risk value for storm surge disasters using the embedded POT loss distribution fitting model. Mar. Environ. Sci. 37 (05), 773–779. doi:10.13634/j.cnki.mes.2018.05.022
Keywords: maximum wind speed of typhoons, storm surge, direct economic losses, genetic simulated annealing algorithm, BP neural network
Citation: Zhang Y, Zhang T, Shen W, Ou Z and Zhang J (2023) Economic loss assessment of typhoon-induced storm surge disasters in the South China Sea based on GSA-BP model. Front. Earth Sci. 11:1258524. doi: 10.3389/feart.2023.1258524
Received: 20 July 2023; Accepted: 08 November 2023;
Published: 27 December 2023.
Edited by:
Jianfeng Li, Hong Kong Baptist University, Hong Kong SAR, ChinaReviewed by:
Xiaohui Lu, The University of Nottingham Ningbo, ChinaCopyright © 2023 Zhang, Zhang, Shen, Ou and Zhang. This is an open-access article distributed under the terms of the Creative Commons Attribution License (CC BY). The use, distribution or reproduction in other forums is permitted, provided the original author(s) and the copyright owner(s) are credited and that the original publication in this journal is cited, in accordance with accepted academic practice. No use, distribution or reproduction is permitted which does not comply with these terms.
*Correspondence: Tianyu Zhang, emhhYW5ndHlAc2luYS5jb20=
Disclaimer: All claims expressed in this article are solely those of the authors and do not necessarily represent those of their affiliated organizations, or those of the publisher, the editors and the reviewers. Any product that may be evaluated in this article or claim that may be made by its manufacturer is not guaranteed or endorsed by the publisher.
Research integrity at Frontiers
Learn more about the work of our research integrity team to safeguard the quality of each article we publish.