 Higemengist Astatkie
95% of researchers rate our articles as excellent or good
Learn more about the work of our research integrity team to safeguard the quality of each article we publish.
Find out more
ORIGINAL RESEARCH article
Front. Earth Sci. , 19 July 2021
Sec. Sedimentology, Stratigraphy and Diagenesis
Volume 9 - 2021 | https://doi.org/10.3389/feart.2021.658737
This article is part of the Research Topic Cohesive Sedimentary Systems: Dynamics and Deposits View all 21 articles
Surface sediment samples were collected from different streams of Awetu Watershed in southwestern Ethiopia. Sediment samples were analyzed for As, Cd, Cr, Pb, and Hg levels using inductively coupled plasma optical emission spectrometry. The heavy metal concentration ranged from 183.60 to 1,102.80 mg/kg for As (mean 623.32 ± 291.65 mg/kg), 4.40–303.20 mg/kg for Cd (151.09 ± 111.5 mg/kg), 149.20–807.20 mg/kg for Cr (375 ± 212.03 mg/kg), 485.60–3,748.80 mg/kg for Pb (2005.94 ± 954.99 mg/kg) and 3.6–5.6 mg/kg for Hg (4.64 ± 0.59 mg/kg). The mean heavy metal concentration in the streams followed the decreasing order of Pb > As > Cr > Cd > Hg. As, Cr and Pb are detected at high concentrations with values of 623.32, 375.00, and 2,005.94 mg/kg respectively. A low level of heavy concentration (3.6 mg/kg) was recorded for Hg. The contamination factor (CF) of all the studied heavy metals ranged from a low degree (CF < 1) to a very high degree (CF ≤ 6). Mainly, Dololo and Kito streams show a very high degree of contamination (CF ≤ 6) than Awetu and Boye streams. Specifically, As, Cd and Cr in the Dololo and Kito streams have significantly elevated concentrations than others. Geo-accumulation index (Igeo) shows low to moderate contamination level with As, Pb, and Hg; uncontaminated to heavily contaminated by Cr; and moderate to extreme contamination by Cd. Untreated solid waste, garages and farmlands were sources of contamination. Streams receiving wastewater effluents from teaching institutions had higher heavy metal concentrations. Dumping of electronic wastes and car washing discharges also identified as another source of pollution.
Quality of water is affected by human-induced or natural activities in the upstream watershed (Sany et al., 2013). As a result of the natural flow of the water, most pollutants are drained into a one-point collection site, such as reservoirs that can serve as a sink for different pollutants (Nowrouzi and Pourkhabbaz, 2014a). Due to its potential and toxic environmental and public health effects and the ability to accumulate, heavy metal contamination of the aquatic ecosystems is becoming a potential global problem (Sharma et al., 2015).
Sediment contamination with heavy metals could be either from natural geogenic sources or sourced from anthropogenic activities (Giouri et al., 2010). The benthic environment of aquatic ecosystems receives and absorbs heavy metals from natural weathering, erosion, industrial wastes, and atmospheric deposition (Jaishankar et al., 2014). Anthropogenic activities, such as industrial and agricultural discharges, inappropriate disposal of industrial wastes, dumping of domestic and municipal wastes, faulty drainage systems are some of the causes for heavy metal contamination of aquatic ecosystems (Hahladakis and Smaragdaki, 2013; Islam et al., 2015).
Several studies indicated that heavy metal concentration in stream sediments is relatively high due to significant anthropogenic metal loadings carried by tributary rivers (Li et al., 2011). As a result, surficial sediments may serve as a metal puddle that can release metals to the overlying water that could potentially adversely affect the riverine ecosystems (Evans et al., 2003; Reda and Ayu, 2016). It is well-known that the mobility and availability of heavy metals in aquatic environments are primarily affected by physicochemical parameters of water, such as pH, dissolved oxygen, and organic matter content (Sim et al., 2016).
Due to the absence of waste treatment facilities in cities and the discharge of wastes into the nearby water bodies, rivers located near cities are often suffering from heavy metal contamination (Giridharan et al., 2008). A study conducted by Mekonnen and his colleagues (2014) on the Akaki river that crosses Addis Ababa city showed severe contamination of the stream water with heavy metals sourced from industrial, residential, and agricultural wastes. The quality of the water gets worsened as heavy metals bioaccumulate in algal blooms in the downstream section of the water bodies where wastes are discharged from the upstream (Melaku et al., 2007).
Other studies of sediment and water pollution assessment in Ethiopia and in the region showed that the concentration of heavy metals rapidly increases when it entered Addis Ababa city (Akele et al., 2016; Aschale et al., 2016; Woldetsadik et al., 2017), Kombolcha city (north-central part of Ethiopia) (Zinabu et al., 2019), but significantly decreased downstream of the cities. This decrement of heavy metal in the downstream of the town might be due to heavy metals adsorbed into the sediment portion of the river (Khan et al., 2017). Bottom stream sediments are sensitive indicators for monitoring contaminants as they can act as a sink and a carrier for pollutants in the aquatic environment (Benson and Etesin, 2008; Asefa and Beranu, 2016). The presence and behavior of metals in the natural water is a function of the substrate sediment composition, the suspended sediment composition, and the water chemistry (Suresh et al., 2012). Heavy metals are potentially accumulated in sediments and aquatic organisms in the fresh water environment and subsequently transferred to man through the food chain. As a result the concentration of heavy metals in aquatic ecosystems are usually scrutinized by measuring their concentrations in sediments (Ekeanyanwu et al., 2010; El Bouraie et al., 2010).
Nowadays, various indices are developed to assess the level of sediment contamination and ecological risk. Geo-accumulation index (Igeo), enrichment factor (EF), contamination factor (CF), and pollution load index (PLI) methods have been commonly used for geochemical standardization approaches (Müller, 1979). The presence of heavy metals in stream sediments has created an alarming situation that requires immediate attention. Thus, sediment analysis plays a vital role in evaluating the aquatic environment (S. Li and Zhang, 2010). However, information on metal concentrations in stream sediments at a spatial scale along a course of streams in the urban and semi-urban environment is insignificant. Hence, this study addresses existing research gaps and provides valuable information regarding the spatial distributions of selected heavy metals in the urban rivers around the Awetu watershed catchment. This paper discusses the concentrations of heavy metals (As, Cd, Cr, Pb, and Hg) in the surface sediments of four streams around the Awetu watershed catchment, comparing with the Sediment Quality Guidelines (SQGs), and assess the heavy metal contamination using the Igeo, CF, and PLI methods.
Awetu watershed encompasses Jimma City and the surrounding urban and semi-urban regions of southwestern Ethiopia. The streams under the Awetu watershed are receiving pollution from different sources, such as different laboratories of Jimma University, Jimma Medical Center, garages and carwashing points, untreated Jimma town municipal effluent, agricultural non-point source discharges, and animal feedlots. The watershed mainly contains four different streams, of which Awetu is the largest, which divides Jimma city into two while Dololo, Kito, and Boye are tributaries of Awetu stream. The major land-use activities in the Awetu watershed along with the site code and the coordinate points are listed in Table 1. Sampling sites were mapped using the ArcGIS 10.3 for Desktop (ESRI, Redlands, California, United States). Twenty surface integrated sediment samples were collected from each sampling point (Figure 1).
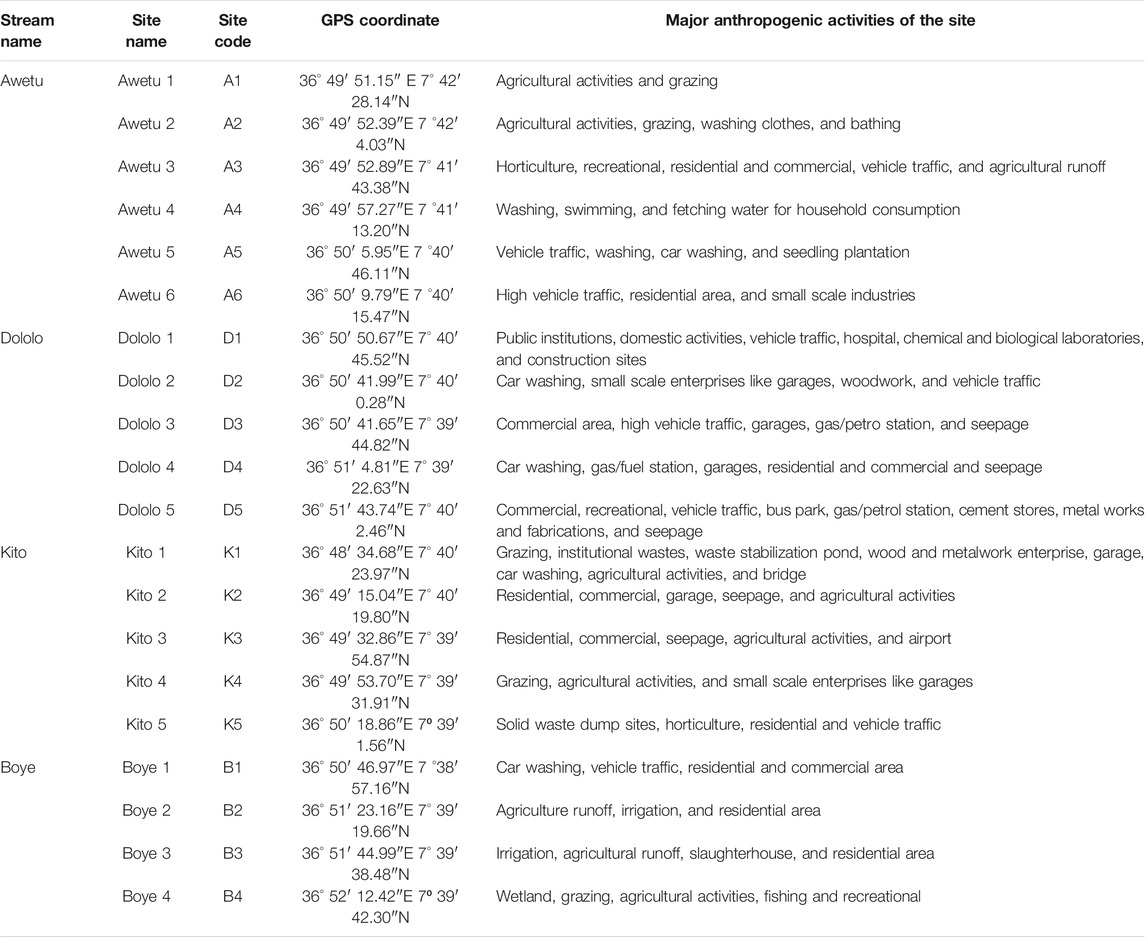
TABLE 1. Sampling stations and their code, GPS coordinates, and major anthropogenic activities in the Awetu watershed streams.
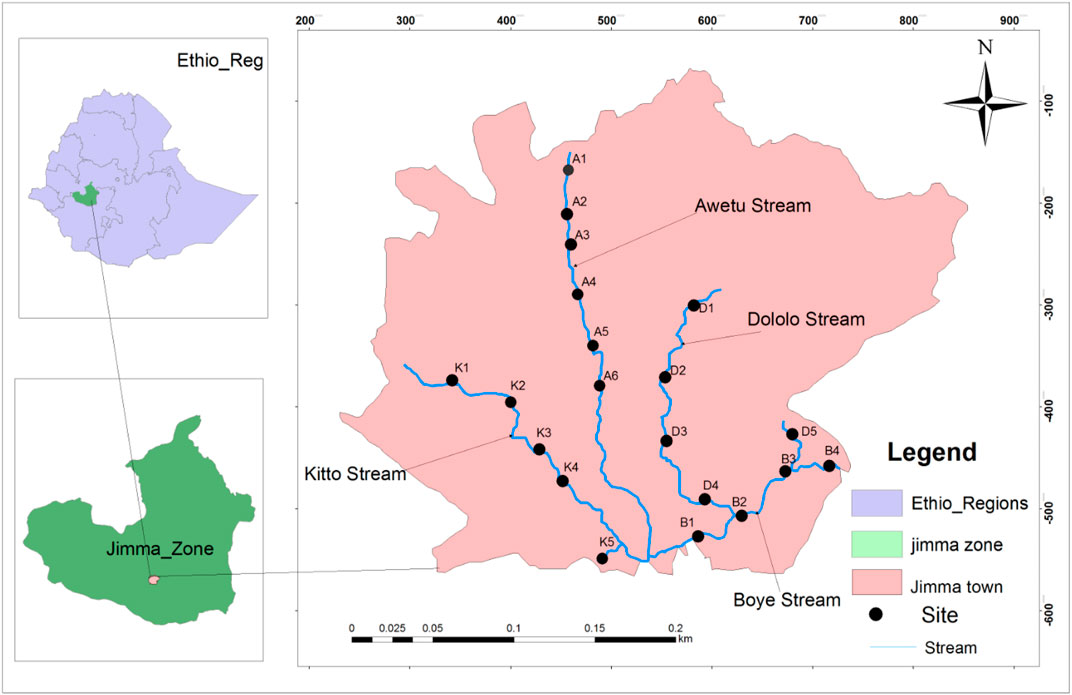
FIGURE 1. Map showing the study area and location of sampling sites in the streams of Awetu watershed.
Submerged surface integrated sediment samples collected from 20 sampling stations in the urban and semi-urban streams of the Awetu watershed are used. As described by Decena et al., 2018, each sample constituted a 0–15 cm depth of sediment collected using a stainless steel bottom sampling dredge (grab sampler). Different grain size of the sediments were considered and homogenized to keep the uniformity of samples collected from each sampling stations (Figure 2). The grab sampler was washed with detergent and rinsed with distilled water before each use to reduce possible contamination. Sediment samples were placed in a new polyethylene zip-lock bag and placed in a cooler with ice, transported to the Environmental Health Laboratory of Jimma University within a few hours sampling, and kept at 4°C until analysis. During sample collection, a hand-held GPS was used to identify the sites (Garmin eTrex®). The sediment samples were air-dried and ground using a pestle and mortar after homogenized. Cobles, pebbles, and other coarse debris were manually removed. Finally, the grounded samples were sieved to pass through 63 µm mesh size to obtain fine-powdered particles and placed in a clean polyethylene zip-lock bag. The processed samples were refrigerated at −20°C until further analysis.
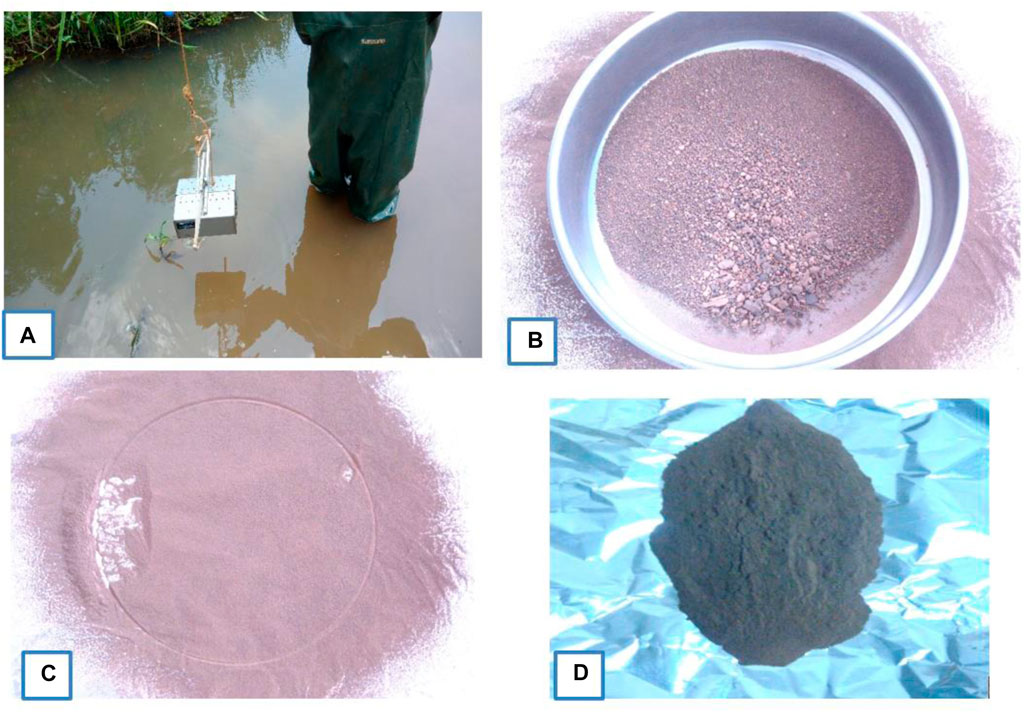
FIGURE 2. Sample collection and preparation of sediment samples in Awetu watershed streams.
A 0.25 g sediment sample was accurately weighed and placed in a dry and clean Teflon microwave digestion vessel and digested with 20 ml aqua regia (3 HNO3:1 HCl v/v) until the solution turned colorless in an open thermostatically controlled hot plate. The digest samples were heated near to dryness and cooled to ambient temperature. The beaker walls were rinsed with 10 ml de-ionized water, and 5 ml HCl were added, mixed, and heated. After that, filtration of the sample into a 50 ml volumetric flask using Whatman No. 42 filter paper was made. Then the digest was allowed to cool and transferred into a 100 ml standard flask and filled to the mark with de-ionized water. The digested samples were subjected to metal analysis using inductively coupled plasma optical emission spectrometry (ICP-OES) (SPECTRO ARCOS Model: ARCOS FHS12, Germany). The calibration curves obtained from concentration and absorbance were used to determine the level of heavy metals of each sample. Data were statistically analyzed using the fitting of a straight line (r > 0.999). A blank reading was used to make a necessary correction during the calculation of concentrations.
Different contamination indices were used to evaluate the findings with different standards. The contamination status of sediment was assessed based on the geo-accumulation index (Igeo), contamination factor (CF), and pollution load index (PLI) (Graça et al., 2002).
CF was used to determine the simple and effective tool in monitoring the level of heavy metal contamination at each site using the following formula (Graça et al., 2002).
Where Csample is the mean metal content in sample sediment, Cbackground is the mean natural background value of the metal. The natural background sample was collected from A1, which is about 10 km from the main areas where maximum anthropogenic activities are performed. This area is assumed to be free from the known anthropogenic source of selected heavy metals. The ratio of the measured concentration to the natural abundance of a given metal had been proposed as the index CF being classified into four grades for monitoring the pollution of a single metal over a period of time (Ali et al., 2016): low degree (CF < 1), moderate degree (1
PLI is used to evaluate sediment quality. PLI of the combined approaches of the five heavy metals were calculated according to (M. A. Islam et al., 2017). The PLI is defined as the nth root of the multiplications of the contamination factor of the target heavy metals (CF).
Where CF1 is the concentration of the first metal, CF2 is the concentration of the second metal, CF3 is the concentration of the third metal and CFn is the concentration of metal nth, and n = the total number of studied heavy metals in the sample. PLI = 0 indicates excellence; PLI = 1 suggests the presence of only a baseline level of pollutants and PLI > 1 indicates progressive deterioration of the site and estuarine quality (Tomlinson et al., 1980). The PLI evaluated the overall toxicity status of the sample and its contribution to the contribution of the five metals.
The degree of contamination from the heavy metals could be assessed by measuring the geo-accumulation index (Igeo). The index of geo-accumulation has been widely used for the assessment of sediment contamination (Islam et al., 2014). To characterize the level of heavy metal contamination in sediment samples, geo-accumulation index (Igeo) was calculated using the equation:
Where; Cn is the content of measured metal ‘‘n’’ in the samples, Bn is the crustal shale background content of the metal ‘‘n’’, the constant of 1.5 is introduced to minimize the variation of background values due to lithogenic origins, and Igeo is a quantitative index of metal enrichment or contamination levels.
Geo-accumulation index (Igeo) values were interpreted as Igeo ≤ 0 uncontaminated; 0 ≤ Igeo ≤ 1—uncontaminated to moderately contaminated; 1 ≤ Igeo ≤ 2—moderately contaminated; 2 < Igeo ≤ 3—moderately to heavily contaminated; 3 ≤ Igeo ≤ 4— heavily contaminated; 4 ≤ Igeo ≤ 5—heavily to extremely contaminated; and 5 < Igeo—extremely contaminated (Müller, 1979).
Heavy metal concentration data were log-transformed to reduce the variability and minimize outliers. R statistical package (R Core Team, 2019) was used to undertake a paired permutation test evaluating the presence of a statistically significant difference between the streams. To determine heavy metal concentrations variability among sediment samples between the urban and semi-urban sites, a one-way ANOVA was applied. Pearson’s correlation was made to examine the correlation between heavy metals and selected physicochemical properties. A probability of 0.05 was considered as a level of significance.
The quality of the analytical results is assured by laboratory quality assurance and quality control methods. These were implemented by pre-cleaning of laboratory materials with 10% HNO3, use of standard operating procedures, analysis of blanks, calibration with the standard, and recovery of known additions. Each heavy metal was analyzed in three replicates, and the results were presented as mean. The recovery percentages attained for the reference materials of sediment is between 97 and 120%, meeting the acceptable recovery of 80–120% recommended by the United States-EPA. In this study, the metal contents were measured according to dry weight to ensure consistency.
Heavy metals concentration in stream sediment indicates the magnitude of pollution in water ecosystems and the capacity to accumulate contaminants (Nowrouzi and Pourkhabbaz, 2014b). Speciation and bio-availability of heavy metals in aquatic ecosystems are strongly dependent on pH, and values <4 increase the toxicity of heavy metals (Edokpayi et al., 2016). The average pH values determined varied between 5.82 and 7.60, reflecting the availability of carbonate hosts in the area (Moore et al., 2011). Mobility of metal is also affected by pH, adsorption/desorption processes, salinity, sulfur, and carbonates (Giouri et al., 2010). Bottom sediments with a higher concentration of organic matter also influence the solubility and mobility of the heavy metals in the aquatic ecosystems (Journal et al., 2010). The formation of potential mobile metal dissolved organic carbon complexes under oxidizing conditions prevents metals from co-precipitation with or adsorbing to oxides of metallic ions (Du Laing et al., 2009).
Heavy metal concentrations in sediments of the Awetu watershed catchment channelized streams with different world standards are summarised in Table 2. The present study exposed all the heavy metals in stream sediment were found above the permissible limit set by WHO (1993) and EU (1998) (Bhuyan et al., 2017). A significant difference in the concentration of As, Cr, Cd, and Pb between streams was identified (p < 0.01).
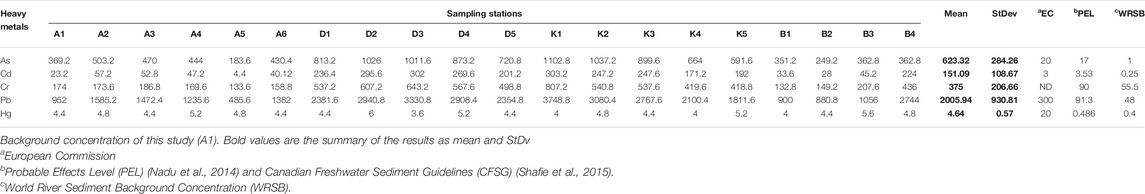
TABLE 2. Heavy metal concentrations (mg/kg) of sediment samples in comparison with different world standards.
The heavy metal concentration ranged from 183.60 to 1,102.80 mg/kg for As (mean 623.32 ± 291.65 mg/kg), 4.40–303.20 mg/kg for Cd (151.09 ± 111.5 mg/kg), 149.20–807.20 mg/kg for Cr (375 ± 212.03 mg/kg), 485.60–3,748.80 mg/kg for Pb (2005.94 ± 954.99 mg/kg) and 3.6–5.6 mg/kg for Hg (4.64 ± 0.59 mg/kg). The mean heavy metal concentration in the streams followed the decreasing order of Pb > As > Cr > Cd > Hg. As, Cr and Pb are detected at high concentrations with values of 623.32, 375.00 and 2,005.94 mg/kg respectively and the minimum concentration found is Hg with a value of 3.6 mg/kg.
The heavy metals concentrations of sediment samples from individual streams showed high variability where the Dololo stream was the highest for all studied heavy metals except Hg. The concentration of heavy metals in all stream sediments are by far higher than the Sediment Quality Guidelines (SQG) values set by World Rivers Khan et al., 2005), EC and PEL (Nadu et al., 2014), USEPA water quality criteria (Hahladakis and Smaragdaki, 2013), Canadian Freshwater Sediment Guidelines (Gergen et al., 2015), and World River Sediment Background Concentration (WRSB) concentration and background concentration of this study.
The highest concentrations of As were observed in D2, D3, K1, and K2 sampling sites where it is the center of the city at which maximum anthropogenic activities are experienced. Some of the heavy metal sources of pollution are the burning of fossil fuels, the use of arsenical fungicides, herbicides and insecticides in agriculture, and wood preservatives in woodwork enterprises (Shankar et al., 2014). The highest value of As is perceived at lower pH (5.82). The study supports this; pH is the most critical factor controlling arsenic speciation under oxidizing conditions and H2AsO4− is dominant at a lower value (pH < 6.9) (Smedley and Kinniburgh, 2001). The interchange in oxidation and solubility of arsenic species affects the environmental behavior and subsequent transportation of arsenic species in the aquatic ecosystems (Chatterjee et al., 2017).
The highest values of Cd are found at K1, D2, and D3 sampling sites. The value at K1 could be attributed to the direct influence of effluents coming from institutional wastes, garage, car-washing, and agricultural activities where phosphate fertilizer has been in use. The values at D2 and D3 sites could be attributed to commercial waste, high vehicle traffic, garages, gas/petrol stations, and seepage from chemical laboratories and public institutions. The high level of Cd in the sediment compared to its levels in the water is to be expected for sediments that have been described as a sink or reservoir for pollutants in water (Topi et al., 2012). The concentration of Cd from all sites is significantly different from the background concentrations (23.2 mg/kg). It is also significantly differ World River Sediment background concentrations by EC (3 mg/kg), PEL and CFSG (3.53 mg/kg), and WRSB (0.25 mg/kg) (Table 2).
The highest values of Cr are found at the K1 sampling site, which could be attributed to the direct influence of effluents coming from institutional wastes like seepage of laboratory and electroplating (Song et al., 2000; Baig et al., 2013). The high level of Cr (VI) in sediment is expected more than water, mainly in the mobile environment but has low mobility under moderately oxidizing and reducing conditions and nearly neutral pH (Decena et al., 2018) and discharged into the nearby natural waters bodies without treatment (Figure 3). Such contaminated environmental resources could be hazardous to humans, wildlife, and highly toxic to aquatic life (Olafisoye et al., 2013).
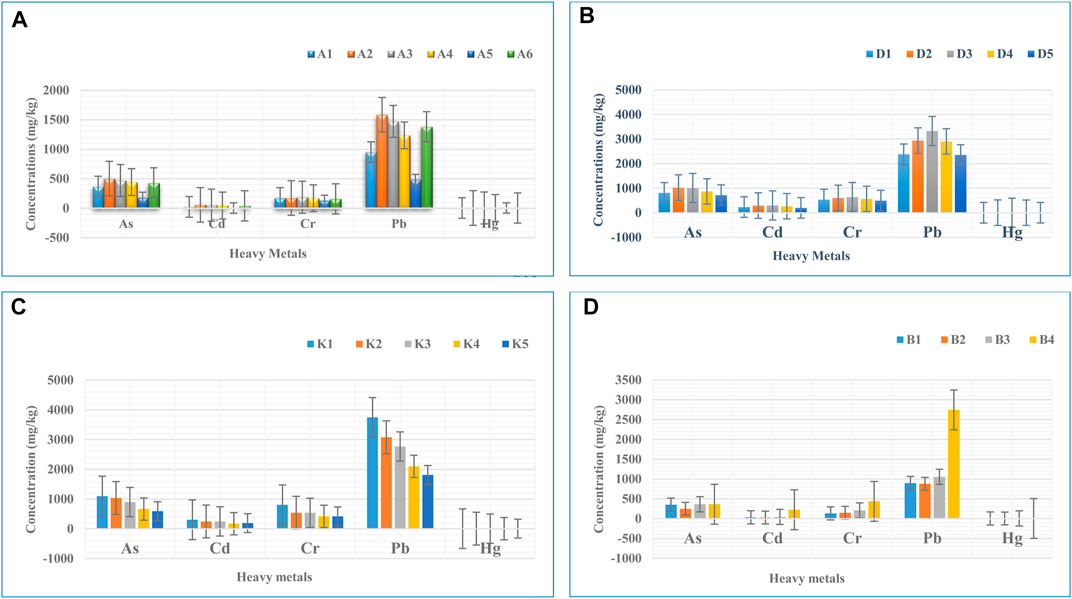
FIGURE 3. Mean metals contents in mg/kg (mean ± standard deviations) in sediments samples collected from stations in Awetu (A), Dololo (B), Kitto (C) and Boye (D) streams in Awetu watershed.
As explained on Figure 4, the highest values of Pb was recorded in Dololo (D1-D5), and Kito (K1-K3) streams with areas near intensive anthropogenic activities like garages, gasoline stations, chemical laboratories, and construction industries (Wuana and Okieimen, 2011). The other factors contributing to higher Pb concentrations might be due to the waste generated from public and private institutions released to the adjacent water bodies without treatment and old water pipelines (Adela et al., 2012). These values exceed the background concentrations of this study (952 mg/kg), EC (300 mg/kg), PEL and CFSG (91.3 mg/kg) and WRSB (48 mg/kg) guideline values (Nadu et al., 2014). Exposure to elevated concentration of Pb through drinking water or food may damage the kidney, increase blood pressure, and anemia (Basim and Khoshnood, 2016). Pb is a threat to public health even at very low concentrations because it usually bioaccumulates in the body. Specifically, it is essentially harmful to children under six and causes mental and physical retardation (Kathuria, 2017).
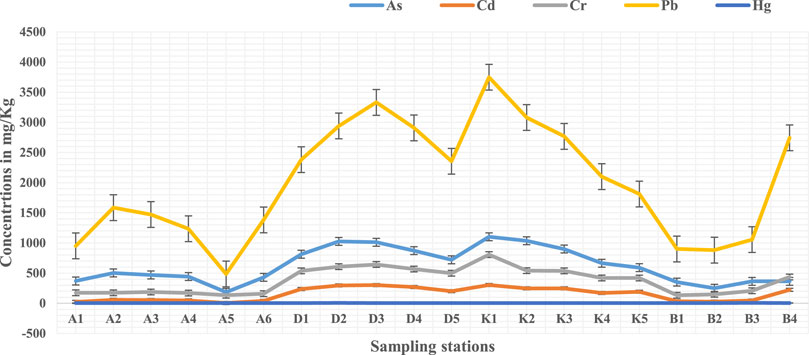
FIGURE 4. Mean metal contents in mg/kg (mean ± standard deviations) in sediments samples of the study area.
The highest values of Hg is recorded D2 (6 mg/kg) followed by B3 (5.6 mg/kg) and D4 (5.2 mg/kg). This might be due to the anthropogenic emission sources of mercury, mostly from solid wastes (municipal and medical) incineration (Wang et al., 2004). As shown in Table 2, these values exceeded the background concentrations of this study (4.4 mg/kg), PEL (0.486 mg/kg) and WRSB (0.4 mg/kg).
The concentration of heavy metals alone does not provide sufficient information on the mobility and potential toxicity of contaminants or their potentially harmful effects on the environment, because different chemicals can inactivate and promote synergistic effects. Igeo, CF, and PLI determine the potentially harmful effect of heavy metals in the environment (Table 3). These indices provide a basis for assessing the effects of sediment-associated contaminants in sediment compared to the values concerning each index (Moore et al., 2011).
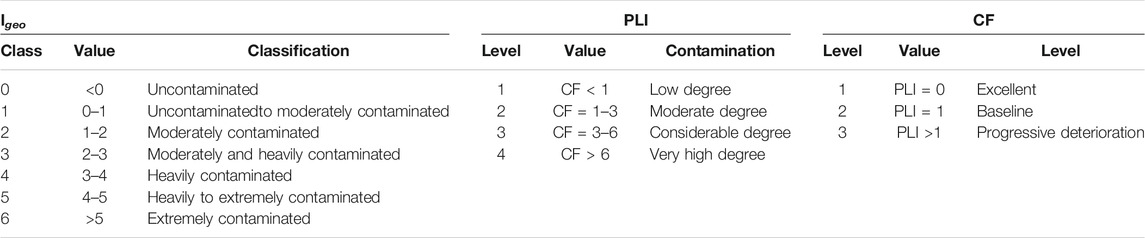
TABLE 3. Contamination categories based on a geo-accumulation index (Igeo), pollution load index (PLI), and contamination factor (CF).
Based on the Igeo values, As and Pb made moderate pollution (0), Cr moderately to heavily polluted, Cd extreme pollution, Hg unpolluted to moderately polluted in the Dololo stream (Table 4).
TABLE 4. Igeo values for heavy metals in surface sediments of Awetu watershed streams.
The CF and PLI values are indicated in Figure 5. These values for heavy metals in sediments are essential to monitoring the enrichment of a given metal over time (Ali et al., 2016). The results indicate that the CF of As in all streams except Boye (0.9) shows a moderate degree of pollution (1
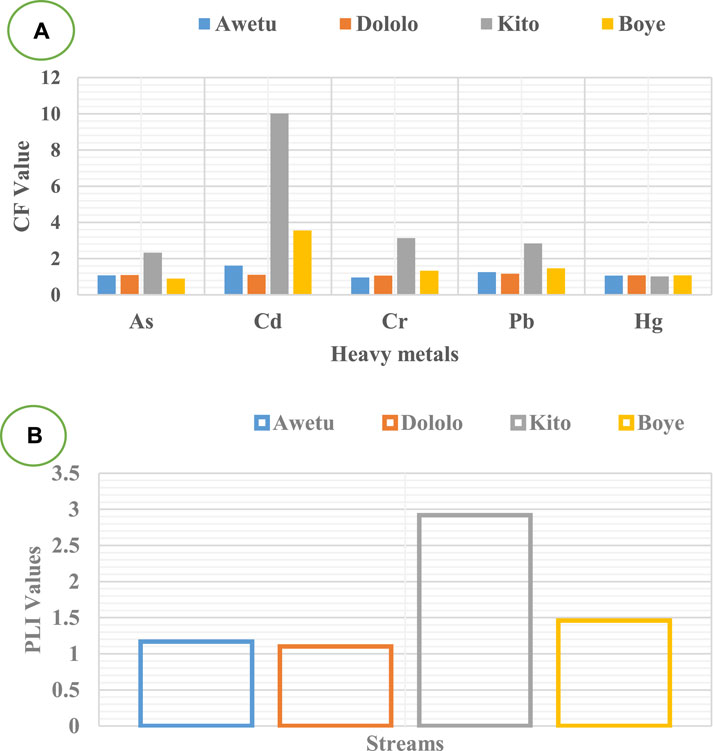
FIGURE 5. The results of CF (A) and PLI (B) in sampling stations of the study area.
The PLI values calculated for each stream revealed the decreasing order of contamination: Kito > Boye > Awetu > Dololo. All the studied streams were found to be polluted (PLI > 1), suggesting inputs from anthropogenic sources. PLI was found to increase in sediments downstream along with Boye and Awetu channelized streams. The Igeo of As shows practically unpolluted in Awetu and Boye, which shows a very low value (<0), unpolluted to moderately polluted in Kito (0–1), and moderately polluted in Dololo (1–2).
The Igeo values calculated for each stream of the studied metals is also indicated in table 4. Accordingly, the concentration level of As indicates unpolluted to moderately polluted status in Awetu and Boye (0–1) and moderately polluted in Dololo and kitto streams (1–2). Cd indicates unpolluted to moderately polluted status in Awetu (0–1), moderately polluted in Boye (1–2), moderately to heavily polluted in Kito (2–3), and extremely polluted in Dololo streams (>5). Cr shows practically unpolluted in Awetu and Boye (<0), moderately polluted in Kito (1–2), and moderately to heavily polluted in Dololo streams (3–4). Pb shows practically unpolluted in Awetu and Boye (<0), unpolluted to moderately polluted in Kito (1–2), and moderately polluted in Dololo (1–2) streams. Hg shows practically unpolluted in Awetu, Kito, and Boye streams (<0) and unpolluted to moderately polluted in the Dololo stream (0–1). The anthropogenic pressures largely contribute to the observed heavy metal concentrations rather than the mineralogical composition of the crust along the watershed. The higher values of Igeo were observed in samples from the Dololo stream as compared to other streams, which might be due to the kind and magnitude of anthropogenic pressures on the areas and differences in industrial and household waste management. However, both factors are likely to be the most significant cause of the observed differences. When compared with results from other developing nations, the concentrations measured in this study are much higher than rural and urban streams (Bai et al., 2011).
The box and whisker plot (Figure 6) indicates that relatively higher heavy metal concentrations were identified in the Dololo and Kito streams, except for Hg. Pairwise permutation test using R statistical package (R Core Team, 2019) showed no significant concentration difference between Awetu and Boye, and Dololo and Kito streams for As, Cd, and Cr concentrations between. These streams are known to receive wastewater discharges from Jimma University compasses. For example, the Dololo stream receives untreated wastewater discharge from the main campus and the Jimma Medical Center. Similarly, Kito stream receives the wastewater effluent from the waste stabilization pond of Jimma Institute of Technology. These campuses have different laboratories which could be a source of these contaminants. The highest level of electrical conductivity at Dololo, followed by Kito streams, could be a clear indication that the sources of contamination could be from those campuses. Though the further investigation of tracing which exact laboratory source from these campuses is crucial, this might be the possible reason why these two differently located streams showed a similar pattern of heavy metal contamination.
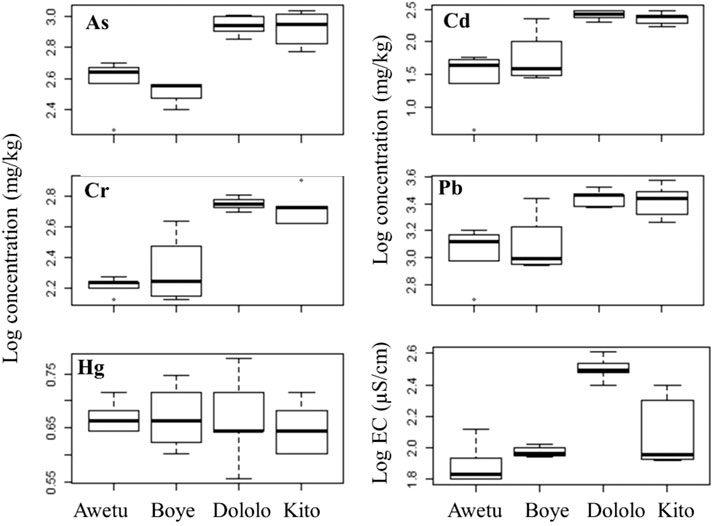
FIGURE 6. Box and whisker plot of heavy metals concentrations and level of electrical conductivity (EC) along with the different streams in Awetu watershed.
The interrelationship among metals in sediment of the aquatic environment provided important information on sources and pathways of variables (heavy metals). The result of bivariate correlations between parameters is shown in Table 5, 6. The elemental pairs, As and Cd (r = 0.901, p < 0.01); As and Cr (r = 0.916, p < 0.01); As and Pb (0.912, p < 0.01); Cd and Cr (0.978, p < 0.01); Cd and Pb (0.963, p < 0.01); Cr and Pb (r = 0.958, p < 0.01) showed significant positive correlation. This result might indicate that similar pollution sources of two or more heavy metals. The elemental association may signify that each paired elements have a common sink in the stream sediments discharged from municipal wastes and agricultural inputs (Bhuyan et al., 2017). Metal and physicochemical associations show pairs EC/As (r = 0.467, p < 0.05), EC/Cd (r = 0.484, p < 0.05) and EC/Cr (0.448, p < 0.05) are correlated with each other, whereas the rest are not significantly correlated. The positive correlations of heavy metals concentration of the sediment with EC might be attributed to anthropogenic impacts (Alghobar and Suresha, 2017). Turbidity has correlated with As (r = 0.574, p < 0.01), Cr (r = 0.513, p < 0.05) and Pb (r = 555, p < 0.05). DO and pH are negatively correlated with all studied heavy metals in the stream sediment, which significantly affects heavy metals (Sekabira et al., 2010). The concentrations of heavy metals were significantly correlated with pH (negatively), turbidity (positively) except for Hg (negatively).
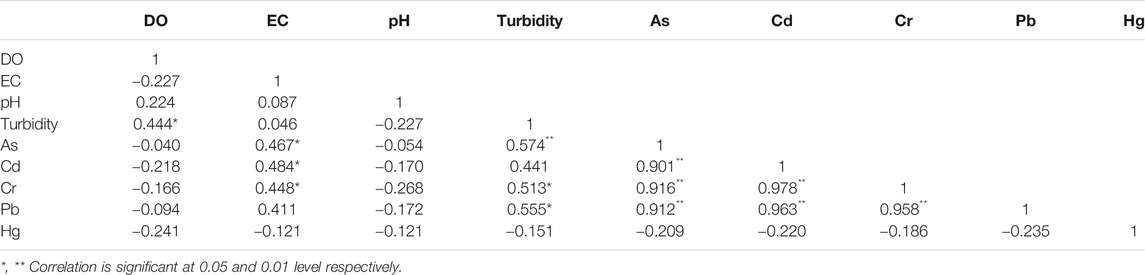
TABLE 5. Correlation between heavy metals, DO, EC, pH, and Turbidity in sediment (n = 20).
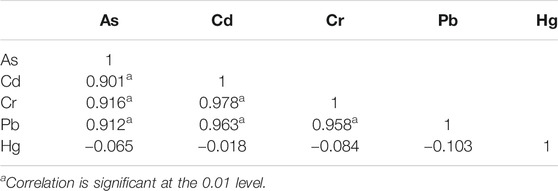
TABLE 6. Correlation between heavy metals in sediment (n = 20).
The absence of a significant correlation between the heavy metals and pH might be due to variation in sediment composition that implies, minerals are the only factors controlling the fixation of heavy metals (Ali et al., 2016). Other studies also showed that there is a significant variation in the concentrations of heavy metals based on the type of waste discharge at different sites (Nagajyoti et al., 2010). Heavy metals originate by their natural occurrence in soil and their concentrations depend on the rock type and environmental conditions, activating the weathering processes. Our findings showed elevated heavy metal concentration than many other published studies (Table 7). This indicates how much the aquatic environment and probably the biota is at risk of elevated heavy metal contamination.
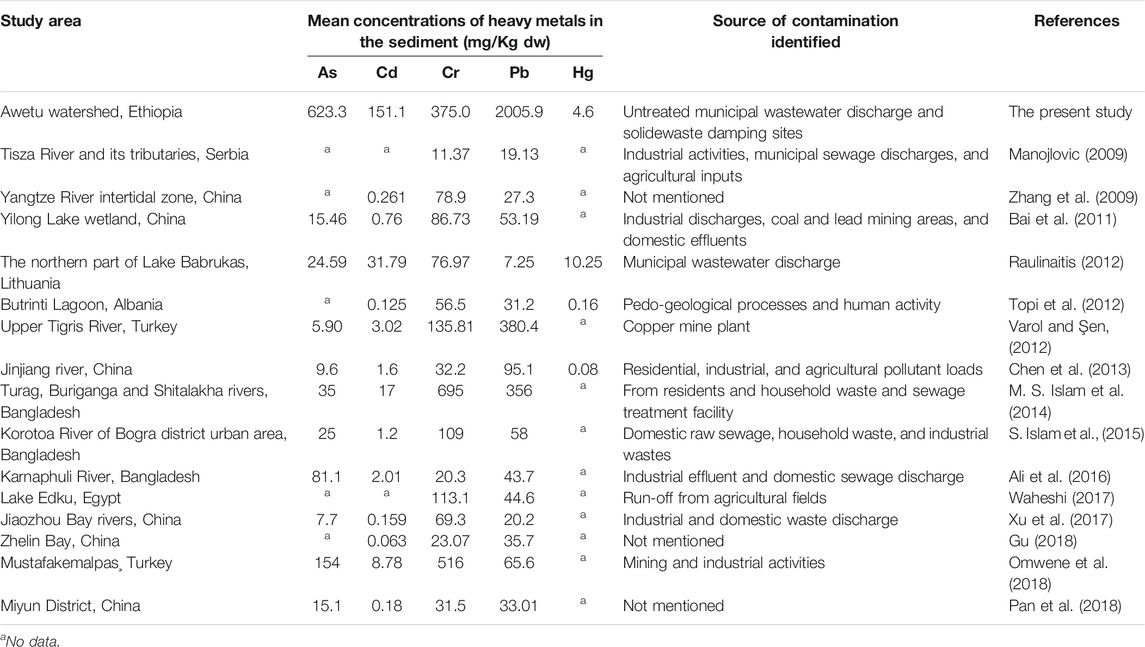
TABLE 7. Heavy metal concentrations in sediment samples from ou study and from other studies from river sediment.
Besides the teaching institutions' wastewater discharge, run-off and waste discharges from different sources, such as car washing facilities, hotels, garages are directly entering the stream system. This could be the main reason for the extremely exceeded Pb concentration than the other studies done in China, Turkey, and Bangladesh. Similarly, Liao et al. (2017) found that the concentrations of heavy metals were upto 120 fold than the background concentration, which was mainly sourced from mining activities. However, for our case, multiple sources of aquatic pollution might have contributed to these very high concentrations of heavy metals.
An investigation was made on sediments of streams from Awatu watershed that showed heavy metal contamination (As. Cd, Cr, Pb, and Hg) at various degrees in southwestern Ethiopia. The concentration of the metals in sediments decreased in the order of Pb > As > Cr > Cr > Hg. The concentrations of heavy metals in the streams of Awetu watershed sediments were remarkably high and varied among sampling points. The data analyses by Igeo, CF, and PLI values showed contamination of the sediments by all the studied heavy metals which exceeded the limits of average world concentration. Correlation analysis shows that heavy metals have common anthropogenic pollution sources that resulted in rapid urbanization and inappropriate waste discharge. As a result, the higher concentration level of heavy metals in sediment poses a risk of water pollution during sediment disturbance or changes in sediment chemistry, which eventually intermix and transferred easily with the water in the hydraulic movement. The results suggested that special attention must be given to the issue of heavy metal pollution since a considerable portion of elements in sediments is likely to release back into the water column. Therefore, public institution and commencial centers shold properly manage their waste discharge. Besides, authorities of in low income countries should inforce waste generating institutions to have waste treatment facilities before releasing to the environment. Studying seasonal influence of heavy meatal concentration in sedimets is recommended.
The raw data supporting the conclusions of this article will be made available by the authors, without undue reservation.
HA Conceived the idea, draft the methodology, collect and analyze samples, statistical analysis of the data AA Review the methodology made statistical analysis, reviewed and edited the manuscript EM Review the methodology, reviewed and edited the manuscript.
The authors declare that the research was conducted in the absence of any commercial or financial relationships that could be construed as a potential conflict of interest.
We are grateful for Jimma University for supporting data collection and laboratory work.
Adela, Y., Ambelu, A., and Tessema, D. A. (2012). Occupational lead Exposure Among Automotive Garage Workers - a Case Study for Jimma Town, Ethiopia. J. Occup. Med. Toxicol. 7, 15–19. doi:10.1186/1745-6673-7-15
Akele, M. L., Kelderman, P., Koning, C. W., and Irvine, K. (2016). Trace Metal Distributions in the Sediments of the Little Akaki River, Addis Ababa, Ethiopia. Environ. Monit. Assess. 188 (7), 389. doi:10.1007/s10661-016-5387-z
Alghobar, M. A., and Suresha, S. (2017). Evaluation of Metal Accumulation in Soil and Tomatoes Irrigated with Sewage Water from Mysore City, Karnataka, India. J. Saudi Soc. Agric. Sci. 16 (1), 49–59. doi:10.1016/j.jssas.2015.02.002
Ali, M. M., Ali, M. L., Islam, M. S., and Rahman, M. Z. (2016). Preliminary Assessment of Heavy Metals in Water and Sediment of Karnaphuli River, Bangladesh. Environ. Nanotechnology, Monit. Manag. 5, 27–35. doi:10.1016/j.enmm.2016.01.002
Aschale, M., Sileshi, Y., Kelly-Quinn, M., and Hailu, D. (2016). Evaluation of Potentially Toxic Element Pollution in the Benthic Sediments of the Water Bodies of the City of Addis Ababa, Ethiopia. J. Environ. Chem. Eng. 4 (4), 4173–4183. doi:10.1016/j.jece.2016.08.033
Asefa, W., and Beranu, T. (2016). Levels of Some Trace Metals in Fishes Tissues, Water and Sediment at Tendaho Water Reservoir, Afar Region, Ethiopia. J. Aquac. Res. Dev. 07 (01), 1–6. doi:10.4172/2155-9546.1000387
Bai, J., Cui, B., Chen, B., Zhang, K., Deng, W., Gao, H., et al. (2011). Spatial Distribution and Ecological Risk Assessment of Heavy Metals in Surface Sediments from a Typical Plateau lake Wetland, China. Ecol. Model. 222 (2), 301–306. doi:10.1016/j.ecolmodel.2009.12.002
Baig, J. A., Kazi, T. G., Elci, L., Afridi, H. I., Khan, M. I., and Naseer, H. M. (2013). Ultratrace Determination of Cr ( VI ) and Pb ( II ) by Microsample Injection System Flame Atomic Spectroscopy in Drinking Water and Treated and Untreated Industrial Effluents. J. Anal. Methods Chem. 2013, 629495. doi:10.1155/2013/629495
Basim, Y., and Khoshnood, Z. (2016). Target hazard Quotient Evaluation of Cadmium and lead in Fish from Caspian Sea. Toxicol. Ind. Health 32 (2), 215–220. doi:10.1177/0748233713498451
Benson, N. U., and Etesin, U. M. (2008). Metal Contamination of Surface Water, Sediment and Tympanotonus Fuscatus Var. Radula of Iko River and Environmental Impact Due to Utapete Gas Flare Station, Nigeria. Environmentalist 28 (3), 195–202. doi:10.1007/s10669-007-9127-3
Bhuyan, M. S., Bakar, M. A., Akhtar, A., Hossain, M. B., Ali, M. M., and Islam, M. S. (2017). Heavy Metal Contamination in Surface Water and Sediment of the Meghna River, Bangladesh. Environ. Nanotechnology, Monit. Manag. 8, 273–279. doi:10.1016/j.enmm.2017.10.003
Chatterjee, S., Moogoui, R., and Gupta, D. K. (2017). Arsenic Contamination in the Environment. Cham: Springer International Publishing. doi:10.1007/978-3-319-54356-7
Chen, H., Teng, Y., Wang, J., Song, L., and Zuo, R. (2013). Source Apportionment of Trace Element Pollution in Surface Sediments Using Positive Matrix Factorization Combined Support Vector Machines: Application to the Jinjiang River, China. Biol. Trace Elem. Res. 151, 462–470. doi:10.1007/s12011-012-9576-5
Decena, S. C., Arguilles, M., and Robel, L. (2018). Assessing Heavy Metal Contamination in Surface Sediments in an Urban River in the Philippines. Pol. J. Environ. Stud. 27 (5), 1983–1995. doi:10.15244/pjoes/75204
Du Laing, G., Rinklebe, J., Vandecasteele, B., Meers, E., and Tack, F. M. G. (2009). Trace Metal Behaviour in Estuarine and Riverine Floodplain Soils and Sediments: A Review. Sci. Total Environ. 407 (13), 3972–3985. doi:10.1016/j.scitotenv.2008.07.025
Edokpayi, J., Odiyo, J., Popoola, O., and Msagati, T. (2016). Assessment of Trace Metals Contamination of Surface Water and Sediment: A Case Study of Mvudi River, South Africa. Sustainability 8 (2), 135. doi:10.3390/su8020135
Ekeanyanwu, C. R., Ogbuinyi, C. A., and Etienajirhevwe, O. F. (2010). Trace Metals Distribution in Fish Tissues, Bottom Sediments and Water from Okumeshi River in Delta State, Nigeria. Ethiopian J. Environ. Stud. Manag. 3 (3), 12–17. doi:10.4314/ejesm.v3i3.63959
Evans, G., Howarth, R. J., and Nombela, M. A. (2003). Metals in the sediments of Ensenada de San Simón (inner Rı́a de Vigo), Galicia, NW Spain. Appl. Geochem. 18 (7), 12–17. doi:10.1016/S0883-2927(02)00203-2
Gergen, I., Harmanescu, M., Basim, Y., Khoshnood, Z., Journal, I., Environmental, O. F., et al. (2015). No Title. J. Hazard. Mater. 16 (1), 1–5. doi:10.1007/978-94-007-0253-0
Giouri, A., Christophoridis, C., Melfos, V., and Vavelidis, M. (2010). ASSESSMENT OF HEAVY METALS CONCENTRATIONS IN SEDIMENTS OF BOGDANAS RIVER AT THE ASSIROS-LAGADAS AREA. 100, 63–70.
Giridharan, L., Venugopal, T., and Jayaprakash, M. (2008). Evaluation of the Seasonal Variation on the Geochemical Parameters and Quality Assessment of the Groundwater in the Proximity of River Cooum, Chennai, India. Environ. Monit. Assess. 143, 161–178. doi:10.1007/s10661-007-9965-y
Graça, M. A., Pardal, M. Â., and Marques, J. C. (2002). Aquatic Ecology of the Mondego River basin Global Importance of Local Experience. coimbra: Imprensa da Universidade de Coimbra, 576. doi:10.14195/978-989-26-0336-0
Gu, Y.-G. (2018). Heavy Metal Fractionation and Ecological Risk Implications in the Intertidal Surface Sediments of Zhelin Bay, South China. Mar. Pollut. Bull. 129 (2), 905–912. doi:10.1016/j.marpolbul.2017.10.047
Hahladakis, J., Smaragdaki, E., Vasilaki, G., and Gidarakos, E. (2013). Use of Sediment Quality Guidelines and Pollution Indicators for the Assessment of Heavy Metal and PAH Contamination in Greek Surficial Sea and lake Sediments. Environ. Monit. Assess. 185, 2843–2853. doi:10.1007/s10661-012-2754-2
Islam, M. A., Romić, M. A., and Romić, M. (2017). Trace Metals Accumulation in Soil Irrigated with Polluted Water and Assessment of Human Health Risk from Vegetable Consumption in Bangladesh. Environ. Geochem. Health 40, 59–85. doi:10.1007/s10653-017-9907-8
Islam, M. S., Ahmed, M. K., Raknuzzaman, M., Habibullah -Al- Mamun, M., and Islam, M. K. (2015). Heavy Metal Pollution in Surface Water and Sediment: A Preliminary Assessment of an Urban River in a Developing Country. Ecol. Indicators 48, 282–291. doi:10.1016/j.ecolind.2014.08.016
Islam, M. S., Han, S., Ahmed, M. K., and Masunaga, S. (2014). Assessment of Trace Metal Contamination in Water and Sediment of Some Rivers in Bangladesh. J. Wat. ^|^ Envir. Tech. 12 (2), 109–121. doi:10.2965/jwet.2014.109
Jaishankar, M., Tseten, T., Anbalagan, N., Mathew, B. B., and Beeregowda, K. N. (2014). Toxicity, Mechanism and Health Effects of Some Heavy Metals. Interdiscip. Toxicol. 7 (2), 60–72. doi:10.2478/intox-2014-0009
Kathuria, P. (2017). “Video Capturing and Streaming over Ad-Hoc Networks,” in 2017 International Conference on Big Data Analytics and Computational Intelligence (ICBDAC), Chirala, Andhra Pradesh, India, 23-25 March 2017 (IEEE), 1–6. doi:10.1109/icbdaci.2017.8070867
Khan, M. Z. H., Hasan, M. R., Khan, M., Aktar, S., and Fatema, K. (2017). Distribution of Heavy Metals in Surface Sediments of the bay of Bengal Coast. J. Toxicol. 2017, 1–7. doi:10.1155/2017/9235764
Khan, R., Israili, S. H., Ahmad, H., and Mohan, A. (2005). Heavy Metal Pollution Assessment in Surface Water Bodies and its Suitability for Irrigation Around the Neyevli lignite Mines and Associated Industrial Complex, Tamil Nadu, India. Mine Water Environ. 24 (3), 155–161. doi:10.1007/s10230-005-0087-x
Li, S., and Zhang, Q. (2010). Risk Assessment and Seasonal Variations of Dissolved Trace Elements and Heavy Metals in the Upper Han River, China. J. Hazard. Mater. 181 (1–3), 1051–1058. doi:10.1016/j.jhazmat.2010.05.120
Li, Y., Li, C.-k., Tao, J.-j., and Wang, L.-d. (2011). Study on Spatial Distribution of Soil Heavy Metals in Huizhou City Based on BP--ANN Modeling and GIS. Proced. Environ. Sci. 10, 1953–1960. doi:10.1016/j.proenv.2011.09.306
Liao, J., Chen, J., Ru, X., Chen, J., Wu, H., and Wei, C. (2017). Heavy Metals in River Surface Sediments Affected with Multiple Pollution Sources, South China: Distribution, Enrichment and Source Apportionment. J. Geochemical Exploration 176, 9–19. doi:10.1016/j.gexplo.2016.08.013
Manojlovic, D. D., Sakan, S. M., Dordević, D. S., and Predrag, P. S. (2009). Assessment of Heavy Metal Pollutants Accumulation in the Tisza River Sediments. J. Environ. Manage. 90, 3382–3390. doi:10.1016/j.jenvman.2009.05.013
Melaku, S., Wondimu, T., Dams, R., and Moens, L. (2007). Pollution Status of Tinishu Akaki River and its Tributaries (ethiopia) Evaluated Using Physico-Chemical Parameters, Major Ions, and Nutrients. Bull. Chem. Soc. Eth. 21 (1), 13–22. doi:10.4314/bcse.v21i1.61364
Moore, F., Esmaeili, K., and Keshavarzi, B. (2011). Assessment of Heavy Metals Contamination in Stream Water and Sediments Affected by the Sungun Porphyry Copper Deposit, East Azerbaijan Province, Northwest Iran. Water Qual. Expo. Health 3, 37–49. doi:10.1007/s12403-011-0042-y
Müller, V. G. (1979). Schwermetalle in den Sedimenten des Rheins- Veränderungen seit 1971. Umschau 79, 778–783. doi:10.1055/s-2007-1023171
Nadu, T., Khan, R., Israili, S. H., Ahmad, H., and Mohan, A. (2014). Heavy Metal Pollution Assessment in Surface Water Bodies and its Suitability for Irrigation Around the Neyevli Lignite Mines and Associated Industrial. Mine Water Environ. 24, 155–161. doi:10.1007/s10230-005-0087-x
Nagajyoti, P. C., Lee, K. D., and Sreekanth, T. V. M. (2010). Heavy Metals, Occurrence and Toxicity for Plants: A Review. Environ. Chem. Lett. 8 (3), 199–216. doi:10.1007/s10311-010-0297-8
Nowrouzi, M., and Pourkhabbaz, A. (2014a). Application of Geoaccumulation index and Enrichment Factor for Assessing Metal Contamination in the Sediments of Hara Biosphere Reserve, Iran. Chem. Speciation Bioavailability 26 (2), 99–105. doi:10.3184/095422914X13951584546986
Nowrouzi, M., and Pourkhabbaz, A. (2014b). Application of Geoaccumulation index and Enrichment Factor for Assessing Metal Contamination in the Sediments of Hara Biosphere Reserve, Iran. Chem. Speciation Bioavailability 26 (2), 99–105. doi:10.3184/095422914X13951584546986
Olafisoye, O. B., Adefioye, T., and Osibote, O. A. (2013). Heavy Metals Contamination of Water. Soil , Plants around Electron. Waste Dumpsite 22 (5), 1431–1439.
Omwene, P. I., Öncel, M. S., Çelen, M., and Kobya, M. (2018). Heavy Metal Pollution and Spatial Distribution in Surface Sediments of Mustafakemalpaşa Stream Located in the World's Largest Borate basin (Turkey). Chemosphere 208, 782–792. doi:10.1016/j.chemosphere.2018.06.031
Pan, L., Fang, G., Wang, Y., Wang, L., Su, B., Li, D., et al. (2018). Potentially Toxic Element Pollution Levels and Risk Assessment of Soils and Sediments in the Upstream River, Miyun Reservoir, China. Ijerph 15 (11), 2364. doi:10.3390/ijerph15112364
Reda, A. H., and Ayu, A. A. (2016). Accumulation and Distribution of Some Selected Heavy Metals in Both Water and Some Vital Tissues of Two Fish Species from Lake Chamo Ethiopia. Int. J. Fish. Aquat. Stud. 4, 6–12.
Sany, S. B. T., Salleh, A., Sulaiman, A. H., Sasekumar, A., Rezayi, M., and Tehrani, G. M. (2013). Heavy Metal Contamination in Water and Sediment of the Port Klang Coastal Area, Selangor, Malaysia. Environ. Earth Sci. 69 (6), 2013–2025. doi:10.1007/s12665-012-2038-8
Sekabira, K., Origa, H. O., Basamba, T. A., Mutumba, G., and Kakudidi, E. (2010). Assessment of Heavy Metal Pollution in the Urban Stream Sediments and its Tributaries. Int. J. Environ. Sci. Technol. 7 (3), 435–446. doi:10.1007/bf03326153
Shafie, N. A., Aris, A. Z., and Haris, H. (2015). Geoaccumulation and Distribution of Heavy Metals in the Urban River Sediment. Int. J. Sediment Res. 29 (3), 368–377. doi:10.1016/S1001-6279(14)60051-2
Shankar, S., Shanker, U., and Shikha, (2014). Arsenic Contamination of Groundwater: A Review of Sources, Prevalence, Health Risks, and Strategies for Mitigation. Scientific World J. 2014, 1–18. doi:10.1155/2014/304524
Sharma, H., Blessy, B. M., and Neetu, R. (2015). The Characteristics, Toxicity and Effects of Cadmium. Int. J. Nanotechnology Nanoscience 3, 1–9.
Sim, S. F., Ling, T. Y., Nyanti, L., Gerunsin, N., Wong, Y. E., and Kho, L. P. (2016). Assessment of Heavy Metals in Water, Sediment, and Fishes of a Large Tropical Hydroelectric Dam in Sarawak, Malaysia. J. Chem. 2016, 1–10. doi:10.1155/2016/8923183
Smedley, P. L., and Kinniburgh, D. G. (2001). “Source and Behaviour of Arsenic in Natural Waters Importance of Arsenic in Drinking Water,” in United Nations Synthesis Report on Arsenic in Drinking Water (Geneva, Switzerland: World Health Organization), 1–60. doi:10.1055/s-0030-1270755
Song, Z., Williams, C. J., and Edyvean, R. G. J. (2000). Sedimentation of Tannery Wastewater. Water Res. 34 (7), 2171–2176. doi:10.1016/S0043-1354(99)00358-9
Suresh, G., Sutharsan, P., Ramasamy, V., and Venkatachalapathy, R. (2012). Assessment of Spatial Distribution and Potential Ecological Risk of the Heavy Metals in Relation to Granulometric Contents of Veeranam lake Sediments, India. Ecotoxicology Environ. Saf. 84, 117–124. doi:10.1016/j.ecoenv.2012.06.027
Tomlinson, D. L., Wilson, J. G., Harris, C. R., and Jeffrey, D. W. (1980). Problems in the Assessment of Heavy-Metal Levels in Estuaries and the Formation of a Pollution index. Helgolander Meeresunters 33 (1–4), 566–575. doi:10.1007/BF02414780
Topi, T., Bani, A., Malltezi, J., and Sulce, S. (2012). Heavy Metals in Soil, Sediments, Mussels, and Water from Butrinti Lagoon (Albania). Fresenius Environ. Bull. 21 (10 A), 3042–3051.
Varol, M., and Şen, B. (2012). Assessment of Nutrient and Heavy Metal Contamination in Surface Water and Sediments of the Upper Tigris River, Turkey. Catena 92, 1–10. doi:10.1016/j.catena.2011.11.011
Waheshi, Y. A. A. (2017). Distribution and Assessment of Heavy Metal Levels Using Geoaccumulation Index and Pollution Load Index in Lake Edku Sediments, Egypt. Ijema 5 (1), 1. doi:10.11648/j.ijema.20170501.11
Wang, Q., Kim, D., Dionysiou, D. D., Sorial, G. A., and Timberlake, D. (2004). Sources and Remediation for Mercury Contamination in Aquatic Systems-A Literature Review. Environ. Pollut. 131 (2), 323–336. doi:10.1016/j.envpol.2004.01.010
Woldetsadik, D., Drechsel, P., Keraita, B., Itanna, F., and Gebrekidan, H. (2017). Heavy Metal Accumulation and Health Risk Assessment in Wastewater-Irrigated Urban Vegetable Farming Sites of Addis Ababa, Ethiopia. FoodContamination 4 (1), 9. doi:10.1186/s40550-017-0053-y
Wuana, R. A., and Okieimen, F. E. (2011). Heavy Metals in Contaminated Soils: A Review of Sources, Chemistry, Risks and Best Available Strategies for Remediation. ISRN Ecol. 2011, 1–20. doi:10.5402/2011/402647
Xu, F., Liu, Z., Cao, Y., Qiu, L., Feng, J., Xu, F., et al. (2017). Assessment of Heavy Metal Contamination in Urban River Sediments in the Jiaozhou Bay Catchment, Qingdao, China. Catena 150, 9–16. doi:10.1016/j.catena.2016.11.004
Zhang, W., Feng, H., Chang, J., Qu, J., Xie, H., and Yu, L. (2009). Heavy Metal Contamination in Surface Sediments of Yangtze River Intertidal Zone: An Assessment from Different Indexes. Environ. Pollut. 157 (5), 1533–1543. doi:10.1016/j.envpol.2009.01.007
Keywords: Awetu watershed, contamination, Ethiopia, heavy metals, sediment
Citation: Astatkie H, Ambelu A and Mengistie E (2021) Contamination of Stream Sediment With Heavy Metals in the Awetu Watershed of Southwestern Ethiopia. Front. Earth Sci. 9:658737. doi: 10.3389/feart.2021.658737
Received: 26 January 2021; Accepted: 05 July 2021;
Published: 19 July 2021.
Edited by:
Daniel R. Parsons, University of Hull, United KingdomReviewed by:
Mike Rogerson, University of Hull, United KingdomCopyright © 2021 Astatkie, Ambelu and Mengistie. This is an open-access article distributed under the terms of the Creative Commons Attribution License (CC BY). The use, distribution or reproduction in other forums is permitted, provided the original author(s) and the copyright owner(s) are credited and that the original publication in this journal is cited, in accordance with accepted academic practice. No use, distribution or reproduction is permitted which does not comply with these terms.
*Correspondence: Argaw Ambelu, aambelu@yahoo.com
Disclaimer: All claims expressed in this article are solely those of the authors and do not necessarily represent those of their affiliated organizations, or those of the publisher, the editors and the reviewers. Any product that may be evaluated in this article or claim that may be made by its manufacturer is not guaranteed or endorsed by the publisher.
Research integrity at Frontiers
Learn more about the work of our research integrity team to safeguard the quality of each article we publish.