 Liliek Triyono
 Rahmat Gernowo1
- 1Doctoral Program of Information System, Diponegoro University, Central Java, Semarang, Indonesia
- 2Department of Electrical Engineering, Politeknik Negeri Semarang, Semarang, Indonesia
Aruco markers are crucial for navigation in complex indoor environments, especially for those with visual impairments. Traditional CNNs handle image segmentation well, but transformers excel at capturing long-range dependencies, essential for machine vision tasks. Our study introduces MoNetViT (Mini-MobileNet MobileViT), a lightweight model combining CNNs and MobileViT in a dual-path encoder to optimize global and spatial image details. This design reduces complexity and boosts segmentation performance. The addition of a multi-query attention (MQA) module enhances multi-scale feature integration, allowing end-to-end learning guided by ground truth. Experiments show MoNetViT outperforms other semantic segmentation algorithms in efficiency and effectiveness, particularly in detecting Aruco markers, making it a promising tool to improve navigation aids for the visually impaired.
1 Introduction
Navigating independently is a major challenge for individuals with visual impairments. It affects their ability to perform daily tasks and limits their involvement in social and economic activities. This challenge reduces their personal autonomy and impacts their overall quality of life. Indoor navigation issues for visually impaired individuals persist, as current solutions frequently do not overcome critical limits. Conventional GPS is inadequate inside due to signal interference, requiring alternative systems such as beacon-based technologies and smartphone applications that employ digital maps (Theodorou et al., 2022; Kubota, 2024). Nonetheless, these systems frequently depend on pre-existing maps, which are not universally accessible, hence constraining their efficacy (Kubota, 2024).
The intricacy of interior environments exacerbates the problem, as visually impaired individuals encounter challenges in traversing unfamiliar settings due to ambiguous aural or tactile signals and various impediments (Jeamwatthanachai et al., 2019; Fernando et al., 2023). Although systems such as Snap&Nav provide navigation solutions through the creation of node maps, their dependence on sighted aid diminishes user autonomy (Kubota, 2024). Moreover, the computing requirements of contemporary models provide difficulties. Advanced algorithms and machine learning techniques enhance obstacle identification and route planning but frequently necessitate substantial processing resources, rendering them impractical for mobile applications (Tao and Ganz, 2020; Shah et al., 2023). The integration of IoT and cloud computing introduces additional complexity, emphasizing the necessity for lightweight, dependable systems designed for visually impaired users (Messaoudi et al., 2020). Rectifying these deficiencies is essential for the advancement of inclusive indoor navigation solutions.
Recent research has increasingly focused on developing advanced navigation aids to support visually impaired individuals in both indoor and outdoor environments. Technologies such as deep learning, machine vision, wearable devices, and mobile applications have been leveraged to enhance navigation capabilities, offering promising solutions to this pervasive issue (Bai et al., 2019; El-taher et al., 2021; Kuriakose et al., 2021; Martínez-Cruz et al., 2021).
The importance of developing an effective navigation assistance system for visually impaired individuals, particularly in obstacle-filled indoor environments, cannot be overstated. These environments present unique challenges that require sophisticated solutions capable of providing accurate and real-time guidance. The integration of advanced AI models, such as MobileNetV2 and MobileViTV2, along with multi-query attention mechanisms, has shown potential in creating robust and efficient navigation systems. These models aim to empower visually impaired individuals, allowing them to navigate unfamiliar spaces with confidence and independence (Wang et al., 2019).
The main research problem addressed in this study is the development of an independent navigation model that improves the accuracy and efficiency of detecting and interpreting navigation markers under extreme conditions for people with visual impairment. Traditional navigation systems often fall short in complex, obstacle-filled indoor environments, necessitating the need for a more advanced solution. This research proposes integrating MobileNetV2 and MobileViTV2 methods, enhanced by multi-query attention mechanisms, to develop a navigation model that provides precise and reliable assistance, thereby improving the quality of life for visually impaired individuals.
The integration of MobileNetV2 and MobileViTV2 methods represents a cutting-edge approach to developing an independent navigation model for the visually impaired. MobileNetV2, introduced by Sandler et al. (2018), is designed to operate efficiently on mobile and embedded devices, making it highly suitable for real-time applications. Its architecture employs inverted residuals and linear bottlenecks, which help maintain high accuracy while reducing computational demands. This efficiency is crucial for applications requiring portability and immediate response, such as navigation aids for visually impaired individuals.
On the other hand, MobileViTV2, as explored by Chen et al. (2021), utilizes vision transformers to enhance the model’s capability to understand visual contexts. Vision transformers are adept at capturing long-range dependencies within images, providing a more comprehensive interpretation of complex scenes. The integration of these technologies, combined with multi-query attention mechanisms as highlighted by Mehta and Apple (2022), allows the model to focus on multiple aspects of the visual input simultaneously. This multifaceted attention mechanism is instrumental in improving the accuracy and timeliness of navigation instructions, thus providing a significant advancement over existing models.
Existing research on navigation aids for visually impaired individuals has explored a variety of technological solutions, ranging from GPS-based applications to wearable devices and computer vision techniques. Studies like those by Martínez-Cruz et al. (2021) and El-taher et al. (2021) have highlighted the limitations of GPS in indoor environments and the bulkiness of wearable devices, respectively. These limitations underscore the need for more refined and user-friendly solutions. The integration of deep learning models, such as those using CNNs, has shown promise; however, these models often require substantial computational resources, limiting their practicality in mobile settings (Bai et al., 2019).
The recent development of efficient models like MobileNetV2 and vision transformers like MobileViTV2 addresses some of these challenges by offering high accuracy with reduced computational demands. However, a gap remains in the effective integration of these technologies to develop a comprehensive navigation system that is both lightweight and capable of real-time processing. Additionally, the potential benefits of multi-query attention mechanisms in enhancing the focus and accuracy of these models have not been fully explored. This gap presents an opportunity to develop a novel, integrated solution that leverages these advanced techniques for improved navigation assistance.
The aim of this research is to develop a new navigation model for visually impaired individuals by combining MobileNetV2 and MobileViTV2 with multi-query attention mechanisms. The hypothesis is that this AI model will improve both the accuracy and efficiency of Aruco marker detection under challenging conditions compared to existing models. This advancement is expected to offer reliable navigation assistance in indoor environments, enhancing the quality of life for visually impaired users. The study focuses on designing, implementing, and evaluating the model, with future work aimed at refining fusion mechanisms, reducing model complexity, and exploring transfer learning to maintain high accuracy while minimizing computational demands.
Following a brief introduction of the problem statement and the proposed method, the rest of the paper is structured as follows: Section 2 outlines the research methodology used to conduct the study. In Section 3, we present the search results obtained from the research. Section 4 discusses the findings related to multi-scale features and the various combinations of MQA and FFM used to improve model segmentation of multi-class ArUco markers. Finally, the conclusion of the paper is provided in Section 5.
2 Methods
2.1 Transformer and CNNs
CNNs have demonstrated exceptional performance in various image segmentation tasks, showcasing their robust feature representation capabilities. However, despite these strengths, CNN-based methods frequently encounter limitations in modeling long-range relationships. A primary issue is their inefficiency in capturing global context information. Methods that rely on stacking receptive fields necessitate continuous downsampling convolution operations, leading to deeper networks. Training such deep neural networks on small datasets can present significant challenges, including training instability and overfitting. Overfitting is particularly common in deep learning models due to their strong expressive ability relative to traditional models (Zhang et al., 2023). Non-local attention mechanisms have been increasingly utilized in various fields to address challenges related to capturing long-range dependencies and global information (Mei et al., 2020; Huang et al., 2022; Abozeid et al., 2023; Zhou et al., 2023). While these mechanisms can enhance the network’s ability to capture global context, they also introduce considerable computational complexity. This complexity, which is quadratic in relation to the input size, often renders these methods impractical for high-resolution images.
Attention mechanisms were utilized in numerous research that focused on integrating Convolutional Neural Networks. Especially to further enhance the output processing of CNNs. Various visual tasks were implemented with integrated approaches, including video processing (Qi and Zhang, 2023; Sun et al., 2022; Mujtaba et al., 2022), image classification (Dosovitskiy et al., 2021; Liu et al., 2021), and object detection (Benmouna et al., 2023; Wen et al., 2023).
The transformer in natural language processing used transformation tasks (Vaswani et al., 2023). Several natural language processing activities have since shifted to using it. Some natural language processing activities have switched to using ViT. Pre-training on very large datasets is required for ViT (Chen et al., 2023; Misawa et al., 2024). To the State of the Art in the natural image segmentation task, Imagenet replaced the encoder component of the decoding network with a transformer (Doppalapudi, 2023; Xia and Kim, 2023).
Although transformer-based models have demonstrated impressive skills in diverse visual tasks, they have not yet attained acceptable results when compared to traditional CNNs. Transformer designs still exhibit worse performance in visual tasks compared to similarly-sized CNNs, such as EfficientNet (Thakur et al., 2023). The computational cost of transformers based on the mechanism of self-attention is , in contrast to the convolution-based CNNs (Zhou et al., 2024). Therefore, employing the transformer for image-related activities will unavoidably need a substantial amount of GPU resources.
2.2 Image segmentation using transformer and CNNs
The present cutting-edge architecture in computer vision predominantly depends on complete CNNs, with UNet (Chen et al., 2021) and its variations being notable instances. The current state-of-the-art (SOTA) framework in computer vision primarily relies on full CNNs, with UNet and its variants being prominent examples. UNet (Chen et al., 2021) employs an encoding-decoding network architecture. This architecture utilizes cascaded convolutional layers to extract various levels of visual characteristics. The decoder utilizes skip connections to recycle high-resolution feature maps generated by the encoder, enabling the retrieval of crucial feature information (Petit et al., 2021).
2.3 Lightweight networks
Deep learning, although powerful, often requires extensive training data to effectively enhance model learning. However, challenges arise in scenarios like the ArUco dataset due to limitations in data collection related to factors such as lighting conditions, capture angles, and distances. Moreover, the availability of large, publicly accessible datasets is limited, further complicating model training (Lee et al., 2019). To address these challenges, the development of lightweight deep learning models becomes imperative.
Research in deep learning has demonstrated that supervised training of deep learning models heavily relies on large labeled datasets (Karimi et al., 2020). This requirement poses a significant challenge, especially in scenarios where data collection is constrained. Techniques such as model optimization, pruning, quantization, and knowledge distillation have been explored to create lightweight deep-learning models suitable for mobile terminals (Wang et al., 2022). These approaches aim to reduce the computational burden while maintaining model performance.
A self-attention-based vision transformer (ViT), known as MobileViT, is employed to learn the global representation of images. MobileViT (Mehta and Apple, 2022) stands out as the initial lightweight, general-purpose transformer designed for mobile devices. An approach integrating a transformer with a CNN-based lightweight model was investigated, with a particular focus on assessing the feasibility of this lightweight network model for the challenging task of ArUco marker segmentation.
2.4 Mini-MobileNet-MobileViT network
In this part, the Mini-MobileNet-MobileViT (MoNetViT) network architecture and its principal network components were introduced. The system’s backbone structure follows to the architecture of an encoder and decoder, as represented in Figure 1A. Section 2.4.1 offers a more detailed explanation sub-network of the encoder, while Section 2.4.2 focuses on the exploration sub-network of the decoder. The MobileViT module, a crucial part of the network’s encoder architecture, is introduced in Section 2.4.3. This section covers the architecture of the MobileViT module, its primary calculation process internally, and the comparisons between this module and CNN. Furthermore, the MQA module that is suggested in this study is described in Section 2.4.4. The Globalized Block and the Asymmetrical Globalized Block, as well as the justification for their adoption, are part of this module.
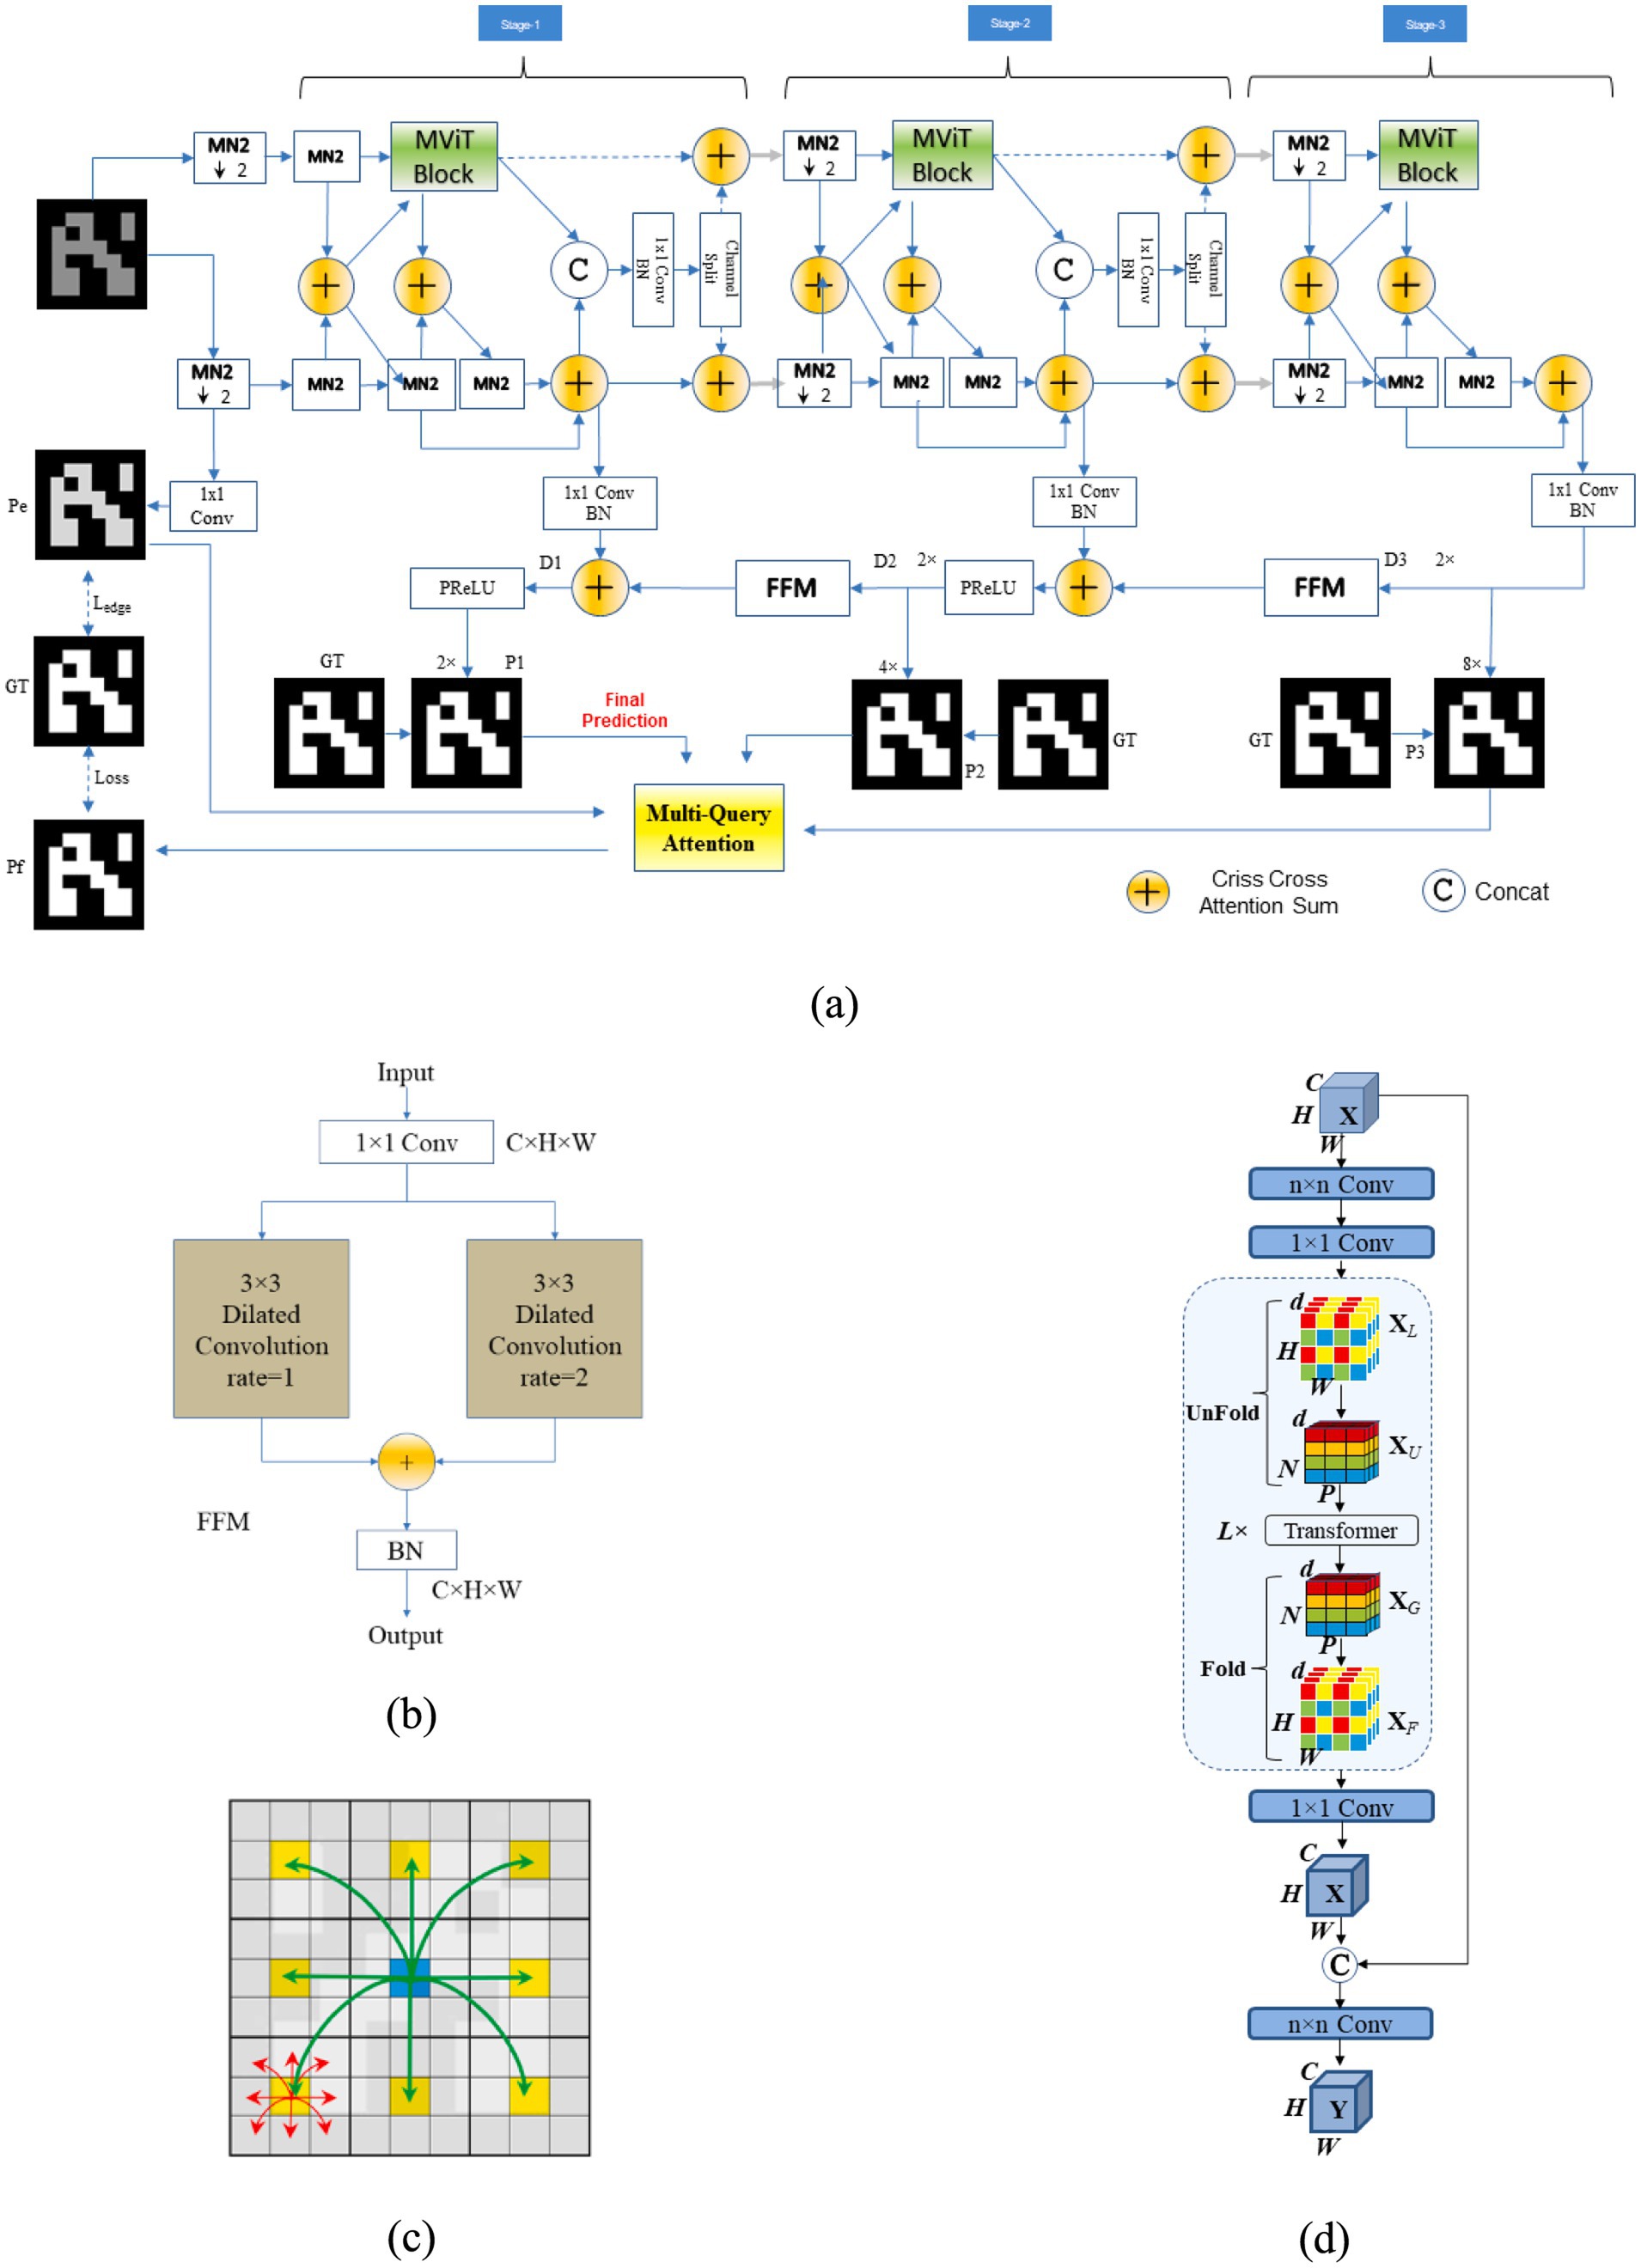
Figure 1. MoNetViT Main Architectural diagram and the essential network components. (A) MoNetViT deep CNN encoder and a few basic modules (B) Feature Fusion Modul (FFM) (C) Illustration calculation between pixels in MobileViT (D) MobileViT-Block.
2.4.1 Encoder sub-network
The proposed model will be developed using an encoder-decoder structure, where the encoder will build two parallel paths connected by a series of attention additions, improving the model’s ability to capture spatial and channel dependencies. The encoder will use MobileNet v2 (MN2 block) (Sandler et al., 2018) and MobileViT block as the base module. , is the representation of the input image, where H and 𝑊 stand for the input image’s height and width, respectively. The input image undergoes resolution degradation through three consecutive stages. In each stage, the size of the feature map is reduced by a factor of 2. As a result, the output feature maps are reduced in size to one-half, one-fourth, and one-eighth of the initial feature map. The MobileViT block is one of the essential components used in the encoder. The input and output sizes of the MobileViT block are the same, indicating that this module does not change the spatial dimensions of the feature map. The MN2 block is another basic module used in the encoder. Stride 1 implies that the module does not perform resolution degradation, and the input and output sizes remain the same.
At the th stage in Equation 1, it is assumed that (·) represents the transformation function of the th MV2-Block. For example, denotes the result produced by the 4th MN2-Block in the th stage. The MobileViT-block module at the th stage has a transformation function denoted as (·). It is important to emphasize that there is a singular MobileViT-block present at each stage.
Moreover, if we represent the output generated by the th MN2-Block module during the th stage as ( ), it is important to highlight that just the first two MN2-Block components reduce the resolution of the original feature map. Thus, belongs to the set of elements in , where belong to the collection and is an element of the set . represents the numerical value assigned to the feature channel at the th stage.
The channel attention module is denoted by . It is reasonable to assume that at this stage , the output of the left path is and the output of the right path is . The formulas Equation 2 can be used to compute and :
Here, represents a convolution operation, represents the feature map, and and represent the outputs of the third and fourth MN2-Block modules at stage , respectively. The function concatenates the feature map with the output of the channel attention module applied to the sum of and . The function splits the resulting tensor into multiple parts.
2.4.2 Decoder sub-network
In the context of a decoder sub-network shown in Figure 1B, the function represents the operation of the Feature Fusion Module (FFM) like figured in Equation 3. The module takes input and processes it through a series of transformations involving convolutional operations and batch normalization. The formula provided is as follows:
represents a divided convolution functional with a kernel size of 3 × 3 and an increase rate of 1, which is equal to a conventional convolution. represents a dilated convolution operation with a kernel size of 3 × 3 and an expansion rate of 2. This indicates a convolution with a dilation process using a 3 × 3 kernel area and an expansion rate that is 1, equivalent to a conventional. BatchNorm refers to the batch normalization operation that standardizes the inputs to a layer for each mini-batch.
In the decoder stage of the network, the feature maps are represented as , where . After the encoder phase, the operation on the feature map (at the third stage of the decoder) is defined . The two main steps for calculating as described. This process entails increasing the resolution of the data and then combining it with the results from the earlier stage of the encoding process. The initial step involves performing up-sampling and Feature Fusion Mapping (FFM). Up-sampling is intended to adjust the feature size to match the output size of the encoder from the previous stage, as illustrated in Equation 4. This process yields an intermediate variable, denoted as . The subsequent step entails a feature fusion operation with the encoder’s output from the prior stage, as demonstrated in Equation 5:
Upsample(·, t) denotes the procedure of augmenting the data map in accordance with the parameter t by bilinear interpolation. The PReLU function of activation is denoted as PReLU(·), whereas batch normalization is indicated as BatchNorm(·). Once all are calculated, a final prediction is obtained through a convolution.
Where is an element of the set Softmax(·) denotes the function that activates softmax. denotes the predicted class label map, with being the final output prediction, as demonstrated in Equation 6.
2.4.3 MobileViT block
Vision Transformers (ViTs) can achieve comparable accuracy to Convolutional Neural Networks (CNNs) in image identification tasks, especially when trained on extensive datasets (Dosovitskiy, 2021). On the other hand, unlike CNNs, ViTs are difficult to optimize and require a large amount of data for training. Research indicates that the suboptimal performance of ViTs is due to a lack of inductive biase (Lee et al., 2019; Petit et al., 2021; Zhou et al., 2024). Inductive biases, while beneficial, also have drawbacks for CNNs; they enable CNNs to capture local spatial information but can limit the network’s overall performance.
However, the transformer’s self-attention system has the capacity to collect global data. Numerous transformers and CNNs combinations have been investigated to overcome their respective deficiencies. ConViT (d’Ascoli et al., 2022) uses gated positional self-attention soft convolutional inductive biases. Semantic segmentation models such as ACNET (Hu et al., 2019) and CMANet (Zhu et al., 2022) have been developed; however, many of these models are computationally intensive. The possibility of leveraging the strengths of both CNNs and ViTs to construct a lightweight network for visual tasks remains an area of ongoing exploration. MobileViT suggests that such an approach is indeed feasible. In this paper, we first examine the calculations involved in MobileViT.
The MobileViT Block, seen in Figure 1D, shares an identical structure with the MobileViT Unit (Mehta and Apple, 2022). The following four phases are applied to a given source tensor :
• The input tensor 𝑋 is first passed through an standard convolution layer, followed by a convolution layer to generate . The convolution stage captures and represents nearby spatial details, whereas the convolution transforms the tensors into higher-dimensional spaces (with dimensions, where is more than ) by acquiring knowledge of a linear combination of the input channels.
• In order to incorporate spatial inductive bias into MobileViT’s learning process, the input is divided into non-overlapping flattening patches , where . The total number of patches is represented by the formula , where h and w are the physical dimensions of every single patch, individually.
• The transformer is then applied to encode the relationships between the patches through the following operation, as demonstrated in Equation 7
• The resulting is then folded back to obtain .
• Ultimately, is transformed into a space with fewer dimensions ( dimensions) using point-by-point convolution and then merging with using concatenation.
The second phase contains the algorithm’s core. The input image , which has dimensions , is separated into patches in the standard ViT structure. Subsequently, every patch undergoes a linear transformation to convert it into a vector. These vectors are then encoded with positional information. Furthermore, the interconnections between the patches are acquired by employing transformer blocks.
Contrary to ViT, the MobileViT algorithm preserves both the patch order and the physical order of pixels inside each of the patches during its second stage. It is crucial to emphasize that the values of and must be exact divisors of and , respectively.
Local information can be encoded by the relationship . The yellow pixels inside a patch have the ability to aggregate data from the pixels that surround them in that patch, as seen in Figure 1C. accomplishes the worldwide data encoding of the transformer by encoding inter-patch connections at the -th place of every patch. The red pixel keeps track of every one of the pixels that encode the full image since, as Figure 1C illustrates, it can identify the yellow pixel that is at the same location in other patches. The lightweight aspect of the model is enhanced by the dot product procedure, which selects only pixels that are in the same position.
According to Mehta and Apple (2022), ordinary convolution can be broken down into three steps: unfolding, matrix multiplication, and folding. Based on the previously indicated computation, a layer of convolution and the Unfold operation carry out the local feature modeling, providing them with convolution-like inductive biases. Next, global feature modeling is carried out using the Transformer → Fold sequence, which gives the MobileViT block global processing power.
2.5 Multi query attention
Figure 2A displays the configuration of a standard non-local block (Wang et al., 2018). The non-local block (Wang et al., 2018) first requires the computation of the similarity between all places. This is accomplished by performing matrix multiplication on an input . The primary computational procedure in the non-local block can be succinctly described as consisting of the following five steps:
• The source feature is subjected to three convolutions, denoted as , , and , resulting in the transformation of into , and . The three numbers correspond to the query, key, and value, respectively. They are used to change the total amount of streams from 𝐶 to .
• A similarity matrix M is created by flattening the query, key, and value to size , where . The matrix is calculated to determine the similarity, as demonstrated in Equation 8:
• The matrix is normalized using a normalization function such as softmax:
• The matrix of attention is then derived, as demonstrated in Equation 9:
• The final result is computed as: . The channel dimension is adjusted from back to by a convolution, denoted as .
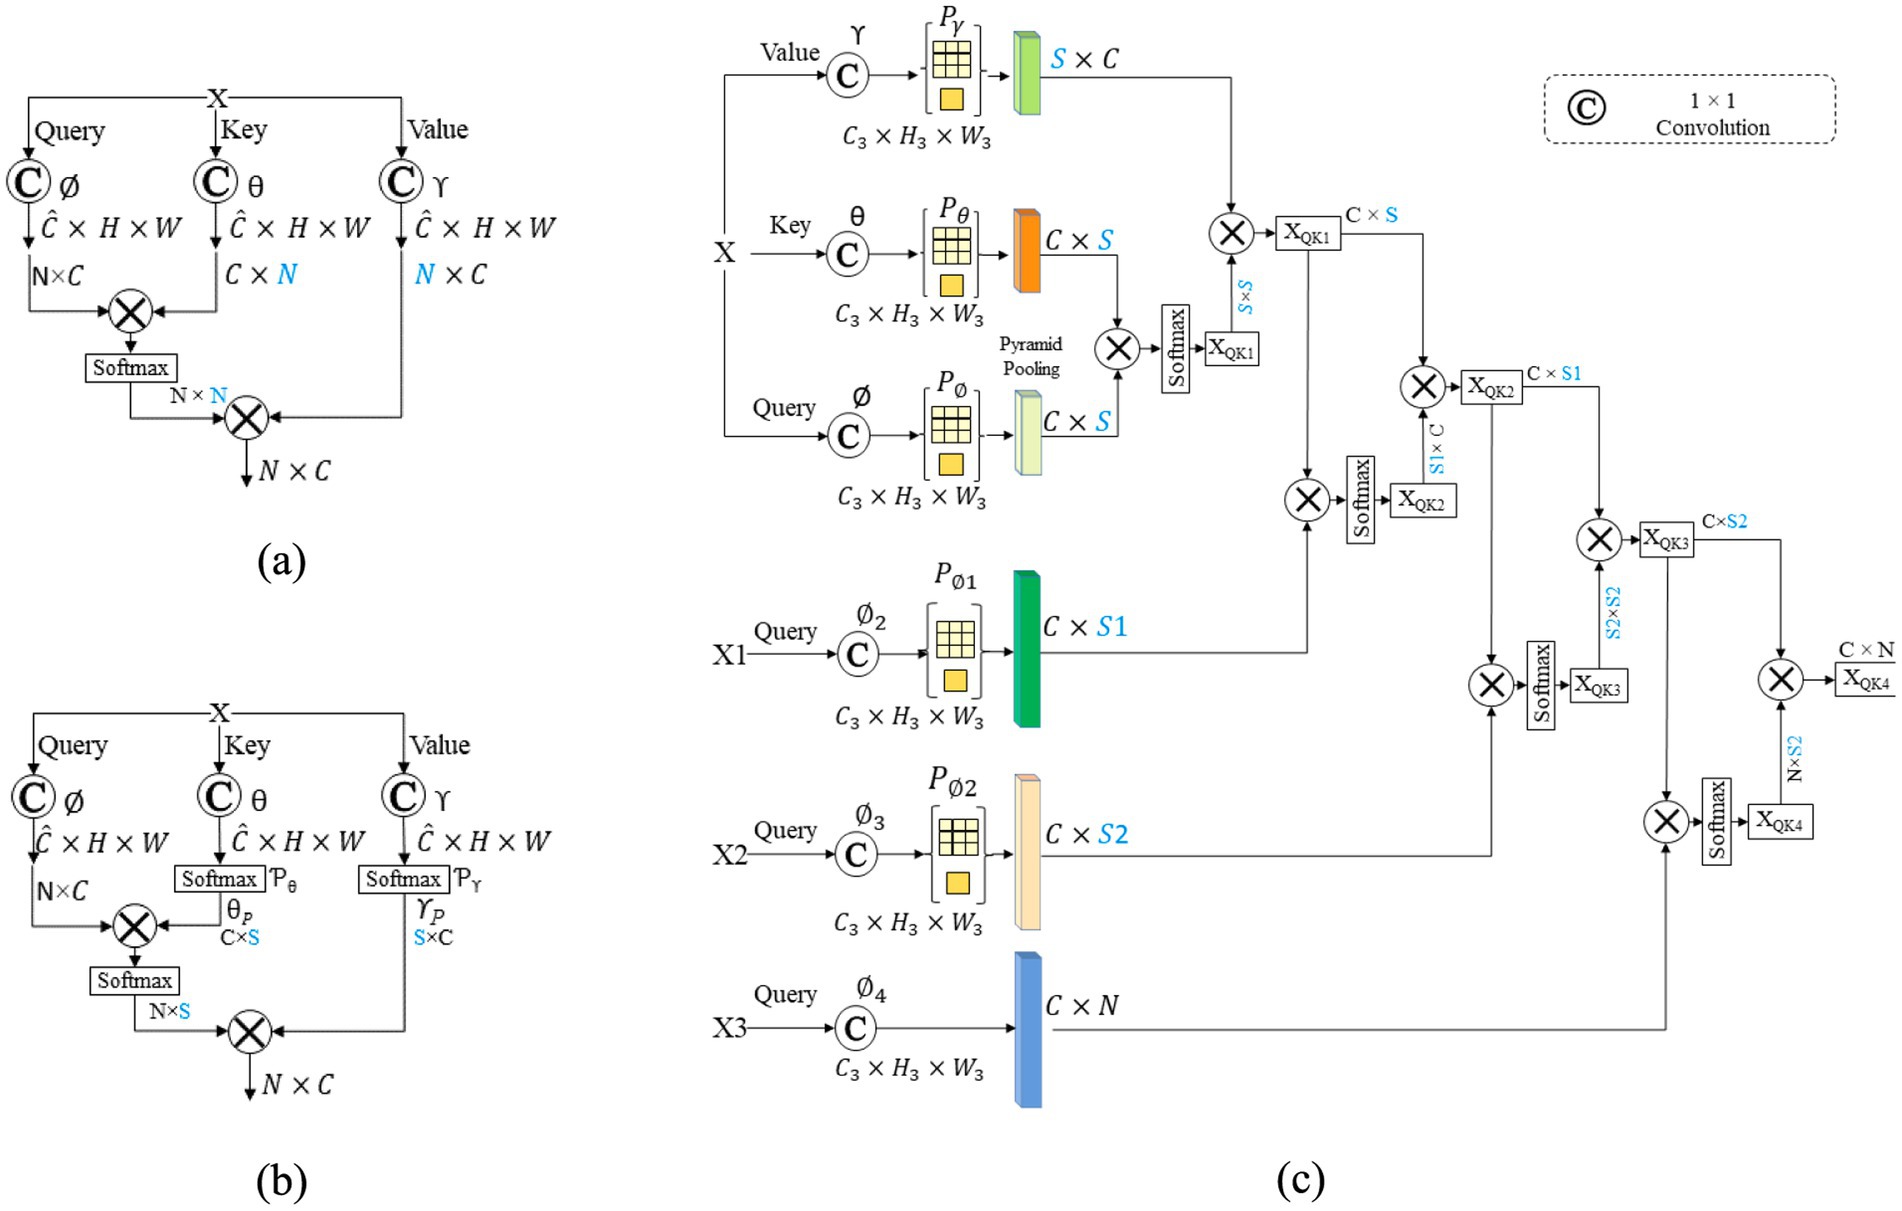
Figure 2. Architecture of a standard (A) non-local block, (B) the asymmetric non-local block, and (C) Multi Query attention module.
Reassessing the Non-local Asymmetric Block
The computational complexity of the global attention block can be described as . The calculation efficiency is mostly affected by N’s size. To fix this, reduce to without altering output size. Zhu et al. (2019) offers the asymmetric non-local block, whose construction is shown in Figure 2B, to tackle this problem.
The asymmetrical pyramid non-local block (APNB) is a modified version of this block that incorporates pyramid pooling within the non-local block in order to decrease computational expenses. One more thing is added after and : a spatial pyramid pooling function (Lazebnik et al., 2006) to pick out a few good anchor points. When the spatial pyramid pooling modules are and , with n denoting the pooling layer’s output size (width or height) and as per Zhu et al. (2019), the overall amount of sampling anchor points is . If we assume that and , the number of calculations will be reduced by an amount . This adjustment efficiently decreases the value of to a lower value, , by selectively sampling a few sample data from and , instead of utilizing all of the points.
The primary computational procedure in the asymmetrical non-local block entails the subsequent modifications, as demonstrated in Equations 10, 11:
The computational technique for the APNB module may be delineated as follows:
Introduce sampling modules and after and γ, accordingly, to sample multiple sparse anchor points. These anchor points are designated as and , respectively.
Generating a similarity matrix , as demonstrated in Equation 12:
is normalized.
stands for normalization function.
The attention matrix AP is subsequently computed, as demonstrated in Equation 13:
The final result is obtained by adding the product of the variables and to the variable X, and assigning it to the variable is a one-by-one convolution. represents a convolutions.
2.6 Motivation
The APNB discussed earlier operates with a single data stream as input, while the asymmetrical fusion nonlocal block typically utilizes two data sources: the top-level feature map and the lower-level feature map. In contrast, the proposed MQA mechanism extends this approach by incorporating four input sources. As shown in Figure 1A, MQA integrates the fundamental value ( ), the elevated characteristics and , and the edge content ( ), allowing for the explicit acquisition of multiple levels of feature representation. By incorporating edge information throughout the semantic segmentation process, the model imposes valuable constraints, enhancing segmentation precision. The cross-entropy loss function further refines this process by measuring the difference between the ground truth ( ) and the feature aggregation map ), ensuring robust alignment of predictions with the actual data.
Commence the acquisition of a parameter map of features and additional feature maps , , and . Five 1 × 1 convolutions, denoted as and , are applied to transform these input maps into new feature maps: and , as demonstrated in Equation 14:
The parameters , , , and in this experiment correspond to the results , , , and P3 from MoNetViT. The sample as well as main computation methodologies within the MQA module were equivalent to those in APNB. The selection units , and are utilized to sample multiple sparse anchor points. These anchor points are represented as and , where and denote the number of sampled anchor points. is less than , which is less than , and is much less than . Mathematically, this is computed using the following Equation 15:
The correlation matrix for and anchoring is displayed here, as demonstrated in Equation 16:
The dimensions of the are , where is significantly smaller than . Next, the process of normalization is carried out on , which enables the calculation of .
The ultimate result of the initial layer is, as demonstrated in Equation 17:
The value of is equal to the product of and . belongs to the set of . The similarity matrix for levels 2, 3, and 4 is computed using an analogy, as demonstrated in Equation 18:
The equation is equal to the product of and . The equation is equal to the product of and . The equation is equal to the product of and .
The ultimate result of levels 2, 3, and 4 is determined in the following manner Equation 19:
The value of is equal to the product of and , where belongs to the set . The value of is equal to the product of and , where belongs to the set . The value of is equal to the product of and , where belongs to the set .
The final result is represented as belonging to the set of . The temporal complexity can be represented as , which is significantly lower than in the conventional non-local block.
2.7 Loss function
The function that measures loss is defined like the ones used by Yeung et al. (2022). The loss function comprises two components: and . Equations 20, 21 (Yeung et al., 2022) display the loss function.
where ground-truth (GT) and the anticipated edge map Pe’s coordinates for each pixel point are represented by ( ).
IoU loss and a conventional cross-entropy loss make up the two components of the loss function.
2.8 Experiment setup
The NVIDIA Tesla T4 GPU was used to train the model within the PyTorch framework for this project. The model underwent training for 50 epochs using a batch size of 16, with the Adam optimizer and a starting learning rate of 1e-3. A learning rate reduction factor of 0.5 was applied when no improvement was observed for 5 consecutive epochs (patience set to 5). The specific hyperparameters utilized in this investigation are outlined in Table 1. In addition, the experiment aimed to compare the proposed MoNetViT model with several state-of-the-art methods, including TransFuse (Zhang et al., 2021), Inf-Net (Fan et al., 2020), U-Net (Ronneberger et al., 2015), U-Net++ (Kwak and Sung, 2021), Mini-Seg (Kim et al., 2023), and DeepLabV3+ (Asadi Shamsabadi et al., 2022), for multi-class segmentation in ArUco marker identification.
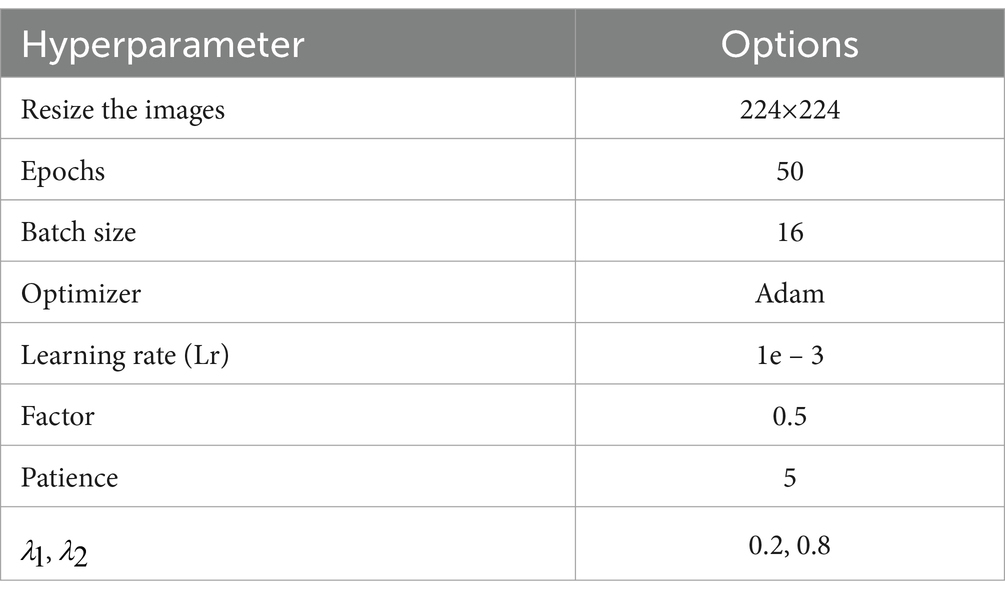
Table 1. Network hyperparameter.
The researchers conducted experiments using freely available datasets for ArUco manual labeling. The dataset employed in this study is an open-source resource that has been fully labeled to indicate various classes of ArUco markers, making it ideal for training models in identification and classification tasks. The dataset preparation involved several pre-processing steps to enhance model generalizability and ensure reproducibility. Images were resized to a resolution of 224 × 224, and pixel values were normalized to the range 0 and 1. Additionally, data augmentation techniques such as random rotation, flipping, and contrast adjustment were applied to improve the model’s ability to generalize across varied conditions. The complete dataset, including all necessary images and labels for training and testing models in ArUco marker identification and classification tasks, can be accessed and downloaded from the following link: https://universe.roboflow.com/loliktry/dataarucomustofa/dataset/5. It was specifically utilized in the multi-class segmentation experiments. Table 2 provides a comprehensive overview of the specific details of this dataset.
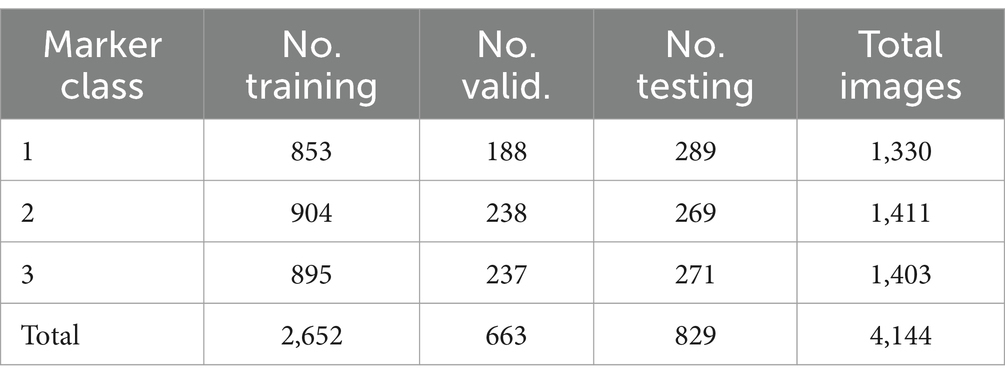
Table 2. Specifications of datasets.
Furthermore, the present study utilized identical methodologies as Fan et al. (2020) to assess the performance of the model. Standard criteria, such as accuracy, specificity, sensitivity, and Dice similarity coefficient, comprise the assessment metrics. In addition, it uses several metrics from object recognition evaluation methods, such as the design measure, the enhanced alignment value (Fan et al., 2018), and the mean absolute error.
3 Results
The dataset utilized in this study is notably large-scale, comprising a total of 4,144 slices. Consequently, the following sections will focus exclusively on a detailed analysis of the results, offering an in-depth examination of the findings and their implications.
3.1 Three-class ArUco marker labeling results
The segmentation data findings for ArUco Marker on the dataset are displayed in Figure 3, demonstrating that MoNetViT in this study exhibits superior performance compared to other baseline models. U-Net and U-Net++ have low Dice scores and sensitivities, resulting in large unsegmented areas. Inf-Net and Mini-Seg show slight improvements but still lack accurate boundary detection. While TransFuse, a CNN + Transformer model, was evaluated, it is not included in Figure 3 due to its very low Dice score. DeepLabV3+ performs reasonably well but falls short of MoNetViT. Overall, MoNetViT achieves the highest Dice, sensitivity, and specificity scores, along with the lowest MAE, indicating its superior segmentation precision.
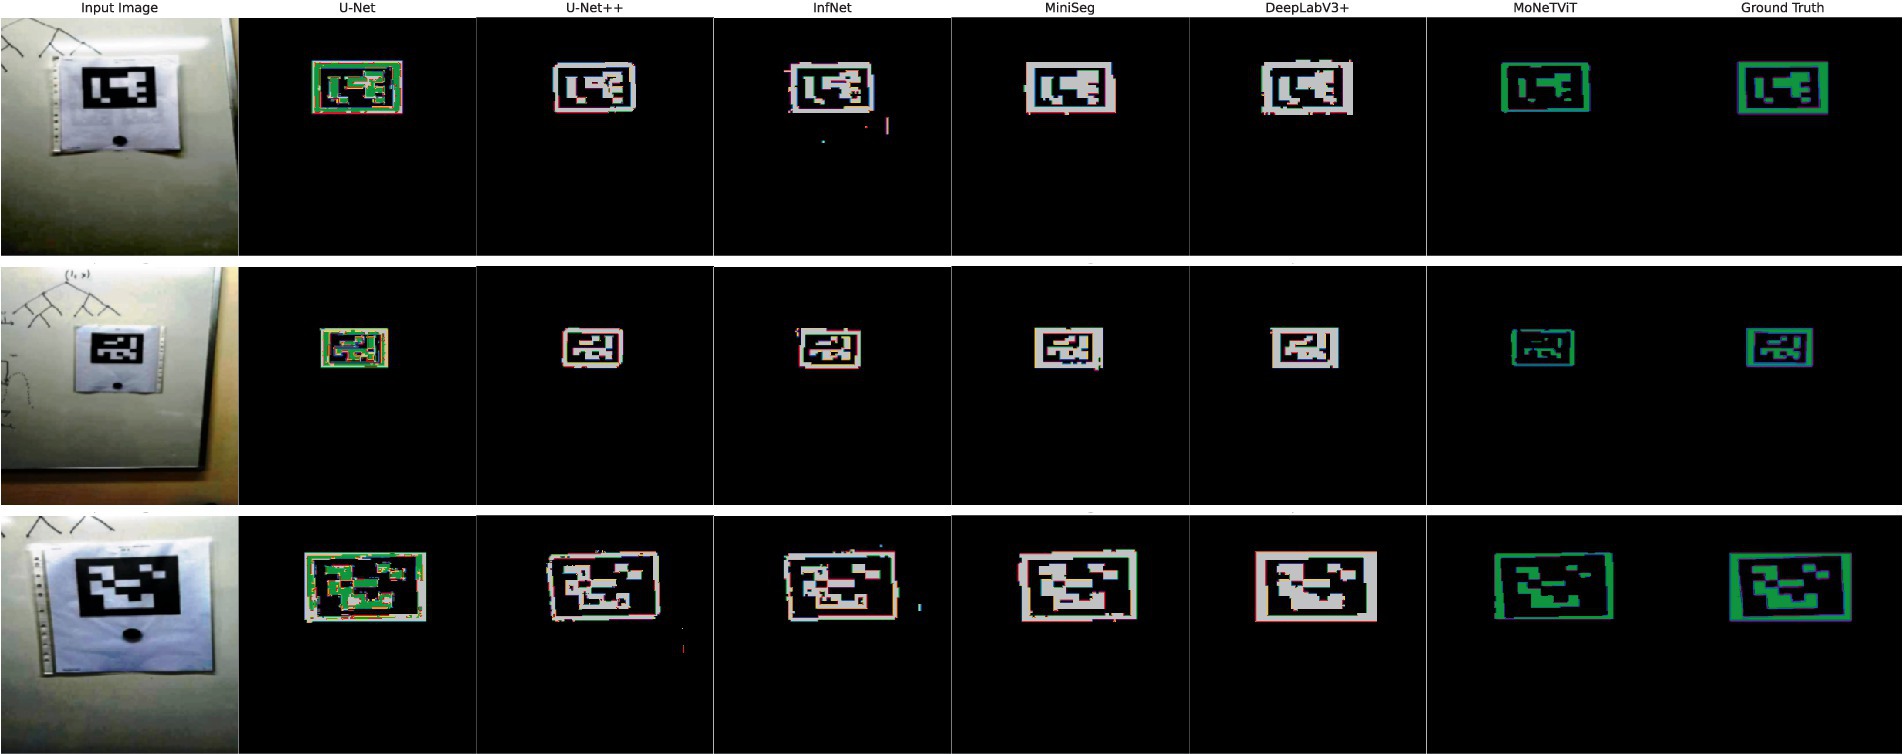
Figure 3. Comparison of segmentation results of three-class labeling.
The MoNetViT model shows superior performance over other state-of-the-art models, including U-Net, U-Net++, Mini-Seg, Inf-Net, TransFuse, and DeepLabV3+, across key evaluation metrics. As summarized in the Table 3, MoNetViT achieves the highest Dice score (0.9584), sensitivity (0.9424), specificity (0.9424), structural similarity 0.9923), and mean edge accuracy (0.9381), while also attaining the lowest Mean Absolute Error (MAE) of 0.0077.

Table 3. Result of three-class labeling.
This outstanding performance is attributed to the integration of Convolutional Neural Networks (CNNs) with a transformer module, which captures both local and global semantic features. The transformer component is crucial for calculating global semantic relationships, while the CNN module extracts local contextual features, resulting in a more robust feature representation. Additionally, the multi-query attention (MQA) module enriches feature diversity through supervised learning, enhancing overall model performance.
An analysis of false positives (FP) and false negatives (FN) further emphasizes MoNetViT’s robustness. With high sensitivity (0.9424) and specificity (0.9424), MoNetViT significantly reduces both FP and FN compared to other models. For instance, while DeepLabV3+ achieves a Dice score of 0.6351, its sensitivity (0.6392) and specificity (0.9655) indicate a higher FN rate relative to MoNetViT. Similarly, Mini-Seg’s balanced sensitivity (0.6268) and specificity (0.9537) suggest that it is more prone to FP and FN, impacting its reliability. In contrast, MoNetViT’s ability to minimize FP and FN contributes to its high Dice score and overall segmentation accuracy.
Despite Inf-Net having the smallest model size (0.073 MB) and TransFuse having the smallest parameter count (0.038 M), MoNetViT outperforms these models in critical metrics. Its effectiveness stems from model design rather than sheer training data volume, highlighting MoNetViT’s robustness and capacity to generalize effectively on the dataset. Paired T-tests indicated that MoNetViT’s improvements were statistically significant (p < 0.05) compared to all models except U-Net++, Mini-Seg, and DeepLabV3+, suggesting that while MoNetViT is generally superior, these models are still competitive in certain tasks. The addition of FP and FN analysis strengthens these findings, demonstrating that MoNetViT achieves its exceptional performance by addressing key limitations in segmentation errors observed in other models.
3.2 Component impact analysis
Several experiments were conducted to validate the functionality of the Multi Query Attention (MQA) and Fusion Feature Module (FFM), two crucial elements of the MoNetViT. Figure 1A depicts an architecture consisting of three stages. The segmentation performance of the MoNetViT model is considerably improved by the MQA module component, as the findings displayed in Table 4 reveal.
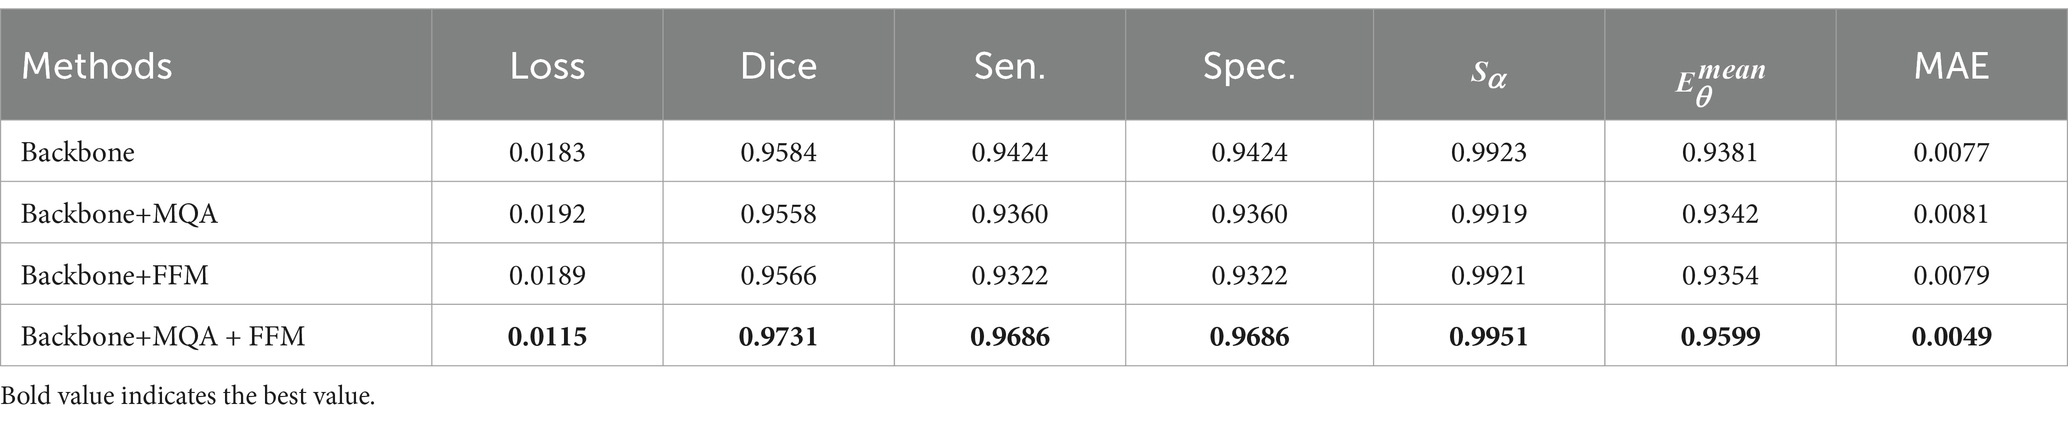
Table 4. MoNetViT ablation study.
Employing MQA and FFM in conjunction with the baseline improves segmentation performance. Specifically, integrating both MQA and FFM with the baseline resulted in improvements of 1.5 and 1.7% in the Dice coefficient, respectively. The findings indicate that using MQA and FFM enhances the encoder’s and decoder’s clarity, thereby further improving segmentation performance. The analysis shows that combining Backbone, FFM, and MQA results in the best performance across all metrics. This model has the lowest loss (0.0115) and the highest Dice coefficient (0.9731), indicating more accurate segmentation and fewer errors. It also achieves the best sensitivity (0.9686) and specificity (0.9686), accurately identifying both positive and negative cases. Additionally, it has the highest structural alignment ( = 0.9951) and precision ( = 0.9599), along with the lowest Mean Absolute Error (0.0049). In comparison, other methods like Backbone alone, Backbone+FFM, and Backbone+MQA perform worse in various metrics, highlighting the benefits of using both FFM and MQA together.
3.3 Parameter comparison
Figure 4 provides a detailed overview of the model performance. MoNetViT achieves superior accuracy while maintaining a relatively small parameter count. Specifically, it uses about half the parameters of U-Net (1.014 M vs. 1.953 M) and significantly fewer parameters than U-Net++ (7.783 M) and DeepLabV3+ (13.324 M). While Inf-Net (0.076 M) and Mini-Seg (0.038 M) have smaller parameter counts, and TransFuse uses the fewest (0.019 M), MoNetViT achieves a much higher Dice score (0.9584) compared to these models. This demonstrates that MoNetViT not only optimizes model size and complexity but also outperforms other models, including transformer-based models like TransFuse, in terms of accuracy (Figure 5).
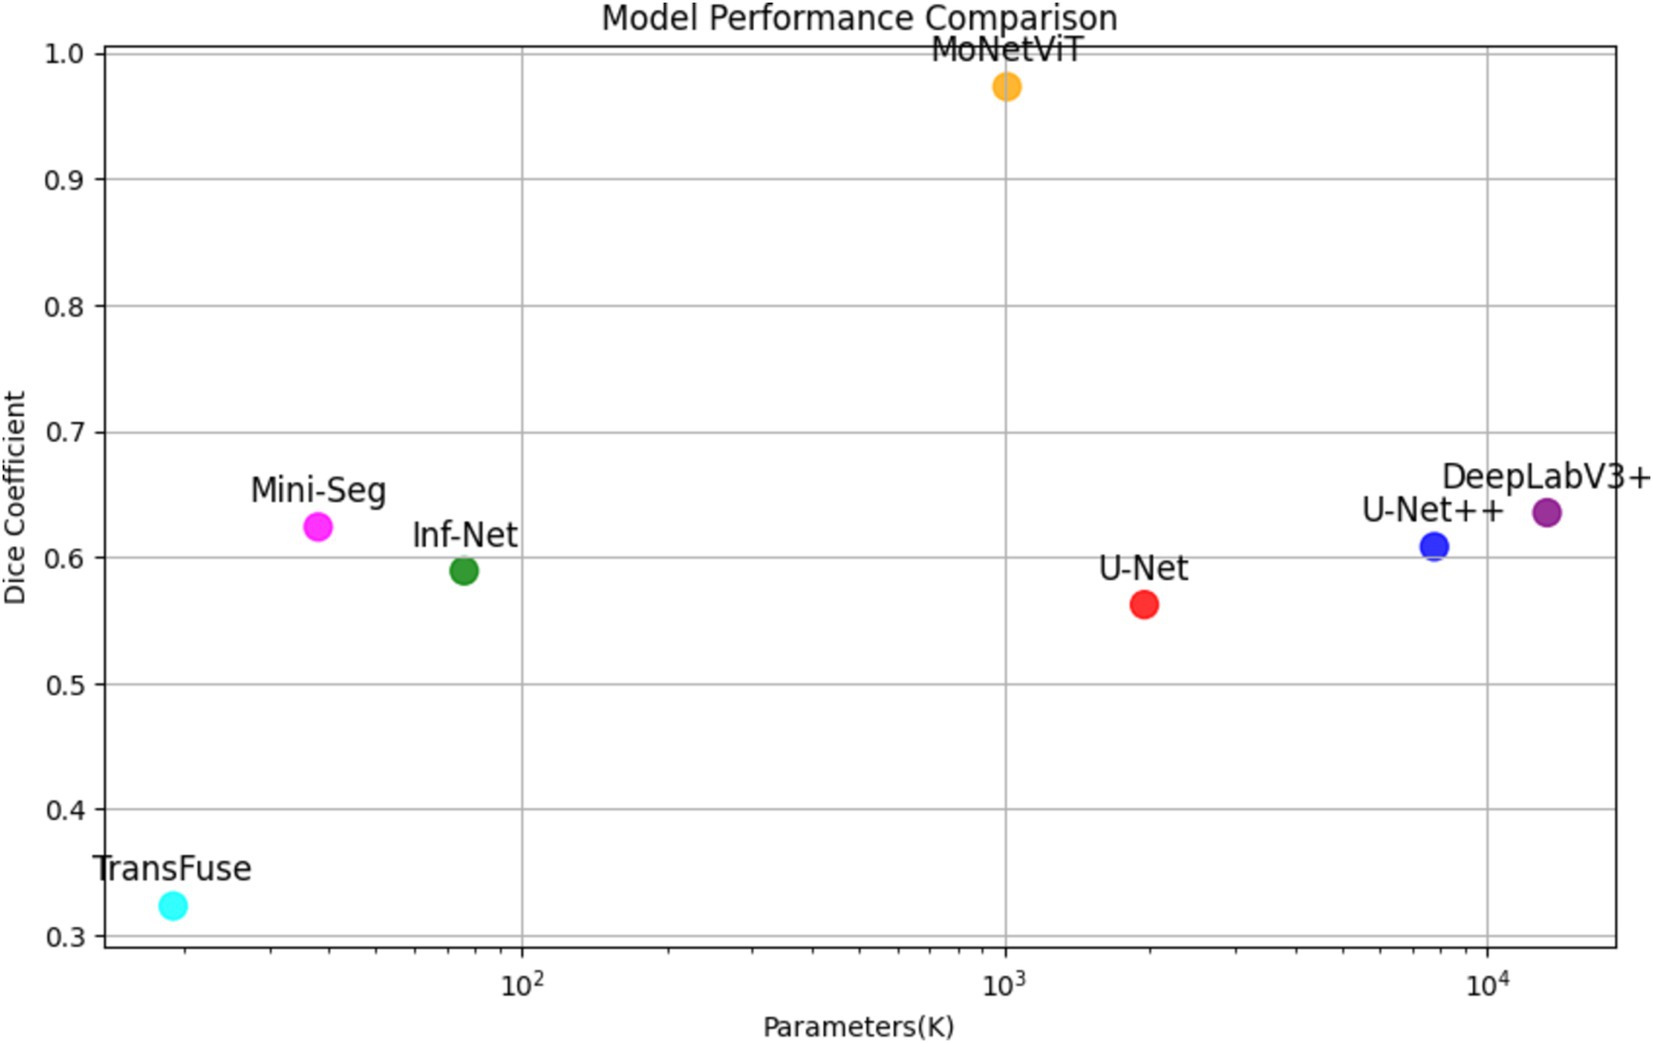
Figure 4. Dice vs. number of parameters between different segmentation algorithms.
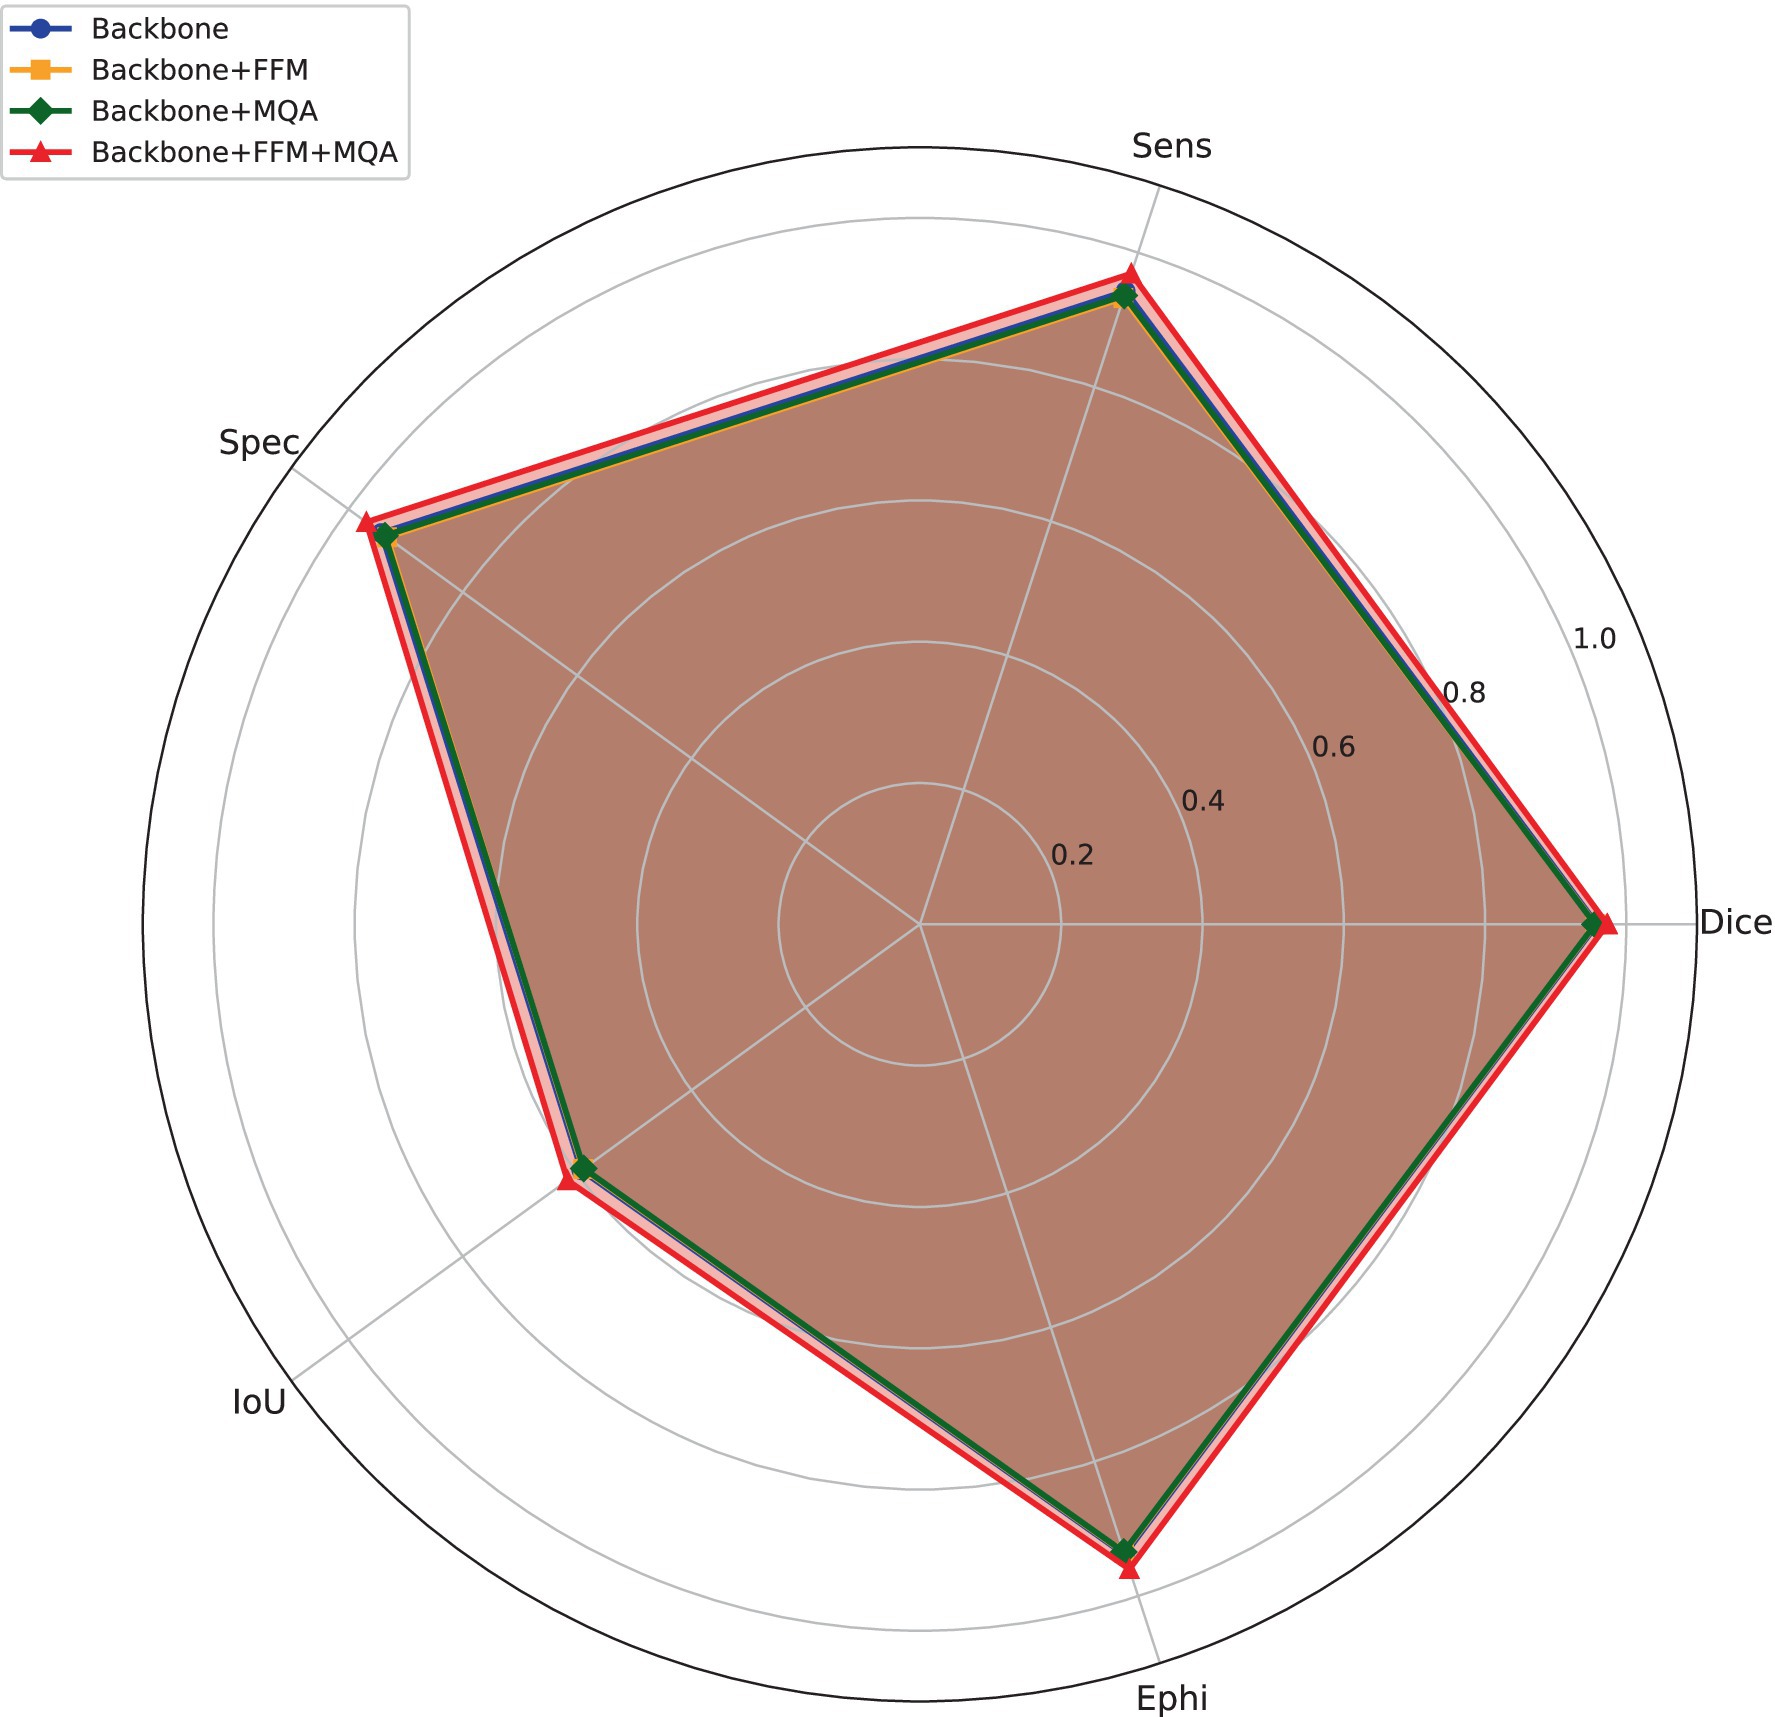
Figure 5. FFM and MQA improvement assessment.
4 Discussion
4.1 Comparison of multi-scale features
Numerous models for combining multi-scale features use conventional networks for object identification and semantic segmentation in image processing. For example, architectures like Feature Pyramid Network (FPN) and U-Net rely on three primary network paths: bottom-up, top-down, and horizontal connections. These paths allow the integration of high-level semantic information with low-level geometric data. In FPN, the bottom-up path extracts high-level features, while the top-down path applies upsampling to enhance semantic details at higher resolutions. Horizontal connections fuse low-level convolution features with high-level features, resulting in a more detailed representation of semantic information.
Nevertheless, FPN faces challenges due to its complex hierarchical structure. The computation of intermediary layers relies heavily on the higher-level layers, requiring the analysis of preceding layers to be completed before passing information to subsequent layers. This dependency can lead to inefficiencies in computation and integration. The proposed MQA approach addresses these limitations by enabling the simultaneous integration of lower-level map attributes, higher-level attribute maps, and edge attribute maps, streamlining the process and enhancing feature representation.
The current work offers a direct and efficient MQA approach and introduces a cascading multi input computational framework. The system employs a mechanism for attention to iteratively compute and use feature maps of varying sizes, directing the ultimate semantic segmentation process. The proposed MQA has the ability to combine multiple input and multiple scale features, and can be trained end-to-end with ground truth supervision. The proposed technique effectively leverages both low and high-resolution features and integrates a method of attention to successfully accomplish the segmentation job on ArUco markers.
4.2 Comparison of different combination MQA and FFM
To evaluate the impact of MQA and FFM on MoNetViT’s performance, a series of tests were conducted. The experiments utilized the same network backbone and implementation details to ensure consistency with previous studies. The results, as shown in the radar chart and table, compare the baseline “Backbone,” “Backbone+MQA,” “Backbone+FFM,” and “Backbone+MQA + FFM” configurations. The radar chart illustrates that the region representing “Backbone+MQA + FFM” (in red) is larger than those of other configurations, indicating superior performance across key metrics. Similarly, the table reinforces these findings, showing that “Backbone+MQA + FFM” achieves the highest Dice score (0.9731), sensitivity (0.9686), and specificity (0.9686), along with the lowest MAE (0.0049). These results suggest that integrating both MQA and FFM significantly enhances the backbone’s performance, as the areas with MQA and FFM have a notably larger magnitude than those without these modules.
The contributions of the Multi-Query Attention (MQA) and Feature Fusion Module (FFM) to the segmentation performance were further validated through an ablation study. Table 4 highlights the significant improvements achieved by integrating these modules into the baseline model. Specifically, the Dice coefficient increased from 0.9584 for the baseline to 0.9558 (+1.7%) with MQA alone and 0.9566 (+1.9%) with FFM alone. When both modules were combined, the Dice coefficient reached 0.9731 (+3.4%), demonstrating their synergistic effect. Furthermore, sensitivity and specificity improved from 0.9424 each in the baseline to 0.9686 with the combined MQA and FFM setup, while the Mean Absolute Error (MAE) decreased from 0.0077 to 0.0049. These findings emphasize the critical role of MQA in enhancing multi-scale feature integration and FFM in refining feature clarity, resulting in superior segmentation performance. This robust improvement across key metrics underscores the effectiveness of the proposed MoNetViT architecture in addressing complex segmentation tasks.
MoNetViT’s architecture demonstrates significant advantages through its dual-path encoder, which effectively balances local feature extraction using CNNs and global feature extraction via Transformers. This design allows the model to capture both fine-grained details and long-range dependencies, improving segmentation performance. Additionally, the integration of the Multi-Query Attention (MQA) module enhances multi-scale feature integration, enabling the model to better aggregate features across varying spatial scales. This contributes to improved segmentation accuracy, particularly in complex scenarios. Furthermore, MoNetViT’s lightweight design minimizes computational demands, making it highly efficient for real-time applications without sacrificing performance. Compared to models like DeepLabV3+, which rely on more resource-intensive architectures, MoNetViT achieves a superior balance of accuracy and efficiency, reinforcing its suitability for deployment in resource-constrained environments.
While MoNetViT demonstrates strong performance, scalability to larger datasets may require optimization strategies, and its adaptability to diverse marker types needs further evaluation across different styles and conditions. Future experiments will focus on enhancing scalability and generalizability through transfer learning and broader dataset evaluations.
5 Conclusion
This study introduces a novel model called MoNetViT, which utilizes fused CNNs and transformers to create a segmentation model for ArUco marker-infested regions. The picture features are extracted simultaneously utilizing Convolutional Neural Networks (CNNs) and transformers, resulting in a reduction in computing burden and model complexity, while enhancing the segmentation performance. Furthermore, this work introduces the multi-query attention (MQA) module as a means to enhance performance. The empirical findings demonstrate that MoNetViT outperforms the other approaches on the ArUco dataset. Further studies will concentrate on the influence of the merging of each model and on discovering strategies for decreasing the level of detail within the model. Future research will focus on enhancing the capabilities of MoNetViT to achieve even more robust outcomes. This includes exploring additional fusion methods to further optimize feature integration and segmentation accuracy. Another key direction is adapting the model for outdoor environments by incorporating GPS data, thereby extending its applicability to diverse navigation scenarios. Leveraging transfer learning techniques will also be prioritized to reduce training times and improve scalability, enabling the model to handle larger and more diverse datasets effectively. These advancements aim to broaden the utility and efficiency of MoNetViT, ensuring its suitability for a wide range of real-world applications.
Data availability statement
The datasets presented in this study can be found in online repositories. The names of the repository/repositories and accession number(s) can be found in the article/supplementary material.
Author contributions
LT: Conceptualization, Data curation, Formal analysis, Funding acquisition, Investigation, Methodology, Project administration, Resources, Software, Supervision, Validation, Visualization, Writing – original draft, Writing – review & editing. RG: Conceptualization, Formal analysis, Funding acquisition, Investigation, Supervision, Validation, Writing – review & editing. Prayitno: Conceptualization, Formal analysis, Funding acquisition, Investigation, Supervision, Validation, Writing – review & editing, Data curation.
Funding
The author(s) declare that no financial support was received for the research, authorship, and/or publication of this article.
Acknowledgments
The authors thank the Ministry of Education, Culture, Research, and Technology for the research grant and support provided for this doctoral dissertation. Additionally, we extend our thanks to Diponegoro University, especially the Doctoral Program of Information Systems, for their continuous support and valuable resources that have significantly contributed to the success of this research.
Conflict of interest
The authors declare that the research was conducted in the absence of any commercial or financial relationships that could be construed as a potential conflict of interest.
Generative AI statement
The author(s) declare that no Generative AI was used in the creation of this manuscript.
Publisher’s note
All claims expressed in this article are solely those of the authors and do not necessarily represent those of their affiliated organizations, or those of the publisher, the editors and the reviewers. Any product that may be evaluated in this article, or claim that may be made by its manufacturer, is not guaranteed or endorsed by the publisher.
References
Abozeid, A., Taloba, A., Faiz Alwaghid, A., Salem, M., and Elhadad, A. (2023). An efficient indoor localization based on deep attention learning model. Comput. Syst. Sci. Eng. 46, 2637–2650. doi: 10.32604/csse.2023.037761
Asadi Shamsabadi, E., Xu, C., Rao, A. S., Nguyen, T., Ngo, T., and Dias-da-Costa, D. (2022). Vision transformer-based autonomous crack detection on asphalt and concrete surfaces. Autom. Constr. 140:104316. doi: 10.1016/j.autcon.2022.104316
Bai, J., Liu, Z., Lin, Y., Li, Y., Lian, S., and Liu, D. (2019). Wearable travel aid for environment perception and navigation of visually impaired people. Electronics 8:697. doi: 10.3390/electronics8060697
Benmouna, B., Pourdarbani, R., Sabzi, S., Fernandez-Beltran, R., García-Mateos, G., and Molina-Martínez, J. M. (2023). Attention mechanisms in convolutional neural networks for nitrogen treatment detection in tomato leaves using hyperspectral images. Electronics 12:22706. doi: 10.3390/electronics12122706
Chen, J., Lu, Y., Yu, Q., Luo, X., Adeli, E., Wang, Y., et al. (2021). TransUNet: transformers make strong encoders for medical image segmentation, arXiv. 1–13. doi: 10.48550/arXiv.2102.04306
Chen, Y., Wang, T., Tang, H., Zhao, L., Zhang, X., Tan, T., et al. (2023). CoTrFuse: a novel framework by fusing CNN and transformer for medical image segmentation. Phys. Med. 68:175027. doi: 10.1088/1361-6560/acede8
d’Ascoli, S., Touvron, H., Leavitt, M. L., Morcos, A. S., Biroli, G., and Sagun, L. (2022). ConViT: improving vision transformers with soft convolutional inductive biases. J. Stat. Mech. Theor. Exp. 2022, 2286–2296. doi: 10.1088/1742-5468/ac9830
Dosovitskiy, A. (2021). “An image is WORTH 16X16 WORDS: transformers for image recognition at scale,” in ICLR 2021 - 9th International Conference on Learning Representations.
Dosovitskiy, A., Beyer, L., Kolesnikov, A., Weissenborn, D., Zhai, X, Unterthiner, T., et al. (2021). “An image is Worth 16x16 Words: transformers for image recognition at scale,” arXiv. doi: 10.48550/arXiv.2010.11929
El-taher, F., Taha, A., Courtney, J., and Mckeever, S. (2021). A systematic review of urban navigation systems for visually impaired people. Sensors 21:3103. doi: 10.3390/s21093103
Fan, D. P., Tao, Z., Ge-Peng, J., Yi, Z., Geng, C., Huazhu, F., et al. (2018). Enhanced-alignment measure for binary foreground map evaluation. IJCAI. 12, 698–704. doi: 10.24963/ijcai.2018/97
Fan, D.-P., Zhou, T., Ji, G. P., Zhou, Y., Chen, G., Fu, H., et al. (2020). Inf-net: automatic COVID-19 lung infection segmentation from CT images. IEEE Trans. Med. Imaging 39, 2626–2637. doi: 10.1109/tmi.2020.2996645
Fernando, N., McMeekin, D. A., and Murray, I. (2023). ‘Route planning methods in indoor navigation tools for vision impaired persons: a systematic review’, disability and rehabilitation. Assist. Technol. 18, 763–782. doi: 10.1080/17483107.2021.1922522
Huang, Q., Lei, Y., Xing, W., He, C., Wei, G., Miao, Z., et al. (2022). Evaluation of pulmonary edema using ultrasound imaging in patients with COVID-19 pneumonia based on a Non-Local Channel attention ResNet. Ultrasound in Medicine \& Biology [Preprint]. 48, 945–953. doi: 10.1016/j.ultrasmedbio.2022.01.023
Hu, X., Yang, K., Fei, L., and Wang, K. (2019). ACNET: attention based network to exploit complementary features for RGBD semantic segmentation. IEEE 21, 1440–1444. doi: 10.1109/icip.2019.8803025
Jeamwatthanachai, W., Wald, M., and Wills, G. (2019). Indoor navigation by blind people: behaviors and challenges in unfamiliar spaces and buildings. Br. J. Vis. Impair. 37, 140–153. doi: 10.1177/0264619619833723
Karimi, D., Dou, H., Warfield, S. K., and Gholipour, A. (2020). Deep learning with Noisy labels: exploring techniques and remedies in medical image analysis. Med. Image Anal. 65:101759. doi: 10.1016/j.media.2020.101759
Kim, H. W., Lee, S., Yang, J. H., Moon, Y., Lee, J., and Moon, W. J. (2023). Cortical Iron accumulation as an imaging marker for neurodegeneration in clinical cognitive impairment Spectrum: a quantitative susceptibility mapping study. Korean J. Radiol. 24, 1131–1141. doi: 10.3348/kjr.2023.0490
Kubota, M. (2024). Snap: smartphone-based indoor navigation system for blind people via floor map analysis and intersection detection. Proc. ACM Hum. Comput. Int. 8, 1–22. doi: 10.1145/3676522
Kuriakose, B., Shrestha, R., and Sandnes, F. E. (2021). Towards independent navigation with visual impairment: a prototype of a deep learning and smartphone-based assistant. Association for Computing Machinery. 113–114. doi: 10.1145/3453892.3464946
Kwak, J., and Sung, Y. (2021). DeepLabV3-refiner-based semantic segmentation model for dense 3D point clouds. Remote Sens. 13:165. doi: 10.3390/rs13081565
Lazebnik, S., Schmid, C., and Ponce, J. (2006). “Beyond bags of features: spatial pyramid matching for recognizing natural scene categories,” in 2006 IEEE Computer Society Conference on Computer Vision and Pattern Recognition (CVPR’06), 2169–2178.
Lee, J., Yoon, W., Kim, S., Kim, D., Kim, S., So, C. H., et al. (2019). BioBERT: a pre-trained biomedical language representation model for biomedical text mining. Bioinformatics 36, 1234–1240. doi: 10.1093/bioinformatics/btz682
Liu, Y., Zhang, Z., Liu, X., Lei, W., and Xia, X. (2021). Deep learning based mineral image classification combined with visual attention mechanism. IEEE Access 9, 98091–98109. doi: 10.1109/access.2021.3095368
Martínez-Cruz, S., et al. (2021). An outdoor navigation assistance system for visually impaired people in public transportation. IEEE Access 9, 130767–130777. doi: 10.1109/access.2021.3111544
Mehta, S., and Apple, M. R. (2022). MobileViT: light-weight, general-purpose, and Mobile-friendly vision transformer. ICLR 22:3. doi: 10.48550/arXiv.2110.02178
Mei, Y., Fan, Y., Zhou, Y., Huang, L., Huang, T. S., and Shi, H. (2020). Image super-resolution with cross-scale non-local attention and exhaustive self-exemplars mining. arXiv. doi: 10.48550/arxiv.2006.01424
Messaoudi, M. D., Menelas, B. A. J., and Mcheick, H. (2020). Autonomous smart white cane navigation system for indoor usage. Technologies 8:37. doi: 10.3390/technologies8030037
Misawa, N., Yamaguchi, R., Yamada, A., Wang, T., Matsui, C., and Takeuchi, K. (2024). Design methodology of compact edge vision transformer CiM considering non-volatile memory bit precision and memory error tolerance. Jap. J. Appl. Phys. 63:03SP05. doi: 10.35848/1347-4065/ad1bbd
Mujtaba, G., Malik, A., and Ryu, E. (2022). LTC-SUM: lightweight client-driven personalized video summarization framework using 2D CNN. IEEE access 10, 103041–103055. doi: 10.1109/access.2022.3209275
Petit, O., Thome, N., Rambour, C., Themyr, L., Collins, T., and Soler, L. (2021). “U-net transformer: self and cross attention for medical image segmentation” in Machine learning in medical imaging. eds. C. Lian, et al. (Cham: Springer International Publishing), 267–276.
Qi, M., and Zhang, H. (2023). Dimensional emotion recognition based on two stream CNN fusion attention mechanism. Third International Conference on Sensors and Information Technology (ICSI 2023). (Eds.). H. Kannan and J. Hemanth. International Society for Optics and Photonics.
Ronneberger, O., Fischer, P., and Brox, T. (2015). U-net: convolutional networks for biomedical image segmentation. Cham: Springer.
Sandler, M., Howard, A., Zhu, M., Zhmoginov, A., and Chen, L.-C. (2018). “MobileNetV2: inverted residuals and linear bottlenecks,” in 2018 IEEE/CVF Conference on Computer Vision and Pattern Recognition, 4510–4520.
Shah, P. A., Hessah, A. R. A. A., and Rayan, H. M. A. A. (2023). Machine learning-based smart assistance system for the visually impaired. 139–144. doi: 10.1109/ITT59889.2023.10184257
Sun, S., Yue, X., Zhao, H., Torr, P. H. S., and Bai, S. (2022). ‘Patch-based separable transformer for visual recognition. IEEE transactions on pattern analysis and machine intelligence 22, 1–8. doi: 10.1109/tpami.2022.3231725
Tao, Y., and Ganz, A. (2020). Simulation framework for evaluation of indoor navigation systems. IEEE access 8, 20028–20042. doi: 10.1109/ACCESS.2020.2968435
Thakur, P. S., Chaturvedi, S., Khanna, P., Sheorey, T., and Ojha, A. (2023). Vision transformer meets convolutional neural network for plant disease classification. Eco. Inform. 77:102245. doi: 10.1016/j.ecoinf.2023.102245
Theodorou, P., Tsiligkos, K., Meliones, A., and Tsigris, A. (2022). An extended usability and UX evaluation of a Mobile application for the navigation of individuals with blindness and visual impairments indoors: an evaluation approach combined with training sessions. Br. J. Vis. Impair. 42, 86–123. doi: 10.1177/02646196221131739
Vaswani, A., Shazeer, N., Parmar, N., Uszkoreit, J., Jones, L., Gomez, A. N., et al. (2023). Attention is all youneed. arXiv. doi: 10.48550/arXiv.1706.03762
Wang, X., Girshick, R., Gupta, A., and He, K. (2018). “Non-local neural networks,”in 2018 IEEE/CVF Conference on Computer Vision and Pattern Recognition, 7794–7803.
Wang, Y., Yi, B., and Yu, K. (2022). Exploration and research about key technologies concerning deep learning models targeting Mobile terminals. J. Phys. Conf. Series 2303:012086. doi: 10.1088/1742-6596/2303/1/012086
Wang, Z., Jianbo, W., Pengfei, M., Fuyong, W., and Wenbao, D. (2019). “Evaluation for parachute reliability based on fiducial inference and Bayesian network,” in Proceedings of the 2018 International Conference on Mathematics, Modeling, Simulation and Statistics Application (MMSSA 2018). London: Atlantis Press.
Wen, F., Wang, M., and Hu, X. (2023). DFAM-DETR: deformable feature based attention mechanism DETR on slender object detection. IEICE Trans. Inf. Syst. E106, 401–409. doi: 10.1587/transinf.2022edp7111
Xia, Z., and Kim, J. (2023). Enhancing mask transformer with auxiliary convolution layers for semantic segmentation. Sensors 23:20581. doi: 10.3390/s23020581
Yeung, M., Sala, E., Schönlieb, C. B., and Rundo, L. (2022). Unified focal loss: generalising dice and cross entropy-based losses to handle class imbalanced medical image segmentation. Comput. Med. Imaging Graph. 95:102026. doi: 10.1016/j.compmedimag.2021.102026
Zhang, Y., Liu, H., and Hu, Q. (2021) ‘TransFuse: fusing transformers and CNNs for medical image segmentation’, in M. Bruijnede Medical Image Computing and Computer Assisted Intervention -- MICCAI 2021. Cham: Springer International Publishing, 14–24
Zhang, Z., Gao, Q., Liu, L., and He, Y. (2023). A high-quality Rice leaf disease image data augmentation method based on a dual GAN. IEEE access 11, 21176–21191. doi: 10.1109/access.2023.3251098
Zhou, C., Zhang, X., and Zhong, Y. (2024). Are transformers more suitable for plant disease identification than convolutional neural networks?. doi: 10.21203/rs.3.rs-4284240/v1
Zhou, L., Zhu, M., Xiong, D., Ouyang, L., Ouyang, Y., and Zhang, X. (2023). MR image reconstruction via non-local attention networks. Fourteenth International Conference on Graphics and Image Processing (ICGIP 2022). (Eds.) L. Xiao and J Xue. International Society for Optics and Photonics.
Zhu, L., Kang, Z., Zhou, M., Yang, X., Wang, Z., Cao, Z., et al. (2022). CMANet: cross-modality attention network for indoor-scene semantic segmentation. Sensors 22:8520. doi: 10.3390/s22218520
Keywords: indoor navigation, computer vision, markers, assistive technology, mobile devices
Citation: Triyono L, Gernowo R and Prayitno (2025) MoNetViT: an efficient fusion of CNN and transformer technologies for visual navigation assistance with multi query attention. Front. Comput. Sci. 7:1510252. doi: 10.3389/fcomp.2025.1510252
Edited by:
Sokratis Makrogiannis, Delaware State University, United StatesReviewed by:
Karisma Putra, Muhammadiyah University of Yogyakarta, IndonesiaMosiur Rahaman, Asia University, Taiwan
Copyright © 2025 Triyono, Gernowo and Prayitno. This is an open-access article distributed under the terms of the Creative Commons Attribution License (CC BY). The use, distribution or reproduction in other forums is permitted, provided the original author(s) and the copyright owner(s) are credited and that the original publication in this journal is cited, in accordance with accepted academic practice. No use, distribution or reproduction is permitted which does not comply with these terms.
*Correspondence: Liliek Triyono, bGlsaWVrLnRyaXlvbm9AcG9saW5lcy5hYy5pZA==