 Sarita Paudel
- Department of Science and Technology, Institute of Digitalisation and Informatics, IMC University of Applied Sciences, Krems, Austria
With the introduction of new Information and Communication Technology (ICT) to Electrical Power Systems (EPSs) there is an increased potential and impact of cyber-attacks. Phasor Measurement Units (PMUs) enable very fine granular measurements to allow situational awareness in smart grids. But false data injection attacks, which manipulate measurement data, can trigger wrong decisions and cause critical situations in the grid. In this paper, we analyze four different false data injection attacks on PMU measurements and investigate different methods to detect such attacks. Classical bad data detection methods are not sufficient to detect stealthy attacks. We therefore propose to complement detection by additional methods. For this we analyze the detection performance of four very different detection methods: (a) the classical adaptive bad data detection approach based on the residuals of linear Kalman Filters, (b) a simple threshold based on the Median Average Deviation (MAD), (c) a distribution-based approach using the Kullback-Leibler Divergence (KLD), and (d) the cumulative sum (CUSUM) as a representative of a change point detection method. We show that each method has advantages and disadvantages and that multiple methods should be used together to prevent that attackers can circumvent detection.
1 Introduction
The integration of Information and Communication Technology (ICT) into Electric Power Systems (EPSs) supports enhanced monitoring and control capabilities. An important use of ICT in this context is to enable situation awareness with respect to the EPS's state. To enable situation awareness, a Wide Area Monitoring System (WAMS) can be deployed that includes distributed sensors, which measure power system state, and communication technologies that enable the transmission of this state to a control center. The data that is collected using a WAMS can be used to support real-time decision making by operators, e.g., in order to respond to a fault, and to facilitate grid planning.
An important technology that has emerged in recent years is Phasor Measurement Units (PMUs). These devices can measure power system state—e.g., voltage, power, and phase angle—at very high frequencies (50 Hz), and can be used to support real-time situation awareness. The data from PMUs can be transmitted over a wide-area network using specialized protocols, such as IEC 61850, to a control center. One important use of the data that has been collected by PMUs is to estimate the state of the power system, e.g., where there is a lack of monitoring capability available or to mitigate measurement noise. There are several approaches to State Estimation (SE). An increasingly popular approach is to use Kalman filters, which have been shown to be robust.
With the introduction of this new technology to EPS's, there is a corresponding increase in risk from cyber-attacks. An example is the 2015 cyber-attack on the Ukraine power grid that caused a regional blackout.
Similarly, cyber-attacks to a WAMS could have significant consequences—in the short-term, if they are used to support fault isolation, incorrect switching decisions could be made, and in the longer-term, if the measurements derived from them are used to support grid planning, sub-optimal and expensive investment strategies could be employed.
An important class of attacks to WAMS are False Data Injection (FDI) attacks, wherein an attacker manipulates data (e.g., voltage and power measurements) to misdirect the processes and systems that use it. Besides detecting an attack also the detection delay it important. The faster an attack is detected, the faster countermeasures can be put in place or decisions delayed until the data is verified. Moreover, researchers have investigated a class of FDI attack that are unobservable to algorithms that aim to detect bad data, normally caused by measurement noise. It has been shown that these unobservable attacks can result in significant consequences to an EPS.
In this paper, we present an investigation into the characteristics of four important and distinct methods for detecting FDI attacks to a WAMS: (a) a residuals-based approach using linear Kalman filters, as an example for an adaptive bad data detection method, (b) a simple threshold based on the Median Average Deviation (MAD), (c) a distribution-based approach using the Kullback-Leibler Divergence (KLD), and (d) the cumulative sum (CUSUM) as a representative of a change point detection method.
To see how differently these methods perform we inject four different attack types into a real PMU measurement data sets. We label the data and then use some part of the data as a training set to derive suitable thresholds for the different methods. We then use measurements that appeared later in time as test data, inject the four different attacks, and then analyze not only if the attacks are detected but also how fast the different methods would raise an alarm for the different attack types. Our findings show that most methods detect some kind of anomaly during attacks, but do not capture all of the modified data points. Also there is no single superior method that performs best for all attack types. A further important finding is that the detection delay varies a lot and highly depends on the attack type and the methods. We argue that grid operators need to deploy a set of multiple different methods to be able to detect different kinds of attacks and to keep up with the effort of sophisticated attackers that try to remain stealthy.
2 Related work
State estimation (SE) based on PMU data is covered in many publications. Jones (2011) and Jones et al. (2013) present PMU-based linear SE for voltage and current. Pignati et al. (2014, 2015) present a three phase linear SE using Discrete Kalman Filter (DKF) and PMU measurements from an EPFL distribution system. Similarly, Sarri et al. (2016) present a three phases SE model based on the same data set. Several proposal have been made for bad data detection (BDD) based on the L2-norm of the residuals from SE (Liu et al., 2011) or normalized residuals (Abur, 2004; Korres and Manousakis, 2011). In Soule et al. (2005), Chowdhury et al. (1991), and Da Silva et al. (1987) the authors use post-fit residuals (difference between estimation and observation) for detecting false data injection attacks. A BDD method based on the pre-fit residuals (difference between prediction and observation) is presented in Pignati et al. (2014).
Manandhar et al. (2014) use a Kalman filter for SE and feed the estimated and original signal to two anomaly detectors: χ2 and a detector based on Euclidean distances between the estimated and measured data. The authors present the detection of a Denial of Service (DoS) attack, a continuous random attack, a short period random attack, a false data injection attack, and a load change attack using the proposed approaches. Similarly, Gokarn et al. (2017) use estimated values from a Kalman filter-based real-time state estimator for attack detection. The authors provide the estimated values to a k-NN algorithm to identify the behavior of the real time data. Nevertheless, it has been shown in Liu et al. (2011) and Dán and Sandberg (2010) that attackers can craft stealthy attacks that are not detected by classical BDD methods.
Averaging fusion methods help dealing with cyber-attacks. PMU data can be manipulated either on devices or in communication channel, i.e., on the way to data centers/control center. Implementation of averaging fusion methods on PMUs network helps to suppress false information due to the FDI attacks. Arithmetic average (AA) based (Li and Hlawatsch, 2021) and geometric average (GA) based (Mahler, 2000) fusion are widely used in distributed sensor networks (Wei et al., 2023). Both fusion methods are derived from the minimization of Kullback-Leibler Divergence (Li et al., 2019) and applicable to linear or non-linear approaches (Heskes, 1998; Hwang et al., 2004).
The above mentioned KLD optimization property of the fusion methods is extended in probability hypothesis density (PDF) functions. Yang et al. (2024) proposed a hybrid (AA and GA) PDF averaging fusion framework, and proved that the framework is resilient to FDI and DoS attacks. The hybrid framework uses AA fusion to compensate for information shortage due to DoS attack and GA fusion to suppress false information due to FDI. Similarly, authors in Yang et al. (2018) proposed a data fusion algorithm to combat FDI attacks in a networked radar systems and claimed that the algorithm dramatically reduced the attack's adverse effects.
Other methods have been proposed to detect anomalies in sensor data. Leys et al. (2013) and Miller (1991) recommend a simply use the Median Average Deviation (MAD) as a robust outlier detection method, and suggested different level of decision for deriving intervals. Chen and Wang (2017) demonstrate that, for false data injection attacks, CUSUM is the fastest anomaly detection technique when compared to a log-likelihood ratio test and extended Kalman filter-based test. Similarly, Kurt et al. (2018) propose a distributed and centralized anomaly detection approach for false data injection and DoS attacks. The authors perform simulations using the IEEE 14 bus power system, and demonstrate that CUSUM is robust and can quickly detect anomalies for time varying states and attacks. Krishna et al. (2016) propose an approach to electricity theft detection, which manifest as false meter readings, using Kullback-Leibler (KL) divergence. This original work was extended by the authors by proposing a model for anomaly detection, also using KL divergence, to detect and mitigate smart meter fraud.
In our work we investigate how different detection methods perform on four different attack types. We use a discrete Kalman Filter (DKF) for estimating states and use the EPFL data set used in Pignati et al. (2014), Pignati et al. (2015), Sarri et al. (2016), and Paudel and Shaaban (2024). To show the effects of the different methods we simplify the model used in Sarri et al. (2016) to a one phase SE model. We adopt the pre-fit residual BDD method described in Pignati et al. (2014) and then apply MAD, CUSUM and KLD-based detection to detect false data attacks that we injected in the EPFL measurement data.
3 State estimation
State estimation uses observed measurement values to estimate the true state of the system. For our investigations we use PMU measured voltage-phasors for estimating the system states. We estimate the voltage using a simplified SE model (derived from Sarri et al., 2016) based on only one phase on a single link. Existing works Pignati et al. (2014, 2015), Sarri et al. (2016), and Jones et al. (2013) provide approaches for linear SE based on three phases. If the phases are mutually coupled, the SE dependents on three phases. Similar to Zanni (2017), we make the assumption that the phases are independent to each other, so that we can estimate the states of each phases separately.
Using rectangular coordinates allows us to apply linear state estimation. Thus the one phase system true state x is simply represented by real and imaginary voltage (Equation 1).
All measured values are expressed by the vector z. In our case the measurement vector also consists of the observed real voltage and the observed imaginary voltage.
3.1 State estimation with linear weighted least squares
In Sarri et al. (2016) two state estimation methods are compared: Linear Weighted Least Squares (LWLS) and Discrete Kalman Filter (DKF). Since we use a very simple model, the simple LWLS estimator in our case would just use the measured values zk at time step k as estimates for the states xk. So the residuals from the LWLS estimation would always be zero and residual-based BDD would fail. More sophisticate SE methods also include previous measurements to calculate an estimate. We therefore focus on an SE model using a discrete Kalman Filter (DKF) as presented below and analyze if in this case attacks could be detected by BDD.
3.2 State estimation with Discrete Kalman Filter
For the DKF, the previous states xk−1 are taken into account to estimate the current state xk as shown in Equation 3.
where A is an m×m matrix that relates the current state xk to the previous state xk−1, represents a set of control variables at time step k, B is a m×l matrix that relates a system state to the control variables uk, and represents the process noise at time step k, with p(w)~N(0, Qk) with process noise covariance matrix Qk.
In accordance to Sarri et al. (2016), we use an auto-regressive integrated moving average (ARIMA) model of order (0,1,0) and therefore assume no control input (B = 0) and simply predict the current state using the previous state with an identity matrix (A = I) (see Sarri et al., 2016). Therefore, the model is reduced to Equation 4.
The relation between the measurement zk at time step k and the (unknown) true state xk at time k can be expressed as
where H is the observation matrix that relates the true state to the observed state and vk is the measurement noise. In our simple model H is the identity matrix, because we estimate the voltage state directly from the measured voltage. The measurement noise is assumed to be Gaussian with measurement noise covariance matrix R, so p(v)~N(0, R).
The prediction (a priori state estimate) of a state at time k is based on the previous estimated state k−1 and determined using Equation 6.
where is the posteriori estimated state from time step k−1.
4 Attack model
In this section, we introduce a general model for FDI attacks. We use attacks on voltage measurements as an example. Similar attacks can be performed on other measurement values, such as frequency, current or phase angle.
Since PMU measurements are used for estimating the states of a power system, data integrity attacks on PMU measurements can lead to incorrect estimated states and potentially bad control decisions. Similar to Liu et al. (2011), Cui et al. (2012), Bobba et al. (2010), and Mohammad (2018), we focus on FDI attacks. But, distinctly, we express different forms of attack using a single model.
It is assumed that an attacker does not want to exceed any safety limits that result in immediate operator intervention, but rather their aim is to discretely poison measurement data. This poisoning can influence historic data for planning or post-incident analysis, influence SE or also be used to prepare an attack, e.g., by poisoning the “new normal,” such that the manipulated data points are taken as a reference for the subsequent time step.
In our example, the attacker is manipulating only the polar voltage measurement values, as shown in Equation 7.
Here zk is the kth voltage measurement value, ak is the attack component (that the attacker adds to the measurements) and is the manipulated measurement value at k. The actual measurement in rectangular form is represented as in Equation (8).
The attack on the polar voltage affects the measurements in rectangular form. The manipulated real and imaginary voltage can be expressed using Equation 9.
where ck, 1 is the resulting offset in real voltage and ck, 2 is the resulting offset in imaginary voltage at time step k.
To define different attacks, we describe the attack component as a combination of a random component rk, with , a linear increasing component s·k+c with a slope s and a constant offset c.
By varying these attack parameters, different types of FDI attacks can be defined. In our experiments, four general types of attack are considered:
1. Constant offset, in which c>0 and all other parameters are zero. Specifically, an attacker adds an offset such that the first manipulated voltage reaches an additional 75% of the nominal voltage and then keeps the offset constant for all observations;
2. Random offset, in which a random component r and a constant c are added;
3. Incremental constant offset, in which a linearly increasing offset is added with s·k+c; and
4. Incremental random offset, in which a random and a linear component rk+s·k+c are added.
Table 1 describes these attacks and the parameters that have been used for experiments.
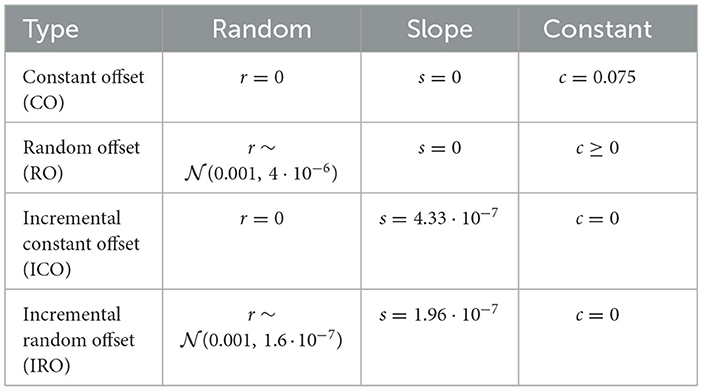
Table 1. Attack parameters and attack types.
Voltage phasor measurements need to be converted from polar to rectangular forms using phase angles. Therefore, aiming to remain undetected and adding a totally new polar voltage (by combining the attack parameters) in the existing data set needs compromising phase angle in the power system. Compromising and manipulating phase angle in a power system is out of the scope of this research. Therefore, the attack model presented in this paper is adequate for the given scenario.
5 Data preprocessing
For experiments, we use real PMU measurement data that has been provided by the École Polytechnique Fédérale de Lausanne and insert the FDI attacks described in Section 4. A 20kV active distribution network is deployed on the EPFL campus. To build reference data for our experiments, we use data from different days and always take it from the same hour (2 am–3 am) per day. The measurement frequency is always 50 Hz. Table 2 shows detailed information about the data sets that were used in our experiments, including the total number of data points, number of Benign Anomalies (BAs), and the number of injected Malicious Anomalies (MAs)—see below for how these are defined. Figure 1 summarizes how the EPFL data has been processed for our experiments.
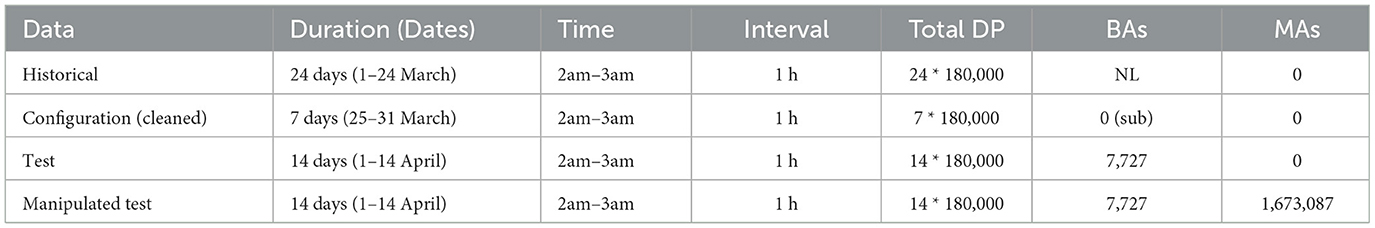
Table 2. Data sets used for experiment, showing number of all data points (Total DP), benign anomalies (BA), malicious anomalies (MA), not labeled (NL), substituted (sub).
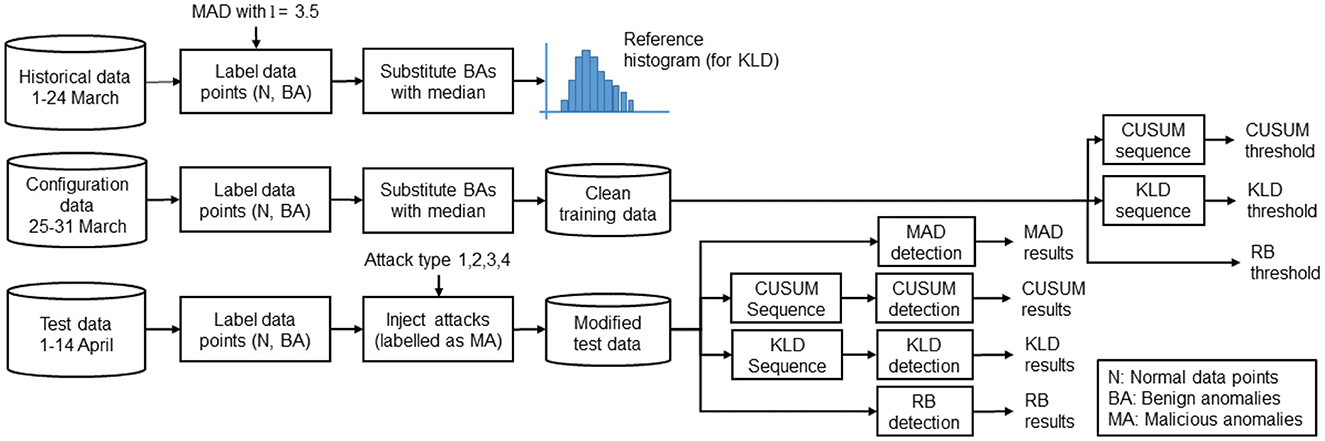
Figure 1. Overview of data processing steps.
First, the data is separated into three portions: historical, configuration, and test data. The historical data is used for building a reference histogram for the distribution-based KLD method. The configuration data is used as a reference for setting thresholds. For this, we take data from seven different days, always using 1 h from each day. The test data is used to evaluate our algorithms; for this, we use data from 14 different days.
It is assumed that there are no attacks in the original EPFL data. To distinguish between normal and anomalous data in the original data, we use the MAD method with a decision level 3.5 to mark all data outside the interval median−3.5·MAD<xi<median+3.5 ·MAD as BAs, and all data within the interval as normal data points.
In the configuration data, the BAs are replaced by the median to get a data set with only normal data points. This data is then used to set thresholds in a way that all normal data points are below the threshold. In the test data, we keep the BAs and, in addition, inject the four attack types described in Section 4; affected data points are labeled as MAs. However, if the data point was already labeled as a BA, that label persists, because the anomaly is not initially caused by the attack. We add the attack in each of the 14 test data files, which each contain one hour of measurement data. All attacks start at the 60, 001st measurement. We assume that the attacker is running a program to add an attack component, and does not check the values before. Therefore, we manipulate the data by always adding the component a(k) to the original value.
As presented in our previous work (Paudel et al., 2018), the residual-based (RB) detection method for voltage measurements proposed in Pignati et al. (2014) fails for data with phase angle variations. To compare our results with the RB method from Pignati et al. (2014), we fix the phase angle in the measured data of each hour with the first observed value.
5.1 Performance metrics
To measure the performance of a detection method, we compare the original labels (BA or MA) of the manipulated test data with the predicted labels from the method. From this we calculate the sum of several metrics: (a) true positives (TP), i.e., the BAs or MAs that have been correctly identified as an anomaly; (b) true negatives (TN), i.e., how many normal data points are correctly classified as normal; (c) false positives (FP), i.e., how many normal data points are classified as anomalies; and (d) false negatives (FN), i.e., how many anomalies we miss (anomalies classified as normal). From these measures, the accuracy, recall, false positive rate (FPR), and precision are calculated.
If a data point is accidentally detected as an attack (false positive) then the normal data is treated as an anomaly and can be replaced/corrected by another data which will influence applications like state estimation. False positive influences state estimation in a way that it predicts wrong state which triggers wrong control actions. For instance, if an anomaly detection method has high false positives, then it impacts the state estimation and leads to incorrect decisions.
In addition, we determine the detection delay that shows how fast an attack is detected. The delay is the difference (in the number of measurements) between the real start of the attack ks and the measurement k when the first data point of the attack was correctly classified as an anomaly. The detection delay has significant implications regarding the invocation of countermeasures and the prevention of further poisoning the measurement values, and could motivate the choice of detection method to apply.
6 Bad data detection
Data sources can have errors; therefore, many grid operators implement bad data detection (BDD) methods to check for them in the measurements that could influence SE. Since BDD methods detect data that deviates from the norm, they could detect manipulated data. However, previous work has shown that an informed attacker can evade detection (Liu et al., 2011; Teixeira et al., 2010). In this section, we apply residual-based BDD algorithms to investigate whether the attacks described in Section 4 can be detected.
6.1 Residual-based detection of anomalies
Residuals are the difference between predictions and observations (so-called pre-fit residuals) or the difference between estimation and observation (post-fit residuals). If residuals are too high, it is inferred the data is bad. To determine whether a residual is too high, a threshold is set for the L2-Norm (Liu et al., 2011) or normalized residuals (Abur, 2004; Korres and Manousakis, 2011).
For our study, we use a method proposed by Pignati et al. (2014) that performs Linear State Estimation (LSE) using a Discrete Kalman Filters (DKF), to estimate the power system voltage states, based on the PMU measurements. The pre-fit residual (yk) (or innovation) is determined using Equation 11, where zk is the observed measurement vector at iteration k (represented by Equation 5), H is the observation model (a matrix that relates the true state to the observed measurements) and is the predicted state (represented by Equation 6), predicted from the previous state.
The innovation covariance (Sk) is based on the past and current iterations of the DKF, and is determined using Equation 12, where Pk∣k−1 is the predicted process covariance matrix.
Sk changes in response to sudden changes in system state. The predicted process covariance matrix depends on the previous process covariance matrix (Pk−1∣k−1) and the current process noise covariance matrix (Qk).
Detection is performed by checking if the pre-fit residuals exceed a threshold Tnormalized, as shown in Equation 13.
Meanwhile, the L2-Norm of the pre-fit residuals is determined using the approach proposed by Liu et al. (2011) (see Equation 14).
Similarly, detection is performed by comparing the L2-Norm of the pre-fit residuals to a threshold TL2, as shown in Equation 15, where TL2 is determined from training data.
A detailed description of the parameters (e.g., Sk, Pk, R, yk) and the anomaly detection method is presented in our previous work (Paudel et al., 2018).
6.2 Experiment setup
We use the cleaned training data (see Table 2) to calculate the innovation covariance, the normalized pre-fit residuals and the L2-Norm of the residuals. We then define a threshold such that all data from the pre-fit residuals from the training data stay below the threshold. For this, we calculate the MAD and set a decision level such that all normal data points lie within the interval. The threshold for normalized residuals is set to 10.65 and 1.41 for L2-Norm.
Since a linear Kalman Filter is used, detection is based on identifying anomalies in the imaginary and real part of the voltage (Paudel et al., 2018). All of the anomalies that are detected in either the real or imaginary voltage are counted. An example of the original and the manipulated data can be seen in Figure 2. The effect of the constant offset attack to the imaginary voltage is shown in Figure 2B. The estimated signal from the Kalman Filter is shown in the second row. We then calculate the residuals for the manipulated test data (third row), and their L2-Norm and normalized value (fourth and fifth row). The residual-based thresholds are used to classify the data points as normal or anomalous.
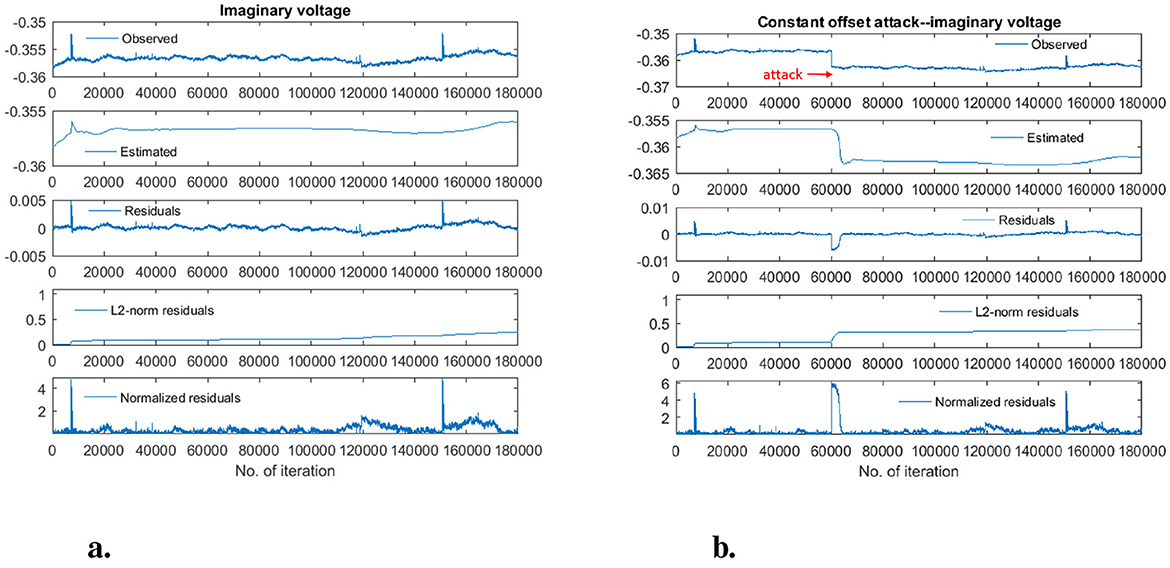
Figure 2. Original, manipulated and estimated imaginary voltage, residuals, and corresponding L2-Norm and normalized residuals of imaginary voltage. (A) Normal operation. (B) Constant offset attack.
6.3 Experiment findings
None of the manipulated data points, caused by the four attacks, were detected using the L2-Norm of the residuals. However, some were detected using the normalized residuals—these results are summarized. The average detection performance (across the 14 test data sets) for the different attack types are shown in Table 3. The detection rate is very low for all of the attacks, as indicated by the recall values. Clearly, the BDD method is not able to reliably detect the four proposed attacks, even using the normalized residuals.

Table 3. Average detection performance of the residual-based BDD using normalized residuals for four false data injection attacks.
A close inspection of the data points that were detected as anomalous was performed. Insights from this analysis can provide requirements for alternative—more effective—means of detecting the attacks. Typical results that show the data points that were detected as anomalous are shown in Figure 3 (Results from the ICO attack are not shown, for space reasons; however, they have the same characteristics as those for the IRO).
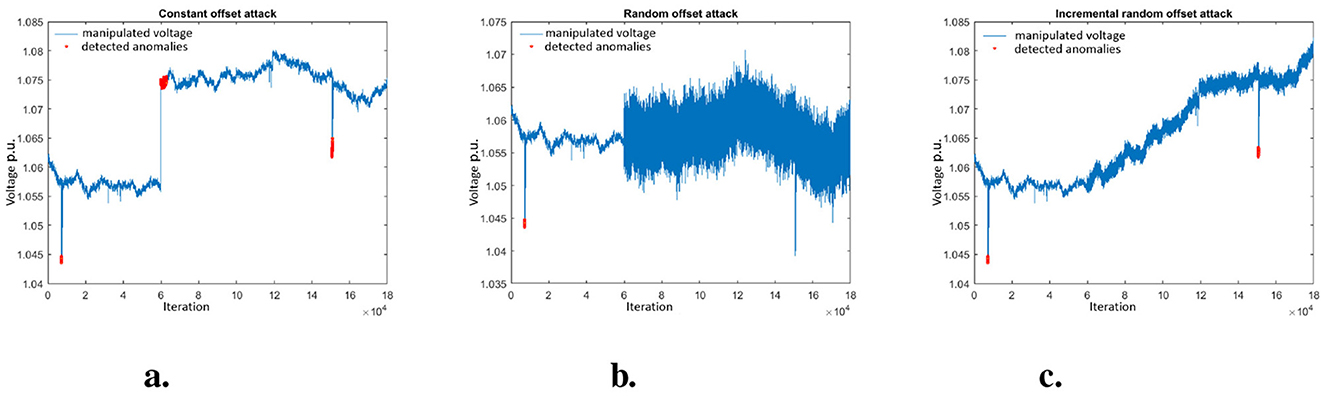
Figure 3. Visualization of detected anomalies in constant offset attack using RB. (A) Constant offset attack. (B) Random offset attack. (C) Incremental random offset attack.
Figure 3A shows an example plot in which a CO attack was detected. It can be seen that the onset of the attack is identified when the attack starts at the 6,001st iteration. Initially, the estimated state yielded by the DKF results in a normalized residual that is sufficiently large to fall outside the detection threshold. However, the DKF adapts to the manipulated data—consequently, the residuals become smaller and the higher manipulated voltage is, after several iterations, considered normal. Meanwhile, the attack persists.
Similarly, the BDD method detects benign transient anomalies, as depicted in Figure 3A at approximately 900 and 1,500 iterations. Although we cannot confirm it, these anomalies are likely to be attributable to short non-critical transients (or noise) in the EPFL distribution grid (In our experiments, 7,191 of these anomalies were detected). Consequently, in practice, these anomalies may not be escalated to an operator.
Figure 3B shows how the BDD method is not able to detect RO attack, despite it being observably anomalous. The normalized residuals do not exceed the detection threshold.
The IRO attack is also not reliably detected, as shown in Figure 3C. This is because the attack gradually manipulates the measured data—in a way that is not abrupt enough to be detected, as in the CO attack—and the DKF “learns” the manipulated values. Subsequently, the estimated state from the DKF reflects the manipulated data. Nevertheless, our previous work (Paudel et al., 2018) has shown this attack results in a noticeable change in the distribution of measured data over time.
In summary, these experiments indicate that the attacks that are defined in Section 4 cannot be reliably detected by the BDD method. Alternative approaches are required.
7 Anomaly detection methods
To more effectively detect our FDI attacks, we propose the use of three well-established statistical anomaly detection methods, which have been applied to similar problems (Messinis and Hatziargyriou, 2018; Chandola et al., 2009; Zhang et al., 2007, 2010; Rassam et al., 2012): (i) a measure of dispersion—the median absolute deviation (MAD); (ii) a distribution-based method—the Kullback-Leibler Divergence (KLD); and (iii) a change detection method—the cumulative sum (CUSUM). We have chosen to apply relatively simple statistical methods, in contrast to, e.g., machine learning-based approaches, to promote the scrutability (understanding) of the results they produce—a desirable property for use in a critical infrastructure setting, such as power distribution networks. These anomaly detection methods are expected to be variously suitable for detecting different attack types—overall detection performance could be improved by combining their output. To this end, we propose the use of a weighted voted scheme (Lueckenga et al., 2016)—originally applied to machine learning algorithms—to combine the results of the algorithms. It is also assumed the anomaly detection methods can be deployed on multiple regions e.g., substations, control centers.
7.1 Anomaly detection algorithms
7.1.1 Median absolute deviation
The MAD is determined by first calculating the median M of the data points. Subsequently, for each data point, the difference to the median (xi−M) is calculated. The MAD is then defined as the median of those differences (Maronna et al., 2006), as shown in Equation 16. To use the MAD as an estimator for the standard deviation, it is multiplied by a scaling factor b, which depends on the distribution of the data—for normally distributed data, which is the case here, b = 1.4826 (Rousseeuw and Croux, 1993).
To define a threshold for detection decisions based on the MAD, a MAD interval can be defined, wherein l is the decision level (Equation 17). Data that are outside the MAD interval are deemed to be anomalous.
7.1.2 Kullback-Leibler Divergence
KLD measures the difference between two probability distributions over the same variable (Kullback and Leibler, 1951; Kullback, 1968). The KLD of a distribution Q(x) from a reference distribution P(x) is a measure of information loss, if we use Q(x) to approximate P(x). The KLD can be used to check a distribution of observations against a reference distribution. We derive a reference distribution from historic data and then use the KLD to compare a sliding time window of test data with the reference distribution. The KLD between two discrete probability distributions P(x) and Q(x) over a discrete domain is calculated using Equation 18 (Gupta et al., 2016; Chaojun et al., 2015). DKL(P∣∣Q) is ≥0 and is only zero if P(x) and Q(x) are equal.
A threshold can be defined for KLD values that are deemed to be anomalous. Section 7.2 describes how this is done in our experiments using the MAD interval.
7.1.3 Cumulative sum
The Cumulative Sum (CUSUM) is a sequential analysis method to detect change points in time series. A two-sided CUSUM algorithm is applied to detect changes in the mean in both directions: or . Using the definitions from Basseville and Nikiforov (1993) (Chapter 2), we define the sufficient statistic si for detecting a change of the mean from μ0 to μ1 in a Gaussian distribution with constant variance σ2, as follows (Equation 19).
For detecting a change point at time tn from observations xi to xk, we build the sum Sn from the si (Equation 20):
We incorporate in the threshold and can therefore express the si in a more simple way as
We then define and as
and set the alarm time to the point where either of them exceeds the threshold TCUSUM.
7.1.4 Weighted voting
To explore whether combining results can improve overall detection performance, a weighted voting (WV) scheme is applied, based on previous work by Lueckenga et al. (2016). In this scheme, positive and negative weights are assigned that reflect a method's prediction accuracy, based on its true positive and negative rates. The weights are assigned using Equation 25, in which x is assigned the true positive and true negative rates of the algorithm. Variables a and b are control variables, which we assign a = 1 and b = 0.85 in the same way as Lueckenga et al. (2016)
To determine whether an anomaly is detected, the weights of the algorithms that predict an anomaly are summed and compared with the sum of the negative weights from those that predict a benign result; the largest value determines the overall prediction.
7.2 Experiment setup
For the anomaly detection experiments, the same data sets and process for defining normal and malicious data points that is described in Section 5 is used—Figure 1 summarizes these processing steps. The anomaly detection methods have been configured, as follows.
For the MAD-based anomaly detection, the decision level is l = 3.5. This is the same level that was used to label the training and test data.
The KLD method requires a reference histogram. To create this, data that have been labeled as normal from the historical set are used. A configuration data set is used to define the detection threshold for KLD. To set the threshold, the KLD is calculated between the reference and configuration data using a one-minute-sized sliding window that progresses in one second steps. Subsequently, we calculate the MAD of this sequence of KLD values and define a decision level l, such that all normal data points lie within the MAD interval. For testing, data that is outside the interval are labeled as anomalous. The KLD method determines whether a window of test data is anomalous—some of this data may not be part of the attack. To calculate the detection performance for KLD, all of the data within an anomalously labeled window is marked as such. We adopted this approach as it reflects how the method would be used in practice. Consequently, more data points are marked as anomalous, resulting in a higher recall and false positive rates; this was confirmed by calculating the results by discriminating between malicious and benign data within a window.
For the CUSUM method, we calculate the CUSUM upper and lower bound , for the configuration data. The MAD is calculated for this sequence of CUSUM values and a decision level is set so that all normal data points lie within the interval. For testing, the CUSUM is calculated and the MAD-based threshold is used to label data as normal or anomalous.
Finally, for the weighted voting scheme, x (the weights) is assigned based on the true and false negative rates of each algorithm using the results from the experiments.
7.3 Experiment results
Table 4 shows the performance for detecting anomalies in the manipulated test data for the different attacks and detection methods. As with the BDD experiments, the overall performance metrics are shown, which are calculated from all of the data points from all fourteen of the manipulated test data sets. All methods detect the CO attack well. The RO attack is better detected by CUSUM than by MAD and KLD. MAD has a lower false positive rate than KLD and CUSUM in all attack types. Similarly, MAD also has higher precision than KLD and CUSUM in attack types CO, ICO, IRO.

Table 4. The average detection performance of the anomaly detection methods for the four attack types.
In addition, Table 5 summarizes how quickly the attacks are detected, showing the minimum, maximum and average detection delay (measure in number of data points after the attack started). An attack is assumed to be detected if at least one of the malicious data points is detected as an anomaly. It therefore only summarizes the detection delay for the malicious anomalies and does not consider the detection delay for the benign anomalies that occurred before the attack. The detection delay shows the number of data points between attack start and the first detection of an anomaly. In comparison to other methods, CUSUM's detection is delayed in most of the attacks because at the beginning changes in mean due to the attacks stay within the allowed variation in the mean.
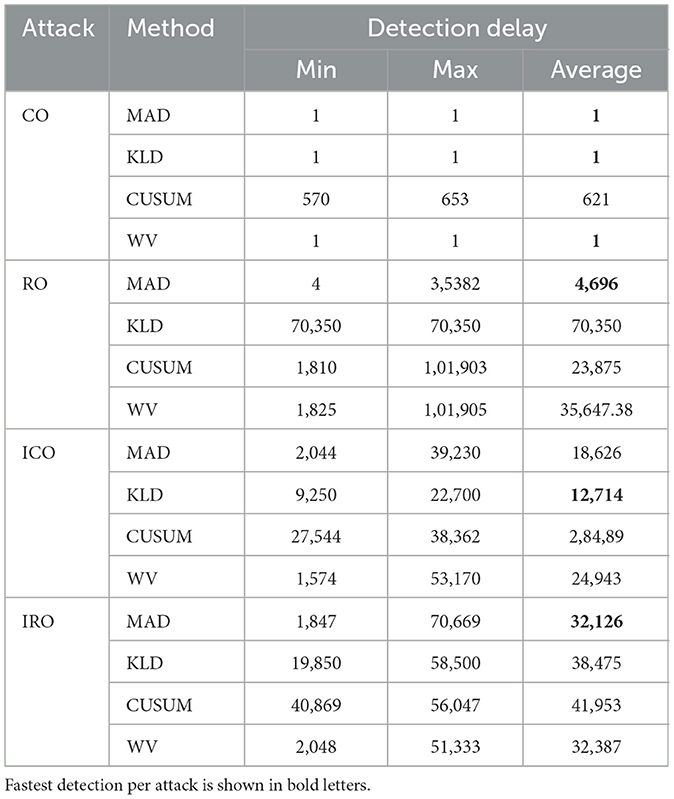
Table 5. The detection delay for the anomaly detection methods and attack types.
7.4 Interpretation of detection results per attack
7.4.1 Constant offset attack
The CO attack is well detected by all the anomaly detection methods. Therefore combining BDD with one of the analyzed methods would be suitable to detect such attacks. If we look at the detection delay we can see big differences among the methods. MAD picks up the attack always immediately when the first anomalous data point occurs (see Table 5). The KLD (window based) needs longer than MAD to detect that a change has occurred (between 1,499 and 3,049 iterations). This can be explained, because the window progresses over the attack data points and only after some time the histogram of the data points in the window differs sufficiently from the reference histogram so that it is detected as anomaly. CUSUM needs much longer to detect the attacks (570 to 653 iterations). This is because it needs some time until the constant change influences the mean value. In the following we look further into details to explain the different effects. Figure 4 shows the manipulated voltage for the CO attack for the first (out of the 14) test data set. The anomalies that were detected by the four different methods are shown as red data points.
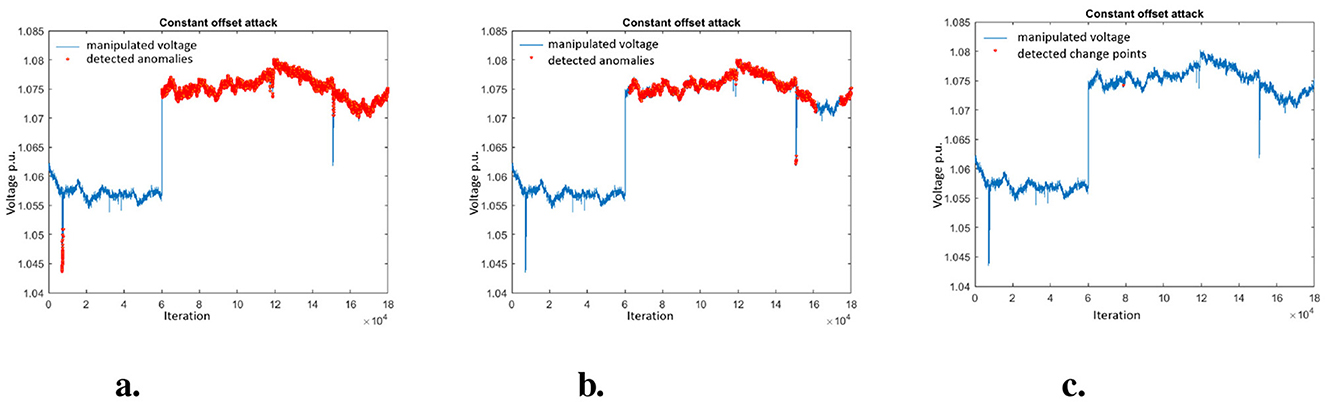
Figure 4. Visualization of detected anomalies in constant offset attack. (A) Detected anomalies using MAD. (B) Detected anomalies using KLD. (C) Detected change points using CUSUM.
One can see how the simple MAD method picks up the anomaly generated by the attack immediately (at the 60,001th measurement) and detects most of the following anomalous data points (Figure 4A). This is not surprising because the attack just suddenly increases the voltage and the MAD just checks for a threshold. The MAD also correctly detects the benign anomaly at the beginning of the trace.
For the KLD (window based) method one can see that the attack is also detected but a bit later (Figure 4B). The CUSUM method detects a change point at iteration 570 but it takes a bit time until the change is recognized. Also one can clearly see how the benign anomaly in the beginning is not detected as change point by CUSUM, because it just consist of a few outliers that do not significantly change the mean.
7.4.2 Random offset attack
The malicious data points due to the RO attack are quite difficult to detect. With the MAD method the overall accuracy for all test data is only 36.10% and the recall is 4.65%. That means we miss more than 95% of the anomalous data points. KLD (window based) and CUSUM perform even worse. CUSUM misses all anomalous data point of the attacks type RO (recall = 0%). KLD detects < 2% of the anomalies (recall = 1.6%) in all 14 data sets using the window-based approach.
These two results can be explained, because the random offset is performed by adding values from a random normal distribution with mean μ = 0.001 (see Table 1). For KLD it seems that most of the added random values stay within the reference histogram, which is no surprise for data coming from a normal distribution. Also with a mean μ = 0.001 the attack only slightly influences the mean over time and therefore will not exceed the CUSUM threshold.
Figure 5 shows the manipulated data for attack RO for the first test data set. It can be seen that the MAD method only detect those random data points which by chance exceeded the threshold. KLD detects not a single anomaly in the first data set, because even with the random added data points the histograms in the sliding windows do not differ much from the reference histogram. This can be seen in the sequence of KLD values shown in Figure 5B, where each data point represents the KLD which compares the histogram calculated from a sliding window (size 1 min, sliding step 1 sec) of the data with the reference histogram. From Figure 5C one can see that also the calculated CUSUM values stay way below the threshold.
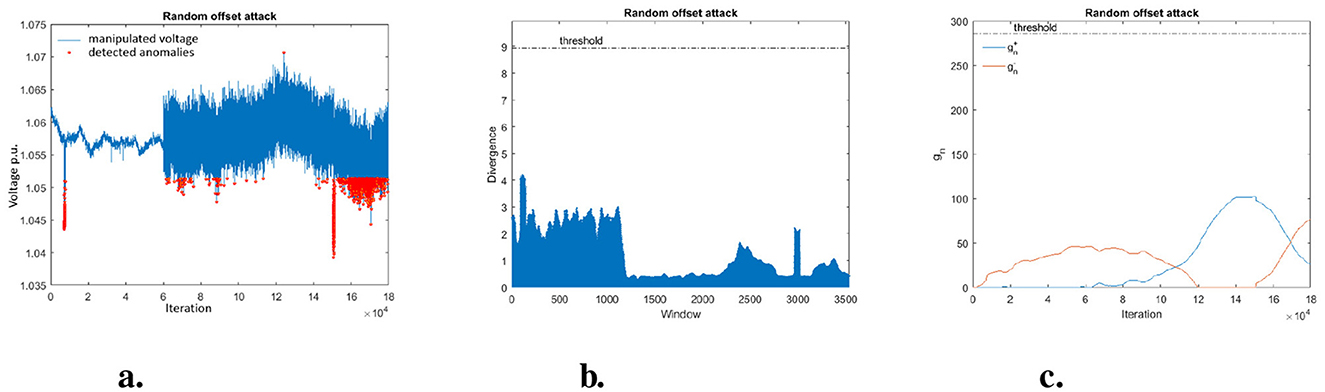
Figure 5. Visualization of detected anomalies by MAD, KLD-and-CUSUM sequence in random offset attack. (A) MAD detection. (B) KLD sequence. (C) CUSUM sequence.
7.4.3 Incremental constant offset attack
The ICO attack is detected well by all methods (see Figure 6). But due to the incremental increase, the attack is only detected after it exceeds a threshold. Therefore the overall performance for MAD and KLD is slightly worse than for the constant offset and the detection takes much longer (see Table 5). CUSUM also detects the attack (see first red point in Figure 6C) but only quite late (the fastest detection was 27,544 iterations after the attack start).
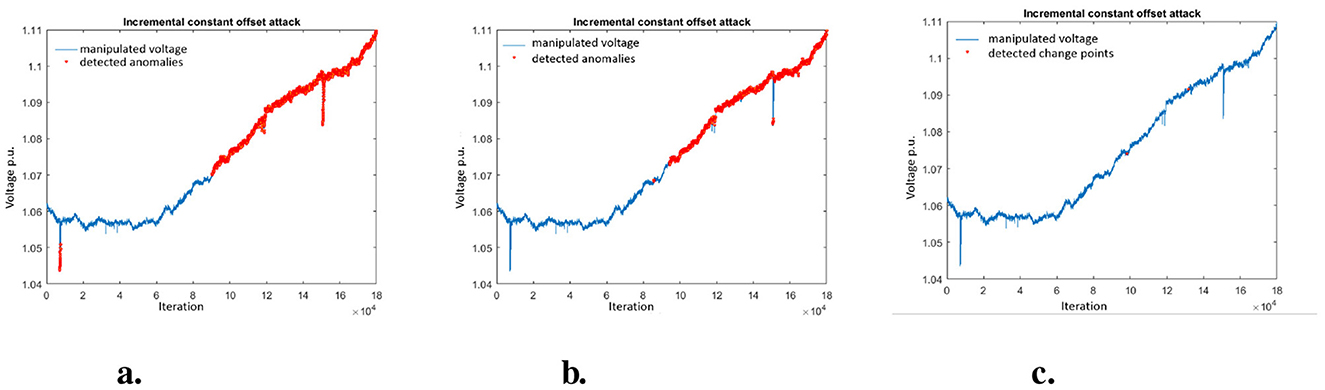
Figure 6. Visualization of detected anomalies in incremental constant offset attack. (A) Detected anomalis using MAD. (B) Detected anomalies using KLD. (C) Detected change points using CUSUM.
7.4.4 Incremental random offset attack
The IRO attack is detected by MAD, KLD, and CUSUM but on average it takes longer than for the pure incremental offset (ICO attack) until anomalies are detected (see Figure 7). This can be explained by the random component that in some cases prevents that thresholds are exceeded. So adding some random noise can be of advantage for attackers to hide malicious activities.
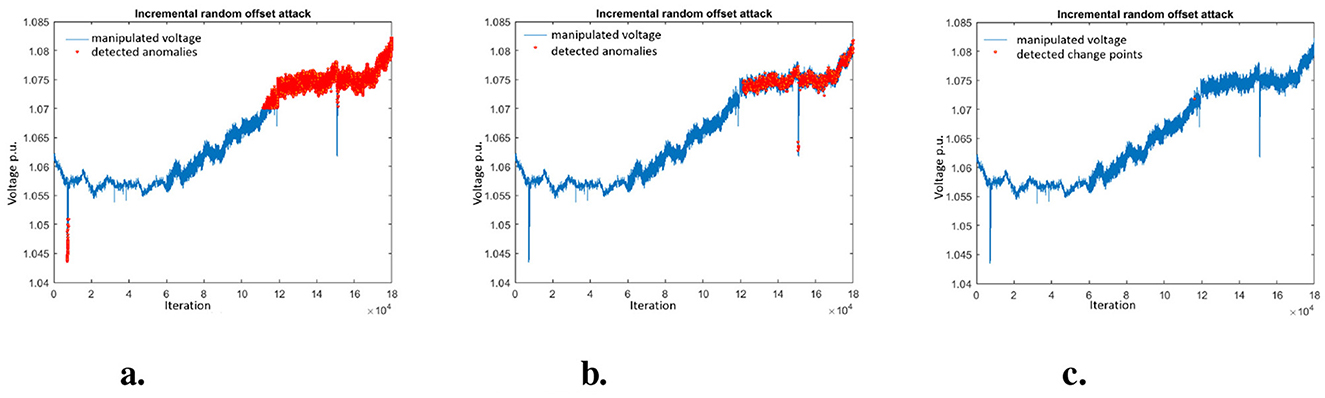
Figure 7. Visualization of detected anomalies in incremental random offset attack. (A) Detected anomalies using MAD. (B) Detected anomalies using KLD. (C) Detected change points using CUSUM.
7.5 Summary of findings
Besides the general observations already discussed in Sections 7.3, 7.4, we can conclude the following findings from the results above:
• Malicious behavior not detected by BDD methods are detected by the methods MAD, KLD, and CUSUM.
• MAD performs well and fast for sudden increases. It might be a good candidate to be applied in addition to BDD. Nevertheless, it fails for random offsets that remains below the threshold.
• KLD detects anomalies with some delay but then consistently detects subsequent anomalies.
• CUSUM completely fails for detecting the random offset attacks.
• Detection delay varies a lot among methods and attack types. MAD picks up changes earlier then KLD or CUSUM.
• Adding some random noise can be of advantage for attackers to hide malicious activities. It also increases detection delays and therefore prevent early detection.
• The combined method enhanced anomaly detection performance as it detected all attacks (at least some anomalous data points); and has a higher precision than the individual methods as it triggered less false alarms.
As a consequence, we conclude that one should not rely on a single method but instead combine several methods in order to prevent that an attacker can circumvent detection. The combined results were more trustworthy than the results of the individual methods.
8 Conclusion
In this paper we analyze four different false data injection attacks on PMU measurements with very different detection methods based on real PMU data. We apply a Residual Based (RB) BDD method to the attacks and identify that three of the attacks are not detected by the RB method. Then we analyze the performance and detection delay of three other methods: (a) a simple threshold based on the median average deviation (MAD), (b) a distribution-based approach using the Kullback-Leibler Divergence (KLD), and (c) the cumulative sum (CUSUM) as a representative of a change point detection method.
Our findings show that no single superior method exists that performs best for all attack types. Traditional bad data detection methods based on residuals from state estimation may be tricked by informed attackers and shows a bad detection performance for maliciously injected attacks. But if additional anomaly detection methods are applied, the detection performance can be significantly improved even with simple methods. Since the different methods show different advantages for particular attack types, especially the combination of methods from different detection concepts (e.g., simple threshold, distribution-based, and change point detection) proves to be powerful to detect a broad variety of attacks.
Another important finding is that the detection delay varies a lot among attack type and methods. This needs to be taken into account since this influences the time needed to invoke countermeasures and therefore can influence the damage caused by an attack.
From our findings we argue that grid operators need to combine a set of multiple different methods in order to be able to detect different attack types and to keep up with the effort of sophisticated attackers that try to hide from detection methods.
In our scenarios, we focus on specific FDI attack types and consider a desirable property for using in a critical infrastructure setting with few computational resources. Our future endeavors will include more generalized attack scenarios and real-world implementation challenges like methods integration into existing grid management system, computation time.
Data availability statement
Publicly available datasets were analyzed in this study. This data can be found here: https://www.epfl.ch/labs/desl-pwrs/smartgrid/monitoring/.
Author contributions
SP: Conceptualization, Data curation, Funding acquisition, Investigation, Methodology, Resources, Software, Validation, Visualization, Writing – original draft, Writing – review & editing.
Funding
The author(s) declare that no financial support was received for the research, authorship, and/or publication of this article.
Conflict of interest
The author declares that the research was conducted in the absence of any commercial or financial relationships that could be construed as a potential conflict of interest.
Generative AI statement
The authors declare that no Generative AI was used in the creation of this manuscript.
Publisher's note
All claims expressed in this article are solely those of the authors and do not necessarily represent those of their affiliated organizations, or those of the publisher, the editors and the reviewers. Any product that may be evaluated in this article, or claim that may be made by its manufacturer, is not guaranteed or endorsed by the publisher.
References
Abur, A. (2004). Power System State Estimation: Theory and Implementation. New York: Marcel Dekker. doi: 10.1201/9780203913673
Basseville, M., and Nikiforov, I. V. (1993). Detection of Abrupt Changes: Theory and Application. Upper Saddle River, NJ, USA: Prentice-Hall, Inc.
Bobba, R. B., Rogers, K. M., Wang, Q., Khurana, H., Nahrstedt, K., and Overbye, T. J. (2010). “Detecting false data injection attacks on dc state estimation,” in Preprints of the first workshop on secure control systems, CPSWEEK (Vol. 2010).
Chandola, V., Banerjee, A., and Kumar, V. (2009). Anomaly detection: a survey. ACM Comput. Surv. 41, 1–58. doi: 10.1145/1541880.1541882
Chaojun, G., Jirutitijaroen, P., and Motani, M. (2015). Detecting false data injection attacks in AC state estimation. IEEE Trans. Smart Grid 6, 2476–2483. doi: 10.1109/TSG.2015.2388545
Chen, L., and Wang, X. (2020). Quickest attack detection in smart grid based on sequential Monte Carlo filtering. IET Smart Grid 3, 686–696. doi: 10.1049/iet-stg.2019.0320
Chowdhury, F. N., Christensen, J. P., and Aravena, J. L. (1991). Power system fault detection and state estimation using Kalman filter with hypothesis testing. IEEE Trans. Power Deliv. 6, 1025–1030. doi: 10.1109/61.85843
Cui, S., Han, Z., Kar, S., Kim, T. T., Poor, H. V., and Tajer, A. (2012). Coordinated data-injection attack and detection in the smart grid: a detailed look at enriching detection solutions. IEEE Signal Proc. Magaz. 29, 106–115. doi: 10.1109/MSP.2012.2185911
Da Silva, A. L., Do Coutto Filho, M. B., and Cantera, J. M. C. (1987). An efficient dynamic state estimation algorithm including bad data processing. IEEE Trans. Power Syst. 2, 1050–1058. doi: 10.1109/TPWRS.1987.4335300
Dán, G., and Sandberg, H. (2010). “Stealth attacks and protection schemes for state estimators in power systems,” in 2010 First IEEE International Conference on Smart Grid Communications (IEEE), 214–219. doi: 10.1109/SMARTGRID.2010.5622046
École Polytechnique Fédérale de Lausanne (EPFL). Epfl smart grid. Available at: https://smartgrid.epfl.ch/ (accessed June 6, 2023).
Gokarn, V., Kulkarni, V., and Saquib, Z. (2017). “Enhancing control system security of power grid using anomaly detection and behaviour analysis,” in 2017 International Conference on Advances in Computing, Communications and Informatics (ICACCI) (IEEE), 1249–1255. doi: 10.1109/ICACCI.2017.8126013
Gupta, S., Waghmare, S., Kazi, F., Wagh, S., and Singh, N. (2016). “Blackout risk analysis in smart grid WAMPAC system using KL divergence approach,” in 2016 IEEE 6th International Conference on Power Systems (ICPS) (IEEE), 1–6. doi: 10.1109/ICPES.2016.7584069
Heskes, T. (1998). “Selecting weighting factors in logarithmic opinion pools,” in Advances in Neural Information Processing Systems.
Hwang, I., Roy, K., Balakrishnan, H., and Tomlin, C. J. (2004). “A distributed multiple-target identity management algorithm in sensor networks,” in 2004 43rd IEEE Conference on Decision and Control (CDC) (Cat. No.04CH37601) (IEEE), 728–734. doi: 10.1109/CDC.2004.1428738
Jones, K. D. (2011). Three-phase linear state estimation with phasor measurements. Doctoral dissertation, Virginia Tech.
Jones, K. D., Thorp, J. S., and Gardner, R. M. (2013). “Three-phase linear state estimation using phasor measurements,” in 2013 IEEE Power and Energy Society General Meeting (IEEE), 1–5. doi: 10.1109/PESMG.2013.6672516
Korres, G. N., and Manousakis, N. M. (2011). State estimation and bad data processing for systems including PMU and SCADA measurements. Electric Power Syst. Res. 81, 1514–1524. doi: 10.1016/j.epsr.2011.03.013
Krishna, V. B., Lee, K., Weaver, G. A., Iyer, R. K., and Sanders, W. H. (2016). “F-DETA: a framework for detecting electricity theft attacks in smart grids,” in 2016 46th Annual IEEE/IFIP International Conference on Dependable Systems and Networks (DSN) (IEEE), 407–418. doi: 10.1109/DSN.2016.44
Kullback, S., and Leibler, R. A. (1951). On information and sufficiency. Ann. Mathem. Stat. 22, 79–86. doi: 10.1214/aoms/1177729694
Kurt, M. N., Yílmaz, Y., and Wang, X. (2018). Distributed quickest detection of cyber-attacks in smart grid. IEEE Trans. Inf. Foren. Secur. 13, 2015–2030. doi: 10.1109/TIFS.2018.2800908
Leys, C., Ley, C., Klein, O., Bernard, P., and Licata, L. (2013). Detecting outliers: do not use standard deviation around the mean, use absolute deviation around the median. J. Exper. Soc. Psychol. 49, 764–766. doi: 10.1016/j.jesp.2013.03.013
Li, T., Fan, H., García, J., and Corchado, J. M. (2019). Second-order statistics analysis and comparison between arithmetic and geometric average fusion: application to multi-sensor target tracking. Inf. Fusion 51, 233–243. doi: 10.1016/j.inffus.2019.02.009
Li, T., and Hlawatsch, F. (2021). A distributed particle-PHD filter using arithmetic-average fusion of gaussian mixture parameters. Inf. Fusion 73, 111–124. doi: 10.1016/j.inffus.2021.02.020
Liu, Y., Ning, P., and Reiter, M. K. (2011). “False data injection attacks against state estimation in electric power grids,” in Proceedings of the 16th ACM Conference on Computer and Communications Security, CCS '011.
Lueckenga, J., Engel, D., and Green, R. (2016). “Weighted vote algorithm combination technique for anomaly based smart grid intrusion detection systems,” in 2016 International Joint Conference on Neural Networks (IJCNN), 2738–2742. doi: 10.1109/IJCNN.2016.7727543
Mahler, R. P. S. (2000). “Optimal/robust distributed data fusion: a unified approach,” in SPIE Defense + Commercial Sensing. doi: 10.1117/12.395064
Manandhar, K., Cao, X., Hu, F., and Liu, Y. (2014). Detection of faults and attacks including false data injection attack in smart grid using Kalman filter. IEEE Trans. Control Netw. Syst. 1, 370–379. doi: 10.1109/TCNS.2014.2357531
Maronna, R. A., Martin, R. D., Yohai, V. J., and Salibián-Barrera, M. (2006). Robust Statistics: Theory and Methods. Toronto, ON: John Wiley and Sons Canada Ltd. doi: 10.1002/0470010940
Messinis, G. M., and Hatziargyriou, N. D. (2018). Review of non-technical loss detection methods. Electr. Power Syst. Res. 158, 250–266. doi: 10.1016/j.epsr.2018.01.005
Miller, J. (1991). Reaction time analysis with outlier exclusion: bias varies with sample size. Quart. J. Exper. Psychol. Sect. A 43, 907–912. doi: 10.1080/14640749108400962
Mohammad, M. (2018). Smart false data injection attacks against state estimation in power grid. arXiv preprint arXiv:1809.07039.
Paudel, S., and Shaaban, A. M. (2024). “Toward a knowledge-based anomaly identification system for detecting anomalies in the smart grid,” in Database and Expert Systems Applications - DEXA 2024 Workshops, eds. B. Moser, L. Fischer, A. Mashkoor, J. Sametinger, A.-C. Glock, M. Mayr et al. (Cham: Springer Nature Switzerland), 44–53. doi: 10.1007/978-3-031-68302-2_4
Paudel, S., Smith, P., and Zseby, T. (2018). “Stealthy attacks on smart grid PMU state estimation,” in Proceedings of the 13th International Conference on Availability, Reliability and Security, 1–10. doi: 10.1145/3230833.3230868
Pignati, M., Popovic, M., Barreto, S., Cherkaoui, R., Flores, G. D., Le Boudec, J. Y., et al. (2015). “Real-time state estimation of the EPFL-campus medium-voltage grid by using PMUs,” in 2015 IEEE Power and Energy Society Innovative Smart Grid Technologies Conference (ISGT) (IEEE), 1–5. doi: 10.1109/ISGT.2015.7131877
Pignati, M., Zanni, L., Sarri, S., Cherkaoui, R., Le Boudec, J. Y., and Paolone, M. (2014). “A pre-estimation filtering process of bad data for linear power systems state estimators using PMUs,” in 2014 Power Systems Computation Conference (IEEE), 1–8. doi: 10.1109/PSCC.2014.7038329
Rassam, M. A., Maarof, M. A., and Zainal, A. (2012). A survey of intrusion detection schemes in wireless sensor networks. Am. J. Appl. Sci. 9:1636. doi: 10.3844/ajassp.2012.1636.1652
Rousseeuw, P. J., and Croux, C. (1993). Alternatives to the median absolute deviation. J. Am. Statist. Assoc. 88, 1273–1283. doi: 10.1080/01621459.1993.10476408
Sarri, S., Zanni, L., Popovic, M., Le Boudec, J. Y., and Paolone, M. (2016). Performance assessment of linear state estimators using synchrophasor measurements. IEEE Trans. Instrument. Measur. 65, 535–548. doi: 10.1109/TIM.2015.2510598
Soule, A., Salamatian, K., and Taft, N. (2005). “Combining filtering and statistical methods for anomaly detection,” in Proceedings of the 5th ACM SIGCOMM conference on Internet Measurement, 31–31. doi: 10.1145/1330107.1330147
Teixeira, A., Amin, S., Sandberg, H., Johansson, K. H., and Sastry, S. S. (2010). “Cyber security analysis of state estimators in electric power systems,” in 49th IEEE Conference on Decision and Control (CDC) (IEEE), 5991–5998. doi: 10.1109/CDC.2010.5717318
Wei, J., Luo, F., Chen, S., and Qi, J. (2023). Robust fusion of gm-phd filters based on geometric average. Signal Proc. 206:108912. doi: 10.1016/j.sigpro.2022.108912
Yang, C., Feng, L., Zhang, H., He, S., and Shi, Z. (2018). A novel data fusion algorithm to combat false data injection attacks in networked radar systems. IEEE Trans. Signal Inf. Proc. Over Netw. 4, 125–136. doi: 10.1109/TSIPN.2018.2790361
Yang, H., Li, T., Yan, J., and Elvira, V. (2024). Hierarchical average fusion with gm-phd filters against fdi and dos attacks. IEEE Signal Process. Lett. 31, 934–938. doi: 10.1109/LSP.2024.3356823
Zanni, L. (2017). Power system estimation based on PMUs-static and dynamic approaches from theory to real implementation. Doctoral thesis.
Zhang, Y., Meratnia, N., and Havinga, P. (2010). Outlier detection techniques for wireless sensor networks: a survey. IEEE Commun. Surv. Tutor. 12, 159–170. doi: 10.1109/SURV.2010.021510.00088
Keywords: smart grid security, anomaly detection, PMU, phasor measurements, state estimation
Citation: Paudel S (2024) An evaluation of methods for detecting false data injection attacks in the smart grid. Front. Comput. Sci. 6:1504548. doi: 10.3389/fcomp.2024.1504548
Received: 01 October 2024; Accepted: 02 December 2024;
Published: 18 December 2024.
Edited by:
Massimo Merro, University of Verona, ItalyReviewed by:
Simone Soderi, IMT School for Advanced Studies Lucca, ItalyTiancheng Li, Northwestern Polytechnical University, China
Copyright © 2024 Paudel. This is an open-access article distributed under the terms of the Creative Commons Attribution License (CC BY). The use, distribution or reproduction in other forums is permitted, provided the original author(s) and the copyright owner(s) are credited and that the original publication in this journal is cited, in accordance with accepted academic practice. No use, distribution or reproduction is permitted which does not comply with these terms.
*Correspondence: Sarita Paudel, U2FyaXRhLlBhdWRlbEBpbWMuYWMuYXQ=