 Anuja Pinge
 Vinaya Gad
 Dheryta Jaisighani
 Surjya Ghosh
 Sougata Sen
- 1Department of Computer Science and Information Systems, Birla Institute of Technology and Science (BITS) Pilani Goa Campus, Sancoale, India
- 2Department of Computer Science, G.V.M'S Gopal Govind Poy Raiturcar College of Commerce and Economics, Ponda, India
- 3Department of Computer Science, University of Northern Iowa, Cedar Falls, IA, United States
- 4Birla Institute of Technology and Science (BITS) Pilani Goa Campus, Sancoale, India
- 5Department of Computer Science and Information Systems, APPCAIR, Birla Institute of Technology and Science (BITS) Pilani Goa Campus, Sancoale, India
Over the last few years, wearable devices have witnessed immense changes in terms of sensing capabilities. Wearable devices, with their ever-increasing number of sensors, have been instrumental in monitoring human activities, health-related indicators, and overall wellness. One health-related area that has rapidly adopted wearable devices is the mental health monitoring and well-being area, which covers problems such as psychological distress. The continuous monitoring capability of wearable devices allows the detection and monitoring of stress, thus enabling early detection of mental health problems. In this paper, we present a systematic review of the different types of sensors and wearable devices used by researchers to detect and monitor stress in individuals. We identify and detail the tasks such as data collection, data pre-processing, features computation, and training of the model explored by such research works. We review each step involved in stress detection and monitoring. We also discuss the scope and opportunities for further research that deals with the management of stress once it is detected.
1 Introduction
According to the World Health Organization, stress is defined as a state of worry or mental tension caused by a difficult situation (World Health Organization, 2024). One can experience physiological stress in various forms; some persist briefly, while others last longer (Dantzer et al., 2014). Short-term stress, such as one faced before an interview, is considered normal and beneficial in some instances; this short-term stress enhances an individual's mental and physical performance (Dhabhar, 2018). However, it is well-known that when physiological stress occurs frequently or if stress persists for a prolonged duration, i.e., when one suffers from chronic stress, it can affect the mental and physical health of the individual (Schneiderman et al., 2005; Selye, 1978). Prolonged chronic stress can cause mental health problems such as depression and anxiety. It can also lead to chronic diseases such as diabetes or high blood pressure (Chrousos, 2009). The field of preventive medicine has thus been identifying and developing approaches for several years that will enable detecting stress at its onset and reduce its negative consequences (Iqbal et al., 2021; Chambers and Belcher, 1994).
Traditional diagnoses of stress are either (a) pen-and-paper questionnaire-based or (b) group discussions or interview-based, or (c) via intrusive or labor-intensive approaches such as monitoring cortisol levels of individuals (Can et al., 2019a). These approaches primarily focus on obtaining the momentary snapshot of the person's mental health, as well as general information about the past history of an individual or family history (Sim, 2019). For example, PSS is an assessment tool to measure perceived stress levels in individuals (Cohen et al., 1994). It assesses how an individual is affected by various situations in daily life with a set of questions. An orthogonal approach to obtain a snapshot of stress experienced by an individual is via cortisol level monitoring in hair and saliva (Steinisch et al., 2014). Traditional questionnaire-based assessment of stress has its own set of challenges: it puts an extra burden on an individual to respond to the questions, the response can be subjective and biased and the questionnaire captures a snapshot of when the individual is filling out the questionnaire (Conner and Barrett, 2012; Heron and Smyth, 2010). Orthogonally, cortisol or other hormone monitoring-based approaches can be labor intensive, and similar to questionnaires, they capture a snapshot of the individual's stress level at a particular time.
More recently, smartphones and wearable devices have revolutionized the stress detection paradigm by enabling the monitoring of mental stress continuously (Cho et al., 2019; Gimpel et al., 2015). Smartphones and wearable devices are always “on” the person; they are usually embedded with multiple sensors that can continuously track various types of wearer's mental health information (Lane et al., 2010; Kumar et al., 2021; Jat and Grønli, 2022). It is well-known that the body of a person experiencing stress displays stress-related responses in various manners, like elevated heart rate, sweating, various biomarkers of HPA-Axis, and change in skin temperature (Carter and Goldstein, 2015; Hong et al., 2012; Noushad et al., 2021); smartphones and wearable devices are equipped with sensors to capture these responses. Indeed, several apps exist for modern smartwatches (either from the manufacturer or from developers) that display the stress level using data from the on-device sensors (Samsung, 2023; ActiveAce, 2023). In addition to collecting sensor data, many of these devices have I/O capabilities, which allows collecting pen-and-paper questionnaire-like responses – often called EMA (De Vries et al., 2021; Shiffman et al., 2008). EMAs are self-reports provided by a user for assessing the behavior or mood of an individual by asking questions related to the current state of mind or mood, i.e., their self-perceived state. The advantage of smartphone-based EMAs is that they can be delivered to the user multiple times a day. Various researchers used smartphones to collect social activity and also the responses to the EMAs (Sano and Picard, 2013; Sano et al., 2015; Wang et al., 2014; Sano et al., 2018; Egilmez et al., 2017; Taylor et al., 2017). These researchers delivered EMAs at various frequencies (Sano et al., 2018; Wang et al., 2014; Hovsepian et al., 2015), collecting information about mood, stress levels, or overall health condition. EMAs thus provide the capability of capturing the ground truth, as experienced by the end-user.
The past couple of decades have also seen a revolution in the field of machine learning, including running the machine learning algorithms on the wearable devices (Sen et al., 2015; Alharbi et al., 2023). The trending machine-learning approaches have contributed to building intelligent systems for stress detection and monitoring. Researchers use the machine learning pipeline in various ways on the smartphone and wearables' data for stress detection and monitoring (Hovsepian et al., 2015; Mishra et al., 2020; Egilmez et al., 2017). More recently, researchers have also used deep learning-based approaches for stress detection and monitoring. The collected self-reports (can be in the form of EMAs, pen-and-paper based, recall based Paulhus et al., 2007) are used as the ground truth for the building of these stress detection and monitoring models. In several cases, researchers make their collected dataset available publicly; other researchers use these publicly available datasets for developing stress detection and monitoring models (Mitro et al., 2023; Cahoon and Garcia, 2023).
In this review paper, we present recent trends in wearable-based stress detection and monitoring research works. We specifically focus on field study papers that use wearable devices and machine learning techniques for detecting and monitoring stress. This review seeks to address the following research questions:
Q.1. Which physiological signals and wearable devices contribute toward stress detection and monitoring? What are the challenges involved in deciding upon these physiological signals and wearable devices?
Q.2. What are the data collection methods used for the detection and monitoring of stress?
Q.3. What methods are used in the machine learning pipeline for stress detection and monitoring?
Q.4. What are the limitations in the state-of-the-art and future directions in the field of stress detection and monitoring?
One may argue that there have been several recent surveys on wearable-based stress detection (Vos et al., 2023; Klimek et al., 2023; Gedam and Paul, 2021). However, these reviews are either comprehensive reviews on publicly available datasets (Vos et al., 2023), or using a specific type of sensor (Klimek et al., 2023), or do not get into details about the sensors in wearable devices for stress detection and monitoring (Gedam and Paul, 2021). Furthermore, no review exists that investigates the fine-grained details of the machine-learning approaches used in stress monitoring. To summarize, these existing reviews do not cover details about the types of wearables used, pre-processing steps involved in cleaning the collected data, details about the features computed, and machine learning techniques or metrics suitable for wearable-based stress detection and monitoring. To fill in the existing gap, in this paper, we provide an in-depth review of stress-detecting and monitoring approaches in papers that have conducted user studies and used machine-learning techniques for stress detection. Wearable-based approaches for stress detection and monitoring collect data using wearables; this data is subsequently used for training machine learning models that can detect and monitor physiological stress. This paper compares different commonly used data pre-processing methods, features computed, machine learning techniques, and metrics used for wearable-based stress detection and monitoring.
Researchers have explored this field of stress detection and monitoring either by using publicly available datasets or by collecting data using physiological signals and wearable devices of interest. Using publicly available datasets eliminates the need for extensive data collection and thus helps save time and cost, resulting in quick validation and replication of the research findings. However, using publicly available datasets skips data collection and pre-processing steps, which hide challenges faced during the data collection and pre-processing. The goal of this review is to help new readers understand the stress detection process in detail, including the data collection steps. Thus, in this paper we do not consider the stress detection and monitoring approaches that use publicly available datasets. More details about the inclusion and exclusion criterion are provided in Section 2.
The rest of the paper is organized as follows: In Section 2, we discuss our literature search approach. We also describe the inclusion and exclusion criteria for selecting papers for review. In Section 3, we describe the different types of wearables and physiological signals used for detecting and monitoring stress. In Section 4, we discuss in detail each step involved in the stress detection pipeline. We then look at open questions and possible future directions in Section 5. Finally, Section 6 provides a conclusion to this review paper.
2 Materials and methods
The main objective of this work is to review papers that utilize wearable technology for physiological stress detection. In this section we first describe the strategy used for searching work relevant to wearable-based detection and monitoring of stress. We used the Preferred Reporting Items for Systematic Reviews and Meta-Analyzes (PRISMA) guidelines for systematic review (Page et al., 2021). We describe the steps followed (in accordance with the PRISMA guidelines) in this systematic review.
2.1 Literature search
To provide a comprehensive overview of stress detection and monitoring, we searched the Google Scholar database,1 the ACM Digital Library,2 PubMed database,3 and the IEEE Xplore database.4
For each database, the combination of keywords “wearables,” “automated,” “stress,” “monitoring,” “detection” were used. We performed a separate search in each database by combining these keywords and grouping them with appropriate concepts. The first literature search activity was performed in August 2023 and the second literature search was performed in December 2023. Therefore, studies published after this date were not included. The publication start year was not restricted in the search. However, to consider recent research approaches, we removed all papers that appeared before 2018. For each keyword, we obtained the top 50 results that were ordered based on the rank provided by the specific library's relevance algorithm. Overall, we evaluated 400 articles – 100 from each database. These 400 articles underwent the following steps. First, duplicate articles obtained from various databases were removed. Next, we screened papers based on title and abstract based on the eligibility and exclusion criteria. After this, we filtered articles that did not meet our inclusion criteria (mentioned in Section 2.2). Finally, the remaining papers were included in the review. We next describe the inclusion criteria and the number of papers remaining at the end of each filtering step. From the first search, we selected 29 papers, and later, from the second pass, we added 10 papers from the same sources, resulting in a total of 39 papers considered for the review.
2.2 Exclusion and inclusion criteria for the review
There has been a vast shift in the sensing from smartphones (Sano et al., 2015; Wang et al., 2014) to wearable sensors (Sano et al., 2018) in the last few years.
Below are the detailed exclusion criteria for this review paper:
- We consider recent and most relevant research works currently used for stress detection and monitoring. We exclude the peer-reviewed journal or conference articles that were published before 2018.
- This review article focuses on physiological stress experienced by humans. We excluded all articles that were not related to user studies performed on human participants.
- One of the primary objectives of this article is to review usage of wearable devices for stress monitoring. We did not consider articles that did not utilize wearable devices.
- As the underlying cause of stress and reaction to it may vary in teenagers and older adults (Li et al., 2016; Di Campli San Vito et al., 2023). We excluded the research studies conducted with the age group of less than 18 and greater than 60.
- We excluded research studies that performed stress detection or monitoring using publicly available datasets.
- We excluded survey papers as they do not have conducted user studies and other novel contributions (Yadav and Bokhari, 2023; Smirthy et al., 2023; Seng et al., 2023).
2.3 Screening and selection of articles
We next describe the literature search, the screening steps, and the number of articles excluded in each step. To start off, based on the literature search, we obtained n = 400 articles (100 from each database). Among these 400 articles, there were cases where the same article was returned by different databases. Overall, we observed that there were 66 duplicate articles that we removed. At the end of this step, we had n = 334 articles. Next we removed n = 122 articles that were published before 2018, leaving us with n = 212 articles. Next, based on the exclusion criteria, we removed n = 13 articles that were not related to user studies performed on human participants, n = 24 articles that did not utilize wearables, n = 71 articles that were not on stress detection or monitoring n = 16 articles that were conducted on minors (< 18 years) or elderly (>60 years), and n = 28 articles where stress detection was performed using publicly available datasets, i.e., that did not consist of a user study. We did not consider survey papers n = 21. Thus, overall n = 224 articles were filtered based on the exclusion criteria, leaving us with n = 39 articles for this review. Figure 1 presents the consort diagram of the search and screening strategy.
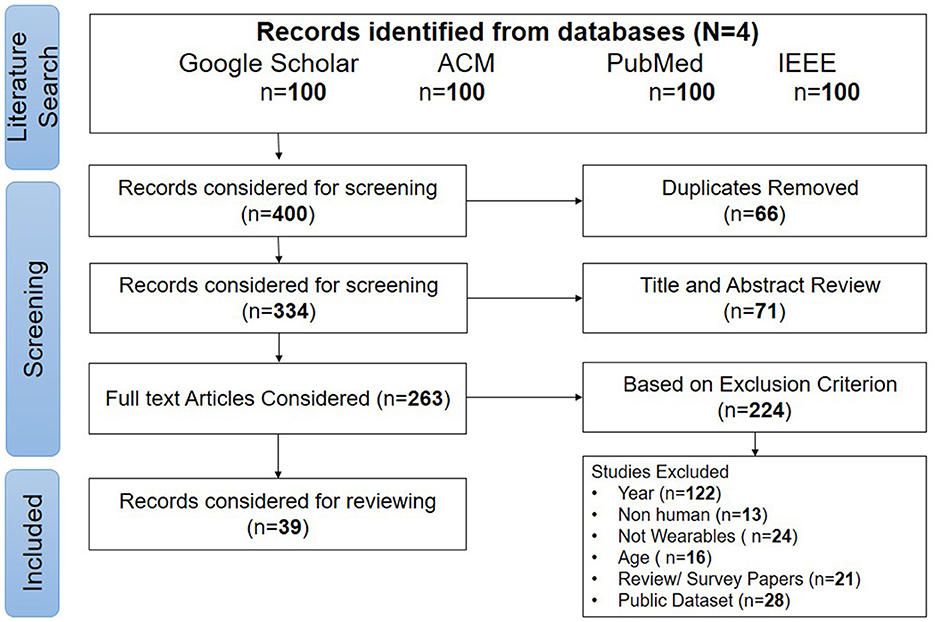
Figure 1. Consort diagram of article selection process.
We next evaluate these 39 articles in terms of the wearable technology used (Section 3) and the machine learning pipeline used in these articles (Section 4). The table summarizing all the research articles considered for this review are mentioned in Supplementary material.
3 Wearable sensing devices for detecting and monitoring stress
As mentioned in the previous section, we shall first explore the wearables used for stress detection and monitoring. This section describes the different wearable sensing technologies used by researchers to acquire physiological signals for stress detection and monitoring. However, before getting into the details of the wearables employed (described in Section 3.2), we first discuss various signals that show promising results in stress detection and monitoring (Section 3.1).
3.1 Physiological signals that enable detecting and monitoring stress
Biological processes of the human body result in changes in electrical, chemical, and mechanical signals. Signals produced by these processes are known as physiological signals (Cacioppo and Tassinary, 1990). For example, the heart's pumping activity generates electrical signals corresponding to the expansion and contraction of heart muscles resulting in a heartbeat pattern (Katz, 2010). Similarly, mechanical activity in the human body corresponds to movements of body parts such as lungs during respiration, and hand or leg movement during activity (Mohanavelu et al., 2017). Some physiological change or psychological arousal in the body can result in the production of body heat, which is then released in the form of sweat—another measurable physiological signal's proxy (Gerrett et al., 2018). Our body function comprises chemical activities such as digestion, metabolism, and hormone levels, which in turn can be responsible for one's physique or behavioral changes. Specific types of physiological changes can act as a proxy for the detection and monitoring of stress (Ghaderi et al., 2015). For example, the sweating rate change without any change in physical activity can be an indicator of stress (Gerrett et al., 2018). Stress levels in individuals can also be affected by environmental factors such as ambient temperature or ambient pressure (Gordon, 2003). Various physiological signals that can measure stress levels are heart activity, brain activity, electrodermal activity, blood volume pulse, skin temperature, and muscle activity (Ghaderi et al., 2015).
Let us now explore physiological signals used for stress detection and monitoring. Various physiological signals that contribute toward stress detection are heart activity, skin conductance, skin temperature, brain activity, and activity-related signals (Ghaderi et al., 2015). ECG or PPG techniques allow capturing various heart activity-related parameters such as HR, BVP, IBI, and HRV (Shrestha et al., 2023; Montesinos et al., 2019; Han et al., 2022; Lee et al., 2022). Heart rate indicates the number of times the heart beats per minute (BPM), which reflects as immediate feedback of physical activity, emotional stress or environmental factors (Shrestha et al., 2023; Campanella et al., 2023; Moser et al., 2023; Aristizabal et al., 2021; Aqajari et al., 2023; Subash et al., 2023). Heart rate is one of the physiological signals used in stress detection and monitoring. ECG measures the heart rate by capturing electrical signals using electrodes placed near the chest or arms (Bin Heyat et al., 2022; Donati et al., 2023; Akbulut et al., 2020; Chalmers et al., 2021; Tazarv et al., 2021; Sheeraz et al., 2022; Betti et al., 2017; Xefteris et al., 2023; Lee et al., 2022; Montesinos et al., 2019; Akmandor and Jha, 2017; Ashwin et al., 2022; Smets et al., 2018b; Amalan et al., 2019), whereas PPG captures heart rate by capturing optical signals using light and measuring the blood volume from reflected light (Shrestha et al., 2023; Campanella et al., 2023; Can et al., 2020). For heart rate measurement, ECG is considered to be more accurate than PPG (Pinge et al., 2022). But ECG has motion artifacts and requires putting the electrodes near the heart that is on the chest or on arms, which can lead to discomfort in individuals during long-run studies (Beeler et al., 2018). PPG, on the other hand, can collect heart rate from body positions such as wrist, neck, or finger, making it feasible for long-run studies. Other heart activity parameters include BVP which measures changes in blood volume (Montesinos et al., 2019), IBI which refers to the time interval between consecutive heartbeats, measured in milliseconds (Han et al., 2022; Tazarv et al., 2021) and HRV which is the variation in the time intervals between heartbeats. It is a measure of the variations in the IBIs (Lee et al., 2022; Rony and Ahmed, 2020; Park et al., 2018; Mishra et al., 2020; Benchekroun et al., 2022; Szakonyi et al., 2021). BVP is collected using PPG where as HRV and IBI can be collected using ECG or PPG techniques.
Stress, which is psychological arousal, results in the generation of sweat; the rate of change of sweat generation results in a change in moisture level on the skin, thus leading to a change in skin conductance (Wilkinson et al., 1964). This change in skin conductance is measured using EDA technique and is also known as GSR. Skin conductance also contributes toward stress detection and monitoring (Anusha et al., 2019; Carreiro et al., 2020; Campanella et al., 2023; Can et al., 2020; Ashwin et al., 2022; Can et al., 2019b; Betti et al., 2017; Amalan et al., 2019). Along with skin conductance, researchers also used skin temperature (Carreiro et al., 2020; Akbulut et al., 2020; Li and Sano, 2020; Smets et al., 2018b; Shajari et al., 2023; Rachakonda et al., 2020), respiration rate (Xefteris et al., 2023; Montesinos et al., 2019; Momeni et al., 2021), activity related signals (Carreiro et al., 2020; Tazarv et al., 2021; Shrestha et al., 2023; Xefteris et al., 2023; Smets et al., 2018b; Rachakonda et al., 2020; Rodrigues et al., 2018; Han et al., 2022). Other physiological signals used for stress detection and monitoring are blood oxygen level (Akbulut et al., 2020; Akmandor and Jha, 2017), blood pressure (Akmandor and Jha, 2017), EEG—a measurement of brain activity (Sheeraz et al., 2022; Betti et al., 2017; Lee et al., 2020; Ashwin et al., 2022), and EMG—a measurement of muscle activity (Mishra et al., 2020).
3.2 Wearable devices with stress detection and monitoring capabilities
Stress detection and monitoring requires capturing various body-generated signals from the individuals, as discussed in the previous subsection. Wearable devices with embedded sensors allow automatic collection of these physiological signals (Vijayan et al., 2021). Let us now look at wearable devices used for stress detection and monitoring.
Traditional medical ECG is captured using 12 leads (Khunti, 2014). This process of capturing the accurate ECG signal is sensitive toward the placement of these electrodes on specific parts of the body, such as the chest, arms, and legs. Therefore, the process of capturing ECG using the 12-leads can be tedious and time-consuming (Tomašić and Trobec, 2013). Another issue with traditional 12-lead ECG is that the setup is immobile, which makes it unsuitable for continuous monitoring of heart activity. Furthermore, traditional 12-lead ECG provides information that is usually interpreted by trained experts (Tomašić and Trobec, 2013). To avoid these issues, many healthcare companies have developed wearable devices with a varying number of leads to capture ECG and make it efficient and portable (Polar, 2024).
Chest-worn off-the-shelf devices: There are numerous chestbands available for commercial use. Along with heart activity, such chestbands are capable of collecting signals such as respiration, an inertial sensor, skin conductance, ambient temperature, and ambient pressure. For example, a Polar chestband can collect heart activity using ECG (Polar, 2024). Many researchers used earlier versions of the Polar chestband Polar H7 (Mishra et al., 2020) and recent Polar H10 (Lee et al., 2022; Zhao et al., 2023; Montesinos et al., 2019). Another chest-worn device that can capture ECG using one lead is Garmin HRM Dual (Garmin, 2024a). Similarly, Shimmer 3 ECG is another such chest-worn device that captures ECG with four leads (Shimmer, 2024). It also has 10 DoF (Degrees of Freedom) with an accelerometer, gyroscope, magnetometer, and air pressure sensor. Researchers used a similar device, Zephyr BioHarness 3 (BH3), which can capture one lead and other physiological signals such as respiration, body temperature, and body movement (Zephyr, 2024; Betti et al., 2017). A chest band from Autosense: a wireless system dedicated to stress detection captures 2-lead ECG along with respiration, ambient temperature, skin temperature, and accelerometer (Hojjatinia et al., 2021). Another chestband from BIOPAC measures EGG and respiration (BIOPAC, 2024; Kim et al., 2020). Various devices and their sensing capabilities are listed in Table 1.

Table 1. Sensorwise details and sampling frequency of chest-worn devices.
Wrist-worn off-the-shelf devices: Another commonly used class of wearables are wrist-worn devices. Several wrist-worn devices are embedded with the PPG sensor (Biswas et al., 2019). PPG measures heart rate by emitting light toward the skin and measuring changes in the blood volume from reflected light (Allen et al., 2021). PPG can be measured accurately from different body parts such as the forehead, ear, nose, neck, finger, wrist, or arm (Allen et al., 2021). Unlike the chest-worn devices, the wrist-worn devices capture heart activity by using PPG technique (Biswas et al., 2019). Researchers used wrist-worn devices such as Empatica E4 (Campanella et al., 2023; Moser et al., 2023; Carreiro et al., 2020), Fitbit (fitbit, 2024), Samsung Gear Sports Smartwatch (Samsung, 2024), and Garmin Vivosmart 4 (Garmin, 2024b) for stress detection and monitoring.
Other off-the-shelf devices: Researchers experimented with other devices, such as sensorized garments i.e., smart garments, to collect ECG and EDA signals (Bin Heyat et al., 2022; Donati et al., 2023; Xefteris et al., 2023; Wu et al., 2018). Researchers also used EEG signals, which are captured by sensing near the brain. Researchers used existing devices such as MindWave Mobile EEG headset (Betti et al., 2017) for collecting EEG signals. The wrist-worn devices and their sensing ability are listed in Table 2.
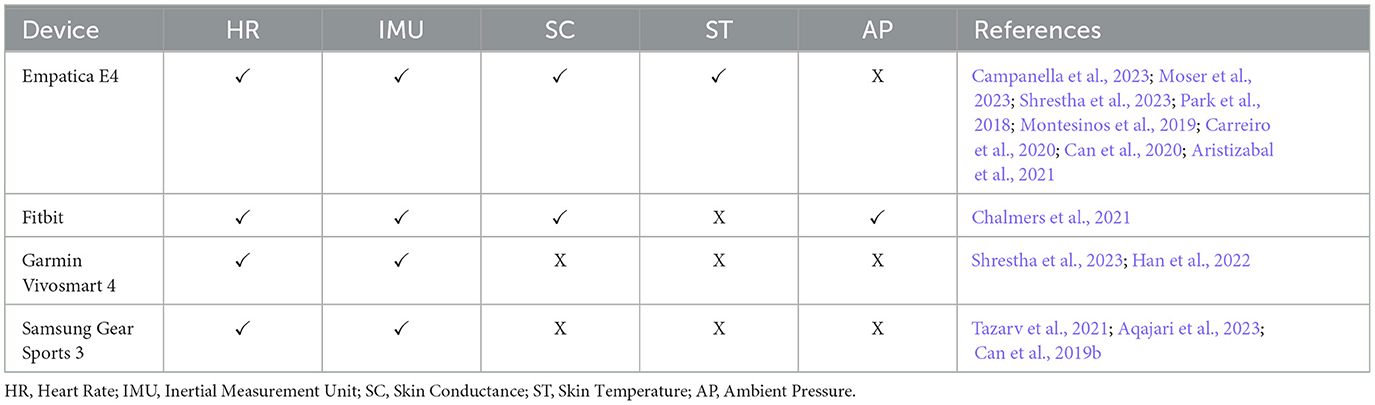
Table 2. Sensorwise details and sampling frequency of wrist-worn devices.
The sensing capabilities of all the wrist-worn devices are almost identical except for a few sensors, such as skin temperature, skin conductance or ambient pressure. The most commonly used device, Empatica E4, allows effortless data collection and retrieval via the suite provided, where the data can be downloaded at the click of a button, unlike Garmin Vivosmart 4, which needs a Bluetooth application to receive the data from the watch. Empatica E4 is costlier as compared to other devices such as Garmin Vivosmart 4, Fitbit, or Samsung Gear Watch (Empatica, 2024; Garminvivo, 2024). Researchers need to take into account the trade-off between the cost and effort involved in data collection when choosing these devices.
The chest-worn devices capture heart rate using ECG and hence are considered as more accurate as compared to PPG (Bent et al., 2020). But chest-worn devices are sensitive to motion artifacts which can result in the collection of noisy data (Rasti et al., 2023). Although the chest-worn devices are considered to be accurate, they may not be comfortable for long-run studies (Cosoli et al., 2020). In such cases, wrist-worn devices are considered for data collection. Additionally, wrist-worn devices have built-in memory, which helps to collect and store the data within the device, whereas most off-the-shelf chest-worn devices need an application to constantly receive the data. One major challenge in using the off-the-shelf device is that these devices may not have all the necessary sensors of interest in one device. Hence, researchers develop devices with custom sensors, which we will discuss next.
Custom-made devices: Custom-made devices have a micro-controller, which can control and synchronize between the various sensors connected to it. Researchers have developed their own devices with sensors like ECG (Akbulut et al., 2020; Sheeraz et al., 2022), PPG (Zubair and Yoon, 2019), EDA (Subash et al., 2023; Shajari et al., 2023) skin temperature (Rachakonda et al., 2020; Subash et al., 2023), EEG (Sheeraz et al., 2022; Lee et al., 2020), and IMU (Rachakonda et al., 2020). However, deciding on whether to use off-the-shelf devices or develop a custom-made device is dependent upon physiological signals of interest. Using either of these devices has its advantages and challenges and can be application dependent. The off-the-shelf devices might not have all the sensors of interest or expected sampling frequency. In turn, one might have to consider using more than one wearable device or develop a custom-made device with the sensors of interest (Rachakonda et al., 2020; Zubair and Yoon, 2019; Akbulut et al., 2020).
Summary: Research studies for stress detection and monitoring use both off-the-shelf devices or custom-made devices as shown in Figure 2. Several researchers used off-the-shelf devices to collect physiological signals for stress detection and monitoring (Mishra et al., 2020; Campanella et al., 2023). In the research articles considered in our review, the off-the-shelf devices are majorly (85%) chest-worn or wrist-worn, with some researchers using other body-worn devices such as headset. Chest-worn devices placed near the heart are prominently used to observe heart activity using ECG, and Wrist-worn devices placed at various parts such as finger, wrist, and ear can collect information about heart activity, accelerometer (movement of an attached body part) and also skin conductance (Cosoli et al., 2020). This section helps to understand wearables and physiological signals used for stress detection and monitoring answering RQ1.
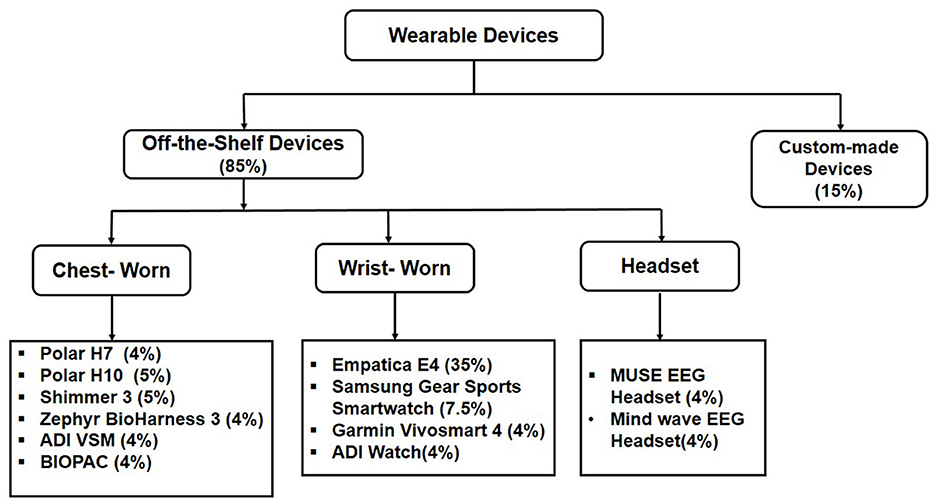
Figure 2. Overview of the wearable devices used for collecting physiological signals.
4 Stress detection approaches
Now that we have a basic understanding of the sensors and physical devices used in stress detection and monitoring research, let us next understand how data from these devices are analyzed to detect and monitor stress. Stress detection and monitoring approaches using wearables rely on machine learning algorithms. One can utilize machine learning approaches in a real-time mode (to detect stress as soon as it occurs in real-time) or in offline mode (to detect any physiological stress episode (post-analysis) experienced by the individual). Both these modes use machine learning techniques for detecting and monitoring stress. However, unlike real-time stress detection, one cannot provide real-time interventions when the data is analyzed offline. In this review, we do not differentiate between online (and in-situ) stress detection and offline stress detection. We identify and evaluate the standard machine-learning steps necessary for stress detection and monitoring.
A standard machine learning pipeline for stress detection and monitoring involves data collection, data pre-processing, feature computation, training, and testing the model. We present these steps in Figure 3. Data collection includes collecting physiological signals using wearable devices either (a) in a controlled environment by inducing stress using stressors or (b) in free-living conditions with domain-specific stress conditions. Then, during the data pre-processing step, the collected data is cleaned using various techniques. The next step is feature computation, which enables a meaningful representation of the data. These features are then used for training and evaluating the machine learning model. Now, let us look at each of these steps in detail.
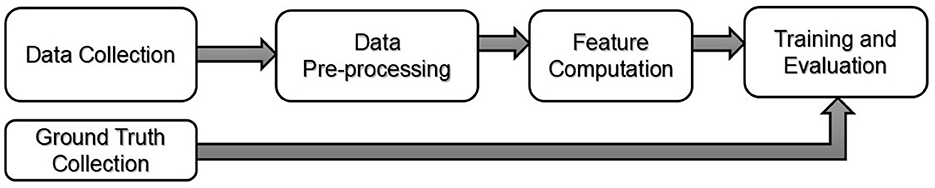
Figure 3. Commonly used machine learning framework for detecting, monitoring, and tracking an individual's stress level. The ground truth enables validating the predictions made by the machine learning models.
4.1 Data collection methods
As described in Section 3.2, various off-the-shelf or custom-made devices can be used for data collection in user studies that aim to detect and monitor stress. Data collection also involves the collection of ground truth needed for developing the model. Data can be collected either from a controlled environment or from a free-living study. For controlled studies, researchers analyze the physiological signals either by inducing stress in a laboratory environment or by observing stressful activities that an individual performs. Orthogonally, in free-living studies, researchers provide one or more devices to participants, who wear these devices continuously while performing their normal everyday activities.
Laboratory studies: Data collection in a controlled environment is conducted by inducing stress via stressors. Researchers use a combination of these stressors with interleaved rest periods between such stressors for detecting and monitoring stress in a controlled environment. Researchers use a well-defined combination of stressors such as TSST. Several researchers used the Trier Social Stress Test (TSST; Allen et al., 2017) which has stressors such as preparing and presenting a short speech and mental arithmetic tasks with interleaved resting periods (Chalmers et al., 2021; Rodrigues et al., 2018; Rachakonda et al., 2020; Momeni et al., 2021).
In addition to the stressors introduced by TSST, researchers have also introduced additional stressors in their studies, such as watching a horror movie (Lee et al., 2022). The original TSST approach reduced residual stress by asking participants to rest between stressors. However, some researchers replaced the rest period with a short neutral video presented to the participants (Zhao et al., 2023).
Other than TSST, many researchers have used different combinations of stressors. Campanella et al. conducted a study with five different stressors or tasks with rest periods in between (Campanella et al., 2023). These tasks included the assembly of a Lego puzzle with instructions, without instructions, and a Resume presentation. Can et al. collected data from a controlled study, where the stress is induced by listening to the lectures, followed by an exam, which is similar to the mental arithmetic task in TSST (Can et al., 2020). Sheeraz et al. and Xefteris et al. used laboratory protocol with two stressors—Mental Arithmetic Task and Stroop Color-Word Test (SCWT). In the mental arithmetic task, participants were instructed to keep subtracting value 17 from 1,000 for a fixed duration of ~5 min (Mishra et al., 2020; Pinge et al., 2022), whereas in the SCWT (Scarpina and Tagini, 2017), where a word was presented to the participant, the participant was instructed to speak aloud the color of the word, and not the actual word (Sheeraz et al., 2022; Xefteris et al., 2023). For example, the word “Red” might have been written using the color purple. Participants were instructed to say aloud the word “Purple” (the color) and not “Red” (the word). Lee et al. (2020) also used a memory search stressor for inducing stress along with mental arithmetic and SCWT stressors (Sheeraz et al., 2022). Akbulut et al. (2020) collected physiological data using a stressor where participants had to watch a video with different emotions such as sadness, fear, anger, disgust, calmness, and happiness along with physical stressors – walking. Similar to watching videos containing different emotions as stressor was used by Wu et al. (2021) to collect physiological data. Betti et al. (2017), Xefteris et al. (2023), and Mishra et al. (2020) conducted lab studies where they employed two stressors – one stressor was a short presentation followed by a second stressor—a cold pressor task. Similarly, Shajari et al. (2023) used physical activity, 30–60 min of walking on the treadmill, as a stressor for collecting physiological signals. Moser et al. (2023) used acoustic stressors with 60–90 s of air horn which was amplified by speakers.
To summarize, Stressors can be broadly categorized as psychological and physical (Roldán-Rojo et al., 2021). The various psychological stressors used by various researchers are mental arithmetic task, short presentation, watching horror movie (Lee et al., 2022; Akbulut et al., 2020), Lego Puzzle (Campanella et al., 2023), Resume Presentation (Campanella et al., 2023), SCWT (Sheeraz et al., 2022; Xefteris et al., 2023), memory search task (Lee et al., 2020), acoustic stressors (Moser et al., 2023) and physical stressors include walking/running (Akbulut et al., 2020; Shajari et al., 2023), and cold pressor tasks (Mishra et al., 2020).
Free-living studies: Free-living data collection provides a naturalistic view of a person's life; the stressors here are usually not artificially provided but are natural—based on everyday activities. In the stress detection and monitoring literature in free-living conditions, the duration of such studies varies from a few hours, days or months (Smets et al., 2018a). Longer free-living studies usually assist in monitoring fine-grained activities and stressors more accurately. Data from long free-living studies help develop more accurate and personalized stress detection models.
Medical emergencies are known to induce stress in individuals. Researchers have used medical emergencies to understand free-living stress. Anusha et al. (2019) and Amalan et al. (2019) collected data for 3 h to understand pre-surgery stress (Betti et al., 2017). Bin Heyat et al. (2022) collected data for 12 h with usual activities allowed within lab. Hojjatinia et al. (2021) collected data for 3 days, Carreiro et al. (2020) collected data 4–5 days using wrist-worn Empatica E4 device. Park et al. (2018) collected physiological signals for 7 days, but data was collected three times a day for 30 s but was not collected continuously. Aqajari et al. (2023) collected data for 2 weeks. Shrestha et al. (2023) collected data for 30 consecutive days, whereas Li and Sano (2020) collected data for 30–90 days from each participant for stress detection and monitoring. There can be challenges involved while collecting data in free-living studies. These challenges involve either technical errors from wearable devices used for the data collection or human error while starting and stopping the collection on a daily basis. Longer duration of free-living studies ensure robust data collection and also help to gain useful insights from the physiological responses to various situations in day-to-day life. This also helps to identify the underlying cause of environmental conditions that can trigger stress in an individual.
Ground truth collection approaches: Data collection phase involves collection of ground truth as well. Ground Truth collection is an important task prior to the training of a model. During the laboratory study, the periods for which stressors are provided to participants are labeled as “Stressed” and all other periods are labeled as “Not Stressed.” For free-living studies, ground truth can be collected using EMA (Li and Sano, 2020; Tazarv et al., 2021). EMA is a method that involves sending questions to the users and collecting in-situ information. Researchers often use existing questionnaires such as DASS (Bin Heyat et al., 2022; Chalmers et al., 2021), STAI (Anusha et al., 2019), and PSS (Park et al., 2018) to gather necessary stress-related information. Some researchers send questions based on the information needed. For example, Li and Sano (2020) collected self-reports via email, where they collected details of mood (sad or happy), health (sick or healthy) and stress level (stressed-calm). Aqajari et al. (2023) collected self-reports by sending questions based on time or activity with seven number of EMA's per day.
The performance of the stress detection model is dependent upon the ground truth. There are challenges involved in using the collected ground truth. For laboratory studies, most of the researchers use protocol for ground truth collection. Although it is considered more accurate, sometimes it could be misleading. For example, during rest periods of laboratory study, if a user is continuously thinking/worried or, in another way, if some stressors are not capable of inducing stress, then such situations can have an impact on the performance of the stress detection model. On the other hand, the challenges with free-living studies are users might not respond accurately or not respond at all. In such cases, training the model without ground truth labels becomes challenging. To overcome such problems, researchers sometimes ignore part of the rest period data (to remove residual stress) or provide incentives for EMA responses to the participants (Mishra et al., 2020).
4.2 Data pre-processing techniques
Sensor data collected from wearable devices may contain noise because of the presence of the body, the sensor's movement, and environmental noise. The most commonly used pre-processing steps involve noise and outlier removal, interpolation, and normalization. Physiological signals obtained from various sensors such as ECG, PPG, EDA, Skin Temperature, and Accelerometer are passed through different filters to remove noise. Researchers filtered ECG and PPG signals using Butter-worth filter (Akmandor and Jha, 2017; Benchekroun et al., 2022; Aqajari et al., 2023). ECG signal are also filtered using Fast Fourier Transform (Bin Heyat et al., 2022; Li and Sano, 2020; Akmandor and Jha, 2017), Discrete Wavelet Transform (Akbulut et al., 2020; Benchekroun et al., 2022; Moser et al., 2023), and Chebyshev II (Campanella et al., 2023). Some researchers used a bandpass filter to remove the noise and smoothed the signals using average filter (Ashwin et al., 2022; Park et al., 2018; Campanella et al., 2023). These filtered signals are then passed to the peak detector to get heart rate signals (Akbulut et al., 2020; Rodrigues et al., 2018; Campanella et al., 2023; Tazarv et al., 2021; Wu et al., 2021; Zhao et al., 2023).
EDA signal is comprised of two components: Phasic and Tonic. The phasic component is known as Skin Conductance Response(SCR). The tonic component is known as Skin Conductance Level (SCL; Posada-Quintero and Chon, 2019). For EDA, most of the researchers used the Butter-worth filter of order 4 (Anusha et al., 2019; Tazarv et al., 2021; Betti et al., 2017) for each component.
After noise removal, some researchers removed outliers (Mishra et al., 2020; Wu et al., 2021; Lee et al., 2022). The removal of noise and outliers may result in missing values for some data points. Researchers use interpolation in such cases. The missing data are interpolated using Cubic Spline (Lee et al., 2022; Mishra et al., 2020) and linear interpolation (Hojjatinia et al., 2021; Can et al., 2020; Moser et al., 2023). Some researchers normalized the data before computing features (Li and Sano, 2020; Mishra et al., 2020). Pre-processing steps are dependent upon the type of features computed. For example, most of the researchers use Fast Fourier Transform to convert the data from time-domain to frequency domain (Moser et al., 2023; Amalan et al., 2019; Aqajari et al., 2023; Akbulut et al., 2020).
4.3 Feature computation methods
The next step in the process of stress detection and monitoring is feature computation. We will now look at the different types of features computed using various physiological signals.
Researchers compute time-domain and frequency-domain features from physiological signals such as ECG, PPG, EDA, Skin Temperature, and Accelerometer. Various time-domain and frequency-domain features are computed from the sensor data obtained from various wearables. Computing frequency domain features involves transforming time series data into the frequency spectrum using mathematical transformations like the Fourier Transform (Ashwin et al., 2022). These features help in understanding how the signals are distributed across different frequency bands.
As discussed in the earlier section, ECG and PPG can give physiological signals such as heart rate (HR), R-R intervals (RR), also known as heart rate variability (HRV), and inter-beat interval. Researchers compute statistical time-domain features such as mean of HR or RR intervals, standard deviation of HR or RR intervals, minimum, maximum, median of heart rate or RR intervals (Akbulut et al., 2020; Mishra et al., 2020; Rodrigues et al., 2018). Other time-domain features include RMSSD (Root mean square of successive differences between the adjacent RRs), SDSD (Related standard deviation of successive RR interval difference; Amalan et al., 2019; Aqajari et al., 2023; Benchekroun et al., 2022; Ashwin et al., 2022; Lee et al., 2022; Rony and Ahmed, 2020), NN50 (Number of successive RR intervals pairs that differ more than 50s), PNN50 (NN50 divided by the number of RR intervals), SDNN (Standard Deviation of normal RR intervals; Amalan et al., 2019; Montesinos et al., 2019; Tazarv et al., 2021; Betti et al., 2017), HRV triangular index (total number of RR intervals divided by the height of the histogram of all RR intervals measured on a scale with bins of 1/128 s), TINN (triangular interpolation of RR interval histogram; Can et al., 2019b; Akbulut et al., 2020). Researchers also computed breathing rate using PPG signals (Aqajari et al., 2023; Tazarv et al., 2021).
Researchers computed frequency-domain features by using band pass filter for VLF (very low frequency; Chalmers et al., 2021; Betti et al., 2017; Momeni et al., 2021), LF (low frequency; Benchekroun et al., 2022; Can et al., 2019b; Wu et al., 2021), HF (high frequency) and LF/HF Ratio (Chalmers et al., 2021; Wu et al., 2021; Betti et al., 2017; Wu et al., 2018). Some researchers computed total power (Benchekroun et al., 2022; Amalan et al., 2019), energy (Can et al., 2020) pLF (prevalent low-frequency oscillation of heart rate), pHF (prevalent high-frequency oscillation of heart rate; Can et al., 2019b, 2020).
Researchers compute statistical, phasic, and tonic features of EDA. Statistical features of EDA include mean, median, mode standard deviation, maximum, and a minimum of EDA (Campanella et al., 2023). Phasic features capture rapid transient changes as a response to the situation, whereas tonic features vary slowly over time, which helps to understand psychological state over a longer period of time (Cecchi et al., 2020). Features of phasic and tonic components are mean and standard deviation of Phasic component (Wu et al., 2021; Betti et al., 2017), peaks phasic (Can et al., 2020) mean and standard deviation of tonic component (Can et al., 2020), Skin conductance response is a rapid, transient change in skin conductance in response to the events. Hence, researchers computed features such as startle (number of detected startles), Startle mean (mean of the amplitude of the startles), Startle SD (standard deviation of the amplitude of the startles), Rise time mean (mean of the rise time of the startles), Rise time SD (standard deviation of the rise time of the startle), Fall time mean (mean of the fall time of the startles), and Fall time SD (standard deviation of the fall time of the startles) (Wu et al., 2021; Betti et al., 2017).
Some researchers computed features such as mean of respiration duration, SD of respiration signal, and median of respiration duration for respiration signal (Akmandor and Jha, 2017; Momeni et al., 2021). Other features computed are mean blood pressure, mean blood oximeter (Akmandor and Jha, 2017), mean X, mean Y, mean Z, and magnitude for accelerometer signals (Can et al., 2019b). Overview of the features computed are shown in Table 3.

Table 3. Physiological signals with their features.
4.4 Machine learning techniques
Researchers perform stress detection and monitoring either by developing classification models or by performing statistical analysis. The features computed from various physiological signals extract meaningful information. from the raw signals. These features are then passed on to train the machine learning model. Instead of developing a classification model, few researchers analyze the data collected using wearables using statistical analysis (Rony and Ahmed, 2020). Some of the commonly used statistical tests used are Paired-test, Anova, or Pearson's Correlation (Chalmers et al., 2021; Amalan et al., 2019).
4.4.1 Classification techniques
Researchers used machine learning and deep learning methods for detecting and monitoring stress. For stress detection and monitoring, the researchers perform two-class classification as stressed or not stressed. Researchers considered a Decision Tree, which is a simple and versatile rule-based technique that can be used for a numerical type of data (Momeni et al., 2021). Decision trees are sensitive toward imbalanced datasets, and they can generate complex trees that may not be able to generalize, thus leading to overfitting the data. Hence, instead of using a single decision tree, an ensemble of decision trees is used for making predictions. Each of these decision trees makes a prediction and, based on majority voting, is the model's predicted output. This technique is called Random Forest (Liu et al., 2012). This random forest algorithm gives high accuracy and is robust to overfitting. It works well even with unbalanced datasets hence many researchers used this for stress detection and monitoring (Aqajari et al., 2023; Bin Heyat et al., 2022; Campanella et al., 2023; Can et al., 2019b; Momeni et al., 2021; Ashwin et al., 2022; Can et al., 2020). Another ensemble machine learning technique used by researchers is XGBoost (Aqajari et al., 2023; Tazarv et al., 2021; Xefteris et al., 2023).
SVM is another technique used for classification of stress (Aqajari et al., 2023; Campanella et al., 2023; Lee et al., 2022; Can et al., 2019b). SVM aims to find a hyperplane that divides data into desired classes. It is robust to overfitting and its performance is dependent on class separability in the data. Physiological signal values for the classes of not stressed and stressed might overlap and are inseparable; in such cases, SVM may not work well, and a complex classification technique is needed.
Some researchers used KNN machine learning algorithm for stress detection and monitoring (Akmandor and Jha, 2017; Aqajari et al., 2023; Tazarv et al., 2021; Can et al., 2019b; Anusha et al., 2019). KNN works by computing distances between data points and forming groups of similar characteristics. Since KNN does not make any prior assumptions about the data, it is capable of capturing prominent insights from the data on its own. However, KNN has a challenge in choosing the value of K(number of nearest neighbors) and may also suffer when the boundaries of the two groups overlap. Some researchers also used Naive Bayes (Bin Heyat et al., 2022; Ashwin et al., 2022), Logistic Regression (Can et al., 2019b; Campanella et al., 2023), and regression-based approach using linear regression (Park et al., 2018).
Researchers experimented with other deep-learning approaches for stress detection and monitoring. Multi-layer Perceptron with hidden layer is capable of performing binary as well as multi-class classification (Can et al., 2019b, 2020; Tazarv et al., 2021; Rachakonda et al., 2020; Akbulut et al., 2020). Stress can cause gradual changes in physiological signals, which can be captured using LSTM (Wu et al., 2021; Li and Sano, 2020) method. Some researchers also used CNN (Subash et al., 2023; Donati et al., 2023). The classification techniques are summarized in Table 4.
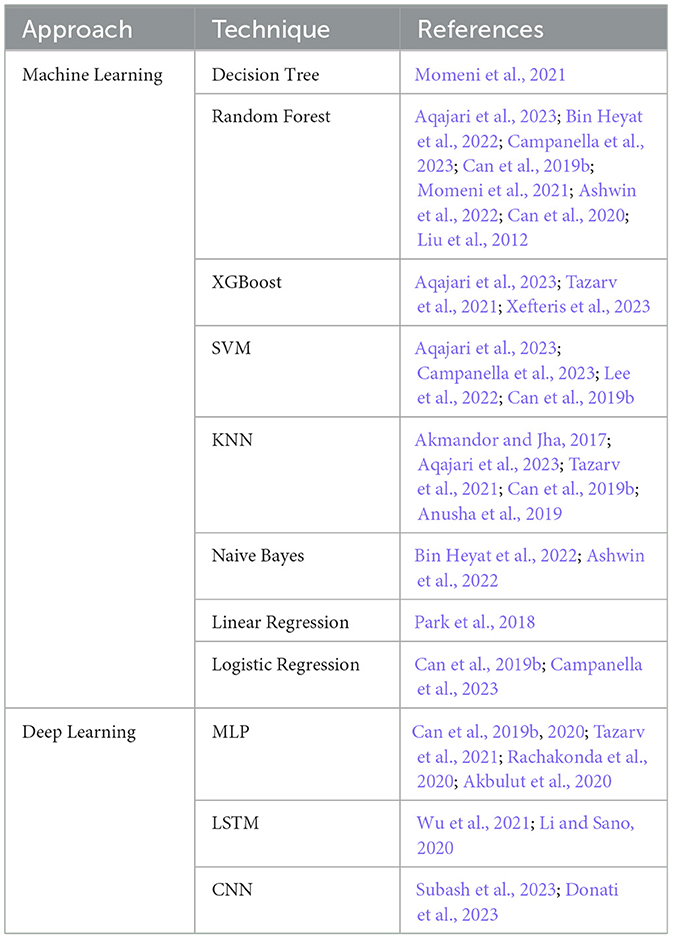
Table 4. Various machine learning techniques used by researchers to train the stress detection and monitoring model.
Summary: In the past two decades, researchers have experimented with various machine-learning techniques. Most of the researchers observed that Random Forest and XGBoost work well for stress detection and monitoring approaches. Similarly, researchers are now experimenting with using deep learning approaches for stress detection and monitoring, and there is scope to improve the performance, such as the stress detection and monitoring approach, by fine-tuning these deep learning architectures.
4.4.2 Metrics used
The performance of the developed model can be evaluated using Accuracy. Accuracy is a good measure to evaluate the stress detection model if dataset is balanced (Akmandor and Jha, 2017; Aristizabal et al., 2021; Benchekroun et al., 2022; Momeni et al., 2021; Park et al., 2018; Can et al., 2019b; Ashwin et al., 2022; Campanella et al., 2023; Can et al., 2020). Since the F1-score considers Precision and Recall, it is a good measure when the dataset is imbalanced (Szakonyi et al., 2021; Bin Heyat et al., 2022; Lee et al., 2022; Aqajari et al., 2023; Mishra et al., 2020; Smets et al., 2018b). Other metrics used for evaluating the stress detection model are Specificity (True Negative Rate), Sensitivity (True Positive Rate) (Bin Heyat et al., 2022; Aristizabal et al., 2021; Zubair and Yoon, 2019). Using the specificity and sensitivity of the model, the ROC curve can be plotted, and AUC can be used to quantify the model performance (Benchekroun et al., 2022; Bin Heyat et al., 2022). Table 5 summarize the metrics used by different researchers.
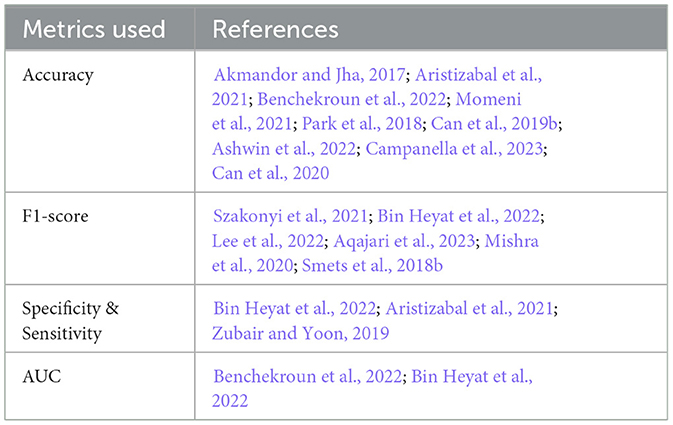
Table 5. Various metrics used by researchers to evaluate the stress detection and monitoring model.
The performance of the classification techniques is dependent on the data used for training and testing. Researchers trained and tested the stress detection approach using various classification techniques. Most researchers observed higher performance with Random Forest classifier (Can et al., 2019b, 2020; Campanella et al., 2023) when compared with SVM, KNN ranging from accuracy of 76.5–88.20%. Some researchers SVM (Accuracy = 82%) worked slightly better as compared to RF (Accuracy = 80%) (Mishra et al., 2020), and for some Decision Trees (Bin Heyat et al., 2022) performed better (Accuracy = 95%). Figure 4 summarizes the stress detection and monitoring approaches.
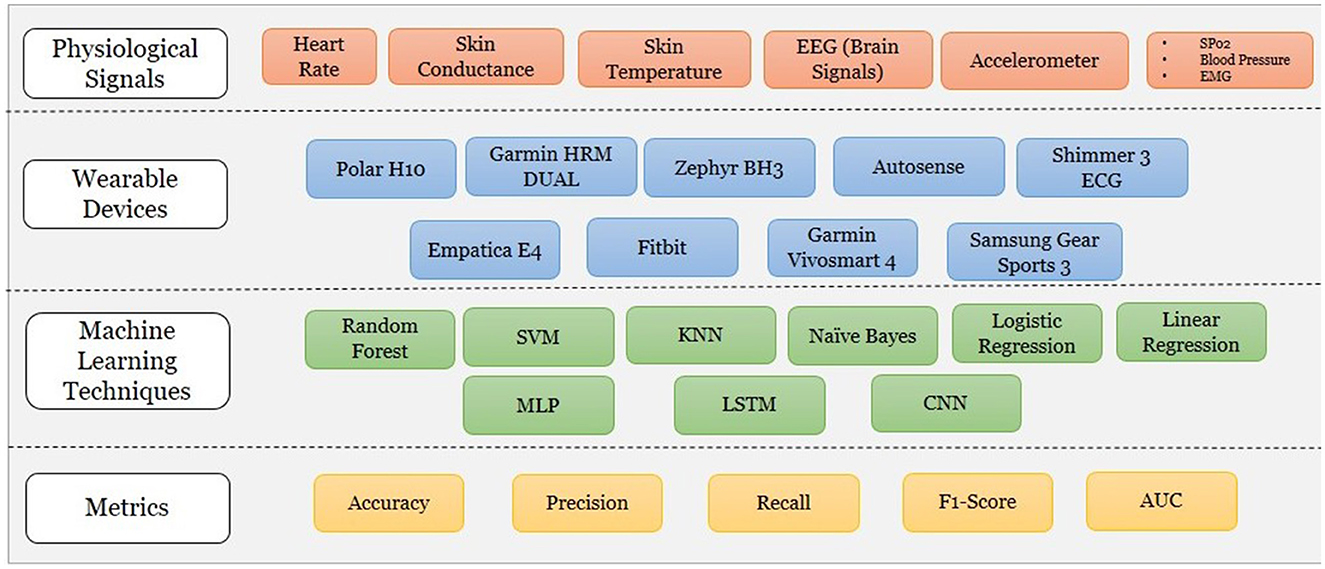
Figure 4. Overview of stress detection and monitoring approaches.
Summary: When conducting studies for stress detection either in a controlled or in a free-living environment, the physiological data collected may not be balanced. Hence, in such cases, it is logical to analyze the model using precision, recall, and F1-score in order to have a better understanding of the performance of the model. This section helps to understand stress detection and monitoring approaches in detail answering RQ2 & 3.
4.5 Applications of stress detection and monitoring
Daily life situations or work pressure can cause chronic stress or frequent episodes of acute stress. In order to cope with such stress, individuals often get involved in substance use disorder or other harmful habits such as smoking, excessive alcoholism, or even overeating. Detecting and monitoring stress helps in keeping the wellbeing of individuals. Researchers considered stress in different areas such as daily habits (Tazarv et al., 2021; Han et al., 2022; Moser et al., 2023), stress experienced at the workplace (Donati et al., 2023; Xefteris et al., 2023), in college students (Li and Sano, 2020; Park et al., 2018; Can et al., 2019b), or while driving (Rony and Ahmed, 2020). Some researchers detected stress in patients before undergoing surgery (Anusha et al., 2019; Amalan et al., 2019), patients with metabolic syndrome (Akbulut et al., 2020) or cravings during treatment for substance use disorder (Carreiro et al., 2020; Shrestha et al., 2023) and stress levels before and after smoking events (Hojjatinia et al., 2021; Akbulut et al., 2020).
5 Discussion
This review of research work on stress detection and monitoring throws light on existing research gaps, challenges faced, and future directions in this field. Let us understand the various challenges in the existing approaches and possible future directions to overcome them. In this section we present answer to RQ4.
Stress detection using publicly available datasets: During our literature search, we observed that researchers (n = 28) had used the publicly available datasets WESAD for stress detection and monitoring purposes (Schmidt et al., 2018). This dataset is collected using the wrist-worn device Empatica E4 and the chest-worn device Resbipan. This dataset has physiological signals ECG, EDA, respiration, body temperature, and accelerometer signals. Researchers have experimented using various physiological signals such as heart rate (Albaladejo-González et al., 2023; Dahal et al., 2023), EDA (Islam and Washington, 2023; Zhu et al., 2023), or combinations such as heart rate and EDA (Gupta et al., 2023) or considering all the physiological signals of the dataset (Garg et al., 2021; Pogliaghi et al., 2022). Since the publicly available datasets are with particular demographics, this can prove a limitation to be used in the research works. Also, these publicly available datasets can limit the user with using existing physiological signals and may have to repeat the entire data collection process in order include new physiological signals. Using the popular dataset on a wide scale may lead to redundant analysis of the same existing dataset with the absence of new insights into the findings.
Choice of wearables: The performance of the stress detection and monitoring model is dependent upon the choice of physiological signals, context, and environmental information. Based on research, changes in heart rate and skin conductance levels have been identified as a good indicator of stress (Akbulut et al., 2020; Chalmers et al., 2021; Campanella et al., 2023). Researchers have also experimented with other signals, such as brain signals captured using EEG, or via monitoring activity information and environmental conditions such as ambient temperature and pressure (Akmandor and Jha, 2017). Literature reveals that it is currently a challenge to decide which sensors and devices to use to collect these physiological signals. Researchers must consider user comfort and usability while deciding on the device to use for their study. Usability can either be in terms of physical comfort of wearing the devices or the social stigma associated with the devices (Beeler et al., 2018). Although devices worn on the wrist might be more usable and acceptable, however, they might not be well-suited to capture certain physiological markers. For example, a wrist-worn heart rate monitor might be less accurate than a chest-worn monitor in capturing heart rate related information (Pinge et al., 2022). This opens up several research questions, such as how do we ensure devices that are comfortable to wear can accurately capture physiological signals? What measures can be taken to increase the comfort of non-traditional wearable devices? What is the balancing point between usability, acceptability, and accuracy?
In addition to the comfort of wearing these devices, the question of social stigma also arises. Users of mental health monitoring devices might be worried that context-capturing sensors might not be acceptable to bystanders or observers might be able to determine specific health conditions based on the devices that one is wearing. This raises some interesting research directions: Is it possible to develop miniaturized wearables that are not easily noticeable? An interesting example of such wearables are the hearing aid devices that are often not observable. Alternatively, further research is necessary to improvise regularly worn devices so that they can be used for monitoring mental health. Devices such as smartwatches, smart bands, smart rings, and wearables have become popular. They are often embedded with multiple sensors. Innovations in terms of more accurate mental health disorder detection using these commercial devices are the need of the hour.
Ground truth from users: Traditional wearable-based mental health monitoring systems collected physiological signals and used those signals to determine specific health disorders (Cella et al., 2018; Tsai et al., 2022). These systems often do not use the wearer of the device to validate their predictions in real time. However, a human-in-the-loop approach to mental health monitoring is the need of the hour.
Current machine learning based stress detection approaches are largely dependent on the collected human responses. But these approaches require high quality self-reports and high response rates (Gao et al., 2023). One needs to consider various factors while collecting user's responses. First, as the quantification of whether one is stressed or not stressed can be subjective, one has to be selective in choosing the type of questions delivered to the user to capture the user's state of mind. Second, it is necessary to decide upon the frequency of the questions delivered, that is, how often the questions should be delivered so that the user's response captures the variations in state of mind. If the time interval between these questions delivered is longer, then there can be recall bias in the responses of the individuals (Chan et al., 2018). On the other hand, users might be reluctant to answer if the questions are delivered within a short span of time (Moskowitz and Young, 2006). The number of questions to be answered by a user is also a concern while collecting responses from individuals. Lengthier the questionnaires, there is a chance that users might prefer skipping. To handle this issue, some researchers explored providing microEMAs to reduce user burden (Intille et al., 2016; King et al., 2019). One can possibly explore approaches to reduce the size of EMAs so that it is easy to respond via wearables. Further, it is necessary to explore approaches to even reduce the number of micro-EMA probes or use an AI-based approach for self-report collection with a reduced burden on the user to respond to the probes (Ghosh et al., 2024).
Machine learning techniques: Finally, we have observed that most work (including our methodology) relies on a shallow learning approach for stress detection and monitoring. With the recent proliferation of deep learning, they have become an interesting candidate for stress detection and monitoring (Albertetti et al., 2020; Zhang et al., 2021). However, rather than using deep learning blindly, one might consider analyzing whether the improvements in performance provided by deep learning approaches over shallow learning approaches outweigh the need for computational and need for large dataset-like challenges. One such approach used Auto Encoders to use unlabeled data for detection (Yu and Sano, 2023). One must remember that it is not easy to collect large volumes of health data with labels.
Stress management: The major aim of detecting and monitoring stress is to provide support for its management. However, very few research work moves beyond proof of concept development. JITAI is a recent technique where the interventions are provided as a support that can help an individual to adapt to the undesirable changes in the state of mind (Sharmin et al., 2015; Mishra et al., 2021). These techniques involve challenges such as what kind of support is to be provided, how to provide it, and opportune timings to deliver the interventions. Researchers have been working on developing methods to find the right time to provide based on user's receptivity (Künzler et al., 2019; Choi et al., 2019). Such research approaches are based on simulation or controlled environments (Lee et al., 2021). Also, very few researchers have used JITAI's toward stress detection and monitoring (Howe et al., 2022) in real-time. Hence, providing support using JITAIs for free living or real-time remains a challenge.
Stress detection in-situ: One of the motivation behind detecting and monitoring stress is to provide support for its management. Hence, performing stress detection in real-time is needed. Considering the scope of this review, some wearable devices, such as the Samsung Gear Sports Watch, are capable of collecting physiological signals and processing them on the device, allowing real-time stress detection. However, some wearable devices allow the collection of data but cannot process these collected signals on the device. In such cases, it is possible to perform real-time stress detection by having another device that can process the data and run a stress detection model to detect stress. However, research works considered for this review focus on the offline analysis of the physiological signals. Hence, we do not elaborate on the onboard computational power of the wearable devices used for stress detection and monitoring.
Limitations of the current review: In this review, we primarily focus on devices and machine learning approaches used for stress detection and monitoring. Of course, there are several details that have not been covered in the manuscript, which we believe will be useful for researchers focusing on stress detection and monitoring. In this article, we do not consider the clinical acceptability of the devices. For example, a device like the Empatica might be more clinically accepted than many other wearables. We also do not focus on the capabilities and acceptability of the devices by individual users. Specifically, many existing wearables might run out of battery within a few hours if all the sensors are kept on. Similarly, many existing devices might heat up if on-device machine learning is performed on them. In this review, we have ignored these concerns.
In terms of software, the current review does not focus on the privacy and security aspects of the devices and analysis. For example, the heart rate collection might introduce a vulnerability in the devices. We also do not focus on the advantages and disadvantages of the machine learning models from a theoretical point of view. Researchers interested in these aspects might have to refer to other stress detection surveys such as Mentis et al. (2024), Gomes et al. (2023), and Oh et al. (2021).
6 Conclusion
This paper reviews state-of-the-art works for stress detection and monitoring. Much research is done in developing systems that can detect and monitor stress using smartphones. However, we considered approaches that use wearables for detecting and monitoring stress. The papers considered for this review were retrieved from Google Scholar, ACM Digital Library, PubMed, and IEEE Xplore. We emphasized critical phases in stress detection and monitoring systems. This includes data collection, data pre-processing, feature computation, machine learning, and model evaluation. This survey will help new researchers to understand the details of the state-of-the-art methods used in stress detection and monitoring systems.
Data availability statement
The original contributions presented in the study are included in the article/Supplementary material, further inquiries can be directed to the corresponding author.
Author contributions
AP: Writing – review & editing, Methodology, Supervision, Validation, Visualization, Writing – original draft. VG: Writing – original draft, Writing – review & editing. DJ: Methodology, Supervision, Validation, Writing – original draft, Writing – review & editing. SG: Methodology, Supervision, Validation, Writing – review & editing. SS: Methodology, Supervision, Validation, Writing – original draft, Writing – review & editing.
Funding
The author(s) declare financial support was received for the research, authorship, and/or publication of this article. This material is based upon work supported by Science & Engineering Research Board's SERB-SURE project numbers SUR/2022/002735 and SUR/2022/001965, BITS Pilani's grants C1/23/152 and C1/23/173, e-Monitor project grant (Reference no: TRP3RDED02178, dated: 20/02/2024) sponsored by AI4ICPS, IIT Kharagpur. The authors would also like to acknowledge support under the Faculty Enrichment Internship Program (FEIP) of the Directorate of Higher Education, Govt. of Goa. All findings and recommendations are those of the authors and do not necessarily reflect the views of the funding institutes.
Conflict of interest
The authors declare that the research was conducted in the absence of any commercial or financial relationships that could be construed as a potential conflict of interest.
Publisher's note
All claims expressed in this article are solely those of the authors and do not necessarily represent those of their affiliated organizations, or those of the publisher, the editors and the reviewers. Any product that may be evaluated in this article, or claim that may be made by its manufacturer, is not guaranteed or endorsed by the publisher.
Supplementary material
The Supplementary Material for this article can be found online at: https://www.frontiersin.org/articles/10.3389/fcomp.2024.1478851/full#supplementary-material
Footnotes
References
ActiveAce (2023). Stress Monitor for Watch. Available at: https://apps.apple.com/vg/app/stress-monitor-for-watch/id1510429086 (accessed June 14, 2024).
Akbulut, F. P., Ikitimur, B., and Akan, A. (2020). Wearable sensor-based evaluation of psychosocial stress in patients with metabolic syndrome. Artif. Intell. Med. 104:101824. doi: 10.1016/j.artmed.2020.101824
Akmandor, A. O., and Jha, N. K. (2017). Keep the stress away with soda: stress detection and alleviation system. IEEE Trans. Multi-Scale Comput. Syst. 3, 269–282. doi: 10.1109/TMSCS.2017.2703613
Albaladejo-González, M., Ruipérez-Valiente, J. A., and Gómez Mármol, F. (2023). Evaluating different configurations of machine learning models and their transfer learning capabilities for stress detection using heart rate. J. Ambient Intell. Human. Comput. 14, 11011–11021. doi: 10.1007/s12652-022-04365-z
Albertetti, F., Simalastar, A., and Rizzotti-Kaddouri, A. (2020). “Stress detection with deep learning approaches using physiological signals,” in International Conference on IoT Technologies for HealthCare (Berlin: Springer), 95–111.
Alharbi, R., Shahi, S., Cruz, S., Li, L., Sen, S., Pedram, M., et al. (2023). Smokemon: unobtrusive extraction of smoking topography using wearable energy-efficient thermal. Proc. ACM Interact. Mob. Wear. Ubiquit. Technol. 6, 1–25. doi: 10.1145/3569460
Allen, A. P., Kennedy, P. J., Dockray, S., Cryan, J. F., Dinan, T. G., and Clarke, G. (2017). The trier social stress test: principles and practice. Neurobiol. Stress 6, 113–126. doi: 10.1016/j.ynstr.2016.11.001
Allen, J., Zheng, D., Kyriacou, P. A., and Elgendi, M. (2021). Photoplethysmography (ppg): state-of-the-art methods and applications. Physiol. Meas. 42:100301. doi: 10.1088/1361-6579/ac2d82
Amalan, S., Vaishali, B., Preejith, S., Joseph, J., and Sivaprakasam, M. (2019). “Pre-surgery stress monitoring using heart rate variability measures,” in 2019 41st Annual International Conference of the IEEE Engineering in Medicine and Biology Society (EMBC) (Berlin: IEEE), 4592–4595.
Anusha, A., Sukumaran, P., Sarveswaran, V., Shyam, A., Akl, T. J., Preejith, S., et al. (2019). Electrodermal activity based pre-surgery stress detection using a wrist wearable. IEEE J. Biomed. Health Informat. 24, 92–100. doi: 10.1109/JBHI.2019.2893222
Aqajari, S. A. H., Labbaf, S., Tran, P. H., Nguyen, B., Mehrabadi, M. A., Levorato, M., et al. (2023). Context-aware stress monitoring using wearable and mobile technologies in everyday settings. arXiv preprint arXiv:2401.05367. doi: 10.1101/2023.04.20.23288181
Aristizabal, S., Byun, K., Wood, N., Mullan, A. F., Porter, P. M., Campanella, C., et al. (2021). The feasibility of wearable and self-report stress detection measures in a semi-controlled lab environment. IEEE Access 9, 102053–102068. doi: 10.1109/ACCESS.2021.3097038
Ashwin, V., Jegan, R., and Rajalakshmy, P. (2022). “Stress detection using wearable physiological sensors and machine learning algorithm,” in 2022 6th International Conference on Electronics, Communication and Aerospace Technology (Coimbatore: IEEE), 972–977.
Beeler, N., Roos, L., Delves, S. K., Veenstra, B. J., Friedl, K., Buller, M. J., et al. (2018). The wearing comfort and acceptability of ambulatory physical activity monitoring devices in soldiers. IISE Trans. Occup. Ergon. Hum. Fact. 6, 1–10. doi: 10.1080/24725838.2018.1435431
Benchekroun, M., Chevallier, B., Beaouiss, H., Istrate, D., Zalc, V., Khalil, M., et al. (2022). “Comparison of stress detection through ECG and PPG signals using a random forest-based algorithm,” in 2022 44th Annual International Conference of the IEEE Engineering in Medicine and Biology Society (EMBC) (Glasgow: IEEE), 3150–3153.
Bent, B., Goldstein, B. A., Kibbe, W. A., and Dunn, J. P. (2020). Investigating sources of inaccuracy in wearable optical heart rate sensors. NPJ Digit. Med. 3:18. doi: 10.1038/s41746-020-0226-6
Betti, S., Lova, R. M., Rovini, E., Acerbi, G., Santarelli, L., Cabiati, M., et al. (2017). Evaluation of an integrated system of wearable physiological sensors for stress monitoring in working environments by using biological markers. IEEE Trans. Biomed. Eng. 65, 1748–1758. doi: 10.1109/TBME.2017.2764507
Bin Heyat, M. B., Akhtar, F., Abbas, S. J., Al-Sarem, M., Alqarafi, A., Stalin, A., et al. (2022). Wearable flexible electronics based cardiac electrode for researcher mental stress detection system using machine learning models on single lead electrocardiogram signal. Biosensors 12:427. doi: 10.3390/bios12060427
BIOPAC (2024). H10 Heart Rate Monitor. Available at: https://www.biopac.com/product/electrogastrogram-amplifier (accessed April 13, 2024).
Biswas, D., Simões-Capela, N., Van Hoof, C., and Van Helleputte, N. (2019). Heart rate estimation from wrist-worn photoplethysmography: a review. IEEE Sens. J. 19, 6560–6570. doi: 10.1109/JSEN.2019.2914166
Cacioppo, J. T., and Tassinary, L. G. (1990). Inferring psychological significance from physiological signals. Am. Psychol. 45:16.
Cahoon, J. L., and Garcia, L. A. (2023). “Continuous stress monitoring for healthcare workers: evaluating generalizability across real-world datasets,” in Proceedings of the 14th ACM International Conference on Bioinformatics, Computational Biology, and Health Informatics [Association for Computing Machinery (ACM)], 1–5.
Campanella, S., Altaleb, A., Belli, A., Pierleoni, P., and Palma, L. (2023). A method for stress detection using empatica E4 bracelet and machine-learning techniques. Sensors 23:3565. doi: 10.3390/s23073565
Can, Y. S., Arnrich, B., and Ersoy, C. (2019a). Stress detection in daily life scenarios using smart phones and wearable sensors: a survey. J. Biomed. Informat. 92:103139. doi: 10.1016/j.jbi.2019.103139
Can, Y. S., Chalabianloo, N., Ekiz, D., and Ersoy, C. (2019b). Continuous stress detection using wearable sensors in real life: algorithmic programming contest case study. Sensors 19:1849. doi: 10.3390/s19081849
Can, Y. S., Chalabianloo, N., Ekiz, D., Fernandez-Alvarez, J., Riva, G., and Ersoy, C. (2020). Personal stress-level clustering and decision-level smoothing to enhance the performance of ambulatory stress detection with smartwatches. IEEE Access 8, 38146–38163. doi: 10.1109/ACCESS.2020.2975351
Carreiro, S., Chintha, K. K., Shrestha, S., Chapman, B., Smelson, D., and Indic, P. (2020). Wearable sensor-based detection of stress and craving in patients during treatment for substance use disorder: a mixed methods pilot study. Drug Alcohol Depend. 209:107929. doi: 10.1016/j.drugalcdep.2020.107929
Carter, J. R., and Goldstein, D. S. (2015). Sympathoneural and adrenomedullary responses to mental stress. Comprehens. Physiol. 5:119. doi: 10.1002/cphy.c140030
Cecchi, S., Piersanti, A., Poli, A., and Spinsante, S. (2020). “Physical stimuli and emotions: EDA features analysis from a wrist-worn measurement sensor,” in 2020 IEEE 25th International Workshop on Computer Aided Modeling and Design of Communication Links and Networks (CAMAD) (Pisa: IEEE), 1–6.
Cella, M., Okruszek, Ł., Lawrence, M., Zarlenga, V., He, Z., and Wykes, T. (2018). Using wearable technology to detect the autonomic signature of illness severity in schizophrenia. Schizophr. Res. 195:537–542. doi: 10.1016/j.schres.2017.09.028
Chalmers, T., Hickey, B. A., Newton, P., Lin, C.-T., Sibbritt, D., McLachlan, C. S., et al. (2021). Stress watch: the use of heart rate and heart rate variability to detect stress: a pilot study using smart watch wearables. Sensors 22:151. doi: 10.3390/s22010151
Chambers, R., and Belcher, J. (1994). Predicting mental health problems in general practitioners. Occup. Med. 44, 212–216.
Chan, L., Swain, V. D., Kelley, C., de Barbaro, K., Abowd, G. D., and Wilcox, L. (2018). Students' experiences with ecological momentary assessment tools to report on emotional well-being. Proc. ACM Interact. Mob. Wear. Ubiquit. Technol. 2, 1–20. doi: 10.1145/3191735
Cho, Y., Julier, S. J., and Bianchi-Berthouze, N. (2019). Instant stress: detection of perceived mental stress through smartphone photoplethysmography and thermal imaging. JMIR Ment. Health 6:e10140. doi: 10.2196/10140
Choi, W., Park, S., Kim, D., Lim, Y.-k., and Lee, U. (2019). Multi-stage receptivity model for mobile just-in-time health intervention. Proc. ACM Interact. Mob. Wear. Ubiquit. Technol. 3, 1–26. doi: 10.1145/3328910
Chrousos, G. P. (2009). Stress and disorders of the stress system. Nat. Rev. Endocrinol. 5, 374–381. doi: 10.1038/nrendo.2009.106
Conner, T. S., and Barrett, L. F. (2012). Trends in ambulatory self-report: the role of momentary experience in psychosomatic medicine. Psychosomat. Med. 74, 327–337. doi: 10.1097/PSY.0b013e3182546f18
Cosoli, G., Spinsante, S., and Scalise, L. (2020). Wrist-worn and chest-strap wearable devices: aystematic review on accuracy and metrological characteristics. Measurement 159:107789. doi: 10.1016/j.measurement.2020.107789
Dahal, K., Bogue-Jimenez, B., and Doblas, A. (2023). Global stress detection framework combining a reduced set of hrv features and random forest model. Sensors 23:5220. doi: 10.3390/s23115220
Dantzer, B., Fletcher, Q. E., Boonstra, R., and Sheriff, M. J. (2014). Measures of physiological stress: a transparent or opaque window into the status, management and conservation of species? Conserv. Physiol. 2:cou023. doi: 10.1093/conphys/cou023
De Vries, L. P., Baselmans, B. M., and Bartels, M. (2021). Smartphone-based ecological momentary assessment of well-being: a systematic review and recommendations for future studies. J. Hap. Stud. 22, 2361–2408. doi: 10.1007/s10902-020-00324-7
Dhabhar, F. S. (2018). The short-term stress response—mother nature's mechanism for enhancing protection and performance under conditions of threat, challenge, and opportunity. Front. Neuroendocrinol. 49, 175–192. doi: 10.1016/j.yfrne.2018.03.004
Di Campli San Vito, P., Shakeri, G., Ross, J., Yang, X., and Brewster, S. (2023). “Development of a real-time stress detection system for older adults with heart rate data,” in Proceedings of the 16th International Conference on PErvasive Technologies Related to Assistive Environments (IEEE), 226–236.
Donati, M., Olivelli, M., Giovannini, R., and Fanucci, L. (2023). Ecg-based stress detection and productivity factors monitoring: the real-time production factory system. Sensors 23:5502. doi: 10.3390/s23125502
Egilmez, B., Poyraz, E., Zhou, W., Memik, G., Dinda, P., and Alshurafa, N. (2017). “UStress: understanding college student subjective stress using wrist-based passive sensing,” in 2017 IEEE International Conference on Pervasive Computing and Communications Workshops (PerCom Workshops) (Kona: IEEE), 673–678.
Empatica (2024). Empatica. Available at: https://www.empatica.com/en-int/store/e4-wristband/ (accessed June 25, 2024).
fitbit (2024). Fitbit. Available at: https://www.fitbit.com/global/in/home (accessed April 30, 2024).
Gao, N., Ananthan, S., Yu, C., Wang, Y., and Salim, F. D. (2023). Critiquing self-report practices for human mental and wellbeing computing at ubicomp. arXiv preprint arXiv:2311.15496. doi: 10.48550/arXiv.2311.15496
Garg, P., Santhosh, J., Dengel, A., and Ishimaru, S. (2021). “Stress detection by machine learning and wearable sensors,” in Companion Proceedings of the 26th International Conference on Intelligent User Interfaces, 43–45.
Garmin (2024a). Garmin HRM Dual. Available at: https://www.garmin.com/en-US/p/649059 (accessed April 30, 2024).
Garmin (2024b). Garmin Vivosmart 4. Available at: https://www.garmin.co.in/products/wearables/vivosmart-4-black-large/ (accessed June 24, 2024).
Garminvivo (2024). Garminvivo. Available at: https://www.garmin.co.in/products/wearables/vivosmart-4-black-large/ (accessed June 25, 2024).
Gedam, S., and Paul, S. (2021). A review on mental stress detection using wearable sensors and machine learning techniques. IEEE Access 9, 84045–84066. doi: 10.1109/ACCESS.2021.3085502
Gerrett, N., Griggs, K., Redortier, B., Voelcker, T., Kondo, N., and Havenith, G. (2018). Sweat from gland to skin surface: production, transport, and skin absorption. J. Appl. Physiol. 125, 459–469. doi: 10.1152/japplphysiol.00872.2017
Ghaderi, A., Frounchi, J., and Farnam, A. (2015). “Machine learning-based signal processing using physiological signals for stress detection,” in 2015 22nd Iranian Conference on Biomedical Engineering (ICBME) (Tehran: IEEE), 93–98.
Ghosh, S., Mandi, S., Sen, S., Mitra, B., and De, P. (2024). “Towards estimating missing emotion self-reports leveraging user similarity: a multi-task learning approach,” in Proceedings of the CHI Conference on Human Factors in Computing Systems (CHI 2024), 1–19.
Gimpel, H., Regal, C., and Schmidt, M. (2015). “Mystress : unobtrusive smartphone-based stress detection,” in Proceedings of the 23rd European Conference on Information Systems (ECIS). Münster.
Gomes, N., Pato, M., Lourenco, A. R., and Datia, N. (2023). A survey on wearable sensors for mental health monitoring. Sensors 23:1330. doi: 10.3390/s23031330
Gordon, C. J. (2003). Role of environmental stress in the physiological response to chemical toxicants. Environ. Res. 92, 1–7. doi: 10.1016/S0013-9351(02)00008-7
Gupta, R., Bhongade, A., and Gandhi, T. K. (2023). “Multimodal wearable sensors-based stress and affective states prediction model,” in 2023 9th International Conference on Advanced Computing and Communication Systems (ICACCS), Volume 1 (Coimbatore: IEEE), 30–35.
Han, Y., Lee, H., Toshnazarov, K. E., Noh, Y., and Lee, U. (2022). “Stressbal: personalized just-in-time stress intervention with wearable and phone sensing,” in Adjunct Proceedings of the 2022 ACM International Joint Conference on Pervasive and Ubiquitous Computing and the 2022 ACM International Symposium on Wearable Computers (UbiComp/ISWC), 41–43.
Heron, K. E., and Smyth, J. M. (2010). Ecological momentary interventions: incorporating mobile technology into psychosocial and health behaviour treatments. Br. J. Health Psychol. 15, 1–39. doi: 10.1348/135910709X466063
Hojjatinia, S., Daly, E. R., Hnat, T., Hossain, S. M., Kumar, S., Lagoa, C. M., et al. (2021). Dynamic models of stress-smoking responses based on high-frequency sensor data. NPJ Digit. Med. 4:162. doi: 10.1038/s41746-021-00532-2
Hong, J.-H., Ramos, J., and Dey, A. K. (2012). “Understanding physiological responses to stressors during physical activity,” in Proceedings of the 2012 ACM Conference on Ubiquitous Computing [Association for Computing Machinery (ACM)]„ 270–279.
Hovsepian, K., Al'Absi, M., Ertin, E., Kamarck, T., Nakajima, M., and Kumar, S. (2015). “Cstress: towards a gold standard for continuous stress assessment in the mobile environment,” in Proceedings of the 2015 ACM International Joint Conference on Pervasive and Ubiquitous Computing (UbiComp 2015) [Association for Computing Machinery (ACM)], 493–504.
Howe, E., Suh, J., Bin Morshed, M., McDuff, D., Rowan, K., Hernandez, J., et al. (2022). Design of Digital Workplace Stress-Reduction Intervention Systems: Effects of Intervention Type and Timing, 1–16.
Intille, S., Haynes, C., Maniar, D., Ponnada, A., and Manjourides, J. (2016). “μEMA: microinteraction-based ecological momentary assessment (EMA) using a smartwatch,” in ACM International Joint Conference on Pervasive and Ubiquitous Computing, UbiComp, 1124–1128.
Iqbal, T., Elahi, A., Redon, P., Vazquez, P., Wijns, W., and Shahzad, A. (2021). A review of biophysiological and biochemical indicators of stress for connected and preventive healthcare. Diagnostics 11:556. doi: 10.3390/diagnostics11030556
Islam, T., and Washington, P. (2023). Individualized stress mobile sensing using self-supervised pre-training. Appl. Sci. 13:12035. doi: 10.3390/app132112035
Jat, A. S., and Grønli, T.-M. (2022). “Smart watch for smart health monitoring: a literature review,” in International Work-Conference on Bioinformatics and Biomedical Engineering (Berlin: Springer), 256–268.
Khunti, K. (2014). Accurate interpretation of the 12-lead ecg electrode placement: a systematic review. Health Educ. J. 73, 610–623. doi: 10.1177/0017896912472328
Kim, N., Seo, W., Kim, S., and Park, S.-M. (2020). Electrogastrogram: demonstrating feasibility in mental stress assessment using sensor fusion. IEEE Sens. J. 21, 14503–14514. doi: 10.1109/JSEN.2020.3026717
King, Z. D., Moskowitz, J., Egilmez, B., Zhang, S., Zhang, L., Bass, M., et al. (2019). Micro-stress ema: A passive sensing framework for detecting in-the-wild stress in pregnant mothers. Proc. ACM Interact. Mob. Wear. Ubiquit. Technol. 3, 1–22. doi: 10.1145/3351249
Klimek, A., Mannheim, I., Schouten, G., Wouters, E. J., and Peeters, M. W. (2023). Wearables measuring electrodermal activity to assess perceived stress in care: a scoping review. Acta Neuropsychiatr. 19, 1–11. doi: 10.1017/neu.2023.19
Kumar, P., Chauhan, R., Stephan, T., Shankar, A., and Thakur, S. (2021). “A machine learning implementation for mental health care. application: Smart watch for depression detection,” in 2021 11th International Conference on Cloud Computing, Data Science and Engineering (Confluence) (IEEE), 568–574.
Künzler, F., Mishra, V., Kramer, J.-N., Kotz, D., Fleisch, E., and Kowatsch, T. (2019). Exploring the state-of-receptivity for mhealth interventions. Proc. ACM Interact. Mob. Wear. Ubiquit. Technol. 3, 1–27. doi: 10.1145/3369805
Lane, N. D., Miluzzo, E., Lu, H., Peebles, D., Choudhury, T., and Campbell, A. T. (2010). A survey of mobile phone sensing. IEEE Commun. Mag. 48, 140–150. doi: 10.1109/MCOM.2010.5560598
Lee, J., Elhaouij, N., and Picard, R. (2021). Ambientbreath: unobtrusive just-in-time breathing intervention using multi-sensory stimulation and its evaluation in a car simulator. Proc. ACM Interact. Mob. Wear. Ubiquit. Technol. 5, 1–30. doi: 10.1145/3463493
Lee, J. H., Gamper, H., Tashev, I., Dong, S., Ma, S., Remaley, J., et al. (2020). “Stress monitoring using multimodal bio-sensing headset,” in Proceedings of the 2024 CHI Conference on Human Factors in Computing Systems, 1–7.
Lee, S., Hwang, H. B., Park, S., Kim, S., Ha, J. H., Jang, Y., et al. (2022). Mental stress assessment using ultra short term hrv analysis based on non-linear method. Biosensors 12:465. doi: 10.3390/bios12070465
Li, B., and Sano, A. (2020). Extraction and interpretation of deep autoencoder-based temporal features from wearables for forecasting personalized mood, health, and stress. Proc. ACM Interact. Mob. Wear. Ubiquit. Technol. 4, 1–26. doi: 10.1145/3397318
Li, Q., Xue, Y., Zhao, L., Jia, J., and Feng, L. (2016). Analyzing and identifying teens' stressful periods and stressor events from a microblog. IEEE J. Biomed. Health Informat. 21, 1434–1448. doi: 10.1109/JBHI.2016.2586519
Liu, Y., Wang, Y., and Zhang, J. (2012). “New machine learning algorithm: Random forest,” in Information Computing and Applications: Third International Conference, ICICA 2012, Chengde, China, September 14-16, 2012. Proceedings 3 (Berlin: Springer), 246–252.
Mentis, A.-F. A., Lee, D., and Roussos, P. (2024). Applications of artificial intelligence- machine learning for detection of stress: a critical overview. Mol. Psychiat. 29, 1882–1894. doi: 10.1038/s41380-023-02047-6
Mishra, V., Künzler, F., Kramer, J.-N., Fleisch, E., Kowatsch, T., and Kotz, D. (2021). Detecting receptivity for mhealth interventions in the natural environment. Proc. ACM interact. Mob. Wear. Ubiquit. Technol. 5, 1–24. doi: 10.1145/3463492
Mishra, V., Pope, G., Lord, S., Lewia, S., Lowens, B., Caine, K., et al. (2020). Continuous detection of physiological stress with commodity hardware. ACM Trans. Comput. Healthc. 1, 1–30. doi: 10.1145/3361562
Mitro, N., Argyri, K., Pavlopoulos, L., Kosyvas, D., Karagiannidis, L., Kostovasili, M., et al. (2023). AI-enabled smart wristband providing real-time vital signs and stress monitoring. Sensors 23:2821. doi: 10.3390/s23052821
Mohanavelu, K., Lamshe, R., Poonguzhali, S., Adalarasu, K., and Jagannath, M. (2017). Assessment of human fatigue during physical performance using physiological signals: a review. Biomed. Pharmacol. J. 10, 1887–1896. doi: 10.13005/bpj/1308
Momeni, N., Valdés, A. A., Rodrigues, J., Sandi, C., and Atienza, D. (2021). CAFS: cost-aware features selection method for multimodal stress monitoring on wearable devices. IEEE Trans. Biomed. Eng. 69, 1072–1084. doi: 10.1109/TBME.2021.3113593
Montesinos, V., Dell'Agnola, F., Arza, A., Aminifar, A., and Atienza, D. (2019). “Multi-modal acute stress recognition using off-the-shelf wearable devices,” in 2019 41st Annual International Conference of the IEEE Engineering in Medicine and Biology Society (EMBC) (Berlin: IEEE), 2196–2201.
Moser, M. K., Resch, B., and Ehrhart, M. (2023). An individual-oriented algorithm for stress detection in wearable sensor measurements. IEEE Sens. J. 2023:3304422. doi: 10.1109/JSEN.2023.3304422
Moskowitz, D. S., and Young, S. N. (2006). Ecological momentary assessment: what it is and why it is a method of the future in clinical psychopharmacology. J. Psychiat. Neurosci. 31, 13–20. doi: 10.1503/jpn.050100
Noushad, S., Ahmed, S., Ansari, B., Mustafa, U.-H., Saleem, Y., and Hazrat, H. (2021). Physiological biomarkers of chronic stress: a systematic review. Int. J. Health Sci. 15:46. doi: 10.53786/ijhs.v15i5.2347
Oh, S.-R., Seo, Y.-D., Lee, E., and Kim, Y.-G. (2021). A comprehensive survey on security and privacy for electronic health data. Int. J. Environ. Res. Publ. Health 18:9668. doi: 10.3390/ijerph18189668
Page, M. J., McKenzie, J. E., Bossuyt, P. M., Boutron, I., Hoffmann, T. C., Mulrow, C. D., et al. (2021). Updating guidance for reporting systematic reviews: development of the prisma 2020 statement. J. Clin. Epidemiol. 134, 103–112. doi: 10.1016/j.jclinepi.2021.02.003
Park, J., Kim, J., and Kim, S.-P. (2018). “Prediction of daily mental stress levels using a wearable photoplethysmography sensor,” in TENCON 2018-2018 IEEE Region 10 Conference (Jeju: IEEE), 1899–1902.
Paulhus, D. L., and Vazire, S. (2007). The self-report method. Handb. Res. Methods Personal. Psychol. 1, 224–239.
Pinge, A., Bandyopadhyay, S., Ghosh, S., and Sen, S. (2022). “A comparative study between ECG-based and PPG-based heart rate monitors for stress detection,” in 2022 14th International Conference on COMmunication Systems and NETworkS (COMSNETS) (Bangalore: IEEE), 84–89.
Pogliaghi, A., Di Lascio, E., Gashi, S., Piciucco, E., Santini, S., and Gjoreski, M. (2022). “Multi-task learning for stress recognition,” in Adjunct Proceedings of the 2022 ACM International Joint Conference on Pervasive and Ubiquitous Computing and the 2022 ACM International Symposium on Wearable Computers (Association for Computational Linguistics), 202–206.
Polar (2024). H10 Heart Rate Monitor. Available at: https://www.polar.com/en/sensors/h10-heart-rate-sensor (accessed April 13, 2024).
Posada-Quintero, H. F., and Chon, K. H. (2019). “Phasic component of electrodermal activity is more correlated to brain activity than tonic component,” in 2019 IEEE EMBS International Conference on Biomedical and Health Informatics (BHI) (Chicago, IL: IEEE), 1–4.
Rachakonda, L., Mohanty, S. P., and Kougianos, E. (2020). “Stress-lysis: an IOMT-enabled device for automatic stress level detection from physical activities,” in 2020 IEEE International Symposium on Smart Electronic Systems (iSES)(Formerly iNiS) (Chennai: IEEE), 204–205.
Rasti, T., Zhu, Q., Zhou, K., Soni, A., Zhao, S., and Sleeman, D. (2023). A summative survey on ECG and PPG signal analysis. Int. J. Comput. Appl. Technol. 73, 148–162. doi: 10.1504/IJCAT.2023.134762
Rodrigues, S., Paiva, J. S., Dias, D., Pimentel, G., Kaiseler, M., and Cunha, J. P. S. (2018). Wearable biomonitoring platform for the assessment of stress and its impact on cognitive performance of firefighters: an experimental study. Clin. Pract. Epidemiol. Ment. Health 14:250. doi: 10.2174/1745017901814010250
Roldán-Rojo, T. A., Rendón-Veléz, E., and Carrizosa, S. (2021). “Stressors and algorithms used for stress detection: a review,” in 2021 9th International Conference on Affective Computing and Intelligent Interaction (ACII) (Nara: IEEE), 1–8.
Rony, R. J., and Ahmed, N. (2020). “Development of a low cost wearable with mobile sensing to monitor driving stress through HRV,” in Proceedings of the 2020 Symposium on Emerging Research from Asia and on Asian Contexts and Cultures [Association for Computing Machinery (ACM)], 37–40.
Samsung (2023). Measure Your Stress Level With Samsung Health. Available at: https://www.samsung.com/us/support/answer/ANS00080574/ (accessed June 13, 2024).
Samsung (2024). Samsung Gear. Available at: https://www.samsung.com/us/mobile/wearables/smartwatches/gear-sport-black-sm-r600nzkaxar/ (accessed June 24, 2024).
Sano, A., Phillips, A. J., Amy, Z. Y., McHill, A. W., Taylor, S., Jaques, N., et al. (2015). “Recognizing academic performance, sleep quality, stress level, and mental health using personality traits, wearable sensors and mobile phones,” in 2015 IEEE 12th International Conference on Wearable and Implantable Body Sensor Networks (BSN) (IEEE), 1–6.
Sano, A., and Picard, R. W. (2013). “Stress recognition using wearable sensors and mobile phones,” in 2013 Humaine Association Conference on Affective Computing and Intelligent Interaction (Geneva: IEEE), 671–676.
Sano, A., Taylor, S., McHill, A. W., Phillips, A. J., Barger, L. K., Klerman, E., et al. (2018). Identifying objective physiological markers and modifiable behaviors for self-reported stress and mental health status using wearable sensors and mobile phones. J. Med. Intern. Res. 20:9410. doi: 10.2196/jmir.9410
Scarpina, F., and Tagini, S. (2017). The stroop color and word test. Front. Psychol. 8:241674. doi: 10.3389/fpsyg.2017.00557
Schmidt, P., Reiss, A., Duerichen, R., Marberger, C., and V. Laerhoven, K. (2018). “Introducing wesad, a multimodal dataset for wearable stress and affect detection,” in International Conference on Multimodal Interaction (ICMI 2018).
Schneiderman, N., Ironson, G., and Siegel, S. D. (2005). Stress and health: psychological, behavioral, and biological determinants. Annu. Rev. Clin. Psychol. 1, 607–628. doi: 10.1146/annurev.clinpsy.1.102803.144141
Sen, S., Subbaraju, V., Misra, A., Balan, R. K., and Lee, Y. (2015). “The case for smartwatch-based diet monitoring,” in 2015 IEEE International Conference on Pervasive Computing and Communication Workshops (PerCom workshops) (St. Louis, MO: IEEE), 585–590.
Seng, K. P., Ang, L.-M., Peter, E., and Mmonyi, A. (2023). Machine learning and AI technologies for smart wearables. Electronics 12:1509. doi: 10.3390/electronics12071509
Shajari, S., Salahandish, R., Zare, A., Hassani, M., Moossavi, S., Munro, E., et al. (2023). Microsweat: a wearable microfluidic patch for noninvasive and reliable sweat collection enables human stress monitoring. Adv. Sci. 10:2204171. doi: 10.1002/advs.202204171
Sharmin, M., Raij, A., Epstien, D., Nahum-Shani, I., Beck, J. G., Vhaduri, S., et al. (2015). “Visualization of time-series sensor data to inform the design of just-in-time adaptive stress interventions,” in ACM International Joint Conference on Pervasive and Ubiquitous Computing (ACM), 505–516.
Sheeraz, M., Aslam, A. R., and Altaf, M. A. B. (2022). “Multiphysiological shallow neural network-based mental stress detection system for wearable environment,” in 2022 IEEE International Symposium on Circuits and Systems (ISCAS) (Austin, TX: IEEE), 2309–2313.
Shiffman, S., Stone, A. A., and Hufford, M. R. (2008). Ecological momentary assessment. Annu. Rev. Clin. Psychol. 4, 1–32. doi: 10.1146/annurev.clinpsy.3.022806.091415
Shimmer (2024). Shimmer 3 ECG. Available at: https://shimmersensing.com/product/shimmer3-ecg-unit-2/ (accessed April 29, 2024).
Shrestha, S., Stapp, J., Taylor, M., Leach, R., Carreiro, S., and Indic, P. (2023). “Towards device agnostic detection of stress and craving in patients with substance use disorder,” in Proceedings of the... Annual Hawaii International Conference on System Sciences. Annual Hawaii International Conference on System Sciences, Volume 2023 (NIH Public Access), 3156.
Sim, I. (2019). Mobile devices and health. N. Engl. J. Med. 381, 956–968. doi: 10.1056/NEJMra1806949
Smets, E., De Raedt, W., and Van Hoof, C. (2018a). Into the wild: the challenges of physiological stress detection in laboratory and ambulatory settings. IEEE J. Biomed. Health Informat. 23, 463–473. doi: 10.1109/JBHI.2018.2883751
Smets, E., Rios Velazquez, E., Schiavone, G., Chakroun, I., D'Hondt, E., De Raedt, W., et al. (2018b). Large-scale wearable data reveal digital phenotypes for daily-life stress detection. NPJ Digit. Med. 1:67. doi: 10.1038/s41746-018-0074-9
Smirthy, M., Dhanushree, M., and Ashisha, G. (2023). “Investigation of machine learning techniques and sensing devices for mental stress detection,” in 2023 4th International Conference on Signal Processing and Communication (ICSPC) (Coimbatore: IEEE), 287–291.
Steinisch, M., Yusuf, R., Li, J., Stalder, T., Bosch, J. A., Rahman, O., et al. (2014). Work stress and hair cortisol levels among workers in a bangladeshi ready-made garment factory–results from a cross-sectional study. Psychoneuroendocrinology 50, 20–27. doi: 10.1016/j.psyneuen.2014.08.001
Subash, S., Tejas, B., Vasanth, R., and Vani, B. (2023). “CNN and Arduino based stress level detection system,” in 2023 4th International Conference for Emerging Technology (INCET) (Belgaum: IEEE), 1–4.
Szakonyi, B., Vassányi, I., Schumacher, E., and Kósa, I. (2021). Efficient methods for acute stress detection using heart rate variability data from ambient assisted living sensors. Biomed. Eng. Onl. 20, 1–19. doi: 10.1186/s12938-021-00911-6
Taylor, S., Jaques, N., Nosakhare, E., Sano, A., and Picard, R. (2017). Personalized multitask learning for predicting tomorrow's mood, stress, and health. IEEE Trans. Affect. Comput. 11, 200–213. doi: 10.1109/TAFFC.2017.2784832
Tazarv, A., Labbaf, S., Reich, S. M., Dutt, N., Rahmani, A. M., and Levorato, M. (2021). “Personalized stress monitoring using wearable sensors in everyday settings,” in 2021 43rd Annual International Conference of the IEEE Engineering in Medicine and Biology Society (EMBC) (IEEE), 7332–7335.
Tomašić, I., and Trobec, R. (2013). Electrocardiographic systems with reduced numbers of leads—synthesis of the 12-lead ECG. IEEE Rev. Biomed. Eng. 7, 126–142. doi: 10.1109/RBME.2013.2264282
Tsai, C.-H., Chen, P.-C., Liu, D.-S., Kuo, Y.-Y., Hsieh, T.-T., Chiang, D.-L., et al. (2022). Panic attack prediction using wearable devices and machine learning: development and cohort study. JMIR Med. Informat. 10:e33063. doi: 10.2196/33063
Vijayan, V., Connolly, J. P., Condell, J., McKelvey, N., and Gardiner, P. (2021). Review of wearable devices and data collection considerations for connected health. Sensors 21:5589. doi: 10.3390/s21165589
Vos, G., Trinh, K., Sarnyai, Z., and Azghadi, M. R. (2023). Generalizable machine learning for stress monitoring from wearable devices: a systematic literature review. Int. J. Med. Informat. 173:105026. doi: 10.1016/j.ijmedinf.2023.105026
Wang, R., Chen, F., Chen, Z., Li, T., Harari, G., Tignor, S., et al. (2014). “Studentlife: assessing mental health, academic performance and behavioral trends of college students using smartphones,” in ACM International Joint Conference on Pervasive and Ubiquitous Computing.
Wilkinson, R., Fox, R., Goldsmith, R., Hampton, I., and Lewis, H. (1964). Psychological and physiological responses to raised body temperature. J. Appl. Physiol. 19, 287–291.
World Health Organization (2024). Stress. Available at: https://www.who.int/news-room/questions-and-answers/item/stress (accessed June 11, 2024).
Wu, J., Zhang, Y., and Zhao, X. (2021). “Stress detection using wearable devices based on transfer learning,” in 2021 IEEE International Conference on Bioinformatics and Biomedicine (BIBM) (Houston, TX: IEEE), 3122–3128.
Wu, W., Pirbhulal, S., Zhang, H., and Mukhopadhyay, S. C. (2018). Quantitative assessment for self-tracking of acute stress based on triangulation principle in a wearable sensor system. IEEE J. Biomed. Health Informat. 23, 703–713. doi: 10.1109/JBHI.2018.2832069
Xefteris, V.-R., Tsanousa, A., Symeonidis, S., Diplaris, S., Zaffanela, F., Monego, M., et al. (2023). “Stress detection based on wearable physiological sensors: laboratory and real-life pilot scenario application,” in SIGNAL 2023 [International Academy, Research, and Industry Association (IARIA)], 14.
Yadav, G., and Bokhari, M. U. (2023). “Comparative study of mental stress detection through machine learning techniques,” in 2023 10th International Conference on Computing for Sustainable Global Development (INDIACom) (New Delhi: IEEE), 1662–1666.
Yu, H., and Sano, A. (2023). Semi-supervised learning for wearable-based momentary stress detection in the wild. Proc. ACM Interact. Mob. Wear. Ubiquit. Technol. 7, 1–23. doi: 10.1145/3596246
Zephyr (2024). Zephyr Bioharness. Available at: https://www.zephyranywhere.com/resources/developer-user-tools (accessed April 29, 2024).
Zhang, P., Li, F., Zhao, R., Zhou, R., Du, L., Zhao, Z., et al. (2021). Real-time psychological stress detection according to ECG using deep learning. Appl. Sci. 11:3838. doi: 10.3390/app11093838
Zhao, Y., Tao, Y., Le, G., Maki, R., Adams, A., Lopes, P., et al. (2023). Affective touch as immediate and passive wearable intervention. Proc. ACM Interact. Mob. Wear. Ubiquit. Technol. 6, 1–23. doi: 10.1145/3569484
Zhu, L., Spachos, P., Ng, P. C., Yu, Y., Wang, Y., Plataniotis, K., et al. (2023). Stress detection through wrist-based electrodermal activity monitoring and machine learning. IEEE J. Biomed. Health Informat. 27, 2155–2165. doi: 10.1109/JBHI.2023.3239305
Keywords: wearable technology, stress detection, stress monitoring, healthcare, ubiquitous computing, affective computing
Citation: Pinge A, Gad V, Jaisighani D, Ghosh S and Sen S (2024) Detection and monitoring of stress using wearables: a systematic review. Front. Comput. Sci. 6:1478851. doi: 10.3389/fcomp.2024.1478851
Received: 11 August 2024; Accepted: 18 November 2024;
Published: 18 December 2024.
Edited by:
Luca Davoli, University of Parma, ItalyReviewed by:
Colin K. Drummond, Case Western Reserve University, United StatesAlfredo Padilla Lopez, Autonomous University of Baja California, Mexico
Copyright © 2024 Pinge, Gad, Jaisighani, Ghosh and Sen. This is an open-access article distributed under the terms of the Creative Commons Attribution License (CC BY). The use, distribution or reproduction in other forums is permitted, provided the original author(s) and the copyright owner(s) are credited and that the original publication in this journal is cited, in accordance with accepted academic practice. No use, distribution or reproduction is permitted which does not comply with these terms.
*Correspondence: Anuja Pinge, cDIwMjAwMDUyQGdvYS5iaXRzLXBpbGFuaS5hYy5pbg==; Sougata Sen, c291Z2F0YXNAZ29hLmJpdHMtcGlsYW5pLmFjLmlu