 Markeya S. Peteranetz
 Anthony D. Albano
- 1College of Engineering, University of Nebraska-Lincoln, Lincoln, NE, United States
- 2School of Education, University of California, Davis, Davis, CA, United States
One way to increase the quality of computing education research is to increase the quality of the measurement tools that are available to researchers, especially measures of students' knowledge and skills. This paper represents a step toward increasing the number of available thoroughly-evaluated tests that can be used in computing education research by evaluating the psychometric properties of a multiple-choice test designed to differentiate undergraduate students in terms of their mastery of foundational computing concepts. Classical test theory and item response theory analyses are reported and indicate that the test is a reliable, psychometrically-sound instrument suitable for research with undergraduate students. Limitations and the importance of using standardized measures of learning in education research are discussed.
Introduction
As the number of jobs in the technology sector continues to grow and increasing numbers of students choose to take computing courses at the K-12 and undergraduate levels, interest in computing education research is growing as well. The learning outcomes used in computer science (CS) education research are typically captured by classroom tests, grades, or students' self-report of learning, each of which is a problematic proxy for learning outcomes. The quality of classroom tests can vary widely, and when reported in research, details about the development process or psychometric characteristics are usually unavailable. Grades are composites of a variety of factors (e.g., tests, performance assessments, participation) that differ widely across instructors and courses, and as such, are of inconsistent and questionable validity when used as a generalizable measure of learning (Brookhart et al., 2016). Self-reports of perceived learning also have validity concerns. Students are not always good judges of how much they have learned, and research examining the alignment of self- and teacher-assessment has yielded mixed results (see Ross, 2006 for a review). As others have pointed out (Tew and Guzdial, 2011; Shute et al., 2017), the lack of psychometrically evaluated assessments that can be used in computing education research is a challenge to researchers' ability to draw conclusions and make comparisons across studies that attempt to determine the effectiveness of various pedagogical approaches, learning activities, and interventions. Making available higher-quality standardized measures of students' learning will facilitate generalizable research.
As part of our research on learning in undergraduate CS courses, we have developed standardized assessments of core computing concepts. We intend for these assessments to be available to other researchers conducting research in undergraduate settings. To that end, we begin this paper by reviewing the literature on cognitive assessments appropriate for computing education research. Then, we describe an assessment developed by our team. Next, we report a psychometric evaluation of the assessment, including both classical test theory (CTT) and item response theory (IRT) analyses before presenting limitations of the study and concluding thoughts.
In order to develop and evaluate curricula and educational interventions for computing education, a small number of assessments of computational thinking and CS knowledge have been created and used in research. Many of these tests have been created for K-12 populations (Zur-Bargury et al., 2013; Grover et al., 2014; Roman-Gonzalez, 2015; Rodriguez et al., 2017; Roman-Gonzalez et al., 2017). Most tests for K-12 students were created for middle school students in classes covering the basics of computing. These tests have multiple choice items (Roman-Gonzalez, 2015; Roman-Gonzalez et al., 2017) or open-ended problem-solving items (Rodriguez et al., 2017), or a combination of the two (Zur-Bargury et al., 2013; Grover et al., 2014).
At the post-secondary level, researchers have often measured mastery of computational thinking and introductory CS content through classroom assessments (e.g., see Table S4A of Freeman et al., 2014). These classroom assessments are not readily available to other researchers, and information about the quality of the assessments is rarely provided. Relative to classroom assessments, there are fewer instances of researchers using standardized tests that have undergone psychometric evaluation. Such assessments make possible comparisons among studies that use different types of instructional interventions across a variety of institutions and samples. A review of the literature yielded four such tests, which are reviewed next.
Existing tests of computational thinking and CS knowledge created for post-secondary students vary in the extent to which they use code within the test. On one end of the code-usage spectrum is the test built by Gouws et al. (2013), which contains no computer code. It is a 25-item test of computational thinking skills with both multiple-choice and constructed-response items that were sourced from retired versions of the South African Computer Olympiad “Talent Search” screening test. The items themselves may have been evaluated when they were created for the screening test, but detailed information about the development and evaluation of the items is not available. The evaluation provided by Gouws et al. (2013) does not include traditional test-level or item-level psychometric results such as internal consistency reliability, item difficulty, or item discrimination.
On the other end of the spectrum of code usage is the test presented by Lister (2005). This test was created as a final exam for introductory CS students, and most items require the examinee to interpret code written in Java. Lister's analysis of the test includes a breakdown item difficulty levels for the students in each quartile, commentary on each question, and the functioning of distractors. In the middle of the code-usage spectrum are the tests developed by Tew (2010), Tew and Guzdial (2010), and Tew and Guzdial (2011) and by Parker et al. (2016). These tests, the Foundational CS1 Assessment (FCS1) and the Second CS1 Assessment (SCS1), use pseud-code to test students' understanding of introductory CS concepts in a way that is independent of students' mastery of any particular coding language. The pseudo-code was developed by Tew (2010) and was designed to have minimal syntax and a simple structure. The FCS1 and the SCS1 have been evaluated through IRT analysis and have been found to have satisfactory psychometric properties (Tew and Guzdial, 2011; Parker et al., 2016). Citing test security concerns, the creators of the FCS1 and the SCS1 have restricted access to their tests, so despite their intent to create assessments available to the computing education research community, the tests have seen limited use in research.
The test presented in this paper, the Nebraska Assessment of Computing Knowledge (NACK), lies between the middle and the code-free end of the code-usage spectrum. Similar to the FCS1 and SCS1, the NACK uses pseudo-code for a small number of items as it assesses undergraduate students' computational thinking and CS knowledge. The CS faculty involved in creating the NACK identified content areas that reflected the wide range of topics that are included in most introductory CS courses. An initial pool of 26 conceptual and problem-solving items was created by the faculty. Because of the need to keep the test brief, the item pool was reduced, resulting in less coverage of topics from the undergraduate CS curriculum. Over three cycles of pilot testing, evaluation, and refinement, 13 multiple-choice items were selected for the final version of the test. These items cover content fundamental to CS, such as selection, looping, arrays, functions, algorithms, search, and sorting.
The NACK was designed as a norm-referenced test, and the final items were selected so that scores would be approximately normally distributed with mean of roughly 50% correct. As a result, few students taking the test are expected score very low or very high. Details about the early phases of test development have been previously reported (Nelson et al., 2015), and the full test is available for download on the project website1 and in the Supplementary Material section (originally published in Peteranetz et al., 2018). Although the test was originally developed for introductory CS students, it has also been given in intermediate and advanced CS courses. In our research, web-based survey platforms have been used for delivery. However, a paper-pencil format could also be used. Other changes may include modifications to terminology, so as to make test content consistent with local usage. Substantial changes to administration procedures or test content may impact the psychometric properties of the test, in which case we recommend that validation studies be conducted locally.
The purpose of this paper is to evaluate the psychometric properties of the NACK, including reliability, item difficulty, item discrimination, option performance, measurement invariance, and differential item functioning. Results are intended to help establish validity evidence in support of score inferences based on the NACK, so as to encourage future research and implementation in CS programs.
Methods
Data collection took place over 6 years as part of a larger grant-funded study aimed at developing and evaluating a learning intervention in undergraduate courses. The final 13-item version of the NACK was administered electronically during the week immediately prior to final exams as part of a survey battery that included multiple non-cognitive assessments and demographic questions. The survey was administered during class time and participants used personal, web-enabled devices to access it via the SurveyMonkey platform. The full battery of instruments has been reported elsewhere (Shell and Soh, 2013; Nelson et al., 2015). Completion of the survey was voluntary, and performance on the test did not impact grades, decreasing the likelihood of participants looking up answers, or keeping a record of the test items.
When documenting consent to participate in the study, participants could separately allow the researchers obtain their final grade in the CS course from which they were recruited. Final course grades for consenting participants were obtained from official university records. At this institution, grades follow the traditional A through F grading system, and letter grades were converted to the numeric equivalents used for grade point average calculation prior to analysis (i.e., A/A+ = 4, A- = 3.67…F = 0).
Participants
Participants were undergraduate students (N = 1,381) enrolled in undergraduate CS courses at a large, research-focused institution in the Midwestern United States from the fall 2012 semester to the spring 2018 semester. Participants were recruited from courses at all academic levels, resulting in a sample that included students who had completed a wide range of CS coursework. The unequal numbers of men (n = 1,148) and women (n = 233) in the sample are reflective of the gender imbalance of students taking CS courses at the university. All academic levels were represented in the sample but most were underclassmen (freshmen = 577, sophomores = 446, juniors = 227, seniors = 131). Participant race/ethnicity information was not collected due to Institutional Review Board (IRB) concerns about the possibility of secondary identification of students from underrepresented minority groups. Informed consent was obtained for all participants prior to their participation, in accordance with the institution's IRB policy. Participants were not required to complete the survey, and there was no compensation for doing so.
Analysis
A variety of statistical methods are available for analyzing the psychometric properties of educational measures like the NACK. These include what are referred to as CTT analyses and IRT analyses (de Ayala, 2009). Both CTT and IRT were used here to examine student performance at the total score and item levels. Although some of the analyses can be used successfully with incomplete data, to be consistent across analyses, we reduced the item analysis sample to those students with valid responses on all 13 NACK items (N = 1,201). Not all participants consented to having their grades included in the research (n = 933).
Within a CTT framework, we evaluated internal consistency reliability using coefficients alpha and omega (McDonald, 1999). These reliability indices summarize the extent to which test takers respond in consistent ways across the NACK items, with lower values (e.g., 0–0.60) indicating weak to moderate consistency in scores and larger values (0.60–1.00) indicating moderate to strong results. Although alpha is the more commonly reported of the two indices, due to its simplicity of calculation, studies have shown that the assumptions of alpha (equal factor loadings across items) are often not met, in which case omega (which does not assume equal loadings) is preferable (e.g., Trizano-Hermosilla and Alvarado, 2016).
We calculated mean performance by item (a measure of item difficulty, labeled p-value for proportion correct), the correlation between performance on each item and performance on the total test (a measure of item discrimination, labeled ITC for item-total correlation), and coefficient alpha with each item removed from the scale (alpha-if-item-deleted or AID). We examined the quality of unscored response choices within each item using an option analysis which broke down the response choice distributions into three groups based on total score (the bottom third, middle third, and top third).
We also examined differential item functioning (DIF), a phenomenon in testing where students of the same underlying ability level have different probabilities of correct response on an item, and this difference depends on or can be predicted using some student characteristic that is unrelated to the test, typically a demographic variable such as gender or ethnicity. A fair test is one in which knowledge, skills, and abilities in the content being tested are the only significant predictors of student performance. In this case, students of different groups but the same ability level will have the same probabilities of correct response. The presence of DIF indicates that an item may be biased against certain subpopulations of students (Albano and Rodriguez, 2013). DIF by gender was examined using the Mantel-Haenszel method (MH; Holland and Thayer, 1988), which relies on contingency tables and odds ratios to break down student performance at the item level.
We then used confirmatory factor analysis (CFA) to check the factor structure of the NACK. We hypothesized a unidimensional structure, with all items loading on a single factor and uncorrelated error terms. Model fit statistics were used to evaluate this hypothesis, including the comparative fit index (CFI), where values above 0.95 were taken to indicate acceptable model fit, and root mean square error of approximation (RMSEA), where values below 0.05 indicated acceptable model fit (Kline, 2016).
Next, an IRT model with parameters for person ability (labeled θ), item difficulty (b), item discrimination (a), and lower asymptote (c) was fit to the data. In this model, referred to as a 3 parameter logistic model (3PL), the probability of correct response P(X) is predicted from a logistic function that combines person and item parameters as:
Reduced forms of the model were also explored, including the 2 parameter logistic model or 2PL, in which c is constrained to be 0, and the Rasch model in which c is 0 and a is 1, leaving item difficulty b as the only item parameter (for additional details, see de Ayala, 2009). Models were compared using two likelihood-based indices, the Akaike information criterion (AIC) and Bayesian information criterion (BIC), where reduced values from one model to the next indicated improvement in model fit.
Finally, we examined external indicators of the validity of NACK scores. We compared the performance of students at different points in the CS course progression and also correlated NACK scores with student grades. This institution uses the 100–499 numbering system for first-year through senior-level courses, and within the CS curriculum, students generally are required to take lower-numbered courses before higher-numbered courses (e.g., 100-level courses are prerequisites for 200-level courses). Comparing scores in courses at different levels makes it possible to roughly compare the performance of students with different degrees of exposure to CS instruction. For this analysis, students in honors courses were considered separately as they were considered a different population than students in non-honors courses.
Results
Item Analysis
CTT item analysis was conducted on the reduced sample of students with complete data. Only cases that contained a valid response for all 13 items were included in the item analysis (N = 1,201). For this sample, coefficients alpha and omega were both 0.77, which is generally considered acceptable for a cognitive assessment used for research purposes. The mean number of correct responses was 7.27 (SD = 3.31), and the distribution of total scores was approximately normal. Item statistics are shown in Table 1, with results broken down for the full sample, women (n = 198), and men (n = 1,003).
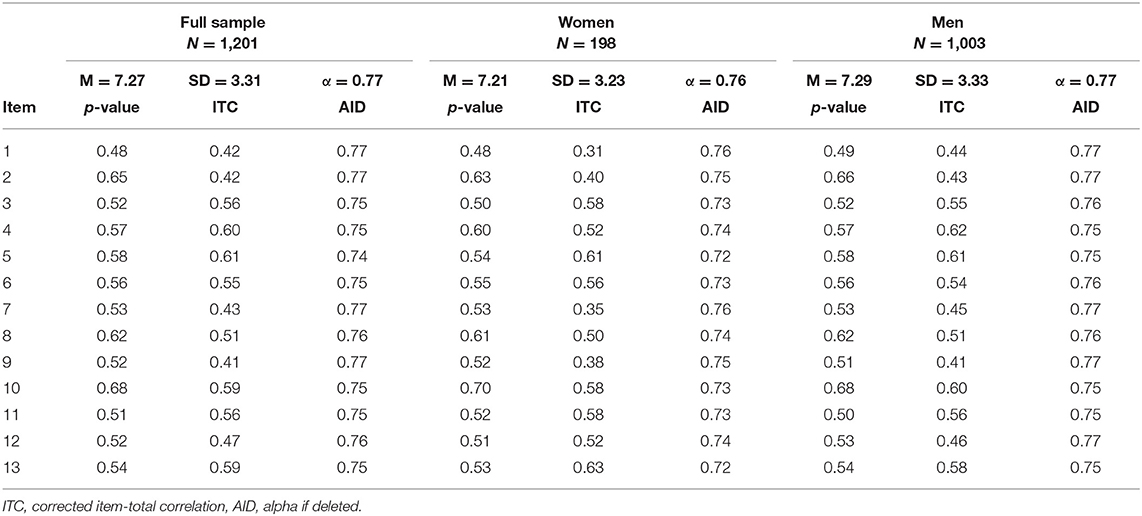
Table 1. CTT item analysis results.
The mean total score for men (7.29) was slightly higher than for women (7.21), but the difference was not statistically or practically significant (t286 = 0.29, p = 0.77). Differences in item statistics by gender were not substantial, so we focus here on the CTT results for the full sample. Item difficulty, or proportion correct (p-value), ranged from 0.48 to 0.68, which is acceptable for a norm-referenced test and in line with the test purpose of discriminating among students in CS. The ITC, which ranged from 0.40 to 0.61, also supported this test purpose. These values indicate that item performance related moderately to strongly with overall performance. None of the AID were above the overall alpha of 0.77, indicating that all items contributed to the internal consistency reliability of the measure.
Option Analysis
The option analysis results indicated that response choices functioned well-overall. We considered two general guidelines when evaluating the bivariate frequency distributions of ability groups (total score divided into thirds) over options (Rodriguez and Albano, 2017). The first guideline is that all options be chosen by a non-negligible number of test takers. It is recommended that any unselected options be revised or removed. We found that each response option was selected by at least 25 students, or 2% of the full sample. The second guideline is that higher ability groups choose the correct response with higher frequency than low ability groups. This guideline relates to the need for a positive relationship between item and total score performance. Examining the percentages of students from the low, middle, and high ability groups selecting the correct options, the majority were always in the high ability group, indicating that the correct response options functioned as intended.
Differential Item Functioning
DIF results are contained in Table 2. The MH statistics indicated that all of the items fell within reasonable bounds for group differences, that is, none exceeded accepted thresholds for exhibiting DIF. Table 2 shows the MH statistics and corresponding chi-square test statistics for each item, along with chi-square p-values. Large chi-square, with p-values below a criterion type-I error rate such as 0.05, would indicate statistically significant differences in performance for women and men, holding constant any ability differences.

Table 2. Differential item functioning results.
Item Response Theory Analysis
CFA results indicated an acceptable fit for the unidimensional model, with CFI of 0.976 and RMSEA of 0.025 (with 90% confidence interval ranging from 0.018 to 0.033). This evidence of a single underlying factor supported the subsequent modeling via unidimensional IRT. When fitting the 3PL, the most complex of the IRT models examined here, the estimation algorithm did not converge. We expect this had to do with difficulty in identifying suitable lower asymptotes for the item response functions, as is often the case with the 3PL (de Ayala, 2009). The 2PL and Rasch models both converged, and model fit statistics indicated that the 2PL was preferable, with lower AIC and BIC. Figure 1 shows the item response functions for the 13 NACK items, and Table S1 shows item parameter estimates.
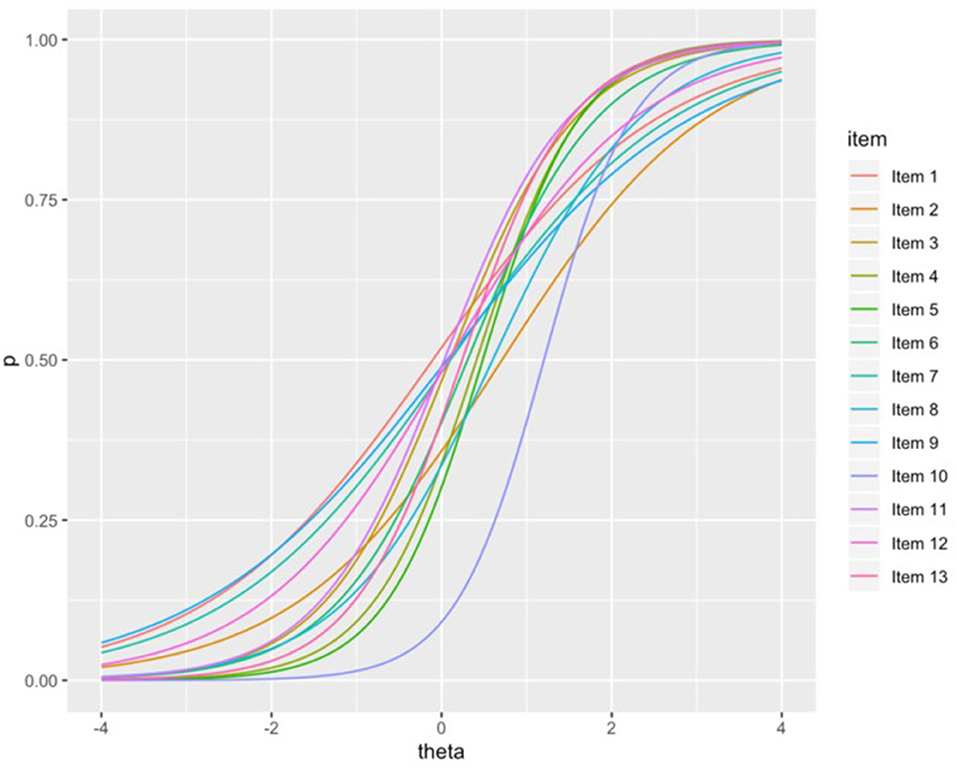
Figure 1. 2PL IRT item response function.
External Indicators of Validity
Average scores for participants enrolled at different course levels differed significantly [F(5, 1, 321) = 83.69, p < 0.001, = 0.241], with participants who were further along in their CS degree program tending to score higher on the NACK. Mean scores tended to increase across the course levels for non-honors courses (see Table 3). The 100-level course mean was significantly lower than all other course levels, and the 400-level course mean was significantly higher than all other non-honors course levels. The difference between 200-level and 300-level courses was not significant. The 100-level honors courses and 300-level honors courses had nearly identical means, and were not significantly different from the 400-level courses.
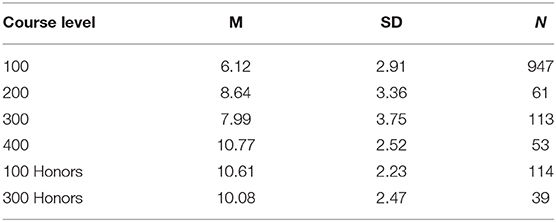
Table 3. Descriptive statistics for NACK scores for different course levels.
Correlations were calculated between NACK scores and numeric grade equivalent scores. Both Pearson and Spearman correlation coefficients were calculated because of the non-normality of the grade distribution and the discrete nature of both variables. The Pearson correlation is more commonly used for test validity but is intended for continuous variables, whereas the Spearman correlation is more appropriate for ordinal variables. The correlations (Pearson r = 0.284, Spearman r = 0.313, ps < 0.001) indicate a positive relationship between NACK scores and grades. As was previously noted, grades are composites of several factors and not “pure” indicators of learning. As a result, we provide these correlations as an initial indicator of the relationship between NACK scores and CS knowledge, while recognizing that additional validation against other measures of CS knowledge are necessary.
Research examining students' motivation and self-regulated learning in CS courses also provides construct-related evidence for the validity of NACK scores. Prior research (Shell et al., 2013) found positive correlations between NACK scores and CS course-specific measures of use of learning strategies, adaptive goal setting, endogenous perceived instrumentality, and positive course-related affect. Negative correlations were found between NACK scores and difficulty self-regulating, maladaptive goal setting, and exogenous perceived instrumentality. The relationships with endogenous and exogenous perceived instrumentality was later replicated, and a positive correlation between NACK scores and aspirations for a career in CS was also found (Peteranetz et al., 2018). Notably, these relationships with perceived instrumentality and career aspirations were stronger for NACK scores than they were for course grades. Finally, Shell and Soh (2013) and Nelson et al. (2015) found that students demonstrating adaptive patterns of motivation and self-regulation in their CS1 course scored higher on the NACK than students demonstrating maladaptive patterns of motivation and self-regulated learning.
Discussion
Collectively, the CTT, DIF, CFA, and IRT analyses, indicate the NACK is psychometrically sound and suitable for research purposes. With this large sample of undergraduate students in CS courses, the NACK demonstrated adequate internal consistency, unidimensionality, and well-functioning items and response options, and no items showed gender-based DIF. Furthermore, scores on the test were associated with course grades and progression through the CS curriculum, and have previously been shown to correlate with measures of student motivation and self-regulated learning (Shell et al., 2013; Peteranetz et al., 2018). To our knowledge, this set of analyses marks the most thorough evaluation of a non-commercial test of computational thinking and CS knowledge. The available evidence supports the continued use of the NACK as a measure of undergraduate students' mastery of computing knowledge and skills in education research.
Limitations of the present analyses and evaluation must be noted. First, the sample used in this study, though large, was drawn from a single, large, research-focused institution in the Midwest region of the United States. Students from this institution are not representative of the larger population of undergraduate students in CS courses. Second and relatedly, the largest single demographic group in this sample was white males, and the majority of students in the sample were in their first or second year of their post-secondary education. Although the sample was consistent with the demographic makeup of the courses from which it was drawn at this institution, it is not representative of the larger population nor of subpopulations in other regions or at other institutions. Third, because race/ethnicity data were not available, we were not able to conduct race/ethnicity-based DIF analysis. Future research should test for the possibility for this and other potential sources of DIF such as international student status. Finally, scores from the NACK have not yet been compared to scores on other similar tests of computational thinking or CS knowledge, which would provide additional validity evidence consistent with the classic criterion approach to validity.
Conclusions
As computing disciplines and the demand for college graduates in those disciplines continue to grow, the importance of studying computing education and the ways it might be improved will continue to grow as well. One way to increase the quality of computing education research is to increase the quality of the measurement tools that are available to researchers, especially measures of students' knowledge and skills. It is common for CS education research to use grades or classroom tests to measure student learning, but grades and classroom tests are generally not suitable for research purposes. Reliability and validity concerns and standards are different when considering measurement for research and for classroom assessment (Smith, 2003; Cizek, 2009), and the different contexts warrant different instruments. Research on student learning typically calls for instruments that are standardized, norm-referenced, and focused on a specific skill or content area, and grades and classroom assessments do not meet those criteria. This paper represents a step toward increasing the number of available thoroughly-evaluated tests of students' knowledge and skills by documenting the psychometric properties of the NACK. Continuing to build the pool of rigorously developed and evaluated assessments of computational thinking and CS knowledge will serve to strengthen the computing education research community.
Data Availability Statement
The datasets generated for this study are available on request to the corresponding author.
Ethics Statement
The studies involving human participants were reviewed and approved by University of Nebraska-Lincoln Institutional Review Board. The patients/participants provided their written informed consent to participate in this study.
Author Contributions
MP provided substantial contribution to the conception of the work, data collection and management, and writing and revising the manuscript. AA provided substantial contribution to the analysis of the data and interpretation of the results, as well as in writing and revising the manuscript.
Funding
This work was supported by the National Science Foundation [grant numbers 0829647, 1431874, and 1122956] and a University of Nebraska-Lincoln Phase II Pathways to Interdisciplinary Research Centers grant, all awarded to Leen-Kiat Soh.
Conflict of Interest
The authors declare that the research was conducted in the absence of any commercial or financial relationships that could be construed as a potential conflict of interest.
Acknowledgments
The authors would like to acknowledge the work of Drs. Leen-Kiat Soh, Duane F. Shell, Elizabeth Ingraham, and Abraham E. Flanigan for their involvement in the research project that led to the creation of this test and the data used in this study.
Supplementary Material
The Supplementary Material for this article can be found online at: https://www.frontiersin.org/articles/10.3389/fcomp.2020.00011/full#supplementary-material
Footnotes
References
Albano, A. D., and Rodriguez, M. C. (2013). Examining differential math performance by gender and opportunity to learn. Educ. Psychol. Meas. 73, 836–856. doi: 10.1177/0013164413487375
Brookhart, S. M., Guskey, T. R., Bowers, A. J., McMillan, J. H., Smith, J. K., Smith, L. F., et al. (2016). A century of grading research: meaning and value in the most common educational measure. Rev. Educ. Res. 86, 803–848. doi: 10.3102/0034654316672069
Cizek, G. J. (2009). Reliability and validity of information about student achievement: comparing large-scale and classroom testing contexts. Theory Pract. 48, 63–71. doi: 10.1080/00405840802577627
de Ayala, R. J. (2009). The Theory and Practice of Item Response Theory. New York, NY: The Guilford Press.
Freeman, S., Eddy, S. L., McDonough, M., Smith, M. K., Okoroafor, N., Jordt, H., et al. (2014). Active learning increases student performance in science, engineering, and mathematics. Proc. Natl. Acad. Sci. U.S.A. 111, 8410–8415. doi: 10.1073/pnas.1319030111
Gouws, L., Bradshaw, K., and Wentworth, P. (2013). “First year student performance in a test for computational thinking,” Proceedings of the 2015 SAICSIT Annual Conference (East London), 271–277. doi: 10.1145/2513456.2513484
Grover, S., Cooper, S., and Pea, R. (2014). “Assessing computational learning in K-12,” Proceedings of the 19th Annual Conference on Innovation and Technology in Computer Science Education (New York, NY), 57–62. doi: 10.1145/2591708.2591713
Holland, P. W., and Thayer, D. T. (1988). “Differential item performance and the Mantel-Haenszel procedure,” in Test Validity, eds H. Wainer and H. Braun (Hillsdale, NJ: Lawrence Erlbaum), 129−145.
Kline, R. B. (2016). “Global fit testing,” in Principles and Practice of Structural Equation Modeling, 4th Edn (New York, NY: The Guilford Press, 262–299.
Lister, R. (2005). “One small step toward a culture of peer review and multi-institutional sharing of educational resources: a multiple choice exam for first semester programming students,” in Proceedings of the 7th Australian Computing Education Conference (Newcastle), 42, 155–164.
McDonald, R. P. (1999). Test Theory: A Unified Treatment. Mahwah, NJ: Lawrence Erlbaum Associates, Inc.
Nelson, K. G., Shell, D. F., Husman, J., Fishman, E. J., and Soh, L. K. (2015). Motivational and self-regulated learning profiles of students taking a foundational engineering course. J. Eng. Educ. 104, 74–100. doi: 10.1002/jee.20066
Parker, M. C., Guzdial, M., and Engleman, S. (2016). “Replication, validation, and use of a language independent CS1 knowledge assessment,” in Proceedings of the 2016 ACM Conference on International Computing Education Research (New York, NY), 93–101. doi: 10.1145/2960310.2960316
Peteranetz, M. S., Flanigan, A. E., Shell, D. F., and Soh, L.-K. (2018). Career aspirations, perceived instrumentality, and achievement in undergraduate computer science courses. Contemp. Educ. Psychol 53, 27–44. doi: 10.1016/j.cedpsych.2018.01.006
Rodriguez, B., Kennicutt, S., Rader, C., and Camp, T. (2017). “Assessing computational thinking in CS Unplugged activities,” in Proceedings of the 48th Technical Symposium on Computer Science Education (New York, NY), 501–506. doi: 10.1145/3017680.3017779
Rodriguez, M. C., and Albano, A. D. (2017). The College Instructor's Guide to Writing Test Items: Measuring Student Learning. New York, NY: Routledge. doi: 10.4324/9781315714776
Roman-Gonzalez, M. (2015). “Computational thinking test: Design guidelines and content validation,” in EDULEARN15 Proceedings (Barcelona), 2436–2444.
Roman-Gonzalez, M., Perez-Gonzalez, J.-C., and Jimenez-Fernandez, C. (2017). Which cognitive abilities underlie computational thinking? Criterion validity of the Computational Thinking Test. Comput. Hum. Behav. 72, 678–691. doi: 10.1016/j.chb.2016.08.047
Ross, J. A. (2006). The Reliability, validity, and utility of self-assessment. Pract. Assess. Res. Eval. 11:14. doi: 10.7275/9wph-vv65
Shell, D. F., Hazley, M. P., Soh, L. K., Ingraham, E., and Ramsay, S. (2013). “Associations of students' creativity, motivation, and self-regulation with learning and achievement in college computer science courses,” in Proceedings of the Frontiers in Education Conference (Oklahoma City, OK), 1637–1643. doi: 10.1109/FIE.2013.6685116
Shell, D. F., and Soh, L. K. (2013). Profiles of motivated self-regulation in college computer science courses: differences in major versus required non-major courses. J. Sci. Educ. Technol. 22, 899–913. doi: 10.1007/s10956-013-9437-9
Shute, V. J., Sun, C., and Asbell-Clarke, J. (2017). Demystifying computational thinking. Educ. Res. Rev. 22, 142–158. doi: 10.1016/j.edurev.2017.09.003
Smith, J. K. (2003). Reconsidering reliability in classroom assessment and grading. Educ. Measur. Issues Practice 22, 26–33. doi: 10.1111/j.1745-3992.2003.tb00141.x
Tew, A. E. (2010). Assessing Fundamental Introductory Computing Concept Knowledge in a Language Independent Manner [Doctoral Dissertation, Georgia Institute of Technology]. Available online at: https://smartech.gatech.edu/bitstream/handle/1853/37090/tew_allison_e_201012_phd.pdf?sequence=1&isAllowed=y
Tew, A. E., and Guzdial, M. (2010). “Developing a validated assessment of fundamental CS1 concepts,” in Proceedings of the 41st ACM Technical Symposium on Computer Science Education (New York, NY), 97–101. doi: 10.1145/1734263.1734297
Tew, A. E., and Guzdial, M. (2011). The FCS1: a language independent assessment of CS1 knowledge,” in Proceedings of the 42nd ACM Technical Symposium on Computer Science Education, New York, NY 111–116. doi: 10.1145/1953163.1953200
Trizano-Hermosilla, I., and Alvarado, J. M. (2016). Best alternatives to Cronbach's alpha reliability in realistic conditions: congeneric and asymmetrical measurements. Front. Psychol 7:769. doi: 10.3389/fpsyg.2016.00769
Keywords: computational thinking, computer science education, computing education research, student learning, test development
Citation: Peteranetz MS and Albano AD (2020) Development and Evaluation of the Nebraska Assessment of Computing Knowledge. Front. Comput. Sci. 2:11. doi: 10.3389/fcomp.2020.00011
Received: 27 November 2019; Accepted: 17 March 2020;
Published: 08 April 2020.
Edited by:
Tom Crick, Swansea University, United KingdomReviewed by:
Neil Brown, King's College School, United KingdomJames Harold Davenport, University of Bath, United Kingdom
Copyright © 2020 Peteranetz and Albano. This is an open-access article distributed under the terms of the Creative Commons Attribution License (CC BY). The use, distribution or reproduction in other forums is permitted, provided the original author(s) and the copyright owner(s) are credited and that the original publication in this journal is cited, in accordance with accepted academic practice. No use, distribution or reproduction is permitted which does not comply with these terms.
*Correspondence: Markeya S. Peteranetz, cGV0ZXJhbmV0ekB1bmwuZWR1