 Muhammad Arif Khan1Ronik Ketankumar Patel2Apurva Pamidimukkala2Sharareh Kermanshachi2*Jay Michael Rosenberger3Greg Hladik4Ann Foss5
- 1Center for Transportation Equity, Decisions and Dollars (CTEDD), University of Texas at Arlington, Arlington, TX, United States
- 2Department of Civil Engineering, University of Texas at Arlington (UTA), Arlington, TX, United States
- 3Department of Industrial, Manufacturing & Systems Engineering, University of Texas at Arlington (UTA), Arlington, TX, United States
- 4Executive Director Auxiliary Services, University of Texas at Arlington, Arlington, TX, United States
- 5Department of Transportation, Arlington, TX, United States
Introduction: Universities and other educational institutions across the United States collaborate with service providers to afford their students, faculty, and staff transit services, such as dedicated buses, on-demand ridesharing, and public transportation. The university community relies on these services, especially in rural and low-density areas without fixed-route transit services. The literature on this topic has a wealth of detailed material about the travel and usage patterns of public transit systems, but it has little information about users’ satisfaction with the transit services provided by universities.
Method: This study focuses on filling this gap by using descriptive statistics and ordered logistic regression to determine how satisfied users are with university transit services and what factors are associated with their level of satisfaction. Four public transit services available to the University of Texas at Arlington community served as our case studies.
Results and Discussion: The results revealed that most users are satisfied with the services overall. Riders were highly satisfied with service attributes like ease of boarding, cleanliness, customer service, and vehicle speed of the four services. On the other hand, they were least satisfied with service availability and wait times of these services. The findings from this study may be used to provide the UTA community with better mobility and accessibility options and to evaluate the levels of satisfaction with similar services offered to other university communities.
1 Introduction
Public transportation contributes significantly to urban travel throughout the globe. Recent trends in transit ridership in the United States, however, indicate a major decline in ridership. Based on a recent transit cooperative research program (TCRP), public transit ridership in the U.S. decreased for six consecutive years from 2012 to 2018 for all modes, with the bus ridership reaching its lowest point (Watkins et al., 2019). Many factors, including public transit cost, efficiency, availability, safety, car ownership, congestion, land use, and parking availability, contribute to the decline in public transportation use (Taylor and Fink, 2003).
Enhancing the quality and performance of public transportation would give advantages such as increased speed and the potential to reduce the total transit journey time. Improving important attributes of the transportation service, such as convenience, accessibility, and reliability, can enhance the service’s appeal and increase ridership (Litman, 2008). Enhancing transit corridor safety is another element that might have a substantial impact on transit usage (Tilahun et al., 2016; Patel et al., 2021). Convenience, and safety can boost passenger satisfaction with the service and individual’s service usage. Users’ opinions of an on-demand rideshare service suggest that the dependability of wait and travel times, and flexible pick-up and drop-off locations may motivate consumers to keep the service usage (Fu & Juan, 2017; Etminani-Ghasrodashti et al., 2021a; Etminani-Ghasrodashti et al., 2021b).
Past studies focused on identifying the factors that affect the satisfaction levels of ridesharing customers (Jahan, 2019; Ginavičienė and Sprogytė, 2020; Tyrinopoulos and Antoniou, 2020; Quan et al., 2022; Arif Khan et al., 2023a). Tyrinopoulos and Antoniou (2020) found that comfort, time, and cost savings are significant determinants of riders’ satisfaction with the quality of mobility services, and another study revealed that reducing the cost; speed; convenience; safety; availability; and data confidentiality significantly impacts ridesharing customers’ satisfaction (Jahan, 2019). Chou et al. (2014) espoused that service quality attributes like cleanliness, employee behavior, comfort, safety, and on-time performance impact customer satisfaction. In a study conducted by Wong et al. (2023), it was revealed that passengers were less satisfied with the in-vehicle environment, waiting time, driver’s attitude and safety of demand responsive light public bus services. Another study interviewed elderly users’ level of satisfaction with public transportation services and revealed that seat availability (Wang and Yang, 2019), and the condition of stations are two important service factors that needs improvement (Wong et al., 2017).
Arif khan et al. (2023b) conducted a study to explore students’ travel behavior and preferences while using university transit services. Yet, the literature provides scant evidence on the most influential factors affecting student satisfaction when on-demand ridesharing services and shared autonomous vehicles are integrated with regular fixed-route transit; therefore, the primary aim of this study was to uncover the levels of their satisfaction with attributes like waiting times, availability, accessibility, speed, safety, travel times, cleanliness, ease of boarding and deboarding, and customer service. To achieve this, we explored the answers to the following research questions.
1) What is the satisfaction level of the students who use transit services?
2) What are the most significant factors that affect rider satisfaction levels?
The findings of this study will provide transportation providers with important insights into the factors that affect user satisfaction, giving them the tools that will assist them in developing policies to better serve their riders and grow their business.
2 Literature review
2.1 Ridesharing
Ridesharing customers and drivers can now be connected by a smartphone application that facilitates real-time and demand-responsive trips, thanks to recent advancements in information and communication technology (Rayle et al., 2014; Patel et al., 2022a; Patel et al., 2022b). It is a form of shared mobility that employs an online platform to connect passengers with drivers by using automatic reservations, payments, and feedback (Federal Transit Administration, 2022). On-demand, affordable, dependable, door-to-door transportation can be requested, monitored, and paid for using smartphone apps (Dias et al., 2017; Etminani-Ghasrodasthi et al., 2022). The comfort, accessibility, personalization, excellent service, and opportunity to evaluate the services through smartphone rating applications has resulted in the ridesharing economy booming globally (Arif Khan et al., 2022; Shamsudin et al., 2022). Salas et al., (2022) estimates that the global ridesharing market will grow by more than 115 percent ($185 billion) by 2026.
Transportation network companies (TNCs) that offer ride-sharing services are rapidly becoming popular, as evidenced by Uber’s phenomenal growth. It took 6 years from conception for them to reach the one billion trip milestone and only 6 months in 2016 to reach the two billion trip milestone (Dias et al., 2017). According to the Federal Highway Administration, increased traffic congestion accounts for more than 37% of commuters’ overall journey time in the US (McElroy and Taylor, 2007). Ridesharing services benefit the environment and society by reducing travel costs, travel time, traffic congestion, and air pollution (Furuhata et al., 2013; Arif Khan et al., 2021) while increasing the mobility of non-drivers, including seniors, children, persons with physical disabilities, and those without a license (Shamsudin et al., 2022). Despite promotions and the wide range of services that they offer to attract new clients and keep existing ones, however, ridesharing providers struggle to achieve and maintain a high level of consumer satisfaction (Shamsudin et al., 2022), which is a crucial determinant of transit ridership and customer loyalty (Le et al., 2020). As of 2022, Uber and Lyft, the two major ridesharing companies operating in the US, have a market share of 71% and 29%, respectively (Flynn, 2022).
A number of empirical studies suggest that ridesharing offers many advantages: reduced energy use, emissions, and traffic congestion; and less demand for parking infrastructures (Chan and Shaheen, 2012). Yu et al. (2017) evaluated the environmental impacts of ridesharing, using trip data provided by Didi in Beijing, China, and found that ridesharing amounts to an annual energy savings of 46.2 thousand tons of carbon dioxide (CO2) and 235.7 thousand tons of nitrox oxides (NOX). Similarly, Caulfield (2009) studied the environmental benefits of ridesharing in Dublin, Ireland, using 2006 census data, and found that ridesharing 5 days a week would reduce 12,674 tons of CO2 emissions; Hwang et al. (2020) estimated that travelers who have access to Uber gain a benefit of approximately 1 billion dollars in the Bay area (CA). A simulation study by Ruch et al. (2019) concluded that ridesharing reduces the number of vehicle miles traveled by 11%, with a 15% increase in travel time, in an urban setting and by 12%, with a 3% increase in travel time, in a rural setting.
2.2 Factors affecting ridesharing adoption
Past research on ridesharing focused on ride-matching algorithms for ridesharing optimization (Agatz et al., 2011; Masoud and Jayakrishnan, 2017; Gurumurthy and Kockelman, 2020); dynamic ride-sharing pricing (Agatz et al., 2012); and the advantages of ridesharing for the economy, society, transportation, and the environment (Caulfield, 2009; Chan and Shaheen, 2012; Shaheen et al., 2012; Teubner and Flath, 2015; Yu et al., 2017). The choice of travel mode is influenced by various factors like vehicle ownership and travel distance (Ding et al., 2017), travel time, cost, availability, awareness and safety (Schneider, 2013), personal attitude (Liu et al., 2017), and the built environment (Khan et al., 2014).
The following studies are among those in the literature that identify the factors affecting ridesharing adoption. Nielsen et al. (2015) used a qualitative analysis approach to identify the factors affecting ridesharing adoption in Denmark and found that cost savings and flexibility had positive impacts, while lack of availability and safety had negative impacts. Efthymiou et al. (2013) used ordered logit models to identify the factors affecting individuals 18–36 years old in Greece, and the results suggested that age, household income, and public transit usage significantly impacted their willingness to use ridesharing services. Rahman et al. (2021) used a bivariate-ordered probit model to demonstrate that sociodemographic characteristics like gender, household income, education, and smartphone use affect the adoption of ride-sourcing services in developing countries. The impacts of multiple constructs like environmental concerns, COVID-19, perceived risk, perceived usefulness, and personal innovativeness on consumers’ intention to use ridesharing services have also been studied extensively in the literature (Wang et al., 2020; Eisenberg et al., 2022; Zhang and Liu, 2022).
2.3 Customer satisfaction
Islam et al. (2014) described satisfaction as the experience of an expected outcome being fulfilled. Pasharibu et al. (2018) extensively reviewed the concept of customer satisfaction and concluded that it is the degree to which a customer feels they have received what they expected. Customer satisfaction is essential for organizations to effectively maintain relationships with their customers (Agarwal, 2008), and in the context of transportation, it is critical for ridesharing service providers to analyze customer satisfaction to improve the quality of their service (Islam et al., 2014). Maintaining high levels of customer satisfaction can benefit businesses in numerous ways and result in high rates of returning customers and positive recommendations (Cam et al., 2019). This notion is confirmed by studies that indicate that customers who are satisfied with ridesharing services are more likely to continue using them (Yang and Peterson, 2004; Hidayat et al., 2016; Othman et al., 2017). It is crucial, therefore, that ridesharing companies understand and maintain customer satisfaction and make it a central component of their marketing strategies.
Providing the best services consistently can indirectly improve the company’s brand image and consequently enhance their number of riders and standing in the market (Shamsudin et al., 2022). According to earlier studies on travel services, satisfied consumers are more likely to be loyal. Minser and Webb (2010) cited the positive influence of service quality and customer satisfaction on customer loyalty in public transportation, (Chou et al., 2014; Yilmaz and Ari, 2017), provided empirical support that passenger satisfaction with service is a positive influence on customer loyalty in the area of high speed rail service, and (Permana, 2020) determined that it positively influences customer loyalty to online transportation in Indonesia.
3 Data and methodology
3.1 Data
We used data from an online survey that was conducted at the University of Texas at Arlington (UTA) to obtain information about their experiences with the public transit services available to them. The questions were related to their travel and usage patterns of transit services and considered their demographic attributes. Questions about the following services were included in the survey.
• MavMover: A dedicated, fixed-route shuttle bus service with a set schedule that offers free rides to select destinations
• RAPID: A service funded by the Federal Transit Administration (FTA) that consists of a fleet of on-demand shared autonomous vehicles (SAVs) that provide transportation within the UTA and downtown Arlington areas
• Via: An on-demand shuttle service that offers low-cost rides ($3–$5, based on distance) within the boundaries of the city of Arlington
• Via Shopping Shuttle: An on-demand shopping shuttle service that offers UTA students free rides that are paid for by the university to select shopping destinations
3.2 Survey
To facilitate a better understanding of the riders’ experiences with transit services, a survey was designed, using the online application, QuestionPro, to collect data pertaining to their acceptance, usage, and satisfaction with the available transit services. The survey was reviewed and approved by UTA’s Institutional Review Board (IRB) and distributed electronically via a university link to all students, faculty, and staff above 18 years of age. A letter of consent requiring an electronic signature accompanied the survey, confirming the participants’ agreement that the university could use the data anonymously. The survey consisted of 36 questions that were divided into the following categories.
a. Usage patterns of transit services (frequency of use, etc.)
b. Satisfaction levels of each service
c. Reasons for low or non-use of any of the available services in the past 6 months
d. Socio-demographic and residential location attributes
The survey, which took approximately 9 minutes to complete, was available online from March to April 2022. Each section included open-ended and multiple-choice questions, some of which allowed the respondent to provide more than one answer. Approximately 1,321 respondents completed the survey, but we were not able to use all of the data. Surveys missing a lot of data were discarded, as were those that were answered in substantially more or less time than the average. The majority of the questions were designed to collect ordinal data, but those that contained nominal options were recorded as numerical variables. A sample of survey question is presented in Figure 1.
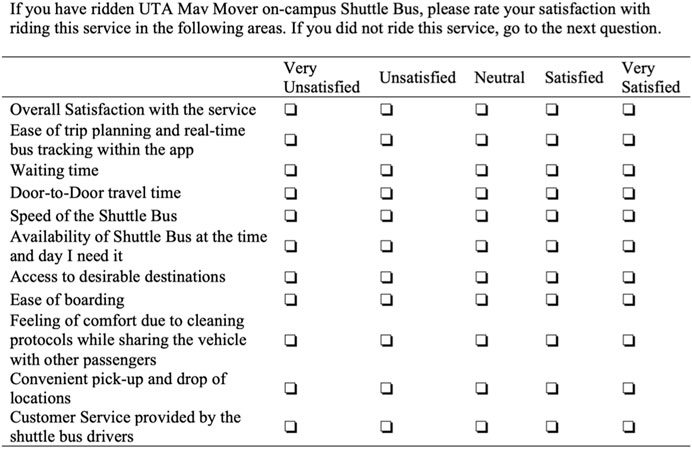
FIGURE 1. Sample of survey question.
3.3 Study area
The study area, Arlington, Texas, is a medium-sized city in the Dallas-Fort Worth (DFW) Metroplex that has a population of 397,269, according to the 2020 American Community Survey data. The racial distribution is 56.1% White, 29.2% Hispanic, 22.9% Black or African American, and 6.6% Asian. The city is very car-dependent, with 38.5% of households having three or more vehicles, 41% having two vehicles, and 18.7% of households having one vehicle; only 1.8% of the households do not have a car. Commuting patterns show that 72% of workers 16 years or older drive alone to work; 8.9% carpool. Arlington is one of the largest cities in the US without a traditional mass-transit public transportation service (Harrington, 2018), so the City provides on-demand ridesharing through several services. Figure 2 shows the geographical context of the study area and transit services, including the Via and RAPID service areas. The MavMover service is not shown on the map, as it provides rides to UTA students and staff to several destinations within the city’s boundaries, using different bus lines/routes.
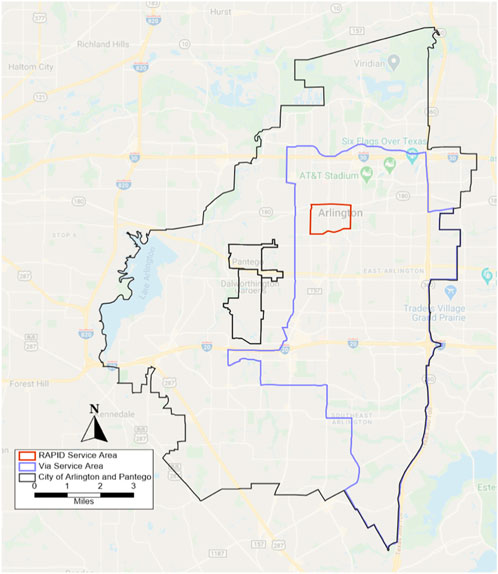
FIGURE 2. Via and RAPID service areas and city of Arlington boundaries.
3.4 Method
Two sets of information were utilized to understand respondents’ satisfaction levels for the four available transportation services. First, we calculated the share of respondents who were very unsatisfied, unsatisfied, neutral, satisfied, or very satisfied, using frequency distributions based upon their survey responses. Second, we investigated the relationship of the satisfaction levels with the service and user attributes, using an ordered logistic regression approach.
An ordered logistic regression is typically used when there are more than two ordinal responses are possible for the outcome variable. The model is routinely applied in various fields including sociology, political science, economics, and psychology (Long and Freese, 2014). Ordered logistic regression assumes that the relationship between each pair of outcome groups is the same, which is referred to as parallel regression assumption. In the model, the level of satisfaction is used as a dependent variable, while the satisfaction levels of various service attributes such as wait times, availability, accessibility, cleanliness, customer service, ease of boarding, picking up and dropping off are used as independent variables. The predicted probability for the ordered logit model can found in the study Long and Freese (2014). F is the cumulative distribution function for ε = var (ε) = π2/3; where: y = response variable; x = vector of independent variables varies between the chosen response variables.; Β = vector of regression coefficients; Ε = Error term
4 Data analysis and results
The results of the analysis were divided into two parts for each service. The first part shows the distribution of respondents based on their overall satisfaction’s levels; the second part shows the individual factors that influence the satisfaction level and separate ordered logistic regression models were run for each service assuming that the service attributes significantly affect the customer’s overall satisfaction levels with each service. Ordered logit model assumes that the relationship between each pair of outcome groups is the same. This is called the parallel line assumption. The test was performed to check the assumption of proportional odds and the results of are summarized in Table 1. All four models pass the test of parallel lines since no test static is significant in Table 1, there is no evidence that the proportional odds assumption has been violated.
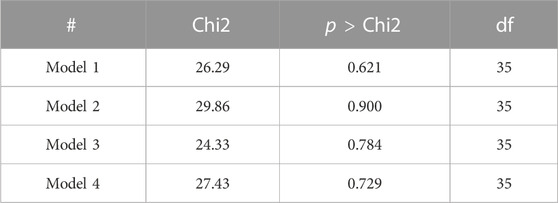
TABLE 1. Test of the parallel lines assumption.
4.1 MavMover
4.1.1 Satisfaction levels based on service components of MavMover
Of the 593 respondents who responded about their satisfaction levels with MavMover were overall satisfied with the services. As presented in the Table 2, more than 73% of respondents were either satisfied or very satisfied with the services. Among other service characteristics, respondents were very satisfied with cleanliness (37.88%, very satisfied) and customer service (41.15% very satisfied). A few service attributes rated relatively lower than others such as wait time was the only attribute that scored less than 50% in satisfaction level (satisfied + very satisfied). All remaining attributes scored more than 50% on the satisfaction scale. These findings indicate that wait times are the biggest concern of the users of MavMover and improving the waiting times could significantly improve user satisfaction levels.
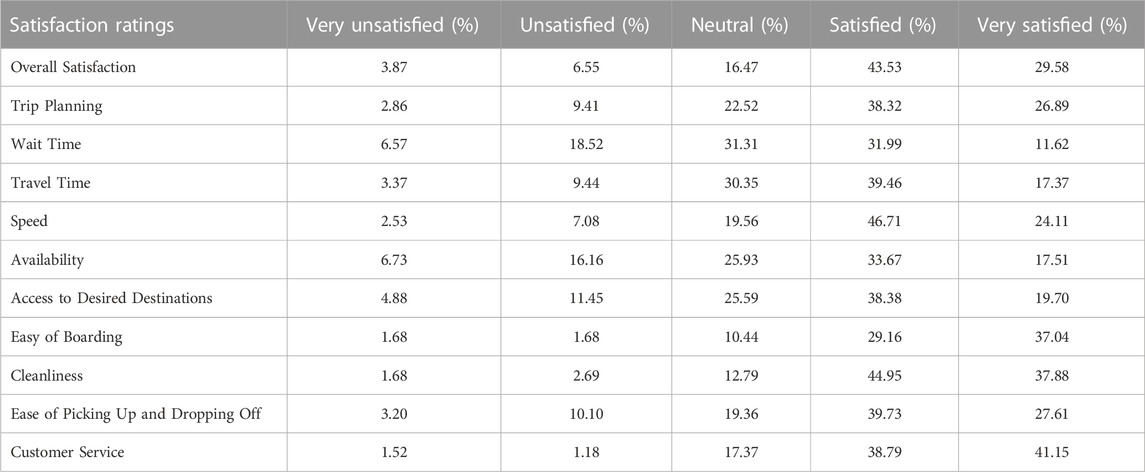
TABLE 2. Distribution of satisfaction levels with MavMover service (n = 593).
4.1.2 Factors affecting satisfaction levels with the MavMover service
The results from the OLR models for the MavMover service are given in Table 3 and indicate that overall, users are satisfied with the services provided. As presented in Table 3, 593 observations were used in the analysis. The likelihood ratio chi-square of 478 with a p-value of 0.0000 tells that the model is statistically significant, as compared to the null model with no predictors. The pseudo-R-squared of 0.305 is also given. The coefficients of most of the service attributes are positively associated with overall satisfaction levels. Destination access is the only attribute that has a negative coefficient, indicating that there is room for improvement in this area.
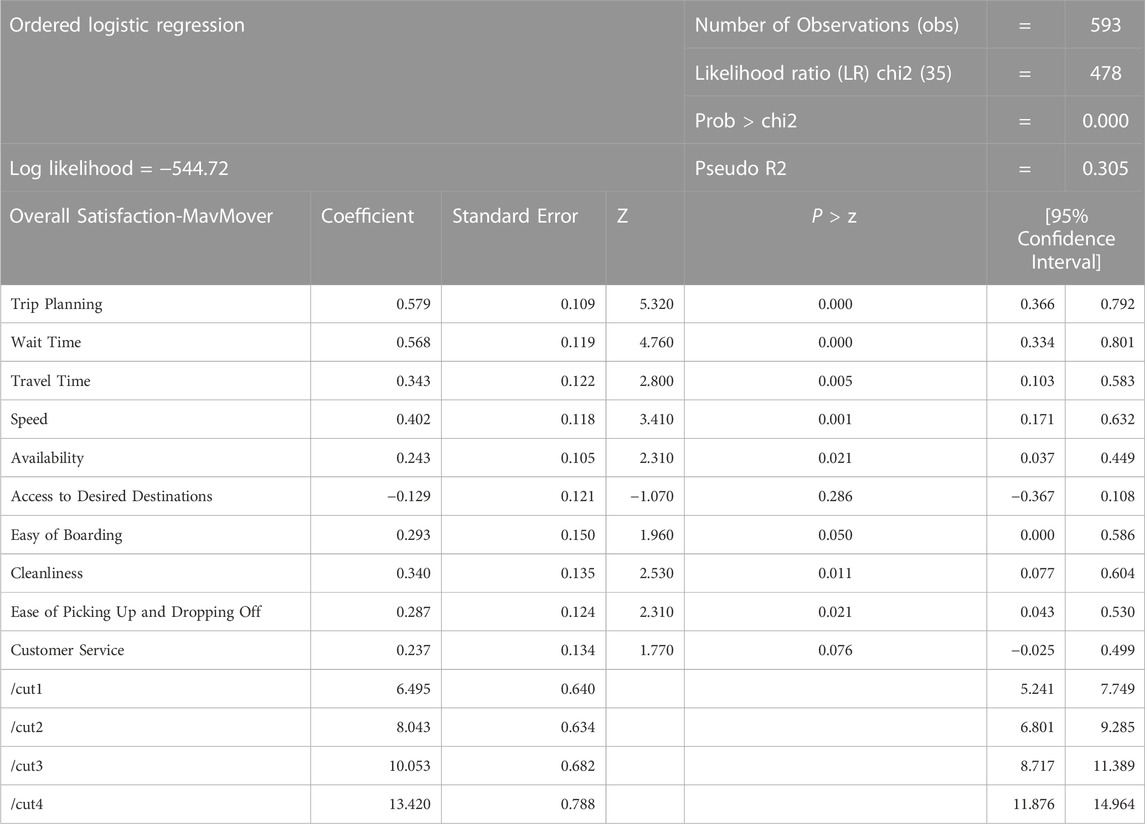
TABLE 3. MavMover service attributes and user satisfaction levels.
4.2 Via shopping shuttle
4.2.1 Satisfaction levels based on service components of the Via shopping Shuttle
Table 4 shows the distribution of respondents based on their satisfaction levels with the Via shopping shuttle. Of the 516 respondents who responded about their satisfaction levels with Via Shopping Shuttle, the majority of them were satisfied with the service as more than 75% of respondents were either satisfied or very satisfied with the service while only 3.88% of respondents said that they were very unsatisfied with the Via service. User responses for other attributes also showed similar trends to MavMover. They were overall satisfied with all other attributed (more than 50% score in the satisfied and very satisfied category) except the wait time category where around 45% of respondents were satisfied and more than 30% were among the unsatisfied user groups. This result again emphasizes the importance and need of improving wait times as users tend to prefer services with the least waiting time for a ride.
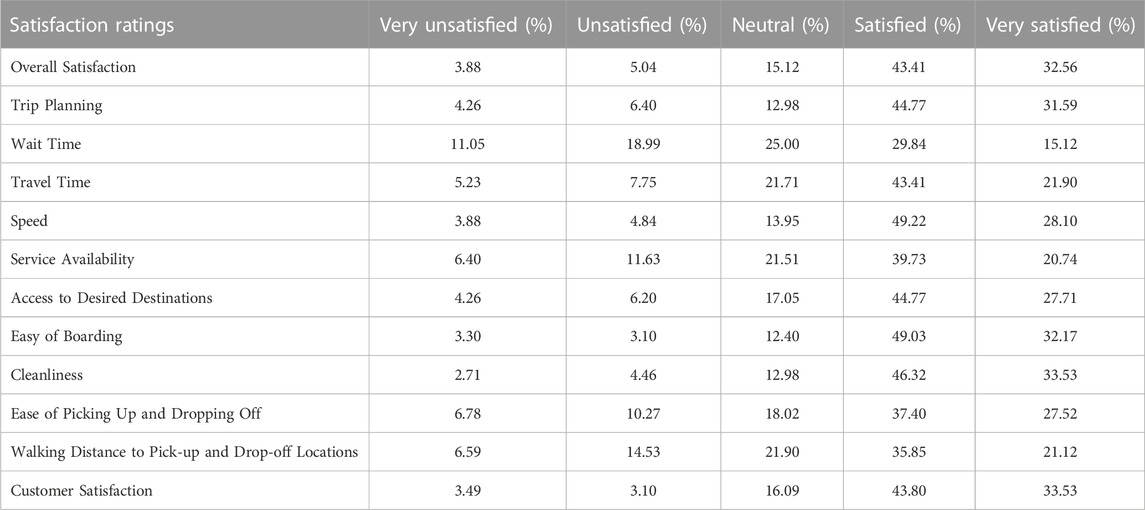
TABLE 4. Distribution of satisfaction levels for via shopping shuttle (n = 516).
4.2.2 Factors affecting satisfaction levels for Via Shopping Shuttle
The results from the OLR model for satisfaction levels of the Via Shopping Shuttle are presented in Table 5. Overall, the users seem to be satisfied with its service characteristics, as indicated by the positive coefficient values of most of the independent variables; however, they do not indicate satisfaction either with availability or the ease of boarding and their p-values are also not significant. The lack of satisfaction with availability could be associated with the limited nature of the service, as it only provides access to select shopping destinations.
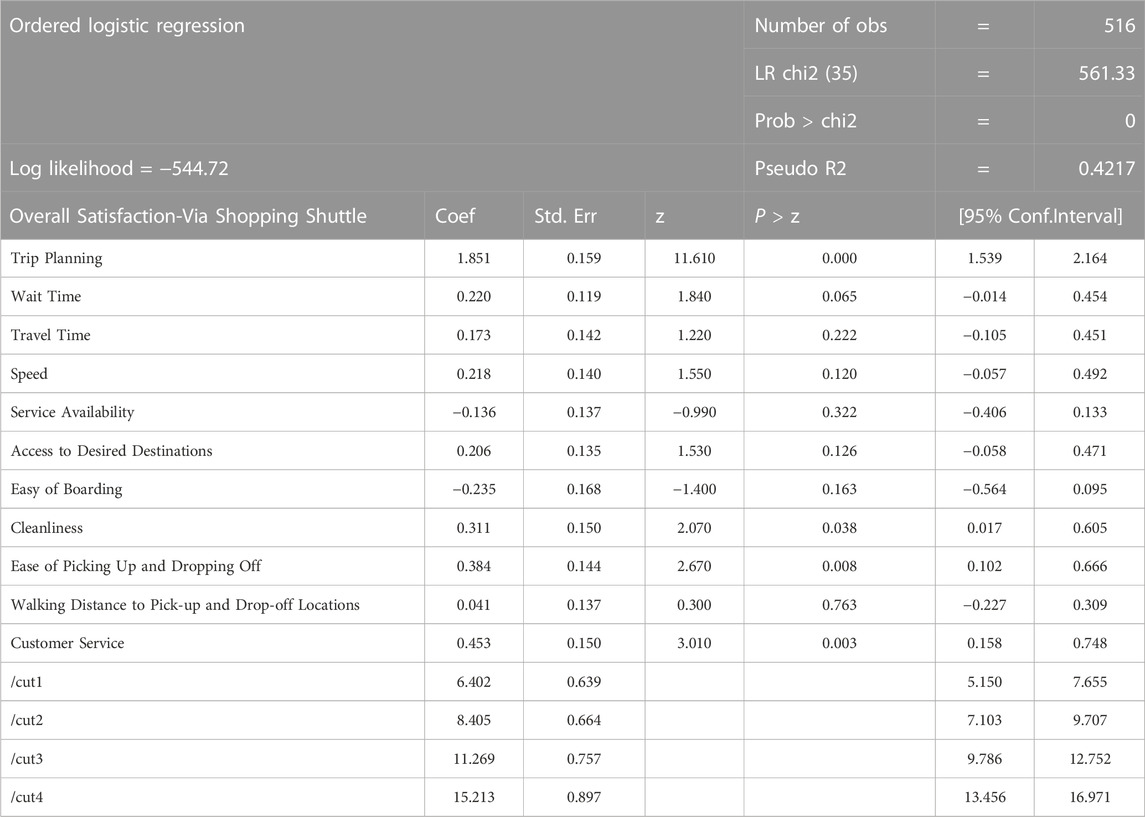
TABLE 5. Attributes and user satisfaction levels with via shopping shuttle service.
4.3 RAPID
4.3.1 Satisfaction levels based on service components of RAPID
Table 6 shows the distribution of respondents based on their satisfaction levels with the RAPID service. Of the 369 respondents who responded about their satisfaction levels with RAPID service, the majority of them were satisfied with the service as more than 75% of respondents were either satisfied or very satisfied with the service while only 3.24% of respondents said that they were very unsatisfied with the RAPID service. They were overall satisfied with all other attributed (more than 50% score in the satisfied and very satisfied category).
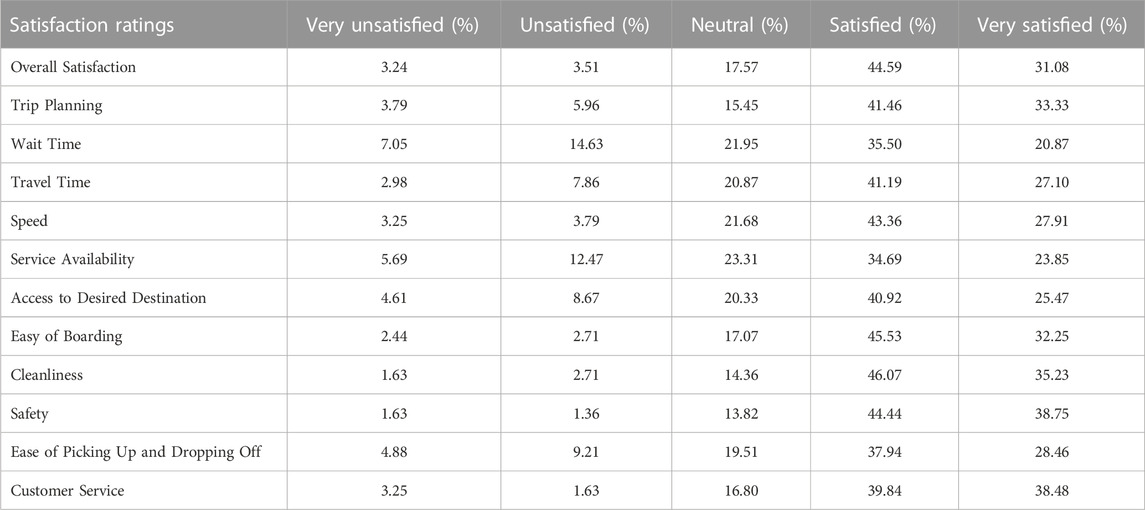
TABLE 6. Distribution of satisfaction levels for RAPID (n = 369).
4.3.2 Factors affecting satisfaction levels for RAPID service
The results of the OLR model for satisfaction levels of RAPID shown in Table 7 indicate that overall, the users are very satisfied with the service characteristics, as all the attributes except availability have positive coefficients. The negative responses on availability may be due to its small service area (lack of service to the entire city).
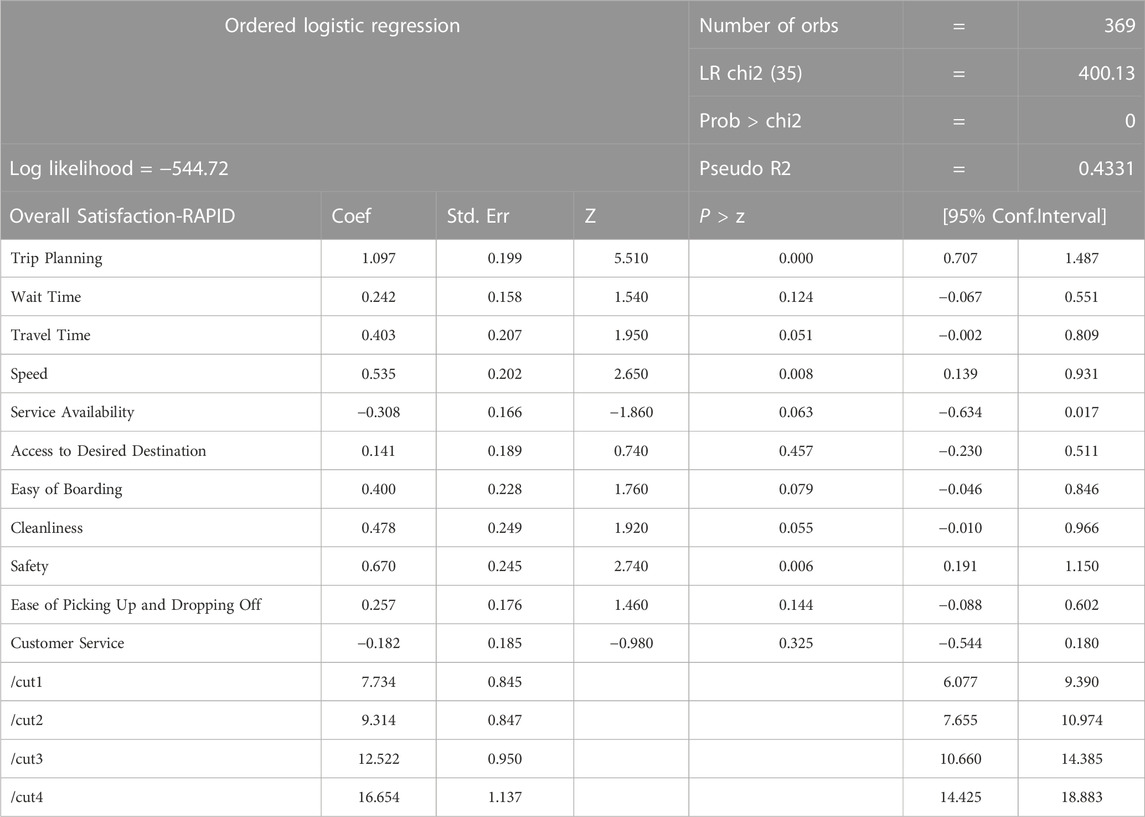
TABLE 7. RAPID attributes and user satisfaction levels.
4.4 Via Shuttle
4.4.1 Satisfaction levels based on service components of Via shuttle
As Table 8 shows, the majority of those who use the Via shuttle service are happy with it. Of the 400 Via Shuttle respondents who answered the question pertaining to their overall satisfaction levels with service offered by Via Shuttle, 26.75% of respondents indicated that they were very satisfied with the services while 46.5% indicated that they were only satisfied and 17.25% reported a neutral opinion. 5.25% of respondents were not satisfied while 4.25% were not very satisfied with the services. Similar to RAPID service Via service also scored more than 50% (satisfied + very satisfied) for all service attributes. For satisfaction levels easy of boarding, cleanliness and customer services score relatively higher than other attributes with wait times being the lowest scorers for satisfaction levels. This indicate that while users were relatively satisfied with Via wait times, but still this ranked the least as compared to other service attributes.
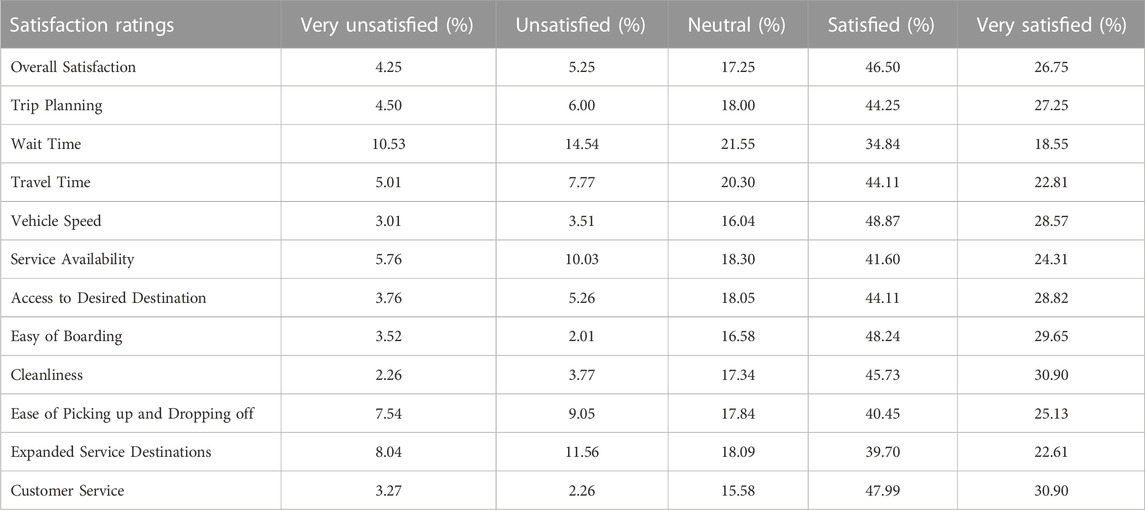
TABLE 8. Distribution of overall satisfaction levels for via shuttle (n = 400).
4.4.2 Factors affecting satisfaction levels for Via service
The OLR model for the Via service indicates that the users are satisfied with all attributes, unlike any other services included in this study (See Table 9). None of the service attributes had a negative coefficient for any service attribute.
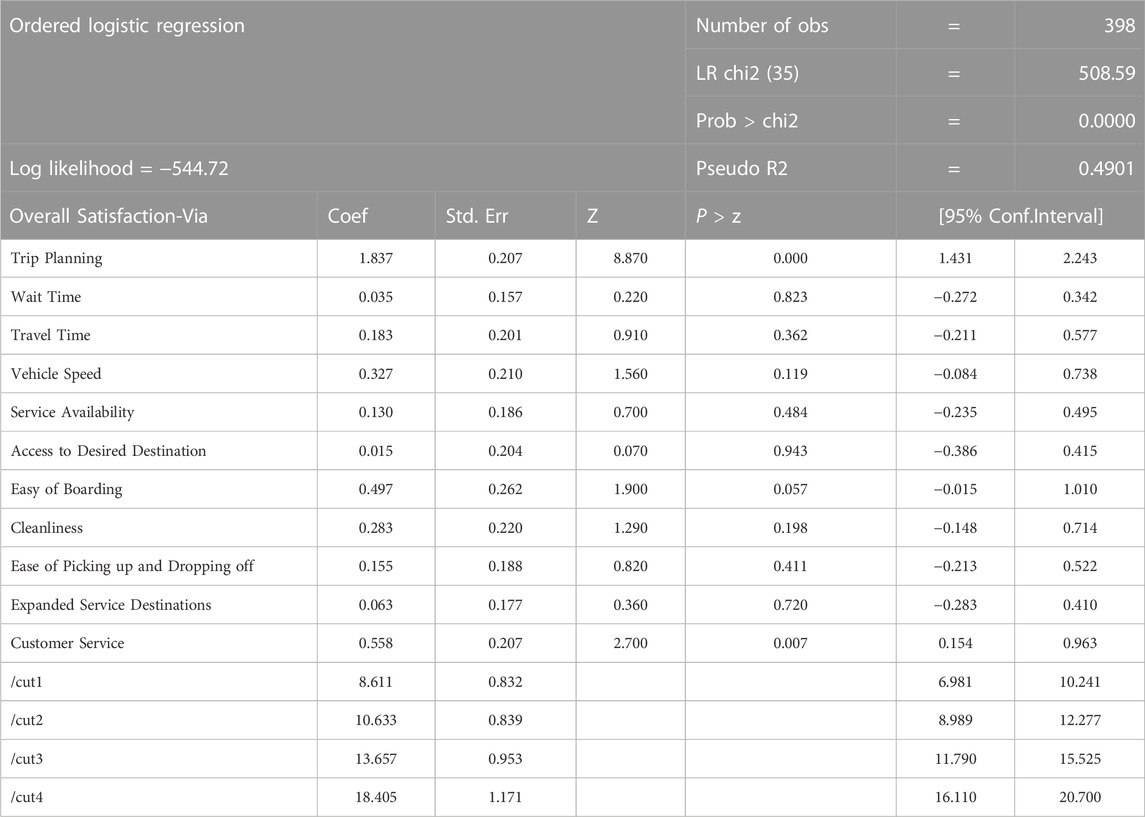
TABLE 9. Via shuttle service attributes and user satisfaction levels.
5 Conclusion
This study evaluates the satisfaction levels of a university community that uses public transit and explores the factors that influence them. The descriptive statistics and ordered logistic regression models show that overall, users are satisfied with the services but feel that certain aspects could be improved. For example, on-demand shared autonomous vehicles users are not entirely satisfied with the availability of the service, as it only serves a very small area, and users of fix-route shuttle bus service are dissatisfied with the destination accessibility of the service, e.g., users are not able to access their desired destinations when they need to.
The comparison among the services shows that users of fixed-route shuttle bus service and on-demand Shopping shuttle service were not very satisfied with the wait times as “wait times” scored the least among all service attributes for these services. However, respondents were relatively satisfied with the wait times of on-demand shuttle service and on-demand shared autonomous vehicle service. The shared autonomous vehicle service has a smaller service area and on-demand shuttle service has a comparatively bigger fleet that helps these services keep wait times at a level that users were not dissatisfied with their wait times.
Therefore, transit providers should improve service performance to increase public transit ridership. Factors such as waiting time, travel time, service area, accessibility to service, and related information are among factors that can be improved through service performance. It is suggested that ridesharing service providers should try to enhance customer satisfaction by expanding the size of their vehicle fleet to meet the demand and reduce the wait times. Wait times, being one of the most important factors in users’ decision-making process need further attention, and fixed-route shuttle bus service and on-demand shopping shuttle could reduce their wait times to improve users’ satisfaction levels.
Accordingly, in addition to improving service performance, service providers should employ different policies and strategies to encourage more people to use public transit. For example, policies such as providing free-fare rides for everyone or eligible people and discounted/free on-demand ridesharing services for first/last mile of transit users are strategies that transit providers can use to increase the service ridership.
In order to attract more riders and make these services sustainable, it is important to ensure that as many members of the university community as possible are aware of the transit options available to them by using all available media channels, to include social media, local print and electronic media and student focused newspapers.
The findings of this study can be used to improve the quality and efficiency of transit services afforded to university communities. Service providers could use the findings from satisfaction levels to alter their existing fleet locations or headways in terms of scheduled services to reduce wait times and hence improve service quality.
Data availability statement
The datasets presented in this article are not readily available because The raw/processed data required to reproduce the above findings cannot be shared at this time due to legal/ethical reasons. Requests to access the datasets should be directed to sharareh.kermanshachi@uta.edu.
Ethics statement
The studies involving human participants were reviewed and approved by The Institutional Review Board at the University of Texas at Arlington. The patients/participants provided their written informed consent to participate in this study.
Author contributions
The authors confirm contribution to the paper as follows: study conception and design: MK, RKP SK, and JMR; data collection: MAK, RKP, SK, JMR, GH, and AF; analysis and interpretation of results: MAK, RKP, and AP; draft manuscript preparation: MAK, RKP writing—review and editing: MAK, RKP, AP, SK, JMR, GH and AF. All authors reviewed the results and approved the final version of the manuscript.
Conflict of interest
The authors declare that the research was conducted in the absence of any commercial or financial relationships that could be construed as a potential conflict of interest.
Publisher’s note
All claims expressed in this article are solely those of the authors and do not necessarily represent those of their affiliated organizations, or those of the publisher, the editors and the reviewers. Any product that may be evaluated in this article, or claim that may be made by its manufacturer, is not guaranteed or endorsed by the publisher.
References
Agarwal, R. (2008). Public transportation and customer satisfaction: The case of Indian railways. Glob. Bus. Rev. 9 (2), 257–272. doi:10.1177/097215090800900206
Agatz, N., Erera, A. L., Savelsbergh, M. W., and Wang, X. (2011). Dynamic ride-sharing: A simulation study in metro atlanta. Procedia-Soc. Behav. Sci. 17, 532–550. doi:10.1016/j.sbspro.2011.04.530
Agatz, N., Erera, A., Savelsbergh, M., and Wang, X. (2012). Optimization for dynamic ride-sharing: A review. Eur. J. Operational Res. 223 (2), 295–303. doi:10.1016/j.ejor.2012.05.028
Arif Khan, M., Shahmoradi, A., Etminani-Ghasrodashti, R., Kermanshachi, S., and Michael Rosenberger, J. (2021). “A geographically weighted regression approach to modeling the determinants of on-demand ride services for elderly and disabled,” in International Conference on Transportation and Development 2021.
Arif Khan, M., Etminani-Ghasrodashti, R., Kermanshachi, S., Rosenberger, J. M., Foss, A., and Hladik, G. (2022). “Demand-responsive transit (DRT) services vs. Fixed route transit: An exploratory study of university students,” in International Conference on Transportation and Development 2022.
Arif Khan, M., Etminani-Ghasrodashti, R., Kermanshachi, S., Rosenberger, J. M., and Foss, A. (2023a). A user and ridership evaluation of shared autonomous vehicles. J. Urban Plan. Dev. 149 (1), 05022048. doi:10.1061/jupddm.upeng-3945
Arif Khan, M., Eminani, R., Kermanshachi, s., Rosenberger, J., Hladik, G., and Pan, Q. (2023b). “What factors shape transit ridership patterns in a university community?,” in Transportation Research Board 102 Annual Meeting, 23–00355.
Cam, L. N. T., Anh, T. T., Moslehpour, M., and Thanh, X. D. T. (2019). “Exploring the impact of traditional and electronic word of mouth on travel intention,” in Proceedings of the 2019 5th International Conference on E-Business and Applications, 83–87.
Caulfield, B. (2009). Estimating the environmental benefits of ride-sharing: A case study of Dublin. Transp. Res. Part D Transp. Environ. 14 (7), 527–531. doi:10.1016/j.trd.2009.07.008
Chan, N. D., and Shaheen, S. A. (2012). Ridesharing in north America: Past, present, and future. Transp. Rev. 32 (1), 93–112. doi:10.1080/01441647.2011.621557
Chou, P.-F., Lu, C.-S., and Chang, Y.-H. (2014). Effects of service quality and customer satisfaction on customer loyalty in high-speed rail services in Taiwan. Transp. A Transp. Sci. 10 (10), 917–945. doi:10.1080/23249935.2014.915247
Dias, F. F., Lavieri, P. S., Garikapati, V. M., Astroza, S., Pendyala, R. M., and Bhat, C. R. (2017). A behavioral choice model of the use of car-sharing and ride-sourcing services. Transportation 44 (6), 1307–1323. doi:10.1007/s11116-017-9797-8
Ding, C., Wang, D., Liu, C., Zhang, Y., and Yang, J. (2017). Exploring the influence of built environment on travel mode choice considering the mediating effects of car ownership and travel distance. Transp. Res. Part A Policy Pract. 100, 65–80. doi:10.1016/j.tra.2017.04.008
Efthymiou, D., Antoniou, C., and Waddell, P. (2013). Factors affecting the adoption of vehicle sharing systems by young drivers. Transp. policy 29, 64–73. doi:10.1016/j.tranpol.2013.04.009
Eisenberg, Y., Hofstra, A., Tilahun, N., and Shanley, J. (2022). Rideshare use among people with disabilities: Patterns and predictors based on a large nationally representative survey. Travel Behav. Soc. 29, 246–256. doi:10.1016/j.tbs.2022.07.001
Etminani-Ghasrodashti, R., Ketankumar Patel, R., Kermanshachi, S., Michael Rosenberger, J., Weinreich, D., and Foss, A. (2021a). Integration of shared autonomous vehicles (SAVs) into existing transportation services: A focus group study. Transp. Res. Interdiscip. Perspect. 12, 100481. doi:10.1016/j.trip.2021.100481
Etminani-Ghasrodashti, R., Ketankumar Patel, R., Kermanshachi, S., Michael Rosenberger, J., and Weinreich, D. (2021b). “Exploring concerns and preferences towards using autonomous vehicles as a public transportation option: Perspectives from a public focus group study,” in International Conference on Transportation and Development, 344–354.
Etminani-Ghasrodashti, R., Hladik, G., Kermanshachi, S., Rosenberger, J. M., Arif Khan, M., and Foss, A. (2022). Exploring shared travel behavior of University students. Transp. Plan. Technol. 46, 1–23. doi:10.1080/03081060.2022.2160718
Federal Transit Administration (2022). Shared mobility definitions. Available at: https://www.transit.dot.gov/regulations-and-guidance/shared-mobility-definitions (Accessed on Oct 7, 2022).
Flynn, J. (2022). 23 riveting ridesharing industry statistics [2022]: Facts about ridesharing in the U.S. Available at: https://www.zippia.com/advice/ridesharing-industry-statistics/.
Fu, X., and Juan, Z. (2017). Understanding public transit use behavior: Integration of the theory of planned behavior and the customer satisfaction theory. Transportation 44 (5), 1021–1042. doi:10.1007/s11116-016-9692-8
Furuhata, M., Dessouky, M., Ordóñez, F., Brunet, M.-E., Wang, X., and Koenig, S. (2013). Ridesharing: The state-of-the-art and future directions. Transp. Res. Part B Methodol. 57, 28–46. doi:10.1016/j.trb.2013.08.012
Ginavičienė, J., and Sprogytė, I. (2020). Factors of service quality affecting students, as customers, satisfaction of ridesharing services in vilnius, Lithuania. Soc. Integr. Educ. Proc. Int. Sci. Conf. 6, 615–624. doi:10.17770/sie2020vol6.4894
Gurumurthy, K. M., and Kockelman, K. M. (2020). Modeling Americans’ autonomous vehicle preferences: A focus on dynamic ride-sharing, privacy and long-distance mode choices. Technol. Forecast. Soc. Change 150, 119792. doi:10.1016/j.techfore.2019.119792
Harrington, J. (2022). Travelers take note: these large cities in America offer no publictransportation. USA TODAY. https://www.usatoday.com/story/travel/experience/america/fifty-states/2018/12/04/americas-largest-cities-with-no-public-transportation/38628503/
Hidayat, A., Saifullah, M., and Ishak, A. (2016). Determinants of satisfaction, trust, and loyalty of Indonesian e-commerce customer. Int. J. Econ. Manag. 10 (1), 151–166.
Hwang, H., Winston, C., and Jia, Y. (2020). Measuring the benefits of ridesharing services to urban travelers. Hutchins Center Working Papers.
Islam, R., Chowdhury, M. S., Sarker, M. S., and Ahmed, S. (2014). Measuring customer's satisfaction on Bus Transportation. American Journal of Economics and Business Administration, 6 (1), 34–41. doi:10.3844/ajebasp.2014.34.41
Jahan, M. (2019). Factors affecting customer satisfaction of the ride-sharing industry in Bangladesh. Business Ethics and Leadership, 3 (4), 74–80. doi:10.21272/bel.3(4).74-80.2019
Khan, M., Kockelman, K. M., and Xiong, X. (2014). Models for anticipating non-motorized travel choices, and the role of the built environment. Transp. Policy 35, 117–126. doi:10.1016/j.tranpol.2014.05.008
Le, H. T., Carrel, A. L., and Li, M. (2020). How much dissatisfaction is too much for transit? Linking transit user satisfaction and loyalty using panel data. Travel Behav. Soc. 20, 144–154. doi:10.1016/j.tbs.2020.03.007
Litman, T. (2008). Valuing transit service quality improvements. J. Public Transp. 11 (2), 43–63. doi:10.5038/2375-0901.11.2.3
Liu, Y., Sheng, H., Mundorf, N., Redding, C., and Ye, Y. (2017). Integrating norm activation model and theory of planned behavior to understand sustainable transport behavior: Evidence from China. Int. J. Environ. Res. Public health 14 (12), 1593. doi:10.3390/ijerph14121593
Long, J. S., and Freese, J. (2014). Regression models for categorical dependent variables using stata. r Third Edition. Stata press.
Masoud, N., and Jayakrishnan, R. (2017). A real-time algorithm to solve the peer-to-peer ride-matching problem in a flexible ridesharing system. Transp. Res. Part B Methodol. 106, 218–236. doi:10.1016/j.trb.2017.10.006
McElroy, R., and Taylor, R. (2007). The congestion problem. U. S. Department of Transportation of Federal Highway Administration.
Minser, J., and Webb, V. (2010). Quantifying the benefits: Application of customer loyalty modeling in public transportation context. Transp. Res. Rec. 2144 (1), 111–120. doi:10.3141/2144-13
Nielsen, J. R., Hovmøller, H., Blyth, P.-L., and Sovacool, B. K. (2015). Of “white crows” and “cash savers:” A qualitative study of travel behavior and perceptions of ridesharing in Denmark. Transp. Res. Part A Policy Pract. 78, 113–123. doi:10.1016/j.tra.2015.04.033
Othman, M., Kamarohim, N., and Nizam, F. M. (2017). Brand credibility, perceived quality and perceived value: A study of customer satisfaction. Int. J. Econ. Manag. 11.
Pasharibu, Y., Paramita, E. L., and Febrianto, S. (2018). Price, service quality and trust on online transportation towards customer satisfaction. J. Ekon. Dan. Bisnis 21 (2), 241–266. doi:10.24914/jeb.v21i2.1965
Patel, R. K., Etminani-Ghasrodashti, R., Kermanshachi, S., Rosenberger, J. M., and Weinreich, D. (2021). Exploring preferences towards integrating the autonomous vehicles with the current microtransit services: A disability focus group study. Int. Conf. Transp. Dev. 2021, 355–366. doi:10.1061/9780784483534.031
Patel, R. K., Etminani-Ghasrodashti, R., Kermanshachi, S., Rosenberger, J. M., and Foss, A. (2022a). Exploring willingness to use shared autonomous vehicles. Int. J. Transp. Sci. Technol. doi:10.1016/j.ijtst.2022.06.008
Patel, R. K., Etminani-Ghasrodashti, R., Kermanshachi, S., Rosenberger, J. M., and Foss, A. (2022b). Mobility-on-demand (mod) projects: A study of the best practices adopted in United States. Transp. Res. Interdiscip. Perspect. 14, 100601. doi:10.1016/j.trip.2022.100601
Permana, A. H. (2020). Price and customer satisfaction on loyalty: An empirical study of online transportation in Indonesia. Int. J. Innov. Sci. Res. Technol. 5 (3), 1275–1280.
Quan, N. H., Hang, B. D., Huy, L. Q., Nguyet, D. T., Linh, T. D., and Yen, N. H. (2022). Applying content analysis method to evaluate customer satisfaction with ride-sharing services: Evidence of enterprises grab and be in vietnam. Hue Univ. J. Sci. Econ. Dev. 131 (5B), 23–41.
Rahman, M. H., Sadeek, S. N., Ahmed, A., Rifaat, S. M., and Abrar, M. (2021). Effect of socio-economic and demographic factors on ride-sourcing services in Dhaka City, Bangladesh. Transp. Res. Interdiscip. Perspect. 12, 100492. doi:10.1016/j.trip.2021.100492
Rayle, L., Shaheen, S., Chan, N., Dai, D., and Cervero, R. (2014). App-based, on-demand ride services: Comparing taxi and ridesourcing trips and user characteristics in san francisco university of California transportation center (uctc)'. Berkeley, United States: University of California.
Ruch, C., Lu, C., Sieber, L., and Frazzoli, E. (2019). Quantifying the benefits of ride sharing. ETH Zurich doi:10.3929/ethz-b-000367142
Salas, J., Patterson, G., and de Barros Vidal, F. (2022). A Systematic mapping of artificial intelligence solutions for sustainability challenges in Latin America and the Caribbean. IEEE Latin America Transactions 20 (11), 2312–2329. doi:10.1109/TLA.2022.9904756
Schneider, R. J. (2013). Theory of routine mode choice decisions: An operational framework to increase sustainable transportation. Transp. Policy 25, 128–137. doi:10.1016/j.tranpol.2012.10.007
Shaheen, S. A., Mallery, M. A., and Kingsley, K. J. (2012). Personal vehicle sharing services in North America. Res. Transp. Bus. Manag. 3, 71–81.doi:10.1016/j.rtbm.2012.04.005
Shamsudin, M. F., Abu Bakar, A. R., and Hashim, F. (2022). “Understanding passengers’ satisfaction and loyalty towards ridesharing services,” in Global business and organizational excellence.
Taylor, B. D., and Fink, C. N. Y. (2003). The factors influencing transit ridership: A review and analysis of the ridership literature. Available at: https://escholarship.org/uc/item/3xk9j8m2.
Teubner, T., and Flath, C. M. (2015). The economics of multi-hop ride sharing. Bus. Inf. Syst. Eng. 57 (5), 311–324. doi:10.1007/s12599-015-0396-y
Tilahun, N., Thakuriah, P., Vonu), , Li, M., and Keita, Y. (2016). Transit use and the work commute: Analyzing the role of last mile issues. J. Transp. Geogr. 54, 359–368. doi:10.1016/j.jtrangeo.2016.06.021
Tyrinopoulos, Y., and Antoniou, C. (2020). “Review of factors affecting transportation systems adoption and satisfaction,” in Demand for emerging transportation systems (Elsevier), 11–36.
Wang, H., and Yang, H. (2019). Ridesourcing systems: A framework and review. Transp. Res. Part B Methodol. 129, 122–155. doi:10.1016/j.trb.2019.07.009
Wang, Y., Wang, S., Wang, J., Wei, J., and Wang, C. (2020). An empirical study of consumers’ intention to use ride-sharing services: Using an extended technology acceptance model. Transportation 47 (1), 397–415. doi:10.1007/s11116-018-9893-4
Watkins, K., Berrebi, S., Diffee, C., Kiriazes, B., and Ederer, D. (2019). “Analysis of recent public transit ridership trends,— in Transit cooperative research program (TCRP), research report 209 (Washington, DC: The National Academies Press).
Wong, R. C. P., Szeto, W. Y., Yang, L., Li, Y. C., and Wong, S. C. (2017). Elderly users’ level of satisfaction with public transport services in a high-density and transit-oriented city. J. Transp. Health 7, 209–217. doi:10.1016/j.jth.2017.10.004
Wong, R. C. P., Yang, L., and Szeto, W. Y. (2023). Comparing passengers’ satisfaction with fixed-route and demand-responsive transport services: Empirical evidence from public light bus services in Hong Kong. Travel Behav. Soc. 32, 100583. doi:10.1016/j.tbs.2023.100583
Yang, Z., and Peterson, R. T. (2004). Customer perceived value, satisfaction, and loyalty: The role of switching costs. Psychol. Mark. 21 (10), 799–822. doi:10.1002/mar.20030
Yilmaz, V., and Ari, E. (2017). The effects of service quality, image, and customer satisfaction on customer complaints and loyalty in high-speed rail service in Turkey: A proposal of the structural equation model. Transp. A Transp. Sci. 13 (1), 67–90. doi:10.1080/23249935.2016.1209255
Yu, B., Ma, Y., Xue, M., Tang, B., Wang, B., Yan, J., et al. (2017). Environmental benefits from ridesharing: A case of beijing. Appl. energy 191, 141–152. doi:10.1016/j.apenergy.2017.01.052
Keywords: consumer satisfaction, transit services, ridesharing, ridesharing adoption, loyalty, transit usage
Citation: Arif Khan M, Patel RK, Pamidimukkala A, Kermanshachi S, Rosenberger JM, Hladik G and Foss A (2023) Factors that determine a university community’s satisfaction levels with public transit services. Front. Built Environ. 9:1125149. doi: 10.3389/fbuil.2023.1125149
Received: 15 December 2022; Accepted: 18 April 2023;
Published: 04 May 2023.
Edited by:
Linchuan Yang, Southwest Jiaotong University, ChinaReviewed by:
Long Truong, La Trobe University, AustraliaSakdirat Kaewunruen, University of Birmingham, United Kingdom
Yang Chen, Southwest Jiaotong University, China
Copyright © 2023 Arif Khan, Patel, Pamidimukkala, Kermanshachi, Rosenberger, Hladik and Foss. This is an open-access article distributed under the terms of the Creative Commons Attribution License (CC BY). The use, distribution or reproduction in other forums is permitted, provided the original author(s) and the copyright owner(s) are credited and that the original publication in this journal is cited, in accordance with accepted academic practice. No use, distribution or reproduction is permitted which does not comply with these terms.
*Correspondence: Sharareh Kermanshachi, sharareh.kermanshachi@uta.edu