 Sisay Fikadu Jaleta
- 1Department of Mathematics, Debre Berhan University, Debre Berhan, Ethiopia
- 2Department of Mathematics, Jimma University, Jimma, Ethiopia
Malaria, an infectious disease transmitted by mosquitoes and caused by the Plasmodium parasite, poses a significant global public health challenge, especially in areas lacking modern medical infrastructure. Traditional medicine often serves as either a primary or complementary treatment avenue. This study introduces a novel deterministic model that considers the impact of treatment seeking-behaviors on malaria transmission dynamics. Expanding upon the existing model, we incorporate distinct groups: individuals seeking treatment at health facilities and those self-treating with traditional remedies, which lack clinical validation. The study employs mathematical techniques for a comprehensive analysis of the model, including positivity, boundedness, existence and uniqueness, equilibrium, reproduction number, sensitivity, optimal control, and numerical simulations performed using MATLAB and the fourth-order Runge-Kutta method. Furthermore, we explore three time-dependent optimal control variables: antimalarial drug treatment, personal protective measures like ITNs, and promoting awareness to discourage inappropriate traditional medicine usage, all aimed at reducing disease transmission. Sensitivity analysis helps identify key parameters affecting malaria dynamics. Notably, increased utilization of health facilities for treatment significantly reduces the basic reproduction number, highlighting the importance of effective healthcare interventions. Numerical simulations underscore the vital role of treating infected individuals at health facilities in malaria eradication efforts. Optimal control analysis suggests that a combination of the three control strategies is most effective in combating malaria. This provides insights for public health policies to address the risk factors of using clinically not validated traditional medicine in malaria-endemic areas.
1 Introduction
Malaria remains a significant global public health challenge, particularly in endemic regions [1]. According to the World Malaria Report (2023), the estimated number of malaria cases worldwide reached 249 million in 2022, marking an increase of 16 million from the pre-pandemic level of 233 million in 2019 [2]. Malaria-related mortality has also remained high, with 608,000 deaths reported in 2022. The disease burden is disproportionately concentrated in the WHO African Region, accounting for approximately 94% of global cases and 96% of malaria deaths. Malaria is caused by Plasmodium parasites, which are transmitted to humans through the bites of infected female Anopheles mosquitoes [2].1 Of the five Plasmodium species known to infect humans—Plasmodium falciparum, Plasmodium vivax, Plasmodium malariae, Plasmodium ovale, and Plasmodium knowlesi—P. falciparum and P. vivax are the most virulent and contribute to the highest morbidity and mortality rates [3].
The transmission dynamics of malaria are influenced by various factors, including human treatment-seeking behavior [4]. Effective and timely treatment plays a critical role in mitigating malaria transmission and reducing its societal impact [5, 6]. Historically, traditional medicine has played a crucial role in malaria treatment, particularly in regions with limited access to modern healthcare [7, 8]. It is estimated that between 25% and 75% of individuals in endemic areas rely on traditional remedies as either a primary or complementary treatment [9]. However, traditional medicine use presents substantial challenges, including a lack of rigorous clinical validation, unpredictable dosage variations, and concerns regarding safety and efficacy [10, 11]. The authors in [12] found that the main challenge with herbal malaria treatment is inappropriate dosage specifications. Unlike standardized pharmaceutical treatments, herbal malaria therapies are often prepared and administered based on empirical knowledge rather than precise scientific formulations. The absence of standardized dosing regimens increases the risk of treatment failure, severe complications, and, potentially, the emergence of antimalarial drug resistance, which is currently a major challenge to malaria control [9].
Mathematical modeling serves as a powerful tool for understanding infectious disease dynamics, evaluating intervention strategies, and informing public health policies [13]. Since the early work of Sir Ronald Ross in 1911 [14], as the disease burden increased, numerous malaria transmission models have been developed [15–18], incorporating factors such as latency periods, human–mosquito interactions, immunity, and heterogeneous susceptibility. The study in [16] presented a mathematical model for malaria dynamics, considering blood transfusion transmission and saturated treatment function to delay in administering anti-malaria drug treatment transmission in the population. They investigated the role of saturated treatment on the dynamics of malaria and verified that delay in treatment is responsible for the decrease in recovery from infection. The authors [17] developed and analyzed a population-level compartmental model of human–mosquito interactions that takes into account an intervention using transmission-blocking drugs. Their results show that the effect of treatment rate on reducing reproduction number depends on the efficacy of the drug. A mathematical model was developed by [19] to assess the effectiveness of antimalarial herbal therapy in controlling malaria transmission. Their study suggests a massive campaign for the use of antimalarial traditional medicine as a treatment for malaria infection. However, further empirical studies and clinical trials are needed to validate the model's predictions and assess the feasibility and effectiveness of implementing herbal therapy on a larger scale. The authors in [5] proposed a deterministic model that explains the transmission dynamics between mosquito and human populations and the impacts of control interventions. A malaria dynamic model with partial immunity and protected travelers using optimal control and cost-effectiveness analysis was developed [16]. They showed that a quadruple of control strategies could minimize infection and implementation costs, suggesting not all strategies are necessary with limited resources. In addition, the study in [20] developed a deterministic model to assess the impact of awareness campaigns on malaria transmission. They applied optimal control theory to minimize disease control costs, concluding that media-driven awareness campaigns are effective for cost-efficient malaria management. The authors in [21] formulated a model incorporating drug resistance, treatment, and mosquito net usage to study malaria dynamics in Nigeria. By fitting the model to real-world data, they identified key parameters influencing disease transmission and emphasized the need for improved control measures targeting resistant strains. Again, the study in [22] proposed a malaria model incorporating insecticide-treated bed nets, human treatment, sterile mosquito techniques, and interventions for pregnant women and newborns, demonstrating that effective control strategies can reduce malaria transmission. The study presented in [23] a nonlinear deterministic model to analyze climatic variability's impact on malaria transmission, highlighting the significance of environmental factors in disease control strategies. The researchers developed a model incorporating partial immunity and protected travelers' movement, using optimal control theory to evaluate intervention strategies for malaria management in populations with varying immunity levels and mobility patterns [24]. Moreover, the study introduced a two-group model distinguishing between symptomatic and asymptomatic carriers of malaria [25]. Optimal control strategies were analyzed to determine effective interventions, emphasizing the role of asymptomatic individuals in disease persistence and control. The study in [15] develops a nonlinear mathematical model to investigate the effects of relapse on malaria transmission dynamics in both human and mosquito populations. Their result showed that relapse occurs not only because of incomplete treatment but also when symptoms reappear after the parasites have been eliminated from blood but persist as dormant hypnozoites in liver cells. However, the model does not explicitly incorporate treatment-seeking behavior, which is a critical factor in malaria control efforts.
Despite extensive research, the disease continues to spread due to various factors, including treatment-seeking behaviors. Many individuals seek treatment from traditional medicine practitioners, whose remedies often lack clinical validation. This study aims to fill the gap in mathematical modeling by incorporating the effect of treatment-seeking behaviors on malaria transmission dynamics using optimal control approaches. Thus, this study is an extension of the model studied in [15], taking into account the treatment-seeking behavior. It extends the existing model by classifying infected individuals based on their treatment choices: those seeking treatment at healthcare facilities and those using traditional remedies without clinical validation. The model further integrates three optimal control strategies: antimalarial drug treatment, the use of insecticide-treated bed nets (ITNs), and awareness campaigns to discourage inappropriate reliance on traditional medicine.
In general, the rest of this article is organized as follows: In Section 2 of the work, the mathematical model is formulated. Section 3 discusses the basic properties of the model, and a sensitivity analysis of the basic reproduction number is conducted in Section 4, followed by numerical simulations in Section 5. In Section 6, optimal control analysis is made analytically, and numerical simulations of optimal control are discussed. Then, discussions and conclusions are provided in Section 7. Lastly, in Section 8, limitations of the study are provided.
2 Model formulation
This study is an extension of the model provided in [15], taking into account the treatment-seeking behavior by adding more compartments and assumptions. The total human population at a time t, denoted by Nh(t), is divided into six epidemiological groups in the presence of the disease as susceptible (Sh), infected (Eh), infectious (Ih), infectious individuals who are undergoing treatment at health facilities (Th), infectious individuals who are undergoing treatment with inappropriate traditional medicine by traditional practitioners (Ts), and recovered (individuals who recover as a result of receiving treatment using traditional medicine or natural immunity Rh). Thus, at any time t ≥ 0, the total human population is given by:
Likewise, the vector population is categorized into three groups: susceptible (Sm), exposed (Em), and infectious (Im). The vector compartment does not include an immune class as mosquitoes never recover from the infection, that is, their infected period ends with their death due to their relatively short lifecycle. Thus, the total vector population denoted Nm(t), at any time t ≥ 0 is given by:
Individuals naturally enter the susceptible class Sh at a constant rate Λh, due to the natural loss of immunity from the human treatment class at health facilities (a constant rate ρ), by loss of immunity from the recovered class (at a constant rate ρ1) and can be decreased by a natural death at a constant rate μ or infected after a bite from an infectious mosquito, and the sporozoites are passed on to them. The transmission rate of infections in a susceptible human population (from an infectious mosquito to a susceptible human) is assumed to be given by a rate λh. An exposed individual becomes infectious at a constant rate θh and an infectious human Ih who is seeking treatment at health facilities will move to the treatment class, Th at a constant rate τ1. It is assumed that individuals who are undergoing treatment at health facilities will recover successfully and then go back to the susceptible class Sh by loss of immunity at a constant rate ρ. Again, an infectious human who is seeking treatment with traditional medicine without a prescription from health professionals will move to the treatment class, Ts at a constant rate τ2. We assumed that an individual in a treatment class, Ts with traditional medicine can recover temporarily due to natural immunity and the use of traditional medicine and will move to the recovered class at a constant rate γ; while the others go back to a health facility due to the ineffectiveness of traditional medicine treatment at a constant progression rate ω. A temporarily recovered human class can be entered into the susceptible human class by losing immunity at a constant rate ρ1 if the merozoites of parasites clear from the blood completely, and if they don't, they go back to the infectious class Ih at a constant rate γ1. All human population classes decreased through natural death at a constant rate μ and disease-induced death rates for Ih and Ts at a constant δ and ψ, respectively.
Similarly, new vectors are recruited at a constant rate, Λm into the susceptible mosquito compartment, Sm. When a susceptible mosquito bites an infectious human, Ih or human in treatment with traditional medicine, Ts, the parasite (in the form of gametocytes) enters the mosquito, and the mosquito moves from the susceptible class to the exposed class, Em at a rate Λm. An infected mosquito will become infectious at a constant rate θm. The vector population classes decreased by natural death at a constant rate η.
The formulation of the model is primarily guided by the following assumptions:
1. When an individual is infected with malaria, we categorize the human treatment class into two groups based on community treatment-seeking behaviors: those receiving treatment at health facilities and those undergoing treatment with traditional medicines without a prescription from healthcare professionals.
2. In this study, the term ‘traditional medicines' (TMs) refers to antimalarial drugs prepared by traditional practitioners. However, it is important to note that these medicines lack clinical validity and are devoid of quality control, safety measures, standardized dosage, and potential drug interactions [26].
3. An infectious individual receiving treatment at health facilities will recover fully and subsequently lose natural immunity, rendering them susceptible to malaria again.
4. An infectious individual undergoing treatment with traditional medicine may experience temporary recovery due to their natural immunity. However, it is assumed that the merozoites of parasites are not completely eliminated from the bloodstream due to the ineffectiveness of traditional antimalarial drugs. Consequently, they may revert to the infectious human class [15].
The flow chart (Figure 1) shows the dynamics of malaria in human and vector populations.
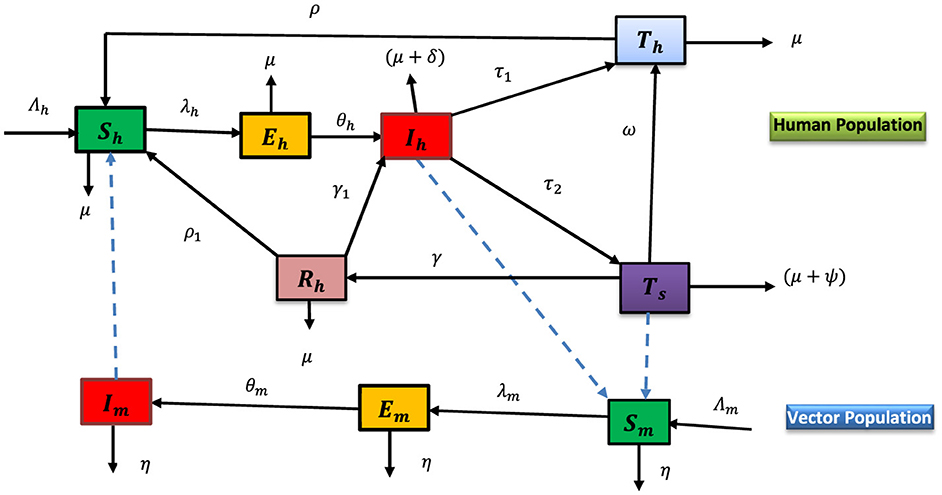
Figure 1. Flow diagram of the malaria transmission dynamics.
The dynamical system of the flow chart of Figure 1 is given as follows:
With an initial conditions [Sh(0), Eh(0), Ih(0), Th(0), Ts(0), Rh(0), Sm(0), Em(0), Im(0)]∈ℝ9+ and where λh and λm are the force of infections from vector to human and human to vector, respectively given by
3 Model analysis
The model represented by the system of differential equation (Equation 1) will be analyzed in the feasible region and since the model represents the populations all the state variables and the parameters are assumed positive [26]. The positivity and boundedness are given in lemma 1 and 2.
Lemma 1 (Positivity). [18, 27] If Sh(0) > 0, Eh(0) > 0, Ih(0) > 0, Th(0) > 0, Ts(0) > 0, Rh(0) > 0, Sm(0) > 0, Em(0) > 0, Im(0) > 0, then the solution Sh(t), Eh(t), Ih(t), Th(t), Ts(t), Rh(t), Sm(t), Em(t) and Im(t) of the system (Equation 1) are all positive for all time t ≥ 0.
Proof: From the first equation of system (Equation 1), we have dShdt+(λh+μ)Sh=Λh+ρTh+ ρ1Rh.
After some simplification and integrating both sides given as:
Since Sh(0) > 0 and f(t) > 0, for all t > 0, and also the exponential function is always positive, then the solution Sh(t) > 0 for all t > 0.
Similarly, it can be shown that the rest of the state variables, Eh(t), Ih(t), Th(t), Ts(t), Rh(t), Sm(t), Em(t),Im(t) are non-negative for all time t > 0.
Thus, we can conclude that all solutions of model (Equation 1) remain positive for all t > 0 and the solution of the model is positive.
Lemma 2 (Boundedness) [28, 29]. The feasible region Ω defined by
With initial condition Sh(0) > 0, Eh(0) > 0, Ih(0) > 0, Th(0) > 0, Ts(0) > 0, Rh(0) > 0, Sm(0) > 0, Em(0) > 0,Im(0) > 0 is positively invariant for the system (Equation 1) in ℝ9+.
Proof: Given Nh(t) = Sh(t) + Eh(t) + Ih(t) + Th(t) + Ts(t) + Rh(t) and Nm(t) = Sm(t) + Em(t) + Im(t). The rate of change in total human population size Nh(t) = Sh(t) + Eh(t) + Ih(t) + Th(t) + Ts(t) + Rh(t) can be obtained as:
After some simplification and integrating both sides, we have:
Now, taking the limsup as t → ∞, gives Nh(t)≤limt→∞supNh(0)e-μt+Λhμ(1-e-μt)= Λhμ.
Similarly, the boundedness of the total vector population is given as:
In particular, Nh(t)≤Λhμ if the total human population at the initial instant of time, Nh(0)≤Λhμ and Nm(t)≤Λmη, if Nm(0)≤Λmη. Therefore, the region is positively invariant for the system (Equation 1). Moreover, if Nh(t)>Λhμ and Nm(t)>Λmη , then either the solution of model (Equation 1) enters Ω in a finite time, or Nh(t) approaches Λhμ and Nm(t) approaches Λmη asymptotically. Hence, the region Ω is positively invariant and attracts all solutions of model (Equation 1) in ℝ6+xℝ3+.
Lemma 3 (Existence and uniqueness). In model (Equation 1) if the initial conditions Sh(0) > 0, Eh(0) > 0, Ih(0) > 0, Th(0) > 0, Ts(0) > 0, Rh(0) > 0, Sm(0) > 0, Em(0) > 0,Im(0) > 0, and t0 > 0, then for all t∈ℝ the solutions Sh(t), Eh(t), Ih(t), Th(t), Ts(t), Rh(t), Sm(t), Em(t) and Im(t) exist in ℝ9+ [17, 28, 30, 31].
Proof: The model (Equation 1) can be described as:
where X(t)=(Sh(t), Eh(t), Ih(t), Th(t), Ts(t), Rh(t), Sm(t), Em(t), Im(t))T with the corresponding initial condition.
X0=(Sh(0), Eh(0), Ih(0), Th(0), Ts(0), Rh(0), Sm(0), Em(0), Im(0)) and f(X) is the vector-valued function representing the hand-right side of the system (Equation 1) which is
Since a function f in the system (Equation 1) has a continuous first derivative in ℝ9+ and X0∈ℝ9+, Nh≠0 and Nm≠0, f is well defined at t = 0. Consequently, according to the widely used fundamental existence and uniqueness theorem [32], lemmas 1 and 2 above, there exists a unique, positive, and bounded solution for the model (Equation 1) in ℝ9+.
3.1 Malaria-free equilibrium point, E0
Malaria-free equilibrium points (MFE) are steady-state solutions where there is no malaria [33]. The malaria-free equilibrium of the system (Equation 1) is E0=(Λhμ,0, 0, 0, 0, 0, Λmη, 0, 0 ).
3.2 The basic reproduction number
The reproduction number (ℛ0) is defined as the average number of secondary infections produced by one infected individual in a completely susceptible population [13]. To obtain R0 for model (Equation 1), we use the next-generation matrix technique described in [18, 34] and is the spectral radius ρ(FV−1), where
By next generation operator method, the basic reproduction number of the model (Equation 1) is given:
Theorem 1. [13, 35, 36] The malaria-free equilibrium point, E0 of the model in the system (Equation 1) is locally asymptotically stable if the reproduction number R0<1 and is unstable ifR0> 1.
Proof: The Jacobian matrix J(E0 ) of the model to (Sh, Eh, Ih, Th, TS, Rh, Sm, Em, Im) at the malaria-free equilibrium point is the following:
where A = qβmh, B = (θh+μ), C = (δ+τ1+τ2+μ), D = (ρ+μ), E = (ω+γ+μ+ψ), F = (γ1+ρ1+μ), G=qμα1mΛmηΛh, H=qμα2mΛmηΛh, I = (θm+η), where eigenvalues of λ1 = −μ and λ6 = − η.
The remaining eigenvalues are the roots of the characteristic equation for Equation 11 given by
Now, we have λ3 = −(ρ+μ) and the remaining eigenvalues are obtained (Equation 14):
Where, P6 = 1 > 0, P5 = (γ+δ+2η+4μ+ω+γ1+θh+θm+ρ1+τ1+τ2) > 0, P4 > 0, P3 > 0, P2 > 0, P1=(IBCEF+IBCFη+IBEFη+ICEFη+BCEFη+IBCEη(1−ℛ20) −AFGθhθm−(IB+Iη+Bη)γγ1τ2) and P0=IBη(CEF(1-R02)-γγ1τ2)>0, where R0<1 and γγ1τ2<CEF.
Applying the Routh–Hurwitz stability criterion [37] and after some little algebraic manipulations, it can be shown that the eigenvalues of the block matrix have negative real parts .i.e. λ1 = −μ < 0 , λ3 = −(ρ+μ) < 0, λ6 = −η < 0, if R0<1. If R0>1, then P1 < 0, thus the matrix JE0 has at least one eigenvalue with a positive real part. Hence, malaria-free equilibrium E0 of the system (Equation 1) is locally asymptotically stable if R0<1 and unstable if R0> 1.
3.3 Malaria-present equilibrium point, E*
The endemic equilibrium point of the dynamical system of Equation 4 is obtained by making the right side of the system equal to zero, providing that Eh ≠ 0, Ih ≠ 0, Ts ≠ 0, Rh ≠ 0, Em ≠ 0, Im ≠ 0. We have supposed the endemic equilibrium point of the model is denoted by E* =Sh*, Eh*, Ih*, Th*, TS*, Rh*, Sm*, Em*, Im* and the corresponding forces of infection are:
λh* =qβmhIm* Sh*Nh and λm* =qα1mIh* Sm*Nh+qα2mTs* Sm* Nh. Next, after some steps of the computations, we have determined the required endemic equilibrium point for the model given as:
Then, by substituting Ih* and Im* in the λh* and λm*, respectively, we get the simplified form:
where P1 = (IBDEΛh(FC−γγ1τ2)+AθmΛm(BDEF(δ+μ) +EF(BD−ρθh)τ1+D(BEF−BEγγ1−θh(Fρω+γρ1))τ2)) and P0=Dη2ΛhIB(CEF(R02-1)+ γγ1τ2).
Consequently, the following result has been determined.
Theorem 2. The model of the system (Equation 1) admits precisely [17].
a. One endemic equilibrium point if R0>1 and P1 < 0 or P0 > 0 and P1 < 0.
b. One endemic equilibrium point if R0<1, γγ1τ2 > CEF and P1 < 0 or P0 > 0 and P1 < 0.
c. One endemic equilibrium point if R0<1, γγ1τ2<CEF and P1 > 0 or P0 < 0 and P1 > 0.
d. No equilibrium point otherwise.
From theorem 2, we can observe that, the existence of one positive root in condition (b) and one positive root in condition (c) suggests that the model can exhibit backward bifurcation phenomenon, where both locally asymptotically stable malaria-free and endemic steady states co-exist, where R0<1. It suggests that while eliminating diseases from the population is dependent on the criterion R0<1, this need is no longer sufficient to ensure disease eradication. Thus, when R0<R0*<1, it can be demonstrated that backward bifurcation happens for certain values of R0. The backward bifurcation phenomena in system (Equation 1) make it challenging to manage or eradicate malaria because R0<R0*<1 requires lowering the model's reproduction number to a level below unity. This implies that further control efforts will be required to eradicate malaria from the population.
Theorem 3. The malaria-present equilibrium, E*=(Sh*, Eh*,Ih*,Th*,TS*,Rh*,Sm*,Em*,Im*) of the system (Equation 1), is locally asymptotically stable (LAS), if R0>1 and unstable if R0<1 [38].
Proof: The Jacobian matrix of the model (Equation 1) is given by
where a1=μ+qβmhIm*Nh*, a4 = ρ, a6 = ρ1, a9=qβmhSh*Nh*, b1=qβmhIm*Nh*, b2 = θh+μ, b9=qβmhSh*Nh* , c2 = θh, c3 = (δ+τ1+τ2+μ), c6 = γ1, d3 = τ1, d4 = (ρ+μ), d5 = ω, e1 = e2 = e3 = τ2, e5 = (ω+γ+μ+ψ), f5 = γ, f6 = γ1+ρ1+μ, g3=qα1mNh*Sm*, g5=qα2mNh*Sm*, g7=(qα1mIh*Nh*+qα2mTS*Nh*+η), h3=qα1mNh*Sm*, h5=qα2mNh*Sm*, h7=(qα1mIh*Nh*+qα2mTS*Nh*), h8 = θm+η, k8 = θm, k9 = η. The corresponding characteristic equation of the Jacobian matrix with eigenvalue λ is given by |J(E*)−λI| = 0; that is,
where P0, P1, P2, …, P9 (see Appendix I).
Therefore, we show that when R0>1, all the coefficients Pi of the characteristic (Equation 17), and the first column values b1, c1, d1, e1, f1, g1, h1 and i0 of the Routh array are positive, so by the Routh-Hurwitz stability criterion, all the eigenvalues of the Jacobian matrix (Equation 17) have negative real parts. Thus, the malaria-present equilibrium is locally asymptotically stable for R0> 1.
4 Sensitivity analysis of the reproduction number
This section aims to perform a sensitivity analysis of the basic reproductive number, which is crucial for designing mitigation strategies to slow the spread of malaria by reducing the reproduction number. Sensitivity analysis helps [39–41] researchers, public health officials, and policymakers prioritize interventions and decisions based on the most strongly influencing factors, enabling them to understand the effects of each parameter on the reproduction number and design effective strategies.
Definition 1. Normalized forward sensitivity index of R0 which is differentiable to a given parameter (p) is defined as [42]
By using the parameter values given in Table 1 and Def. 1, the respective sensitivity indices values for reproduction number are computed in Table 2 and we plot the sensitivity indices in Figure 2.
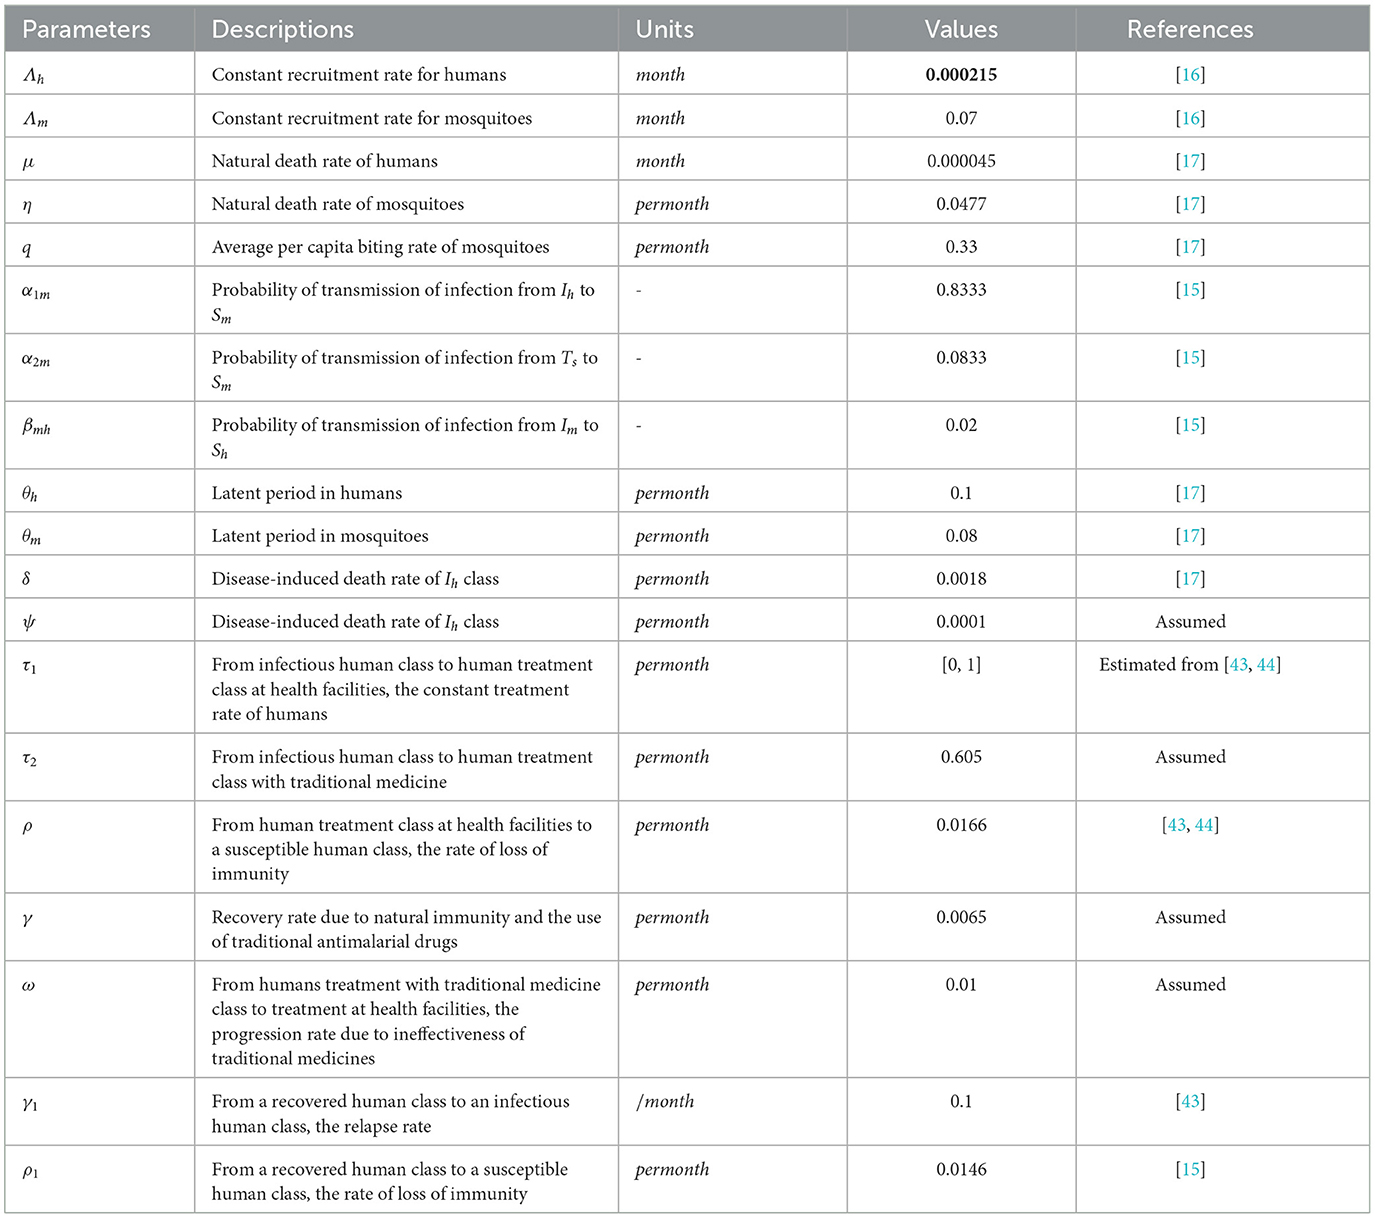
Table 1. Parameters description of the model with their values.
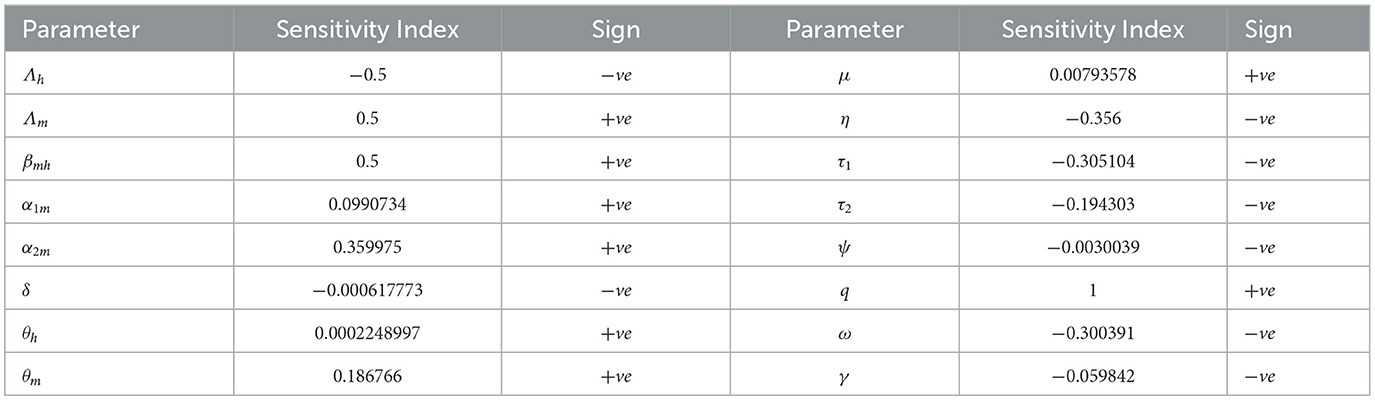
Table 2. Sensitivity indices of R0 to parameters evaluated at the parameter values given in Table 1.
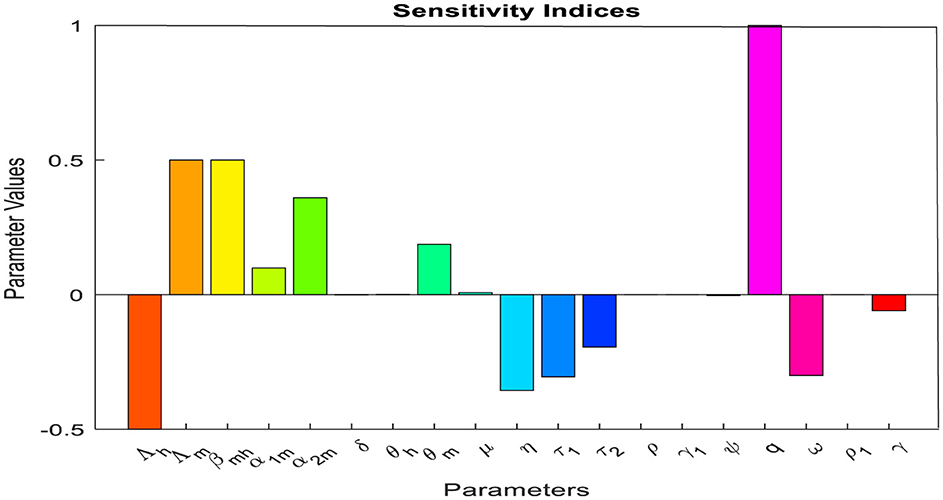
Figure 2. Sensitivity indices of the model parameters for reproduction number, R0.
The positive parameter values increase the reproduction number when they are increased, while the negative parameter values decrease the reproduction number when they are increased. From the parameter values displayed in Table 2, we can observe that factors such as the biting rate of mosquitoes and the probability of transmission of infection from humans in treatment with traditional medicine to susceptible mosquitoes are the most sensitive factors. So, interventions should be introduced to reduce these factors. In another way, factors such as the rate of infectious humans who are undergoing treatment at health facilities (τ1) and the progression rate (ω) due to failure of treatment with traditional medicine to treatment at health facilities are also sensitive to the basic reproduction number. Increasing these factors will decrease the reproductive number and reduce malaria. Moreover, if SI(p)=y, then a 1% increase in the parameter p results in a y% increase if y > 0 (decrease if y < 0) in reproduction number. From our sensitivity indices results, for example, a 10% increase in the probability of transmission of infection from human treatment with traditional medicine to susceptible mosquitoes results in a 3.5% increase in the value of reproduction number. A 10% increase in treatment with traditional medicine results in a 1.9% decrease in value of the reproduction number; a 10% increase in the progression rate (ω) results in a 3% decrease in the value of the reproduction number. Again, an 10% increase in treatment at health facilities results in a 3.1% decrease in the value of the reproduction number and, hence a reduction in malaria.
5 Numerical simulations
This section conducts a numerical simulation to validate the analytical results of a model (Equation 1) designed to study the dynamics of malaria in communities. Parameter values from many sources are used in the model, which employs the fourth-order Runge–Kutta method and MATLAB R2023a to examine the impact of parameters on malaria transmission.
Here, one of our main goals is to look into how treatment with inappropriate traditional medicines affects the dynamics of malaria transmission. Figure 3a shows how varying the treatment rate at health facilities affects the infectious human populations. We can observe that when the treatment rate at health facilities increases, the population of infectious humans can be reduced, and the disease can be eliminated from the community after 140 months.
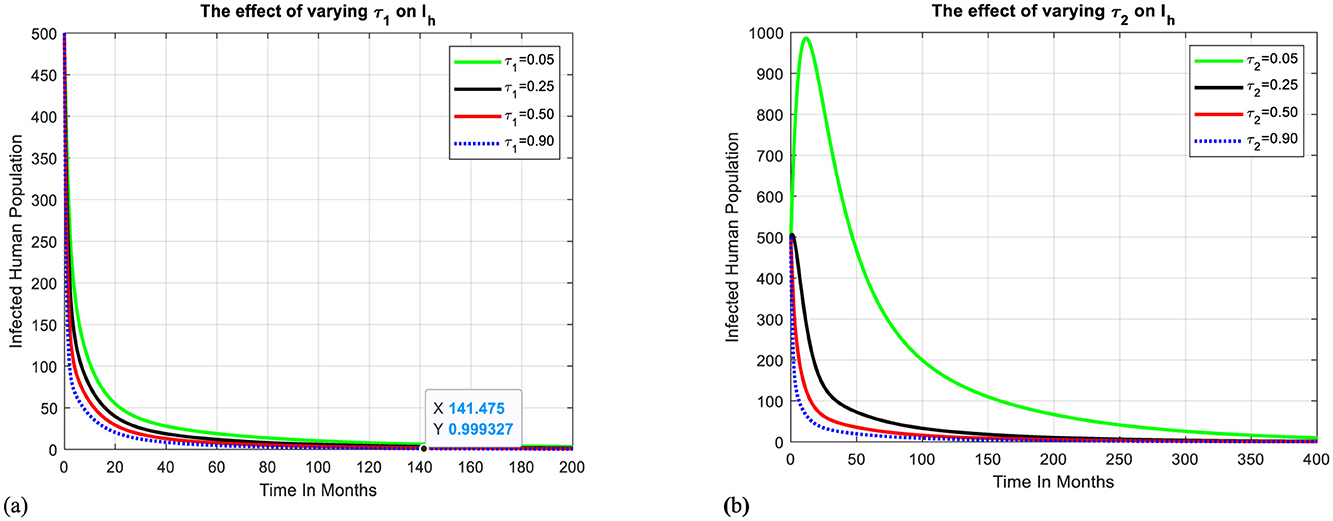
Figure 3. Effect of treatment-seeking behaviors on infectious humans. (a) The effect of treatment at health facilities on infectious humans. (b) The effect of treatment with traditional medicines on infectious humans.
Figure 3b shows how varying the treatment rate with traditional medicines affects the infectious human populations. We can observe that when the treatment rate with traditional medicine increases, the population of infectious humans can be increased because of factors such as lack of quality control, safety, dosage, and potential drug interactions and can be reduced when traditional remedies are considered with caution and in consultation with healthcare professionals or skilled traditional practitioners. If so, it takes more than 400 months to eliminate the disease in the targeted community.
Figure 4a shows how varying the progression rate (awareness) to health facilities affects the human population's treatment with traditional medicines. We can observe that when the progression rate from Ts to Th increases, the population treated with traditional medicines decreases, resulting in the population of infectious humans being reduced, and the disease can be eliminated from the community after 200 months, as shown in Figure 4b.
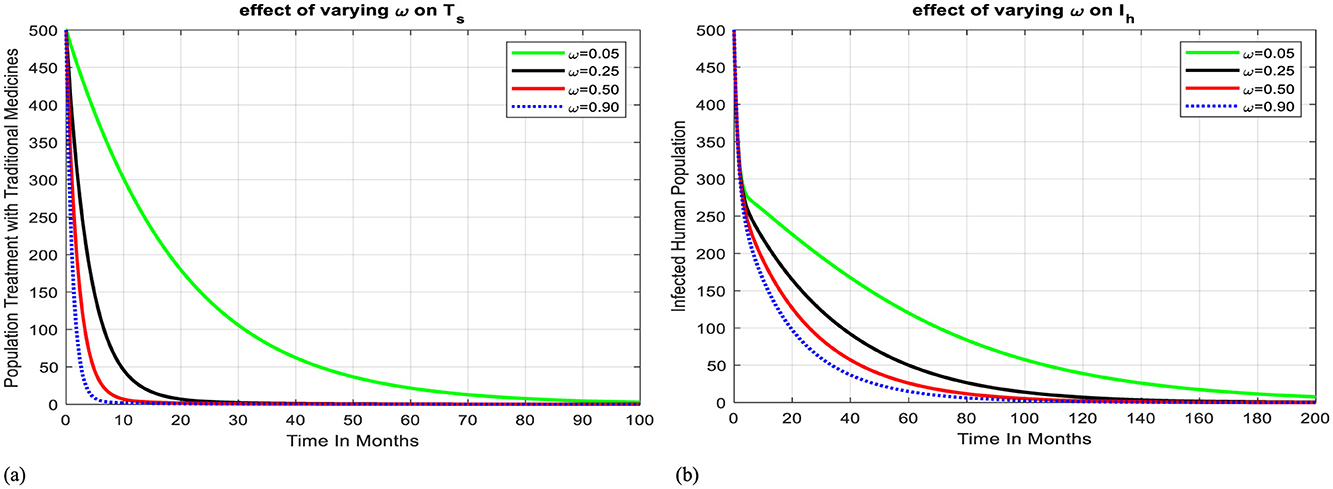
Figure 4. Effect of progression rate on Ts and Ih. (a) Effect of progression rate from treatment with TM to health facility on Ts. (b) Effect of progression rate from treatment with TM to health facility on Ih.
The depicted graph in Figure 5 delineates the relationship between the reproduction number and the treatment rate (τ1) for the transition from the infectious human class to the human treatment class at a health facility. Remarkably, a notable intersection occurs at a reproduction number of one and a treatment rate of τ1 = 0.17. This intersection point carries significant epidemiological implications, suggesting a critical threshold where the spread of infection is balanced by treatment efforts. Now, the rate of new infections matches the rate of individuals transitioning to treatment, potentially indicating a pivotal point for disease control and management strategies. Understanding and leveraging this intersection point can inform targeted interventions aimed at effectively curtailing outbreaks and minimizing their impact on public health.
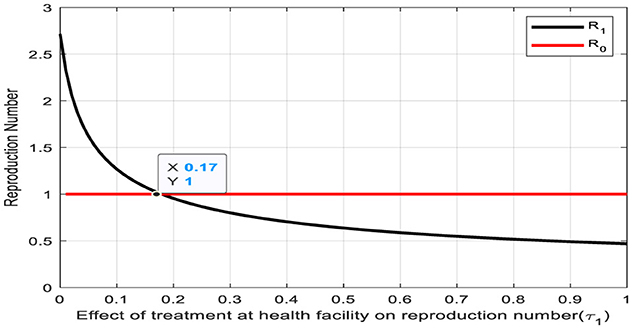
Figure 5. Effect of treatment rate at health facility on reproduction number, R0.
The convergence of the treatment rate (τ2) and the reproduction number on the Figure 6 denotes a significant intersection point, occurring at a value of 0.80. This intersection holds profound implications for the transition from the infectious human class to the human treatment class with traditional medicines. At this point, the treatment rate aligns with the reproduction number, indicating a pivotal balance between the rate of new infections and the effectiveness of treatment interventions. Notably, to achieve a reproduction number of less than one, it is essential for the treatment rate (τ2) to exceed 0.80. Such equilibrium underscores a critical threshold in disease management, where treatment efforts are optimally poised to mitigate the spread of infection effectively. Recognizing and leveraging this intersection point is paramount for devising targeted strategies to control outbreaks and safeguard public health.
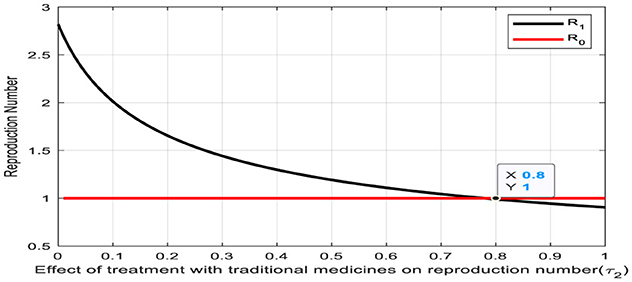
Figure 6. Effect of treatment rate with traditional medicines on reproduction number, R0.
6 Formulation and analysis of optimal control
In this part, we use Pontryagin's maximum principle [45, 46] to identify the parameters required for effective malaria control. We use three time-dependent controls in the model (Equation 1) to find the best disease control approach. The study proposes a model to minimize malaria transmission by introducing control measures like ITNs, antimalarial drug treatment, and raising awareness about avoiding inappropriate traditional medicines. The model is designed to investigate the potential impact of these interventions, with the use of insecticide-treated bed nets, antimalarial drug treatment, and awareness creation being incorporated into the model to determine the most effective approach as follows:
with the corresponding initial conditions
and 0 ≤ u1(t) ≤ 1 represents malaria infection personal protection measures, 0 ≤ u2 ≤ 1 represents antimalarial drug treatment control and 0 ≤ u3 ≤ 1 represents providing awareness on avoiding the inappropriate use of traditional medicines.
The objective function of the system (Equation 19) is to minimize the total number of exposed humans, infectious humans, and mosquitoes while minimizing the cost of control u1(t), u2(t), u3(t) and to find the optimal control values u*=(u1*, u2*,u3*) of the controls u = (u1, u2, u3) such that the associated state trajectories (Sh*, Eh*, Ih*,Th*, Ts*, Rh*,Sm*, Em*, Im*) are solutions of the optimal control system (Equation 19) with initial conditions as given in Equation 20. The objective function is given by
Subject to (Equation 22) where tf is the final time, Nm = (Sm+Em+Im), D1, D2, D3, w1, w2 and w3 are positive weight constants. Our choice of control functions agrees with other literature on control of epidemics [16, 40, 46, 47]. The quadratic costs w1u21(t), w2u22(t) and w3u23 are the costs associated with the use of personal protection measures (ITNs), the use of antimalarial drugs for infectious humans, and awareness on avoiding the un-prescribed use of antimalarial drugs. Here, the fact that the controls are linearly in Equation 19 and quadratic in the objective function allows the Hamiltonian associated with the optimal control problem to be maximized. We seek to find, using the Pontryagin maximum principle [48], an optimal control u1*(t), u2*(t) and u3*(t) satisfying (Equation 19) such that
Where U = {(u1, u2, u3)} such that u1, u2, u3 are measurable with 0 ≤ u1 ≤ 1, 0 ≤ u2 ≤ 1, 0 ≤ u3 ≤ 1, for t∈[0, tf] is the control set. The controls (u1(t), u2(t), u3(t)) are bounded Lebesgue integrable functions [49].
The optimal controls (u1(t), u2(t), u3(t)) satisfy necessary conditions from Pontryagin's maximum principle [48]. This principle converts Equations 19, 21 into a problem of minimizing pointwise a Hamiltonian H, to the controls (u1(t), u2(t), u3(t)). The optimality conditions are obtained using the Hamiltonian formulated from the cost functional (Equation 21) and the governing dynamics (Equation 19). Thus, Hamiltonian H is given as:
Where Γi, i = 1, 2, …, 9 are the associated adjoints for the state variables.
The system of equations is found by taking the appropriate partial derivatives of the Hamiltonian (26) to the associated state variable.
Theorem 4. [45, 47] Let u1*, u*2,u*3 be the optimal control and solutions (Sh*, Eh*, Ih*,Th*, Ts*, Rh*,Sm*, Em*, Im*) of the corresponding state system (19) that minimizes J(u1, u2, u3) over U. Then, there exists adjoint variables Γi, i = 1, 2, …, 9 satisfying the following canonical equations
With transversality conditions
and
Proof: By using [50], the integrand of the objective functional J(u1, u2, u3) is a convex function of u1, u2 and u3. Since the solution of the system (Equation 19) is bounded, hence the system satisfies the Lipshitz property with respect to the variables Sh, Eh, Ih, Th, Ts, Rh, Sm, Em and Im. Therefore, there exists an optimal pair(u1*, u*2,u*3). The governing equations of the adjoint variables are obtained by differentiation of the Hamiltonian function, evaluated at the optimal control. Then, the adjoint system can be written as:
With transversality conditions Γ1(tf) = Γ2(tf) = Γ3(tf) = Γ4(tf) = Γ5(tf) = Γ6(tf) = Γ7(tf) = Γ8(tf) = Γ9(tf) = 0.
Then, from the optimality condition, we have:
Using [51], we get, u1=(Γ2-Γ1)λhSh+(Γ8-Γ7)λmSmw1, u2= (Γ3-Γ4)τ1Ihw2, u3=(Γ5-Γ3)τ2Ihw3 and solving for u*1, u*2 and u*3 we get:
Additionally, the sufficient condition (the second derivative of the Hamilton function with respect to u1, u2 and u3). i.e. ∂2H∂u21=0⇒∂2H∂u21=w1, ∂2H∂u22=0⇒∂2H∂u22=w2 and ∂2H∂u23=0⇒∂2H∂u23=w3.
This shows that the optimal problem goes minimization at u1, u2 and u3.
6.1 Numerical simulations of optimal control
The optimality system consists of the state system in the system (Equation 1), optimal control set in Equation 19, adjoint system in Equation 24, boundary conditions in Equation 25, and initial conditions Sh(0) = 85, Eh(0) = 20, Ih(0) = 20, Th(0) = 5, Ts(0) = 10, Rh(0) = 5, Sm(0) = 1, 000, Em(0) = 20, and Im(0) = 30, [16], while the parameter values are given in Table 2. We carried out the numerical simulation with MATLAB R2023a by using the forward-backward fourth-order Runge-Kutta iterative method to solve the optimality system [46]. The state (Equation 19) is solved with the initial values of state variables using the fourth-order forward Runge–Kutta method and then we used backward fourth-order Runge-Kutta to solve the adjoint equations [45, 46, 51]. To determine the impact of control measures on the reduction of malaria infection, we have the following cases of optimal control strategies:
Intervention I: Optimal use of ITNs, treatment, and awareness creation toward avoiding inappropriate traditional medicines
Figures 7a–c depicts when the three control mechanisms, namely ITNs (u1 ≠ 0), antimalarial drug treatment (u2 ≠ 0), and awareness creation toward avoiding un-prescribed TM (u3 ≠ 0) are implemented to optimize the objective function J. The results show that the number of exposed humans, infectious humans, and mosquitoes are decreased more rapidly when controls are in use than the case without controls. We found that while ITN use, treatment, and raising awareness against the use of un-prescribed traditional medicines can all contribute to a reduction in the malaria burden. Combining these interventions is the most effective way to get improved outcomes
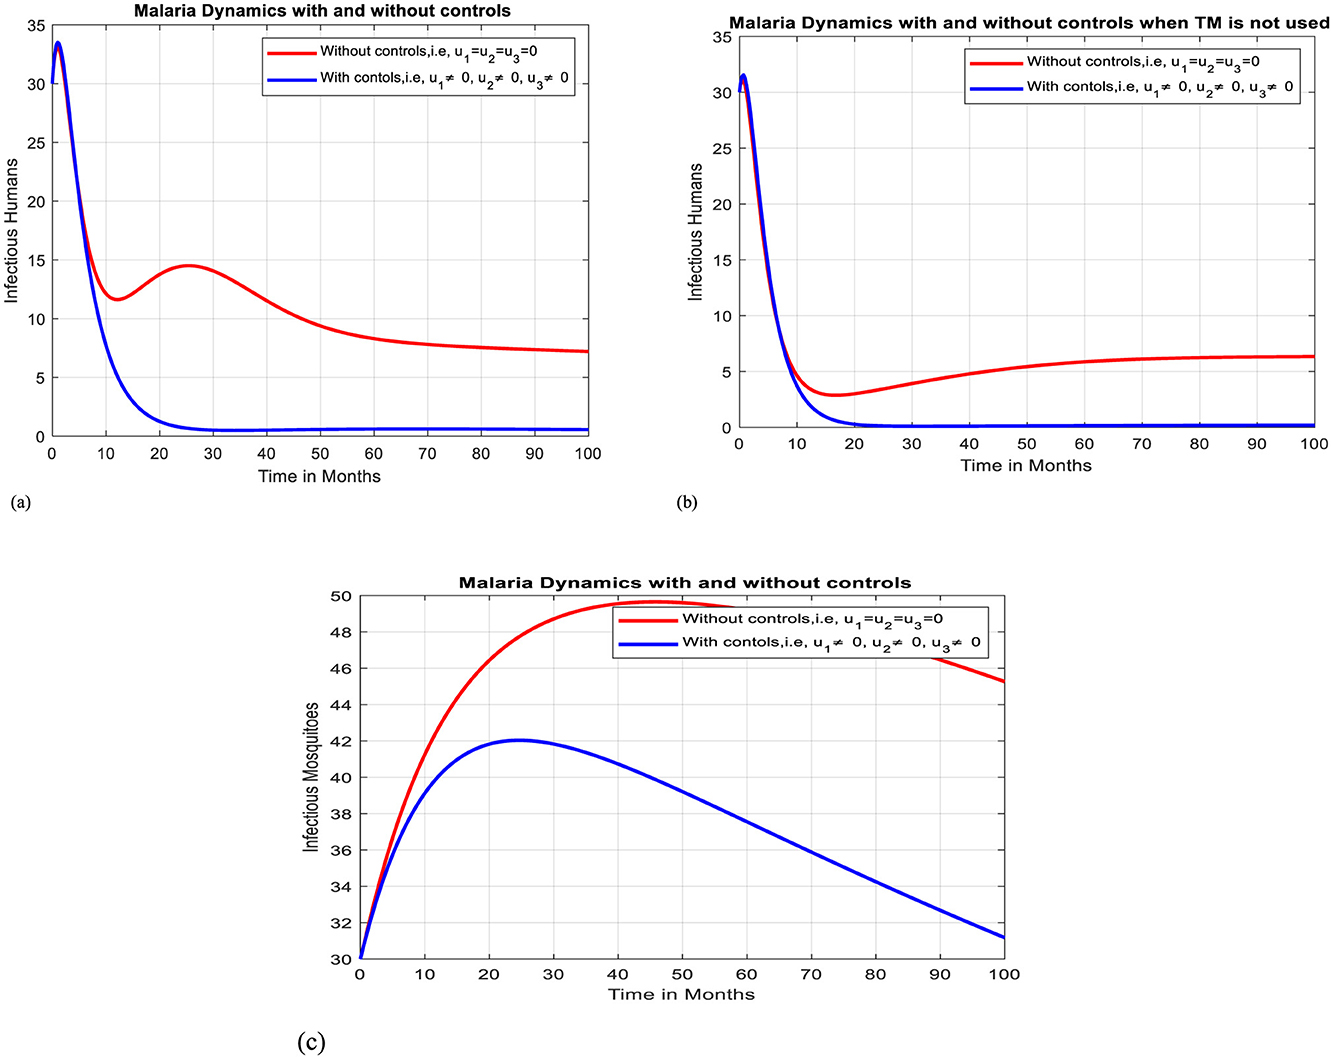
Figure 7. Effect of intervention –I on Ih and Im over time. (a) Simulation of optimal use of u1, u2 and u3 on infectious humans. (b) Simulation of optimal use of all interventions on infectious humans when TM is not used. (c) Simulation of optimal use of u1, u2 and u3 on infectious mosquitoes.
Intervention II: Optimal use of ITNs and antimalarial drug treatment
In this case, simulation is done for infectious humans and mosquitoes when there is no control strategy in place and when there are protective efforts using ITNs and treatment for infectious individuals. As Figures 8a, b illustrates, when controls are in place, the number of infectious humans and infectious mosquitoes decline more quickly than the case without controls, respectively.
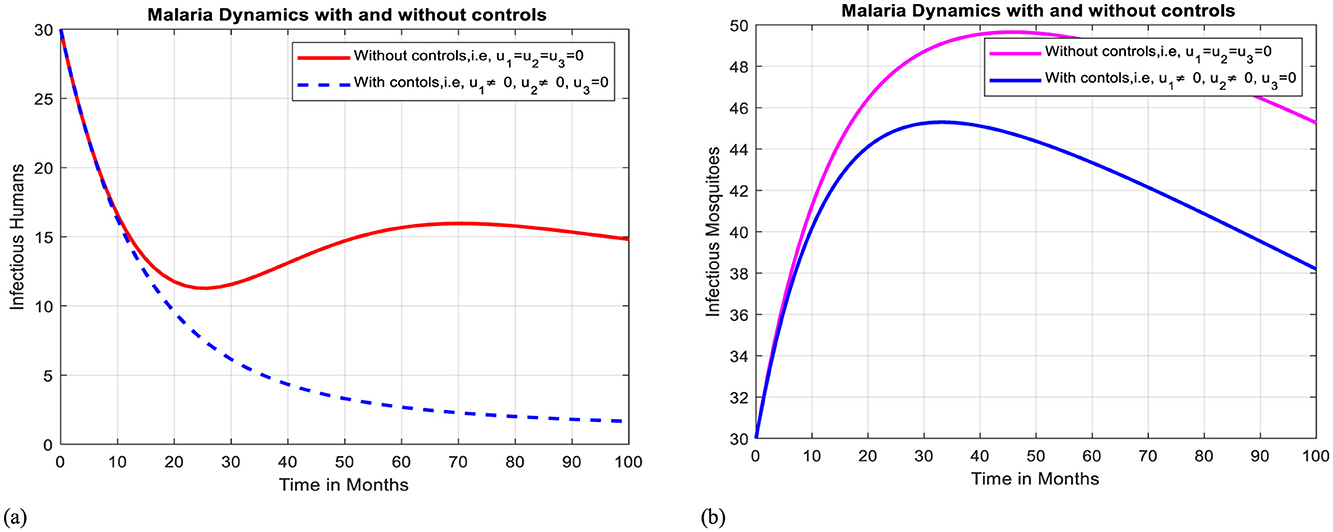
Figure 8. Effect of intervention II on Ih and Im over time. (a) Simulation of optimal use of u1 and u2 on infectious humans. (b) Simulation of optimal use of u1 and u2 on infectious mosquitoes.
Intervention III: Optimal use of ITNs and awareness creation toward inappropriate use of traditional medicines
In this case, simulation is done for infectious humans and mosquitoes when there is a control strategy in place and when there are combined protective efforts using ITNs and using media campaigns for awareness creation of avoiding unprescribed traditional medicines. As Figures 9a, b illustrate, when controls are in place, the number of infectious humans and mosquitoes declines more quickly than in the case without controls.
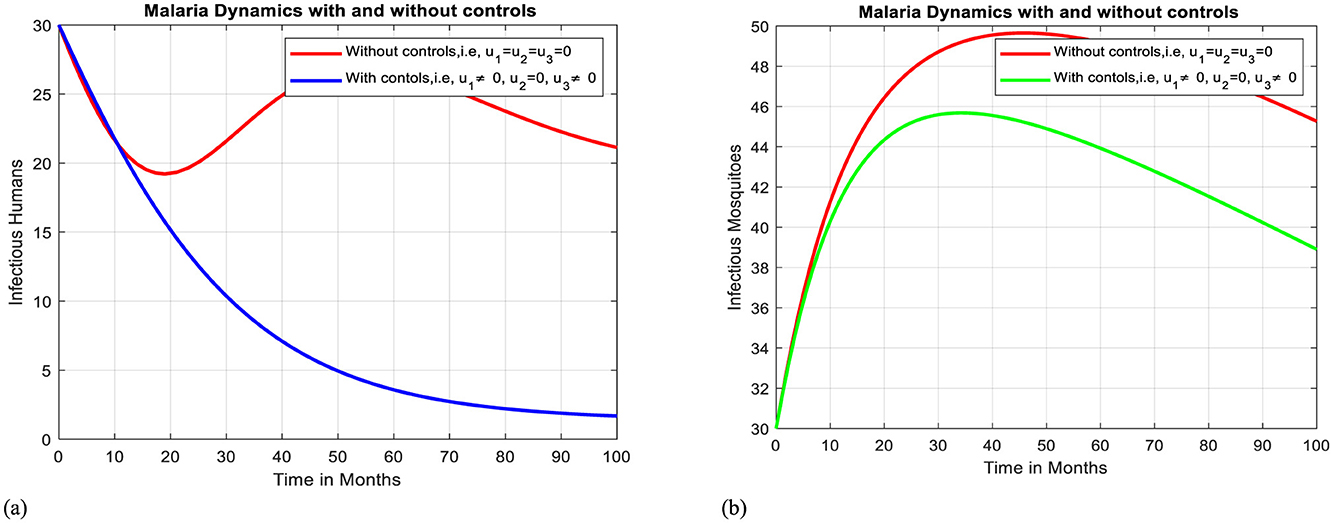
Figure 9. Effect of intervention III on Ih and Im over time. (a) Simulation of optimal use of u1 and u3 on infectious humans. (b) Simulation of optimal use of u1 and u3 on infectious mosquitoes.
Intervention IV: Optimal use of treatment of Infectious Humans and Awareness creation toward inappropriate use of traditional medicines
In this case, simulation is done for infectious humans and mosquitoes when there is no control strategy in place and when there are combined effects of protective efforts using treatment for infectious individuals and using media campaigns to raise awareness of avoiding clinically not valid traditional medicines. As shown in Figures 10a, b, when controls are in place, the number of infectious humans and mosquitoes declines more rapidly than in the case without controls. Here, on comparison, we find that using strategy IV is the powerful one to mitigate malaria compared to the strategy III because it reduces the infectious individuals and mosquitoes to zero after 100 months.
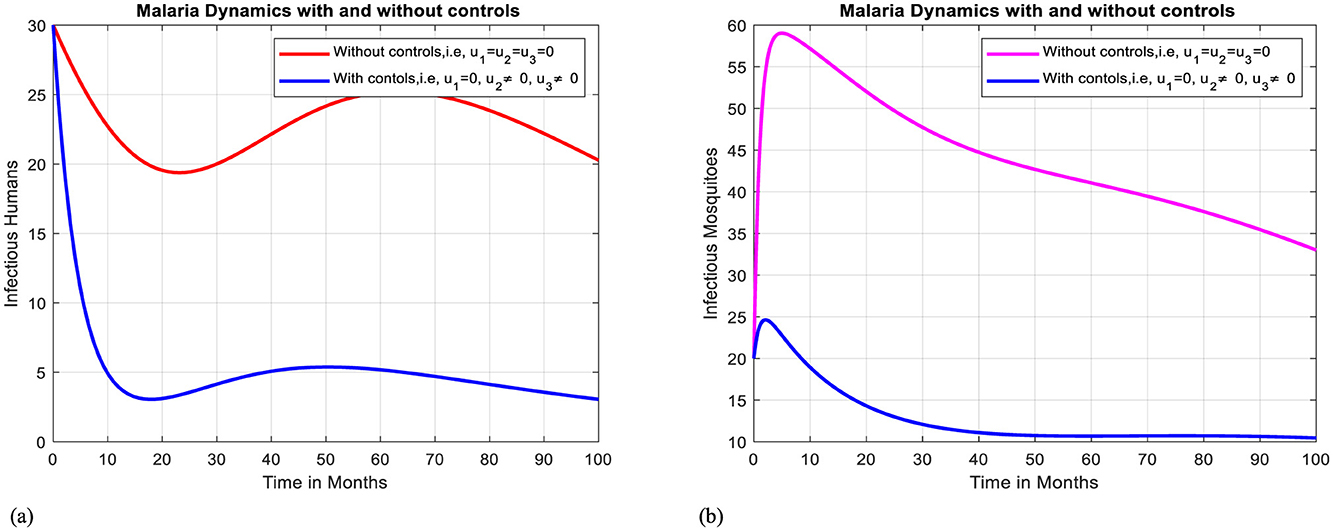
Figure 10. Effect of intervention IV on Ih and Im over time. (a) Simulation of optimal use of u2 and u3 on infectious humans. (b) Simulation of optimal use of u2 and u3 on infectious mosquitoes.
Intervention V: Optimal use of ITNs
Figures 11a, b illustrates how the adoption of personal protective measures using ITNs alone has a positive effect on curbing the prevalence of malaria within the community, but it is not sufficient to eliminate the disease.
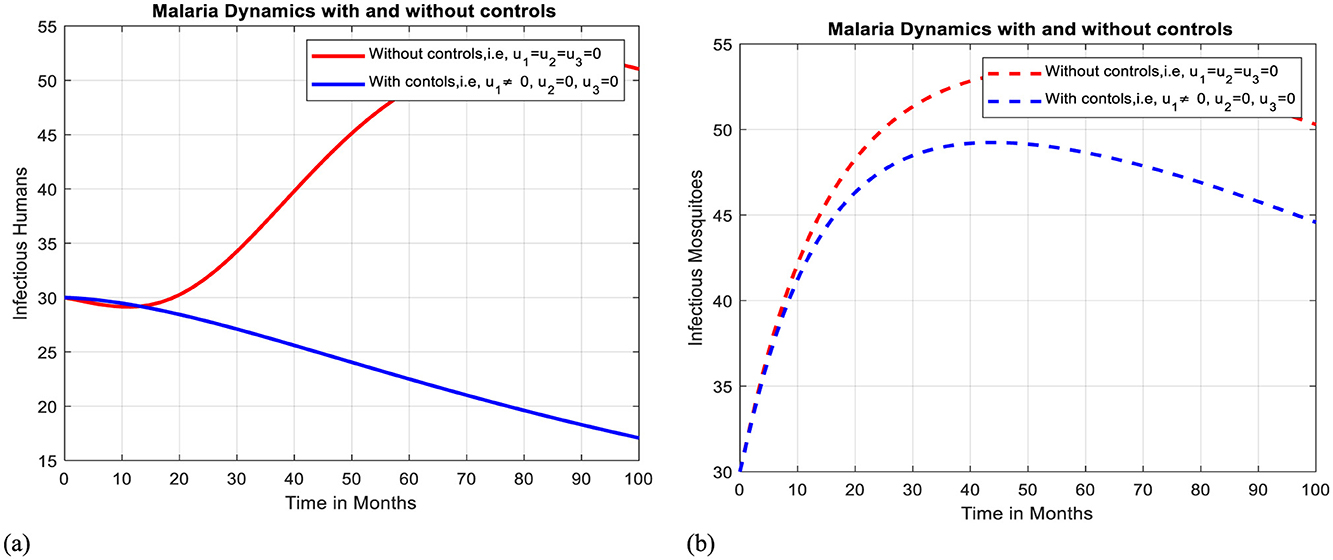
Figure 11. Effect of intervention V on Ih and Im over time. (a) Simulation of optimal use of u1 on infectious humans. (b) Simulation of optimal use of u1 on infectious mosquitoes.
Intervention VI: Optimal use of antimalarial drug treatment
The implementation of treatment alone can effectively slow the transmission of malaria within a community, but it is insufficient to eradicate the illness, as shown by Figures 12a, b.
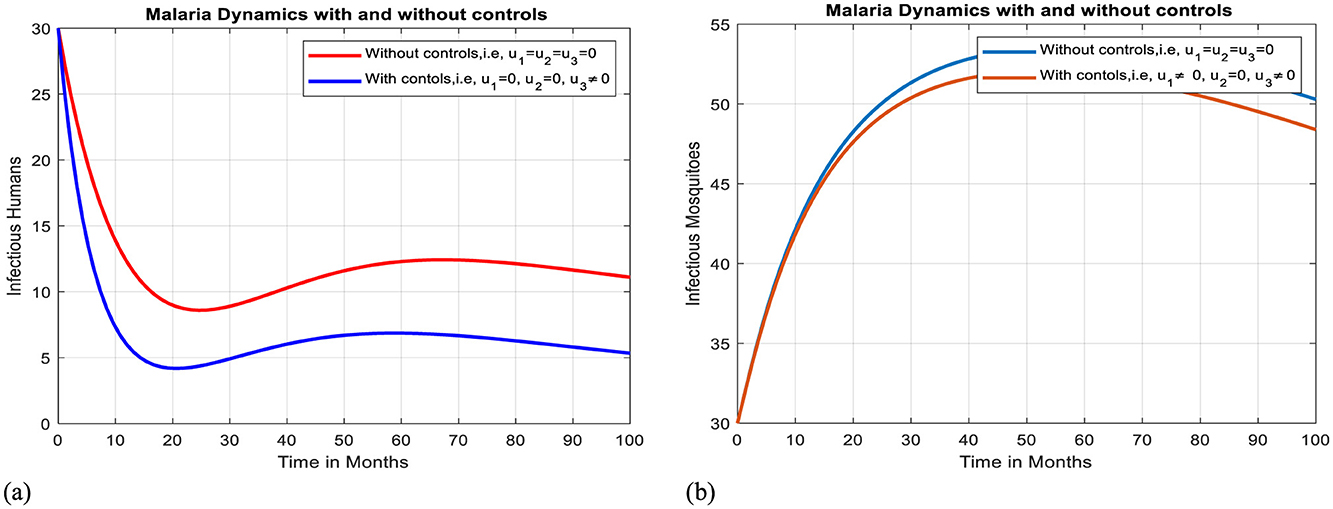
Figure 12. Effect of intervention VI on Ih and Im over time. (a) Simulation of optimal use of u3 on infectious humans. (b) Simulation of Optimal use of u3 on infectious mosquitoes.
Intervention VII: Optimal use of awareness creation toward inappropriate use of TMs
The implementation of awareness creation toward unprescribed traditional medicines alone can reduce the spread of malaria within a community, though it is insufficient to eradicate the illness, as shown by Figures 13a, b.
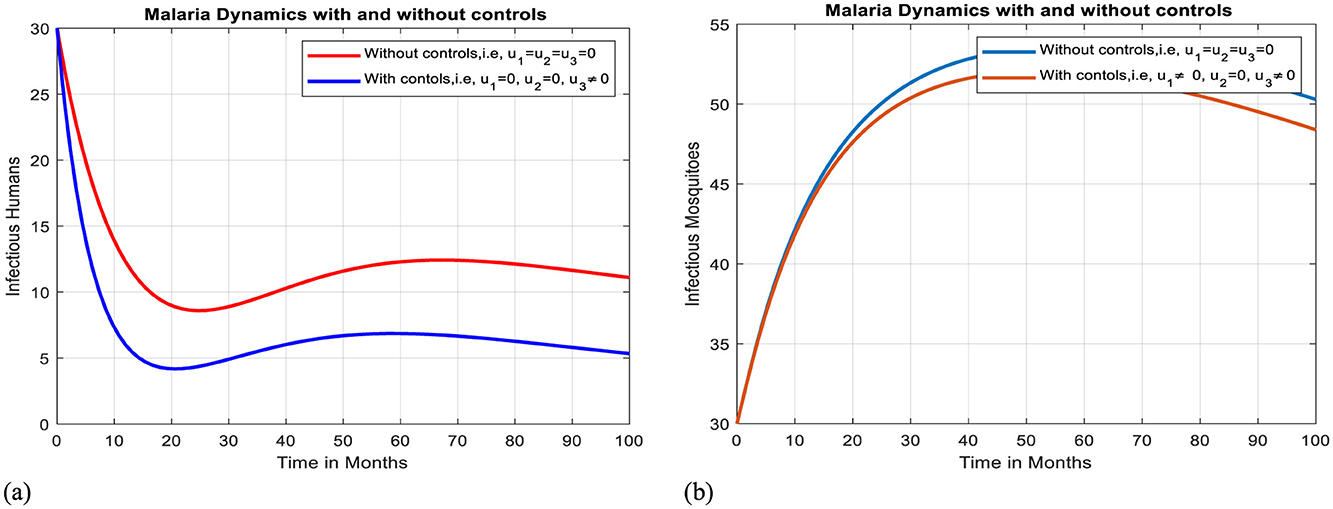
Figure 13. Effect of intervention VII on Ih and Im over time. (a) Simulation of optimal use of u3 on infectious humans. (b) Simulation of optimal use of u3 on infectious mosquitoes.
Moreover, when there is no treatment with inappropriate TMs (τ2 = 0), the three control mechanisms strictly decrease the infected humans initially from 30 to 0 at 20 months, and when there is use of inappropriate TMs (τ2 > 0), the three control mechanisms decrease the infectious humans initially from 30 to 0 after 100 months, as shown in Figures 9a, b, respectively. Although the three strategies do lower the prevalence of malaria, when traditional medicines are used for treatment, the disease is still endemic in the community. Therefore, using the three control mechanisms at the same time, avoiding treatment with inappropriate traditional medicines, and seeking treatment by health professionals at health facilities are the best strategies to mitigate malaria.
7 Discussion and conclusion
This study presents a comprehensive mathematical model to analyze the impact of treatment-seeking behaviors using optimal control on the transmission dynamics of malaria. The model incorporates distinct groups of individuals seeking treatment at health facilities and those relying on traditional remedies, which lack clinical validation. By employing a new deterministic model, the study explores the effects of various control measures, including antimalarial drug treatment, personal protective measures like insecticide-treated bed nets (ITNs), and awareness campaigns to discourage the inappropriate use of traditional medicine. The findings highlight that the utilization of health facilities for malaria treatment significantly reduces the basic reproduction number, underscoring the importance of effective healthcare interventions in malaria-endemic regions. Sensitivity analysis reveals that parameters such as the biting rate of mosquitoes and the probability of transmission from individuals undergoing traditional medicine treatment to susceptible mosquitoes are highly sensitive to changes in reproduction number. This suggests that interventions targeting these parameters could be particularly effective in reducing malaria transmission. Moreover, from our sensitivity results, we can observe that the value of the transmission of infection from Ih to Sm(α1m = 0.0990734), transmission of infection from Ts to Sm(α2m = 0.359975) and transmission of infection from Im to Sh (βmh = 0.5) implies that they increase the reproduction number. This means that the positive parameter values increase the reproduction number when they are increased, while the negative parameter values decrease the reproduction number when they are increased.
Numerical simulations demonstrate that increasing the treatment rate at health facilities leads to a rapid decline in the infectious human population, potentially eliminating the disease. In contrast, reliance on traditional medicine without proper clinical validation can prolong the disease's persistence and can take a long time to eradicate. The study also explores the role of awareness campaigns in reducing the use of inappropriate traditional medicines. Increasing the progression rate from traditional medicine treatment to health facility treatment significantly reduces the population relying on traditional remedies, thereby decreasing the infectious human population. This highlights the importance of public health campaigns in guiding individuals toward clinically validated treatments. Optimal control analysis further emphasizes that a combination of control strategies—ITNs, antimalarial drug treatment, and awareness campaigns—is the most effective approach to combating malaria. The simulations show that implementing all three controls simultaneously leads to a faster reduction in the number of infected individuals and mosquitoes compared to using any single control measure. This finding aligns with previous studies that advocate for integrated control strategies to achieve malaria eradication.
The study highlights the importance of healthcare facilities in malaria control, highlighting the need for increased treatment rates to reduce the basic reproduction number and accelerate the decline in the infectious human population. Traditional medicine, widely used in malaria-endemic regions, faces challenges due to its lack of clinical validation and standardized dosage. Relying on traditional remedies can prolong malaria's persistence, emphasizing the need for consultation with healthcare professionals. Public health campaigns to discourage inappropriate use of traditional medicine and promote clinically validated treatments are crucial. Integrated control strategies, including the use of insecticide-treated bed nets (ITNs), antimalarial drug treatment, and awareness campaigns, are the most effective approach to malaria control. Implementing these strategies simultaneously leads to a faster and more substantial reduction in malaria transmission compared to using any single intervention.
The study suggests that public health policies in malaria-endemic regions should focus on strengthening healthcare infrastructure, regulating traditional medicine, intensifying public health campaigns, and adopting integrated malaria control programs. These include expanding healthcare facilities, ensuring access to antimalarial treatments, and promoting collaboration between traditional practitioners and modern healthcare providers. This holistic approach is more likely to achieve sustainable malaria eradication.
8 Limitations of the study
While this Study provides valuable insights, it has some limitations. The model assumes homogeneous mixing within the population, which may not fully capture the complexities of real-world malaria transmission. Additionally, the study relies on parameter values from existing literature, which may not fully reflect the specific conditions of all malaria-endemic regions. Finally, this study is considered deterministic and governed by a system of integer-order ordinary differential equations. Considering the dynamics of malaria transmission with fractional-order approaches to investigate the memory effect and cost-effectiveness analysis is our future study.
Data availability statement
The original contributions presented in the study are included in the article/Supplementary material, further inquiries can be directed to the corresponding author.
Ethics statement
Written informed consent was obtained from all individuals and, where applicable, from the legal guardians or next of kin of minors, for the publication of any potentially identifiable images or data included in this article.
Author contributions
SJ: Conceptualization, Data curation, Funding acquisition, Investigation, Methodology, Resources, Software, Visualization, Writing – original draft. GD: Formal analysis, Investigation, Methodology, Supervision, Validation, Visualization, Writing – review & editing. CD: Conceptualization, Formal analysis, Project administration, Supervision, Validation, Writing – review & editing.
Funding
The author(s) declare that no financial support was received for the research and/or publication of this article.
Conflict of interest
The authors declare that the research was conducted in the absence of any commercial or financial relationships that could be construed as a potential conflict of interest.
Generative AI statement
The author(s) declare that no Gen AI was used in the creation of this manuscript.
Publisher's note
All claims expressed in this article are solely those of the authors and do not necessarily represent those of their affiliated organizations, or those of the publisher, the editors and the reviewers. Any product that may be evaluated in this article, or claim that may be made by its manufacturer, is not guaranteed or endorsed by the publisher.
Supplementary material
The Supplementary Material for this article can be found online at: https://www.frontiersin.org/articles/10.3389/fams.2025.1552384/full#supplementary-material
Footnotes
References
1. Pucca MB, de Sousa TN, Cardoso de Melo G, Viana GMR. Challenges for diagnosis, treatment, and elimination of malaria. Front Trop Dis. (2024) 5:1394693. doi: 10.3389/fitd.2024.1394693
3. Life Cycle of Culex Mosquitoes-CDC. Available online at: https://www.cdc.gov/mosquitoes/about/life-cycle-of-culex-mosquitoes.html#:~:text=Adult%20female%20Culex%20mosquitoes%20lay,develop%20into%20adult%2C%20flying%20mosquitoes
4. Urama CE, Manasseh CO, Ukwueze ER, Ogbuabor JE. Choices and determinants of malaria treatment seeking behaviour by rural households in Enugu state, South-East Nigeria. Int J Health Promot Educ. (2021) 59:156–73.
5. Kumar A, Kumar M, Nilam A. A study on the stability behavior of an epidemic model with ratio- dependent incidence and saturated treatment. Theory in Biosci. (2020) 139:225–34. doi: 10.1007/s12064-020-00314-6
6. World Health Organization. Global Technical Strategy for Malaria 2016–2030. World Health Organization (2015).
7. Hsu E. Reflections on the ‘discovery' of the antimalarial qinghao. Br J Clin Pharmacol. (2006) 61:666–70. doi: 10.1111/j.1365-2125.2006.02673.x
8. Teng WC, Kiat HH, Suwanarusk R, Koh HL. Medicinal Plants and Malaria: Applications, Trends, Prospects. Boca Raton, FL: CRC Press. (2016).
9. Akilimali A, Bisimwa C, Aborode AT, Biamba C, Sironge L, Balume A, et al. Self-medication and anti-malarial drug resistance in the Democratic Republic of the Congo (DRC): a silent threat. Trop Med Health. (2022) 50:73. doi: 10.1186/s41182-022-00466-9
10. Noronha M, Pawar V, Prajapati A, Subramanian RB. A literature review on traditional herbal medicines for malaria. South Afric J Botany. (2020) 128:292–303. doi: 10.1016/j.sajb.2019.11.017
11. Benzie IFF, Watchel-Galor S. Herbal Medicine: an introduction to its history, usage, regulation, current trends, research needs. Herbal Med. (2011) 464:b10787. doi: 10.1201/b10787
12. Appiah EO, Appiah S, Oti-Boadi E, Oppong-Besse A, Awuah DB, Asiedu PO, et al. Practices of herbal management of malaria among trading mothers in Shai Osudoku District, Accra. PLoS ONE. (2022) 17:e0271669. doi: 10.1371/journal.pone.0271669
15. Gebremichael SM, Mekonnen TT. Relapse effect on the dynamics of malaria in humans and mosquitoes: a mathematical model analysis. IOSR J Mathemat. (2019) 15:46–59.
16. Olaniyi S, Falowo OD, Okosun KO, Mukamuri M, Obabiyi OS, Adepoju OA. Effect of saturated treatment on malaria spread with optimal intervention. Alexandria Eng J. (2023) 65:443–59. doi: 10.1016/j.aej.2022.09.024
17. Woldegerima WA, Ouifki R, Banasiak J. Mathematical analysis of the impact of transmission-blocking drugs on the population dynamics of malaria. Appl Math Comput. (2021) 400:126005. doi: 10.1016/j.amc.2021.126005
18. Bakary T, Boureima S, Sado T. A mathematical model of malaria transmission in a periodic environment. J. Biol. Dynam. (2018) 12:400–32. doi: 10.1080/17513758.2018.1468935
19. Elakhe OA, Isere AO, Akerejola RF. Mathematical model of malaria transmission with anti-malarial herbal therapy as control. Studies (2023) 6:1–16. doi: 10.52589/AJMSS-1276JR4U
20. Haringo AT, Obsu LL, Bushu FK. A mathematical model of malaria transmission with media-awareness and treatment interventions. J Appl Mathemat Comp. (2024) 2024:1–39. doi: 10.1007/s12190-024-02154-9
21. Collins OC, Duffy KJ. A mathematical model for the dynamics and control of malaria in Nigeria. Infectious Dis Model. (2022) 7:728–41. doi: 10.1016/j.idm.2022.10.005
22. Abioye AI, Ibrahim MO, Peter OJ, Ogunseye HA. Optimal control on a mathematical model of malaria. Sci Bull, Series A: Appl Math Phy. (2020) 82:177–90.
23. Keno TD, Dano LB, Makinde OD. Modeling optimal control analysis for malaria transmission with role of climate variability. Computat Mathemat Methods. (2022) 2022:9667396. doi: 10.1155/2022/9667396
24. Olaniyi S, Okosun KO, Adesanya SO, Lebelo RS. Modelling malaria dynamics with partial immunity and protected travellers: optimal control and cost-effectiveness analysis. J Biol Dyn. (2020) 14:90–115. doi: 10.1080/17513758.2020.1722265
25. Tchoumi SY, Chukwu CW, Diagne ML, Rwezaura H, Juga ML, Tchuenche JM. Optimal control of a two-group malaria transmission model with vaccination. Netw Model Analy Health Inform Bioinform. (2022) 12:7. doi: 10.1007/s13721-022-00403-0
26. Graz B, Kitua AY, Malebo HM. To what extent can traditional medicine contribute a complementary or alternative solution to malaria control programmes?. Malaria J. (2011) 10:1–7. doi: 10.1186/1475-2875-10-S1-S6
27. Prakash Raj M, Venkatesh A, Arun Kumar K, Manivel M. Mathematical modeling of the co-infection dynamics of dengue and malaria using delay differential equations. Adv Theor Simul. (2024) 2400609.
28. Jin X, Jin S, Gao D. Mathematical analysis of the Ross–Macdonald model with quarantine. Bull Math Biol. (2020) 82:47. doi: 10.1007/s11538-020-00723-0
29. Alyobi S, Jan R. Qualitative quantitative analysis of fractional dynamics of infectious diseases with control measures. Fractal Fract. (2023) 7:400. doi: 10.3390/fractalfract7050400
30. Jan R, Razak NNA, Boulaaras S, Rehman ZU, Bahramand S. Mathematical analysis of the transmission dynamics of viral infection with effective control policies via fractional derivative. Nonlinear Eng. (2023) 12:20220342. doi: 10.1515/nleng-2022-0342
31. Deebani W, Jan R, Shah Z, Vrinceanu N, Racheriu M. Modeling the transmission phenomena of water-borne disease with non-singular and non-local kernel. Comput Methods Biomech Biomed Engin. (2023) 26:1294–307. doi: 10.1080/10255842.2022.2114793
32. Perko L. Differential Equations and Dynamical Systems. Cham: Springer Science and Business Media. (2013).
33. Tumwiine J, Mugisha JYT, Luboobi LS. A mathematical model for the dynamics of malaria in a human host and mosquito vector with temporary immunity. Appl Math Comput. (2007) 189:1953–65. doi: 10.1016/j.amc.2006.12.084
34. Alshehri A, Shah Z, Jan R. Mathematical study of the dynamics of lymphatic filariasis infection via fractional-calculus. Eur Phys J Plus. (2023) 138:1–15. doi: 10.1140/epjp/s13360-023-03881-x
35. Castillo-Chavez C, Feng Z, Huang W. On the computation of R0 and its role on global stability. In: Castillo-Chávez C, van den Dreissche P, Kirschner D, Yakubu A, editor. Mathematical Approaches for Emerging and Reemerging Infectious Diseases: An Introduction. (2002).
36. Jan R, Boulaaras S, Alyobi S, Jawad M. Transmission dynamics of Hand–Foot–Mouth Disease with partial immunity through non-integer derivative. Int J Biomathem. (2023) 16:2250115. doi: 10.1142/S1793524522501157
37. Allen LJ, Brauer F, Van den Driessche P, Wu J. Mathematical Epidemiology. Berlin: Springer. (2008).
38. Jan R, Hinçal E, Hosseini K, Razak NNA, Abdeljawad T, Osman MS. Fractional view analysis of the impact of vaccination on the dynamics of a viral infection. Alexandria Eng J. (2024) 102:36–48. doi: 10.1016/j.aej.2024.05.080
39. Van den Driessche P, Watmough J. Reproduction numbers and sub-threshold endemic equilibria for compartmental models of disease transmission. Math Biosci. (2002) 180:29–48. doi: 10.1016/S0025-5564(02)00108-6
40. Deressa CT, Mussa YO, Duressa GF. Optimal control and sensitivity analysis for transmission dynamics of Coronavirus. Results Phys. (2020) 19:103642. doi: 10.1016/j.rinp.2020.103642
41. Tang TQ, Jan R, Khurshaid A, Shah Z, Vrinceanu N, Racheriu M. Analysis of the dynamics of a vector-borne infection with the effect of imperfect vaccination from a fractional perspective. Sci Rep. (2023) 13:14398. doi: 10.1038/s41598-023-41440-7
42. Chitnis N, Hyman JM, Cushing JM. Determining important parameters in the spread of malaria through the sensitivity analysis of a mathematical model. Bull Math Biol. (2008) 70:1272–96. doi: 10.1007/s11538-008-9299-0
43. Mangongo YT, Bukweli JDK, Kampempe JDB, Mabela RM, Munganga JMW. Stability global sensitivity analysis of the transmission dynamics of malaria with relapse and ignorant infected humans. Physica Scripta. (2022) 97:024002. doi: 10.1088/1402-4896/ac4862
44. Aldila D, Angelina M. Optimal control problem and backward bifurcation on malaria transmission with vector bias. Heliyon. (2021) 7:4. doi: 10.1016/j.heliyon.2021.e06824
45. Kotola BS Teklu SW Abebaw Abebaw YF Bifurcation optimal control analysis of HIV/AIDS and COVID-19 co-infection model with numerical simulation. PLoS ONE. (2023) 18:e0284759. doi: 10.1371/journal.pone.0284759
46. Okosun KO, Makinde OD. A co-infection model of malaria and cholera diseases with optimal control. Math Biosci. (2014) 258:19–32. doi: 10.1016/j.mbs.2014.09.008
47. Ouattara L, Ouedraogo D, Diop O, Guiro A. Analysis and optimal control of a mathematical model of malaria. Nonlinear Dyn Syst Theory. (2024) 24.
49. Agusto FB. Optimal control and temperature variations of malaria transmission dynamics. Complexity. (2020) 2020:5056432. doi: 10.1155/2020/5056432
50. Fleming WH, Rishel RW. Deterministic and Stochastic Optimal Control. Cham: Springer Science and Business Media. (2012).
Keywords: malaria, health facility, traditional medicine, sensitivity analysis, optimal control
Citation: Jaleta SF, Duressa GF and Deressa CT (2025) A mathematical modeling and optimal control analysis of the effect of treatment-seeking behaviors on the spread of malaria. Front. Appl. Math. Stat. 11:1552384. doi: 10.3389/fams.2025.1552384
Received: 27 December 2024; Accepted: 26 February 2025;
Published: 21 March 2025.
Edited by:
Stephen E. Moore, University of Cape Coast, GhanaReviewed by:
Rashid Jan, University of Swabi, PakistanEric Okyere, University of Energy and Natural Resources, Ghana
Walter Okongo, Pan African University Institute of Basic Sciences, Technology and Innovation, Kenya
Copyright © 2025 Jaleta, Duressa and Deressa. This is an open-access article distributed under the terms of the Creative Commons Attribution License (CC BY). The use, distribution or reproduction in other forums is permitted, provided the original author(s) and the copyright owner(s) are credited and that the original publication in this journal is cited, in accordance with accepted academic practice. No use, distribution or reproduction is permitted which does not comply with these terms.
*Correspondence: Sisay Fikadu Jaleta, sisayfikadu28@gmail.com