
94% of researchers rate our articles as excellent or good
Learn more about the work of our research integrity team to safeguard the quality of each article we publish.
Find out more
ORIGINAL RESEARCH article
Front. Appl. Math. Stat., 19 March 2025
Sec. Dynamical Systems
Volume 11 - 2025 | https://doi.org/10.3389/fams.2025.1530570
This article is part of the Research TopicAdvances in Mathematical Biology and Medicine: Modeling, Analysis, and Numerical SolutionsView all 6 articles
 Sou Nobukawa1,2,3,4*
 Kurnianingsih5
 Isshu Wakita1
 Ayumu Ueno1
 Melyana Nurul Widyawati6
 Cipta Pramana7
 Nurseno Bayu Aji5
 Afandi Nur Aziz Thohari5
 Dwiana Hendrawati8
 Eri Sato-Shimokawara9
 Naoyuki Kubota9
Introduction: In neonates, the early detection of asphyxia improves survival rates and prevents long-term complications. In neonatal care, physiological signals, including heart rate and oxygen saturation, are routinely monitored. However, neonates with neurological conditions such as hypoxic-ischemic encephalopathy (HIE) require direct neural monitoring. Electroencephalography (EEG) is a non-invasive method for assessing neural activity and therefore can effectively detect early signs of asphyxia. Although studies on HIE have utilized clinical-grade EEG systems, the real-world application of wearable EEG devices in broader neonatal care remains underexplored. In this study, we aimed to investigate the effectiveness of wearable EEG devices in detecting asphyxia without restricting its progression to hypoxic-ischemic encephalopathy (HIE).
Methods: We used Fuzzy Entropy (FuzzyEn) to perform power spectral and complexity analyses on EEG signal data healthy neonates and those with asphyxia.
Results: We found that both delta band power and EEG signal complexity decrease in neonates with asphyxia, which is consistent with those of studies on HIE. Furthermore, FuzzyEn in combination with absolute power measurements captured complementary information that led to improved detection accuracy and enhanced identification performance.
Discussion: Wearable EEG devices are scalable and accessible for use in resource-constrained environments (such as rural and developing regions) and can be integrated into Internet of Things (IoT) systems. Our findings highlight the potential of wearable EEG devices in early detection of asphyxia, which may contribute to a more effective neonatal care and improved survival outcomes.
In neonates, physiological monitoring helps detect diseases immediately after birth and promptly intervene, if necessary. This allows for improved survival rate and reduced risk of long-term sequelae [1] [as reviewed in [2, 3]]. The importance of monitoring physiological parameters such as heart rate (HR), respiration rate (RR), and blood oxygen saturation (SpO2), in a specialized hospital environment [4] is widely recognized [reviewed in [5, 6]]. Furthermore, the use of simple and accessible devices, commonly referred to as Internet of Things (IoT) devices, may help reduce demands on neonatal intensive care units (NICUs) [7] and assist regions with rapid population growth, in rural areas, or in island nations with limited medical resources [8, 9].
Among all neonatal physiological signals, electroencephalography (EEG) demonstrates a particularly high clinical utility because it directly reflects neural activity; therefore, EEG can be used to efficiently detect neurological diseases [10]. Several studies have explored its application in neonates [10–13]. Studies have investigated the associations between EEG patterns and conditions such as intraventricular hemorrhage, necrotizing enterocolitis, preterm prolonged rupture of membranes, persistent pulmonary hypertension of the newborn, and hypoxic-ischemic encephalopathy (HIE). HIE–which can develop from asphyxia–is particularly prevalent among neonates, and neural activity in the delta frequency band is associated with increased disease severity [10, 13]. However, most studies on asphyxia have utilized long-term EEG readings obtained immediately after birth using advanced EEG equipment designed for medical institutions [13, 14]. Therefore, novel techniques that can capture HIE-associated EEG patterns in shorter measurement times using simpler and more accessible EEG devices are crucial.
One limitation of simple EEG devices, typified as wearable EEG devices, is the limited number of electrodes. Therefore, the use of metrics that can overcome this limitation, even in low-density EEG systems, is essential. One promising candidate is the complexity measure for time-series patterns in EEG signals [reviewed in [15]]. Over the past few decades, several complexity metrics, including fractal dimensions [16], entropy, and others that are used to calculate complexities across multiple time scales [17–19], have been adopted in both healthy and pathological conditions. These complexity measures can be calculated from the time-series of a single electrode and reflect neural activity across different brain regions, as demonstrated in studies that combined complexity analysis and functional network analysis [19–21]. Therefore, even with low-density EEG systems, complexity measures may capture activity in broader areas of the brain. Additionally, identifying disease-specific patterns over shorter timescales—rather than relying on fluctuations over hours—could significantly improve the practical utilities of these measurements. Studies that investigated the application of complexity metrics for newborns in the context of HIE indicate that neonates who later develop HIE exhibit lower EEG signal complexity than their healthy counterparts [22, 23]. Moreover, this reduced complexity correlates with the degree of cognitive decline observed when the patients are two years old [23]. However, to prevent the progression of asphyxia to HIE, we should focus on cases of severe asphyxia that transition to HIE and also detect earlier stages of asphyxia that indicate the pre-stage of HIE. Moreover, these studies have used clinical-grade EEG systems [22, 23]. In situations where clinical resources are limited, the use of wearable EEG devices—which can be implemented in IoT systems—should be considered a viable alternative [8, 9].
Therefore, in this study, we aimed to derive a complexity metric that can be employed to monitor the degree of asphyxia using data from a simple, low-density, wearable EEG device, especially in settings with limited medical resources. Specifically, EEG data of healthy neonates and those with asphyxia of varying severity were collected and analyzed by medical institutions in Indonesia. The conceptual overview of the study design was demonstrated in Figure 1. First, epochs of 20 seconds each with minimal artifacts were extracted, and multiscale complexity analysis was applied to these epochs to explore the association between the complexity of EEG data and asphyxia at different time scales.
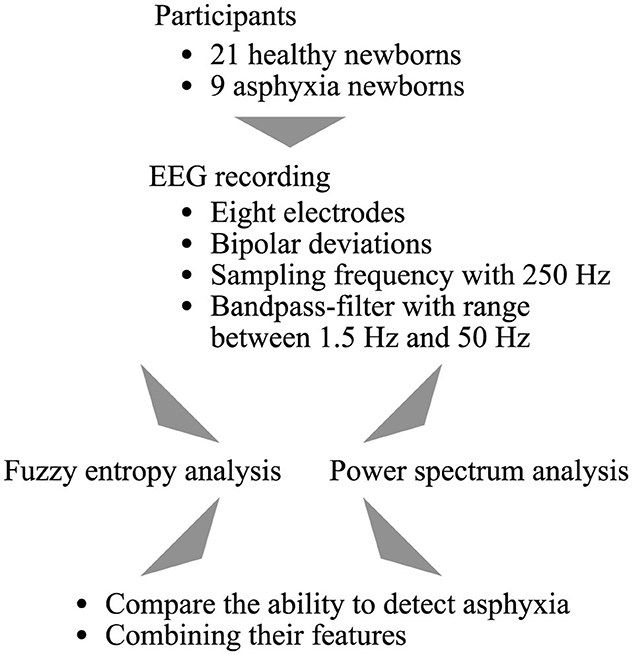
Figure 1. Conceptual overview of the study design.
One of the most fundamental and historically established methods for evaluating neural activity in the brain is power spectrum analysis. This method can capture changes in neural networks associated with aging [24], development [25–27], and pathological conditions [17] through variations in the spectral components [reviewed in [28]]. Interactions across regions in the brain lead to the maturity of neural networks, which results in the emergence of faster components such as theta, alpha, beta, and gamma bands [25–27]. However, neonates and infants predominantly exhibit delta band activity, which reflects the immaturity of the brain and is commonly observed during both wakefulness and sleep stages [26]. In cases of neonatal encephalopathy, the decreased delta band power and the shape of the power spectrum profile in the delta frequency band correlate with increased disease severity [10, 12, 13]. Therefore, power spectrum analysis can be considered one of the relatively well-established methods for detecting abnormalities in neonatal neural activity.
The complexity analysis of neural activity signals—captured using EEG or magnetoencephalography—can be used to identify the developmental stage of neural networks in neonates and infants [25, 29]. The complexity of EEG signals at a single electrode reflects the neural interactions. In contrast, functional connectivity measures that assess synchronization between neural activities across regions require data from numerous electrodes to capture these interactions [17, 19, 30]. Therefore, complexity analysis can be particularly advantageous, especially when simple EEG devices with a restricted number of electrodes are used. Over the past several decades, researchers aiming to calculate the complexity of neural activity have proposed several metric types, which include Lyapunov exponnet to evaluate chaotic dynamics [31], fractal dimensions [16], and various types of entropy [17–19]. Sample entropy (SampEn), a widely used metric for assessing the complexity and unpredictability of time-series data [32], works by determining the frequency of recurring similar patterns within the dataset given a specific tolerance level. Lower SampEn values indicate greater regularity, whereas greater SampEn values reflect increased randomness or greater complexity. SampEn is considered to be more reliable than approximate entropy (ApEn) for shorter and noisier data because it excludes self-matching patterns. Fuzzy entropy (FuzzyEn) has been proposed as an alternative to SampEn [33]. While SampEn calculates complexity by binarizing the entropy values, FuzzyEn applies fuzzy logic to represent these values more precisely, thereby avoiding binary simplification. This approach helps minimize information loss [33]. Consequently, FuzzyEn can calculate complexity from an even shorter time-series dataset than that required by SampEn [34].
The complexity analysis of EEG signals in the context of HIE has been extensively explored [8, 9]. Nemomssa et al. demonstrated that in cases of HIE that progress to cerebral palsy, the accuracy of complexity metrics (such as SampEn, permutation entropy, and spectral entropy) that were applied to alpha-band slow components derived through empirical mode decomposition were high [8]. Mbanuzue et al. demonstrated that the decrease in both permutation entropy and spectral entropy within the slow components (corresponding to the delta band) of the EEG signals correlated with the cognitive decline observed when the patients were two years old [9]. Both studies found that the topological characteristics of functional connectivity (e.g., radius, transitivity, global efficiency, and characteristic path length) strongly correlated with their corresponding EEG signal components [8, 9]. Therefore, complexity analysis has been extensively utilized to capture the alternation of neural activity patterns associated with HIE, and thereby has significantly advanced current research.
Although complexity analysis of EEG signals has been extensively explored in the context of HIE [8, 9], it has not yet been applied to the detection of asphyxia, which represents an earlier stage before the onset of HIE. Given that early intervention is critical in improving neonatal outcomes, addressing complexity analysis at the asphyxia stage is essential for developing early detection methods. Furthermore, no prior studies have combined complexity analysis with the well-established EEG power spectrum analysis. Leveraging multiple metrics from the same physiological signal to enhance detection performance has been proposed in other fields [17, 28, 35], and applying such an approach to the complexity and power analysis of EEG signals in asphyxia represents a promising avenue for improving detection accuracy.
We collected data from 30 neonates—21 healthy newborns and nine with asphyxia—from the Department of Neonatology at the pediatric intensive care unit (PICU) and NICU of K.R.M.T. Wongsonegoro Regional Public Hospital. The nine neonates with asphyxia constituted the clinical group. We diagnosed the neonates with asphyxia on the basis of the criteria outlined by the American College of Obstetrics and Gynaecology (ACOG), American Academy of Pediatrics (AAP), and World Health Organization. The asphyxia group comprised two mild, five moderate, and two severe cases. No neonate with asphyxia exhibited HIE. In contrast, the sex-, weight-, and age-matched control group comprised 21 neonates with no reported history of neuropsychiatric disorders. Table 1 presents the demographic characteristics of both groups. This study was conducted in accordance with ethical standards to ensure the safety, privacy, and wellbeing of all participants involved. Ethical approval was obtained from the KRMT Wongsonegoro Regional Public Hospital (approval number 093/Kom.EtikRSWN/VII/2024), granted on July 26, 2024. This study adhered to all relevant ethical guidelines, including informed consent from the participants, confidentiality of data, and ensuring that the participants were not exposed to unnecessary risks. All procedures were reviewed to ensure alignment with both national and international ethical standards for research involving human participants.
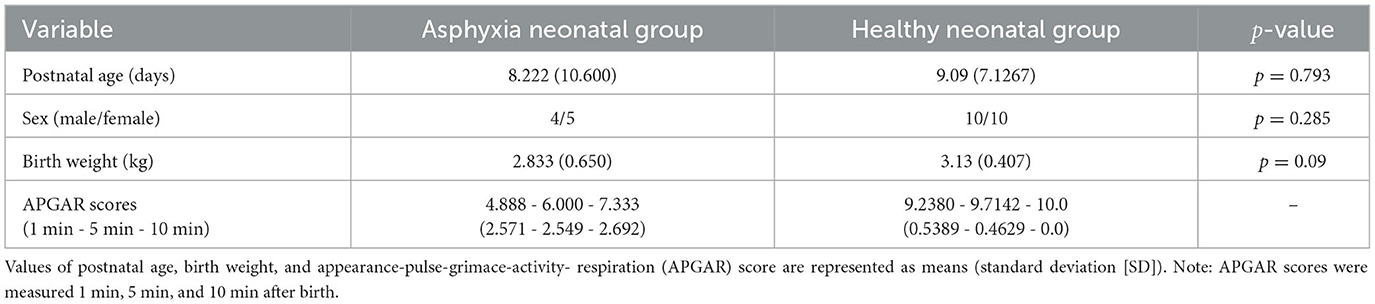
Table 1. Demographic data of asphyxia and control groups.
EEGs were recorded using a Neuro-DCcap EEG system (East Medic Corporation, Kanazawa City, Japan) that was developed for basic medical research. The EEG system consists of eight electrodes (F3, F4, C3, C4, P1, P2, O1, and O2) and a reference electrode positioned at Fz. Standard bipolar derivations (F3-C3, C3-P3, P3-O1, F4-C4, C4-P4, and P4-O2) were employed. The impedance of each electrode was maintained at below 40 KΩ. The EEG data were sampled at 250 Hz and bandpass-filtered between 1.5 and 50 Hz.
The EEG data were recorded for 30–60 min. Following data acquisition, segments of the EEG recordings were processed using the artifact subspace reconstruction (ASR) algorithm in the EEGLAB toolbox; the algorithm identified and removed artifacts; moreover, we selected a continuous 20-second epoch with artifact levels below the threshold for further analysis. In total, we obtained one, two, and three epochs from one, 15, and 14 neonates, respectively.
FuzzyEn improves upon SampEn by utilizing a Gaussian function instead of the Heaviside function to measure vector similarity. Therefore, FuzzyEn assesses the complexity of physiological time-series signals with increased accuracy, surpassing the precision of SampEn [36].
The Z-scored time series of the coarse-grained heart rate data, denoted by the m-dimensional vector , is represented as , where i refers to the time step, is average of in i ≤ k ≤ i + m + 1, and τ is the scale factor. The similarity between two vectors, , is determined using the following exponential function:
Here, represents the maximum distance between and , r is the tolerance, and n is the gradient. The function Φm is expressed as:
The fuzzy entropy was then calculated based on Φm(n, r) using the following equation:
Coarse-graining of the time series data by a scale factor τ is represented as:
where ui (i = 1, 2, ..., N) denotes the observed EEG signal. In multiscale fuzzy entropy analysis, the entropy for the coarse-grained time series is computed at each scale τ. In this study, we used m = 2 and r = 0.2 [36].
In addition to the complexity analysis, we performed power spectral analysis using the EEG signal data. We first calculated the power spectral density (PSD) (dB/Hz), and subsequently used it to calculate the total absolute power in the delta (2–4 Hz) band, using Welch's method for power spectrum estimation. A Hanning window was applied to the 20-second time series for the calculation.
For the FuzzyEn analysis, we conducted a repeated-measures analysis of variance (ANOVA). The group (healthy neonates vs. neonates with asphyxia) served as a between-participant factor; six electrode pairs and 30 temporal scales as within-participant factors. The Greenhouse–Geisser correction was applied to account for sphericity violations, and statistical significance was set at an α level of 0.05. The F-values obtained from the ANOVA reflect the comparison of variance within and between the groups. Post-hoc t-tests were used to further explore the effects of each group and interactions across the electrode pairs and temporal scales. The Benjamini–Hochberg false discovery rate (FDR) correction was applied to control for multiple comparisons across the 180 p-values generated from the six electrode pairs and 30 temporal scales (q < 0.05).
To analyze absolute power, we performed repeated-measures ANOVA again, with group (healthy neonates vs. neonates with asphyxia) as the between-participant factor and six electrode pairs as within-participant factors. Greenhouse-Geisser correction and an α level of 0.05 were applied again. The F-values obtained from the ANOVA reflect the comparison of variances between and within groups. Post hoc t-tests were used to assess the differences between groups and interactions across the electrodes. Log-transformed absolute powers were used to assume normal distribution. To account for multiple comparisons, FDR correction was also applied to the six p-values generated from the six electrode pairs (q < 0.05).
Receiver operating characteristic (ROC) curve analysis was performed to assess the ability of the model to distinguish asphyxia. A logistic regression model incorporating FuzzyEn and absolute power was developed to predict the probability of asphyxia for each participant. True- and false-positive rates were calculated for a threshold range (0–1.0) across both groups. The identification accuracy was quantified using the area under the ROC curve (AUC), with AUC values serving as indicators of classification performance. A logistic regression model based on FuzzyEn, absolute power, and their combination was used to evaluate the classification accuracy, where an AUC of 1.0 indicates perfect identification, and an AUC of 0.5 corresponds to chance-level identification. Here, a leave-one-out cross-validation (LOOCV) was used [37]. Pearson's correlation r between FuzzyEn and absolute power was used for multicollinearity in the logistic regression. As the multicollinearity criterion, |r| > 0.9 was set.
We compared the FuzzyEn between the asphyxia and control groups at each temporal scale τ and for each electrode pair. Figure 2A shows the dependence of FuzzyEn on the temporal scale τ across electrode pairs in both control and asphyxia groups. Table 2 presents the results of the repeated-measures ANOVA for FuzzyEn. The analysis revealed a significant main-group effect, and no interaction effects were observed for group × electrode-pair, group × scale, and group × electrode-pair × scale. Figure 2B shows the dependence of t-value on temporal scale τ as the post-hoc t-test. These results confirmed the significantly smaller FuzzyEn in the asphyxia group, in particular, in 1 ≤ τ ≤ 30 at P3-O1 (q < 0.05).
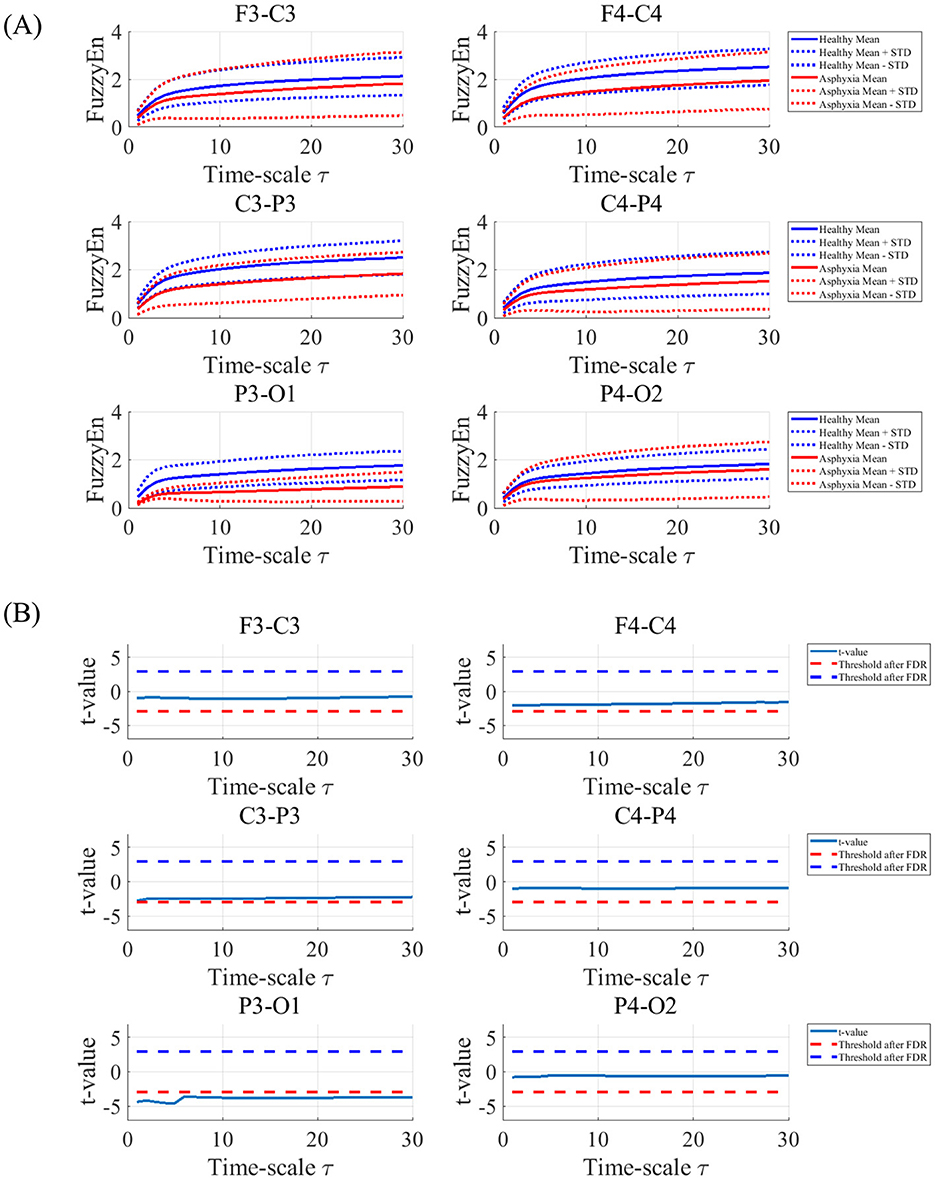
Figure 2. (A) Dependence of Fuzzy Entropy (FuzzyEn) on the temporal scale τ at electrode pairs (F3-C3, C3-P3, P3-O1, F4-C4, C4-P4, and P4-O2) in control and asphyxia groups. Solid and dashed lines represent the mean and standard deviation (SD) for each group, respectively. (B) Dependence of t-value on temporal scale τ between control and asphyxia groups. Negative t-value corresponds to lower FuzzyEn value of asphyxia group than in the control group. The results showed the significantly smaller FuzzyEn in the asphyxia group, in particular, in 1 ≤ τ ≤ 30 at P3-O1.
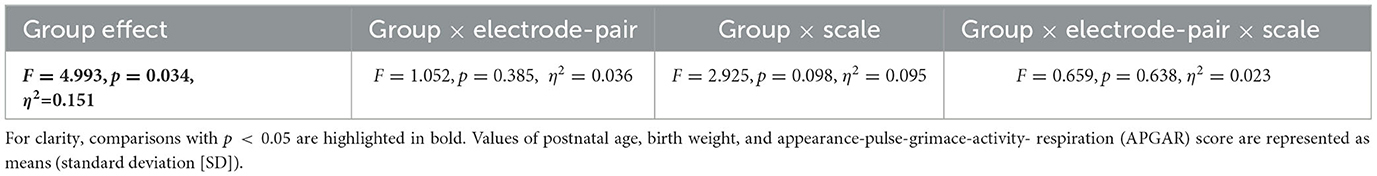
Table 2. Repeated-measures analysis of variance (ANOVA) for Fuzzy Entropy (FuzzyEn) comparing the control and asphyxia groups.
To compare our method with the relatively well-established power spectrum analysis used for detecting abnormalities in neonatal neural activity [10, 12, 13], we compared the absolute power of the delta band between the asphyxia and control groups for each electrode pair. Figure 3A shows the dependence of the absolute power of the delta band across electrode pairs in the control and asphyxiated groups. Table 3 presents the results of the repeated-measures ANOVA for these powers. We observed a significant main-group effect but no interaction effect for group × electrode-pair. In Figure 3B, as their post-hoc t-test, t-values of absolute power between the both groups among electrode-pairs were shown. These results indicated the significantly smaller absolute power at F4-C4, C3-P3, and P3-O1 in the asphyxia group (q < 0.05).

Figure 3. (A) Absolute power of delta band at electrode pairs (F3-C3, C3-P3, P3-O1, F4-C4, C4-P4, and P4-O2) in the control and asphyxia groups. Each solid dot represents the value of each participant. Plus symbol and error bar exhibit the mean and standard deviation (SD) in each group. (B) t-values of absolute power across electrode-pairs between the both groups. Negative t-value indicates that the absolute power of the asphyxia group is lower than that of the control group. The results indicate that significantly smaller absolute power at F4-C4, C3-P3, and P3-O1 in the asphyxia group was (q < 0.05).
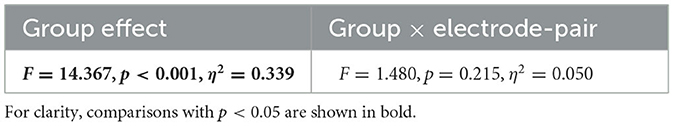
Table 3. Repeated-measures ANOVA results for absolute power of delta band comparing control and asphyxia groups.
The logistic regression model identified asphyxia using a significant reduction in FuzzyEn at P3-O1 shown in Figure 2B and absolute power at F4-C4, C3-P3, and P3-O1 shown in Figure 3B. Figure 4 showed the ROC for classifiers of controls and asphyxia groups by logistic regression based on the averaged FuzzyEn in temporal-scale range 1 ≤ τ ≤ 10 at P3-O1 and absolute power at F4-C4, C3-P3, and P3-O1. AUC was enhanced by the combination of FuzzyEn and absolute power when compared with cases that used them separately. Considering that the current asphyxia group includes relatively few participants in comparison with healthy group, evaluation for precision-recall curve, which places more emphasis on detecting asphyxia cases, is important. The result shown in Supplementary material demonstrated that the same tendency with the case using ROC was obtained.
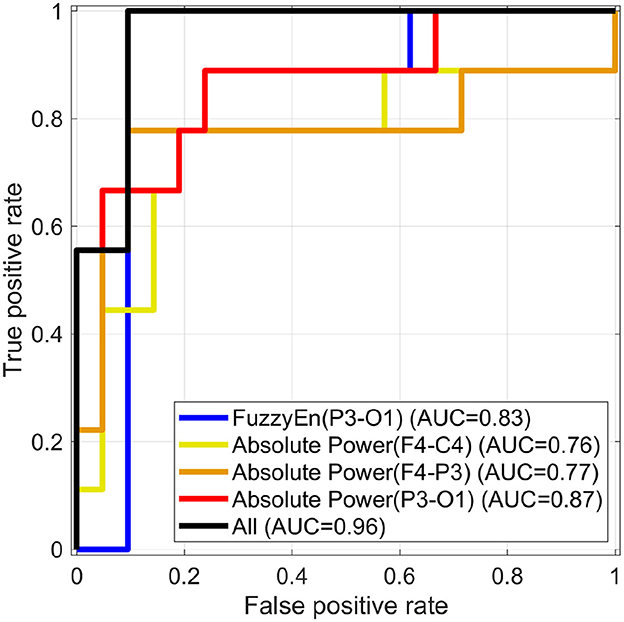
Figure 4. Receiver operating characteristic curves (ROC) for classifiers of control and asphyxia groups by logistic regression based on average of values for FuzzyEn at P3-O1 in the temporal scale range 1 ≤ τ ≤ 10 and absolute powers at F3-C4, C3-P3, and P3-O1. The area under the ROC (AUC) was enhanced by the combination of FuzzyEn and absolute powers (notated by “All”) in comparison with cases that used them separately. Here, the correlations among averaged FuzzyEn and absolute power are lower than the criteria of multicollinearity.
In this study, we aimed to identify the characteristics of EEG signals asphyxia neonates not restricting severe cases of asphyxia that transition into HIE, we applied the complexity analysis with FuzzyEn to EEG signals in healthy and asphyxia groups in addition to the power spectral analysis. As the results, the power components of delta band in EEG signals decreases and the complexity of EEG signals decreases among electrodes-pairs.
Studies on HIE have indicated a decrease in power and complexity owing to reduced neural activity and interactions, and the application of these findings as biomarkers for HIE has advanced [8, 9, 22, 23]. In contrast, this study utilized a wearable EEG device—which can be used under more restricted conditions of medical institutions than traditional medical EEG devices—to analyze power and complexity in a group of neonates with asphyxia and not limit to cases progressing to HIE. Similar reductions in complexity and power were observed, which is consistent with the results of previous studies [8, 9, 22, 23]. This suggests that similar changes in complexity and power occur even in asphyxia and do not restrict the progression to HIE. Therefore, the analysis of power and complexity using wearable EEG may contribute to the early detection of conditions such as HIE and cerebral palsy, and its application to IoT devices that can be used in constrained medical environments is expected in the future.
We also found that the combination of FuzzyEn and absolute power measurements enhanced the ability to detect asphyxia compared with using either metric alone. This improvement may stem from the fact that complexity metrics such as SampEn and FuzzyEn, capture richer time-series information, including phase components, which complement power-based measures [24]. Integration of these complementary metrics can strengthen the diagnostic capability and contribute to the establishment of robust biomarkers for early asphyxia detection. Moreover, an advantage of FuzzyEn over SampEn, another commonly used complexity metric [28], is that FuzzyEn employs a Gaussian function instead of the Heaviside function to measure vector similarity of time-series given by Equation 1, allowing for reliable calculation even with a small number of samples or short time-series data [36]. This is a significant advantage in resource-limited medical settings where obtaining artifact-free epochs is difficult.
This study has some limitations. First, we evaluated EEG power and complexity using a small sample size, which may limit the generalizability of the results. A larger sample, such as a large cohort, could provide more robust evidence and enable a more precise assessment of asphyxia severity. Second, in addition to the cohort study, the long-term follow-up study is needed to evaluate the impact of early detection on long-term neurodevelopmental outcomes. Third, although we applied bandpass filtering in this study, alternative methods for analyzing nonstationary and highly nonlinear time-series signals, such as empirical mode decomposition, may be more appropriate. Fourth, in addition to data analysis approaches, modeling neural activity using stochastic processes, deterministic processes, and delay factors [38–40] is also necessary to estimate the factors that induce abnormal neural activity [41–43]. Future research should address these limitations.
To summarize, this study demonstrated that the power and complexity of EEG signals detected using wearable EEG equipment can help identify asphyxia in neonates. Although several limitations remain, this finding supports the potential for developing IoT devices to distinguish between healthy conditions and pathologies in newborns.
The original contributions presented in the study are included in the article/Supplementary material, further inquiries can be directed to the corresponding author.
The studies involving humans were approved by the KRMT Wongsonegoro Regional Public Hospital. The studies were conducted in accordance with the local legislation and institutional requirements. Written informed consent for participation in this study was provided by the participants' legal guardians/next of kin.
SN: Conceptualization, Data curation, Formal analysis, Funding acquisition, Investigation, Methodology, Project administration, Resources, Software, Supervision, Validation, Visualization, Writing – original draft, Writing – review & editing. K: Conceptualization, Data curation, Formal analysis, Funding acquisition, Investigation, Methodology, Project administration, Resources, Software, Supervision, Validation, Visualization, Writing – original draft, Writing – review & editing. IW: Software, Writing – original draft, Writing – review & editing. AU: Software, Writing – original draft, Writing – review & editing. MW: Conceptualization, Data curation, Investigation, Validation, Writing – review & editing. CP: Data curation, Validation, Writing – review & editing. NA: Data curation, Writing – review & editing. AT: Data curation, Writing – review & editing. DH: Data curation, Writing – review & editing. ES-S: Methodology, Validation, Writing – review & editing. NK: Methodology, Validation, Writing – review & editing.
The author(s) declare that financial support was received for the research and/or publication of this article. This work was supported in part by the Ministry of Education, Culture, Research and Technology of the Republic of Indonesia under Grant No. 277/PKS/D.D4/PPK.01.APTV/VII/2024.
The authors declare that the research was conducted in the absence of any commercial or financial relationships that could be construed as a potential conflict of interest.
The author(s) declare that Gen AI was used in the creation of this manuscript. Language editing and proofreading. These tools were utilized to enhance the clarity, coherence, and grammatical accuracy of the text while ensuring that the scientific content and authorship remain entirely original.
All claims expressed in this article are solely those of the authors and do not necessarily represent those of their affiliated organizations, or those of the publisher, the editors and the reviewers. Any product that may be evaluated in this article, or claim that may be made by its manufacturer, is not guaranteed or endorsed by the publisher.
The Supplementary Material for this article can be found online at: https://www.frontiersin.org/articles/10.3389/fams.2025.1530570/full#supplementary-material
1. Iribarren I, Hilario E, Álvarez A, Alonso-Alconada D. Neonatal multiple organ failure after perinatal asphyxia. Anales Pediatría. (2022) 97:280–e1. doi: 10.1016/j.anpede.2022.08.010
2. Anton O, Dore H, Rendon-Morales E, Aviles-Espinosa R, Seddon P, Wertheim D, et al. Non-invasive sensor methods used in monitoring newborn babies after birth, a clinical perspective. Maternal Health, Neonatol Perinatol. (2022) 8:9. doi: 10.1186/s40748-022-00144-y
3. Kareem FQ, Abduallah WM. Real time monitoring and controlling system for newborn babies in the hospital. Eurasian J Sci Eng. (2022) 8:188–203. doi: 10.23918/eajse.v8i3p188
4. Kumar S, Tripathy S, Jyoti A, Singh SG. Recent advances in biosensors for diagnosis and detection of sepsis: a comprehensive review. Biosensors Bioelectr. (2019) 124:205–15. doi: 10.1016/j.bios.2018.10.034
5. Kim J, Yoo S, Liu C, Kwak SS, Walter JR, Xu S, et al. Skin-interfaced wireless biosensors for perinatal and paediatric health. Nat Rev Bioeng. (2023) 1:631–47. doi: 10.1038/s44222-023-00090-0
6. Zhou L, Guess M, Kim KR, Yeo WH. Skin-interfacing wearable biosensors for smart health monitoring of infants and neonates. Commun. Mater. (2024) 5:72. doi: 10.1038/s43246-024-00511-6
7. Cay G, Solanki D, Al Rumon MA, Ravichandran V, Hoffman L, Laptook A, et al. NeoWear: an IoT-connected e-textile wearable for neonatal medical monitoring. Pervasive Mob Comput. (2022) 86:101679. doi: 10.1016/j.pmcj.2022.101679
8. Nemomssa HD, Alemneh TB. Device for remote and realtime monitoring of neonatal vital signs in neonatal intensive care unit using internet of things: proof-of-concept study. J Clin Monit Comput. (2023) 37:585–92. doi: 10.1007/s10877-022-00929-8
9. Mbanuzue C, Hassan O, Owolabi F. Real-Time Monitoring of neonatal incubator parameters via IoT-integrated device: design, implementation, and evaluation. Int J Res Innov Appl Sci. (2024) 9:127–43. doi: 10.51584/IJRIAS.2024.90409
10. Ahmed R, Temko A, Marnane W, Lightbody G, Boylan G. Grading hypoxic-ischemic encephalopathy severity in neonatal EEG using GMM supervectors and the support vector machine. Clin Neurophysiol. (2016) 127:297–309. doi: 10.1016/j.clinph.2015.05.024
11. Rakshasbhuvankar A, Paul S, Nagarajan L, Ghosh S, Rao S. Amplitude-integrated EEG for detection of neonatal seizures: a systematic review. Seizure. (2015) 33:90–8. doi: 10.1016/j.seizure.2015.09.014
12. Garvey AA, Pavel AM, O'Toole JM, Walsh BH, Korotchikova I, Livingstone V, et al. Multichannel EEG abnormalities during the first 6 hours in infants with mild hypoxic-ischaemic encephalopathy. Pediatr Res. (2021) 90:117–24. doi: 10.1038/s41390-021-01412-x
13. O'toole JM, Mathieson SR, Raurale SA, Magarelli F, Marnane WP, Lightbody G, et al. Neonatal EEG graded for severity of background abnormalities in hypoxic-ischaemic encephalopathy. Sci Data. (2023) 10:129. doi: 10.1038/s41597-023-02002-8
14. Montazeri S, Nevalainen P, Metsäranta M, Stevenson NJ, Vanhatalo S. Clinical outcome prediction with an automated EEG trend, Brain State of the Newborn, after perinatal asphyxia. Clin Neurophysiol. (2024) 162:68–76. doi: 10.1016/j.clinph.2024.03.007
15. Takahashi T. Complexity of spontaneous brain activity in mental disorders. Progr Neuro-Psychopharmacol Biol Psychiat. (2013) 45:258–66. doi: 10.1016/j.pnpbp.2012.05.001
16. Nobukawa S, Yamanishi T, Nishimura H, Wada Y, Kikuchi M, Takahashi T. Atypical temporal-scale-specific fractal changes in Alzheimer's disease EEG and their relevance to cognitive decline. Cogn Neurodyn. (2019) 13:1–11. doi: 10.1007/s11571-018-9509-x
17. Nobukawa S, Yamanishi T, Kasakawa S, Nishimura H, Kikuchi M, Takahashi T. Classification methods based on complexity and synchronization of electroencephalography signals in Alzheimer's disease. Front Psychiatry. (2020) 11:255. doi: 10.3389/fpsyt.2020.00255
18. Ando M, Nobukawa S, Kikuchi M, Takahashi T. Identification of Electroencephalogram signals in Alzheimer's disease by multifractal and multiscale entropy analysis. Front Neurosci. (2021) 15:667614. doi: 10.3389/fnins.2021.667614
19. Ando M, Nobukawa S, Kikuchi M, Takahashi T. Alteration of neural network activity with aging focusing on temporal complexity and functional connectivity within electroencephalography. Front Aging Neurosci. (2022) 14:793298. doi: 10.3389/fnagi.2022.793298
20. Sporns O, Honey CJ, Kötter R. Identification and classification of hubs in brain networks. PLoS ONE. (2007) 2:e1049. doi: 10.1371/journal.pone.0001049
21. Mišić B, Vakorin VA, Paus T, McIntosh AR. Functional embedding predicts the variability of neural activity. Front Syst. Neurosci. (2011) 5:90. doi: 10.3389/fnsys.2011.00090
22. Bakheet D, Alotaibi N, Konn D, Vollmer B, Maharatna K. Prediction of cerebral palsy in newborns with hypoxic-ischemic encephalopathy using multivariate EEG analysis and machine learning. IEEE Access. (2021) 9:137833–46. doi: 10.1109/ACCESS.2021.3118076
23. Alotaibi N, Bakheet D, Konn D, Vollmer B, Maharatna K. Cognitive outcome prediction in infants with neonatal hypoxic-ischemic encephalopathy based on functional connectivity and complexity of the electroencephalography signal. Front Hum Neurosci. (2022) 15:795006. doi: 10.3389/fnhum.2021.795006
24. Nobukawa S, Kikuchi M, Takahashi T. Changes in functional connectivity dynamics with aging: a dynamical phase synchronization approach. Neuroimage. (2019) 188:357–68. doi: 10.1016/j.neuroimage.2018.12.008
25. Hasegawa C, Takahashi T, Yoshimura Y, Nobukawa S, Ikeda T, Saito DN, et al. Developmental trajectory of infant brain signal variability: a longitudinal pilot study. Front Neurcosci. (2018) 12:566. doi: 10.3389/fnins.2018.00566
26. Cohen E, Wong FY, Wallace EM, Mockler JC, Odoi A, Hollis S, et al. EEG power spectrum maturation in preterm fetal growth restricted infants. Brain Res. (2018) 1678:180–6. doi: 10.1016/j.brainres.2017.10.010
27. Wilkinson CL, Yankowitz LD, Chao JY, Gutiérrez R, Rhoades JL, Shinnar S, et al. Developmental trajectories of EEG aperiodic and periodic components in children 2-44 months of age. Nat Commun. (2024) 15:5788. doi: 10.1038/s41467-024-50204-4
28. Nobukawa S, Shirama A, Takahashi T, Toda S. Recent trends in multiple metrics and multimodal analysis for neural activity and pupillometry. Front Neurol. (2024) 15:1489822. doi: 10.3389/fneur.2024.1489822
29. Pelc K, Gajewska A, Napiórkowski N, Dan J, Verhoeven C, Dan B. Multiscale entropy as a metric of brain maturation in a large cohort of typically developing children born preterm using longitudinal high-density EEG in the first two years of life. Physiol Measur. (2022) 43:125001. doi: 10.1088/1361-6579/aca26c
30. Iinuma Y, Nobukawa S, Mizukami K, Kawaguchi M, Higashima M, Tanaka Y, et al. Enhanced temporal complexity of EEG signals in older individuals with high cognitive functions. Front Neurosci. (2022) 16:878495. doi: 10.3389/fnins.2022.878495
31. Rodriguez-Bermudez G, Garcia-Laencina PJ. Analysis of EEG signals using nonlinear dynamics and chaos: a review. Appl Mathem Inf Sci. (2015) 9:2309. doi: 10.12785/amis/090512
32. Richman JS, Moorman JR. Physiological time-series analysis using approximate entropy and sample entropy. Am J Physiol Heart Circul Physiol. (2000) 278:H2039–49. doi: 10.1152/ajpheart.2000.278.6.H2039
33. Zheng J, Cheng J, Yang Y, Luo S, A. rolling bearing fault diagnosis method based on multi-scale fuzzy entropy and variable predictive model-based class discrimination. Mechan Mach Theory. (2014) 78:187–200. doi: 10.1016/j.mechmachtheory.2014.03.014
34. Borin Jr AMS, Humeau-Heurtier A, Virgílio Silva LE, Murta Jr LO. Multiscale entropy analysis of short signals: the robustness of fuzzy entropy-based variants compared to full-length long signals. Entropy. (2021) 23:1620. doi: 10.3390/e23121620
35. Nobukawa S, Shirama A, Takahashi T, Takeda T, Ohta H, Kikuchi M, et al. Identification of attention-deficit hyperactivity disorder based on the complexity and symmetricity of pupil diameter. Sci Rep. (2021) 11:1–14. doi: 10.1038/s41598-021-88191-x
36. Li Y, Xu M, Wang R, Huang W. A fault diagnosis scheme for rolling bearing based on local mean decomposition and improved multiscale fuzzy entropy. J Sound Vib. (2016) 360:277–99. doi: 10.1016/j.jsv.2015.09.016
37. Sreedharan R, Prajapati J, Engineer P, Prajapati D. Leave-one-out cross-validation in machine learning. In: Ethical Issues in AI for Bioinformatics and Chemoinformatics. CRC Press (2024). p. 56–71. doi: 10.1201/9781003353751-5
38. Raza A, Shabbir A, Shafique U, Ahmed N, Rafiq M. Investigation of diabetes mellitus transmission in humans by using time delay tool and numerical treatment approach. Model Earth Syst Environ. (2025) 11:113. doi: 10.1007/s40808-024-02274-y
39. Minhós F, Raza A, Shafique U, Mohsin M. Modeling, analysis, and transmission dynamics of cassava mosaic disease through stochastic fractional delay differential equations. Mathematics. (2025) 13:383. doi: 10.3390/math13030383
40. Minhós F, Raza A, Shafique U. Mathematical modeling and dynamics of gonorrhoea epidemic within stochastic fractional delay differential equations. Model Earth Syst Environ. (2025) 11:1–16. doi: 10.1007/s40808-024-02216-8
41. Nobukawa S. Long-tailed characteristics of neural activity induced by structural network properties. Front Appl Mathem Stat. (2022) 8:905807. doi: 10.3389/fams.2022.905807
42. Fujimoto A, Nobukawa S, Sakemi Y, Ikeuchi Y, Aihara K. Revealing functions of extra-large excitatory postsynaptic potentials: insights from dynamical characteristics of reservoir computing with spiking neural networks. In: International Conference on Artificial Neural Networks. Springer (2024). p. 151–165. doi: 10.1007/978-3-031-72341-4_11
Keywords: asphyxia, complexity analysis, electroencephalography, neonate, neural activity
Citation: Nobukawa S, Kurnianingsih, Wakita I, Ueno A, Widyawati MN, Pramana C, Aji NB, Thohari ANA, Hendrawati D, Sato-Shimokawara E and Kubota N (2025) Detection of neonatal asphyxia by analyzing the complexity of electroencephalography data. Front. Appl. Math. Stat. 11:1530570. doi: 10.3389/fams.2025.1530570
Received: 19 November 2024; Accepted: 24 February 2025;
Published: 19 March 2025.
Edited by:
Stephen E. Moore, University of Cape Coast, GhanaReviewed by:
Ali Raza, The University of Chenab, PakistanCopyright © 2025 Nobukawa, Kurnianingsih, Wakita, Ueno, Widyawati, Pramana, Aji, Thohari, Hendrawati, Sato-Shimokawara and Kubota. This is an open-access article distributed under the terms of the Creative Commons Attribution License (CC BY). The use, distribution or reproduction in other forums is permitted, provided the original author(s) and the copyright owner(s) are credited and that the original publication in this journal is cited, in accordance with accepted academic practice. No use, distribution or reproduction is permitted which does not comply with these terms.
*Correspondence: Sou Nobukawa, bm9idWthd2FAY3MuaXQtY2hpYmEuYWMuanA=
Disclaimer: All claims expressed in this article are solely those of the authors and do not necessarily represent those of their affiliated organizations, or those of the publisher, the editors and the reviewers. Any product that may be evaluated in this article or claim that may be made by its manufacturer is not guaranteed or endorsed by the publisher.
Research integrity at Frontiers
Learn more about the work of our research integrity team to safeguard the quality of each article we publish.