
94% of researchers rate our articles as excellent or good
Learn more about the work of our research integrity team to safeguard the quality of each article we publish.
Find out more
REVIEW article
Front. Appl. Math. Stat., 26 February 2025
Sec. Statistics and Probability
Volume 11 - 2025 | https://doi.org/10.3389/fams.2025.1526540
 Intisar Ibrahim Elias
 Taha Hussein Ali*
In this research, there is significance on the accuracy of estimated parameters of time series models due to noise, which can be addressed using wavelet shrinkage. Depending on the noise of the data, the wavelet with the appropriate level (the number of decomposition levels or scales used in the analysis) and order (the order N of a Coiflets wavelet is the number of vanishing moments of the wavelet function, and it also implies that the scaling function has 2N vanishing moments) that provides the best time series model is determined. In this research, an algorithm was proposed, and the level and order optimal of the Coiflets wavelet that provides the minimum Akaike information criterion (AIC) and Bayesian information criterion (BIC) for the VAR time series model is determined with universal and minimax threshold methods with soft rule. A comparison was made between the efficiency of the proposed method and the traditional method, which relies on the level (L = 3) and order (N = 3) for the Coiflets wavelet, and it is the default value of the MATLAB program, through studying simulation and real data. Through the research results, the efficiency of the proposed method was reached in estimating the parameters of the VAR time series model, effectively treating noise, and determining the optimal Coiflets level and order.
Noise reduction is an important step in preprocessing multivariate time series data. It improves modeling and forecasting accuracy by optimizing for irrelevant fluctuations. Effective noise reduction that retains the underlying signals leads to better model performance in vector autoregressive (VAR) models. Vector autoregressive models are widely used in multivariate time series analysis, which captures interactions between different time series and their historical relationships. While autoregressive (AR) models applied to a single series, vector autoregressive models provide a more granular analysis of dynamic interdependencies, making them particularly useful in macroeconomics and finance to guide decision-making and policy evaluation (1).
Coiflets wavelet transforms are widely used to effectively remove noise in time series, which capture time and frequency information. Coiflets wavelet transforms, known for their correction and close symmetry, are particularly useful in signal processing. Therefore, the success of Coiflets-based noise removal largely depends on the selection of the optimal level and order of the Coiflets wavelet, which affects the efficiency of noise reduction and signal preservation (2).
Wavelets are a powerful mathematical tool widely used to analyze signals by decomposing them into different frequency components. They can be thought of as a “magnifying glass,” uncovering hidden patterns in time series at various scales. In this study, wavelet shrinkage is employed to improve parameter estimation in vector autoregressive (VAR) models. The technique works by transforming time series data using wavelets, removing high-frequency noise through thresholding methods, and applying the VAR model to the denoised data. This approach not only enhances the accuracy of the model but also ensures a better representation of underlying patterns in noisy time series data, making it a valuable method for time series analysis (3).
The research problem addressed in this study concerns improving noise reduction in VAR models by determining the optimal level and order of the Coiflets wavelet, which enhances the model quality based on the lowest values of the AIC and BIC criteria, where lower values indicate optimal model performance. Achieving the lowest possible values of these criteria contributes to improving the accuracy of forecasts and providing clearer economic insights.
The study emphasizes AIC and BIC due to their widespread use and reliability in balancing model complexity with goodness of fit. Furthermore, it offers new insights into advancing noise reduction techniques in time series data analysis.
This research presents a new algorithm to determine the optimal level and order of the Coiflets wavelet to realize the lowest values of the AIC and BIC criteria in a VAR model for time series, utilizing universal and minimax thresholding methods with soft thresholding. The proposed algorithm was compared to the traditional method, which relies on a level and order of (L = 3 and N = 3) for the Coiflets wavelet in MATLAB program, through studying simulation using different sample sizes and noise levels, in addition to real data.
The research was divided into two main aspects: the theoretical aspect, which dealt in a simplified manner with the literature review, VAR model, model selection criteria, denoise time series data, wavelets, Coiflets, shrinkage techniques, soft threshold rule, and the proposed method. As for the applied aspect, an applied study (case study) was conducted on real-world data taken from Johansen’s Danish data set, which included key quarterly economic indicators such as log real money (M2), log real income (Y), bond rate (IB), and bank deposit rate (ID), during the period from 1974 to 1987, with a total of 55 observations (n = 55). The study was conducted using simulation and actual data to validate the algorithm. The statistical tools used in the application aspect were used, which included ready-made programs such as Minitab V21, EViews V12, and MATLAB R2023a, in addition to programs specially designed in the MATLAB programming language. The research concludes with findings derived from both simulations and real-world applications.
Recent studies ensure the prominence of wavelet transformations, especially the Coiflets wavelets, in improving time series prediction and noise reduction across different fields. Donoho and Johnstone (4) presented the importance of wavelet reduction techniques in removing noise from data, which contributed to improving the accuracy and stability of models. Özbek and Aliev (5) explored the limitations of the Kalman filter (KF) when applied to erroneous models, proposing the adaptive fading Kalman filter (AFKF) as a solution to address divergence issues through the dynamic adjustment of forgetting factors. Building on these foundations, Percival and Walden (6) underscored the importance of choosing the appropriate wavelet type and level of analysis in improving the accuracy of estimates extracted from time series, indicating that this directly affects the performance of predictive models (7). Later, Ozbek and Efe (8) introduced an adaptive formulation of the extended Kalman filter (EKF) to tackle non-linear estimation challenges in compartmental models, demonstrating its effectiveness in real-time parameter estimation through simulation studies. Collectively, these studies highlight the growing intersection between wavelet techniques and Kalman filters, setting the stage for robust, accurate, and adaptable predictive models.
Liu et al. (9) an adaptive wavelet transform model for time series data, focuses on improving prediction precision through adaptive techniques (9). This method is effective for enhancing noise reduction in VAR models. In addition, Peng et al. (10) integrates multiresolution wavelet rebuilding with deep learning in neural networks to forecast stock market movements. This research highlighted how wavelets help insulate noise, making them crucial for accurate financial predictions (11). Scout noise removal in financial market prediction using LSTM models, utilizing both the Kalman filter and wavelet transforms. Their returns revealed that wavelet-founded denoising significantly enhances prediction precision, especially in volatile financial environments. Additionally, Nafisi-Moghadam and Fattahi (12) showed the application of the Coiflets wavelets in association with ARIMA-GARCH transformations to predict volatility in financial markets, where several studies have shown the importance of wavelet transformations in improving the performance of time series models. This approach has been applied in price forecasting, where wavelet-based models significantly outperform traditional methods such as ARIMA (13). Ali et al. (14) showed the effectiveness of applying multivariate wavelet reduction within a VAR model to analyze expenditure and revenue data in the Kurdistan Region of Iraq. The results showed the superiority of this technique over traditional methods, which contributed to improving the accuracy of economic forecasts by removing noise from financial data and achieving accurate forecasts for the period between 2022 and 2026 (14).
While previous studies have demonstrated the effectiveness of wavelet transformations in noise reduction and enhancing predictive models, limited attention has been given to determining the optimal levels and order of the Coiflets wavelets specifically tailored for VAR models. Furthermore, the integration of noise reduction techniques with model selection criteria, such as AIC and BIC, remains underexplored. This study addresses these gaps by determining the optimal level and order of the Coiflets wavelets based on minimizing the values of performance criteria, particularly AIC and BIC. To bridge these gaps, the study focuses on applying the Coiflets wavelets in VAR models to reduce AIC and BIC values, thereby improving model quality and prediction accuracy.
Compared to previous studies, this research introduces a novel approach by integrating the Coiflets wavelets with VAR models, prioritizing the minimization of AIC and BIC criteria. This optimal wavelet selection not only enhances noise reduction but also achieves a balance between model complexity and performance. This contribution highlights the novelty of the study and demonstrates its potential to improve economic and financial forecasting in multidimensional datasets.
The theoretical aspect presented some basic concepts about research from the statistical side, as shown in the following paragraphs.
The vector autoregression (VAR) model is a widely recognized statistical approach in time series analysis and econometrics. It is primarily designed to explore the interrelationships among multiple time series variables. Unlike univariate models, which analyze a single variable in isolation, VAR models account for multiple variables simultaneously, allowing for the analysis of intricate dynamic interactions and feedback loops within the system. In this context, each variable is modeled as a linear function of its past values and past values of the other variables within the system (15). The VAR model also represents the linear relationships between a set of k endogenous variables observed over the same period (t = 1, 2, …, T). These variables are organized into a vector with dimensions (kx1), where the elements of this vector correspond to the variable . The autoregressive vector of order (p) can be described by the following formula (16):
Where,
is the vector of the time series variables at time t, with dimensions (k × 1).
C is the constant term vector of the autoregressive variables, with dimensions (k × 1).
are coefficient matrices to be estimated, with dimensions (k × k) for each i = 1, 2, …, p.
is the vector with dimensions k × 1 of random error terms with a mean of zero and a contemporaneous covariance matrix Ω, and dimensions n × n, while for all k, indicating that these errors are uncorrelated across time.
B is the backshift operator.
The formulation of the VAR model allows an overall framework for analyzing the dynamic interactions among multiple time series variables. A VAR (1) model with two-time series variables (k = 2), denoted as (“yl” and “y2”), can be represented by the following system of equations (17):
Where:
and are constants.
the coefficients that show the relationship between the current and past values of the variables.
: The error coefficient terms at time t are for each equation.
This system captures the linear interdependencies between the two time series variables, enabling the estimation of their dynamic behavior over time.
These criteria AIC and BIC play a crucial role in model selection by finding a balance between model accuracy and complexity. These criteria are extensively used throughout statistical and machine-learning fields to determine the best model from a set of different models (18, 19):
The lower AIC value represents the best model, which indicates a good fit with fewer parameters and is calculated according to the following equation:
Where, is the number of parameters in the model for each k = 1, 2, and 3.
is the log-likelihood function of the model.
A lower AIC value indicates a better model, as it implies a good fit with fewer parameters.
The Bayesian Information Criterion (BIC) or Schwarz information criterion called by SIC, SBC, and SBIC is another criterion used for model selection that also takes into account the goodness of fit and model complexity but supposes a stricter penalty for the number of parameters than AIC. It is calculated according to the following equation:
Where:
• is the number of observations.
• is the number of parameters in the model for each k = 1, 2, and 3.
• is the log-likelihood function of the model.
Like AIC, a lower BIC value indicates a better model, but BIC tends to favor simpler models than AIC due to the term.
Denoising time series data stands as a pivotal preprocessing step in modern scientific and engineering domains, essential for refining signal clarity and facilitating accurate data analysis and dependable forecasting. Various techniques are deployed for this purpose, spanning from fundamental methods like moving averages to advanced methodologies such as wavelet transforms, machine-learning algorithms, and robust statistical techniques.
Wavelet denoising emerges as highly effective for handling non-stationary signals prevalent in time series data. This method involves decomposing the original time series into wavelet coefficients, applying thresholds to distinguish signal from noise, and reconstructing the denoised series accordingly. Optimal selection of wavelet functions and decomposition levels is critical for achieving optimal denoising performance, where wavelet transforms adeptly decompose signals into distinct frequency components, enabling targeted noise reduction across multiple scales an advantageous capability for time-varying noise in non-stationary signals (20).
Wavelets are oscillatory functions characterized by an amplitude that initiates at zero, grows or shrinks, and then returns to zero in a repetitive cycle. These brief oscillations, known as wavelets, are integral to modern signal processing and time series analysis (2). According to Ali et al. (21), wavelets can be understood as small waves that, when grouped, can form larger or different waveforms. By stretching and shifting fundamental waves in various ways, a wavelet system can accurately model a diverse range of waveforms.
Wavelets are advanced mathematical tools in signal processing and time series analysis, known for effectively handling non-stationary signals. Unlike Fourier transformations, which decompose signals into sine and cosine functions, wavelets provide dual localization in time and frequency domains. The mother wavelet, ψ(t), serves as the primary function from which all other wavelets are generated through scaling and translation (7, 20).
Thus, (a) is the scaling parameter that controls the frequency and (b) is the translation parameter that controls the time localization.
The discrete wavelet transform (DWT) provides a set of coefficients in both time and frequency domains, summarizing the information of all observations with a reduced number of coefficients. DWT is widely used, especially when data contain contaminants or noise (22).
The discrete wavelet transform (DWT) denotes the coefficients utilized to represent the signal in terms of wavelets, as follows (6):
where are the wavelet coefficients and are the wavelet basis functions at scale j and translation k.
Coiflets wavelets, introduced by Ingrid Daubechies at the request of Ronald Coifman in the spring of 1989, represent a significant advancement in wavelet theory, particularly for signal processing tasks. Coifman’s idea extended the concept of vanishing moments to both scaling and wavelet functions, moving beyond the earlier focus solely on the wavelet function (Ψ). These are called wavelets (Coif N) where (Coif) is an abbreviation from (Coifman) and while the (N) represents the rank of the candidate, and there is a relationship between the rank of the candidate with the length of which (the length of the candidate = 6 N) and the number of moments vanishing of the function wavelet (4) is (L = 2 N), while the number of vanishing moments of the function of scale (ϕ) is (L₁ = 2 N-1). The wavelet properties can be integrated as follows: compact support, orthogonal, and near symmetry (23).
The mathematical form for the Coiflets wavelet ψ (t) that derived from the mother wavelet through scaling and translation, and it is calculated according to the following equation:
where (j) represents the scale parameter and (k) is the translation parameter.
The following equation show explains how the denoised signal is reconstructed using wavelet coefficients and wavelet basis functions after applying thresholding in the Coiflets wavelets denoising process. The equation is defined as:
Thus, are the wavelet coefficients after applying thresholding to remove noise, and are the wavelet basis functions used for signal reconstruction.
Equation 9 represents the wavelet noise removal equation or wavelet reconstruction equation after thresholding, which clarifies the notion of wavelet denoising, in which the signal is processed to remove unwanted noise while preserving its major components. Thus, Wavelet denoising, particularly utilizing the Coiflets wavelets, is most applied in signal processing and time series analysis due to its efficiency in noise repression and keeping signal safety (20).
Universal thresholding is generally used in wavelet shrinkage to denoise data or images. The thresholding technique aims to select an optimal threshold value founded on the statistical characteristic of the data. The idea of universal thresholding selection is to estimate the noise level in the data and apply a threshold that adapts to this noise level. Universal thresholding is considered one common method for Stein’s unbiased risk estimate (SURE), which represents an unbiased estimate of the mean squared error (MSE) of the denoised signal. The threshold value was chosen to decrease and minimize this estimated MSE. The SURE threshold is commonly called the “universal threshold” as it does well across an extensive domain of data and noise kinds without required prior knowledge of the noise properties. Then, adaptively choosing the threshold based on the same data and universal thresholding can effectively remove noise while keeping important data characteristics (24, 25). The universal thresholding method is a powerful tool in wavelet shrinkage to denoise signals. It relies on the statistical characteristics of the data to adaptively determine an optimal threshold value. The universal threshold is calculated as follows:
Where (n) is the number of observations while ( is the standard deviation estimator derived from the wavelet coefficients’ median absolute deviation (MAD) at the first level. It is calculated as follows:
The median absolute deviation (MAD) of the wavelet coefficients at the delicate scale is calculated as follows:
Here, represent the discrete wavelet transformation coefficients at the first level for observations while the constant (0.6745) is the median of the standard normal distribution (26).
The universal threshold balances denoising and signal preservation by minimizing the mean squared error (MSE) of the denoised signal. This threshold adapts automatically to the noise level in the data, making it robust for a wide range of signals and noise types.
Consider a signal with n = 150 observations and a calculated MAD = 0.25. The universal threshold can be computed as follows:
1. Calculate the standard deviation estimator () using the median absolute deviation (MAD):
2. Compute the universal threshold () using the formula:
This computed universal threshold () is then applied to the wavelet coefficients. It effectively removes noise while retaining the essential features of the signal, ensuring both accuracy and reliability in the denoised result.
The minimax threshold method is a powerful technique for denoising waves that aim to reduce the maximum risk or worst-case error, between the estimated and actual signals. This technique is particularly important in scenarios where the noise level is uncertain, as it results in a balanced threshold that effectively balances signal preservation and noise reduction (4).
Donoho and Johnstone (4) first proposed the thresholding method, which is an improvement on the global thresholding method. This approach focuses on an estimator that achieves the minimax risk, formulated as:
Where is the risk function given by Equation 14:
The equations and represent the true and estimated sample values, respectively. In contrast to the global threshold method, which often gives over-smoothing, the goal of the maximum threshold method is to minimize the overall mean square error (MSE) while being careful not to over-smooth the estimates (21, 27).
In the context of this research, the universal threshold and minimax threshold methods were applied to denoise the data set related to Johansen’s Danish dataset. This approach ensured data accuracy and reliability by removing unwanted noise while preserving critical economic patterns. The results confirmed the efficiency of the universal threshold method compared to the minimax threshold method through key statistical metrics, including AIC and BIC, supporting its role in enhancing prediction accuracy and model reliability.
A method used in signal and image processing, especially about wavelet shrinkage, is called soft thresholding. Introduced by Donoho and Johnstone, it extends the hard thresholding method by shrinking wavelet coefficients toward zero to reduce the impact of noise. This method is mathematically defined as follows (21, 25):
or
where
and
In these equations, represents the wavelet coefficients and is the threshold value. Soft thresholding is particularly effective at noise suppression while preserving significant signal features, although it may introduce some signal distortion. Therefore, it is the focus of the application side of wave noise removal.
The soft threshold rule works by adjusting the values below the threshold to zero, whereas the values above the threshold are reduced to the threshold amount. This results in a continuous mapping function. It can balance noise reduction and signal preservation, so soft thresholding is a popular choice in wavelet-based noise removal applications and studies (26).
The proposed algorithm includes data de-noise of VAR time series using wavelet Coiflets with the universal and minimax thresholding estimation method, applying the soft rule through the following steps:
1. Level of wavelet decomposition, specified as a positive integer ≤ where n is the number of observations in the time series. Set L = 1, 2, …, l, where l returns the maximum level L possible for a wavelet decomposition of data using the wavelet specified by the Coiflets wavelets (default value equal to 3).
2. Denoises VAR time series data for all L, as defined in Equations (6–9).
3. Estimating the parameters of the VAR Model for each L, according to Equations (1–3), and computing AIC and BIC for all models using Equations 4, 5.
4. Determine the optimal level (OL) that gives the least AIC and BIC. The optimization algorithm applied in this study ensures computational efficiency by iteratively simulating the data 1,000 times and systematically evaluating noise reduction using the Coiflets wavelets. The stopping criteria are defined based on achieving the lowest AIC and BIC values, with the algorithm halting after 1,000 iterations or upon determining the optimal level and order of the Coiflets wavelets. Convergence is analyzed by testing multiple levels [ to ] and evaluating the AIC values for different Coiflets orders ( to ). The results demonstrate that the algorithm reliably identifies the optimal parameters, achieving robust denoising and improved VAR model performance.
5. Denoises VAR time series data at OL for the Coiflets wavelets with order 1, 2, 3, 4, 5, and universal and minimax thresholding estimation methods using Equations 10–12 according to the universal thresholding and then use Equations 13, 14 in the case of minimax thresholding and applying the soft rule according to Equations 15–18.
6. Determine the optimal order (OO) that gives the least AIC and BIC.
7. Use OL and OO for the Coiflets wavelet with the universal and minimax thresholding estimation methods and apply the soft rule in data denoise.
8. Use data denoise from point (7) in estimating the VAR model according to Equation 1.
The comparison between the proposed method and the classical approach without the Coiflets wave transformation will be made by using simulation data.
In this study, the focus was on evaluating the performance of Coiflets and thresholding techniques, such as universal and minimax, within a VAR model that was applied to the Danish Johansen dataset, which includes quarterly economic indicators such as log real money (M2), log real income (Y), bond rate (IB), and bank deposit rate (ID) from 1974 to 1987. The simulation is based on parameters estimated from the VAR model and aims to determine the optimal level and order of the Coiflets wavelets to remove noise using AIC and BIC criteria. This study relied on sample sizes of 55, 150, 200, and 300 with 1,000 iterations to evaluate the performance of each method. The simulation experiment was conducted using different sample sizes (n) based on , where j represents the level and is a positive integer, with the maximum level denoted by (L). Three sample sizes were chosen for the simulation, as shown below:
• For , which is less than the original sample sizes of
• For , which is less than the original sample sizes of
• For , which is less than the original sample sizes of
In summary, the simulation used sample sizes based on powers of two, providing a robust range for analysis.
Therefore, an algorithm was proposed, and the level and order optimal of the Coiflets wavelet that provides the minimum values using AIC and BIC criteria values for the VAR time series model is determined with Universal and Minimax threshold methods with soft rule. Then, a comparison is made between the efficiency of the proposed method and the traditional method, which relies on the level (L = 3) and order (N = 3) for the Coiflets wavelet, and it is the default value of the MATLAB23 program (see Appendix 1), based on different sample sizes and noise levels. These values were used as a baseline for comparison. They represent average settings for the Coiflets wavelets, where levels and orders typically range from 1 to 5. The study systematically varied these parameters, optimizing them based on AIC and BIC to evaluate the improvements achieved by the proposed method over the default settings. This approach ensures a comprehensive evaluation of Coiflets-based noise removal techniques in improving the performance of the VAR model, as shown:
This study examines the performance of various denoising methods applied to a four-dimensional VAR (2) model across sample sizes of 55, 150, 200, and 300, with 1,000 repetitions for robustness. The efficiency of these methods is evaluated using AIC and BIC criteria, where lower values represent optimal performance for the model. The Coiflets wavelets and different thresholding techniques are used to improve data fidelity, enhancing model accuracy and parameter estimation, as demonstrated in the following cases:
Case (1): The average Akaike information criterion (AIC) and Bayesian information criterion (BIC) for a four-dimensional VAR (2) model were evaluated using Johansen’s Danish dataset. The data were denoised using the Coiflets wavelet transformation, effectively treating contamination based on this method. Conversely, a method without the Coiflets wavelet transformation retained 10% of the data as noise. This process allows for the study of the effect of noise on model performance and the testing of noise removal techniques, as shown in Table 1.
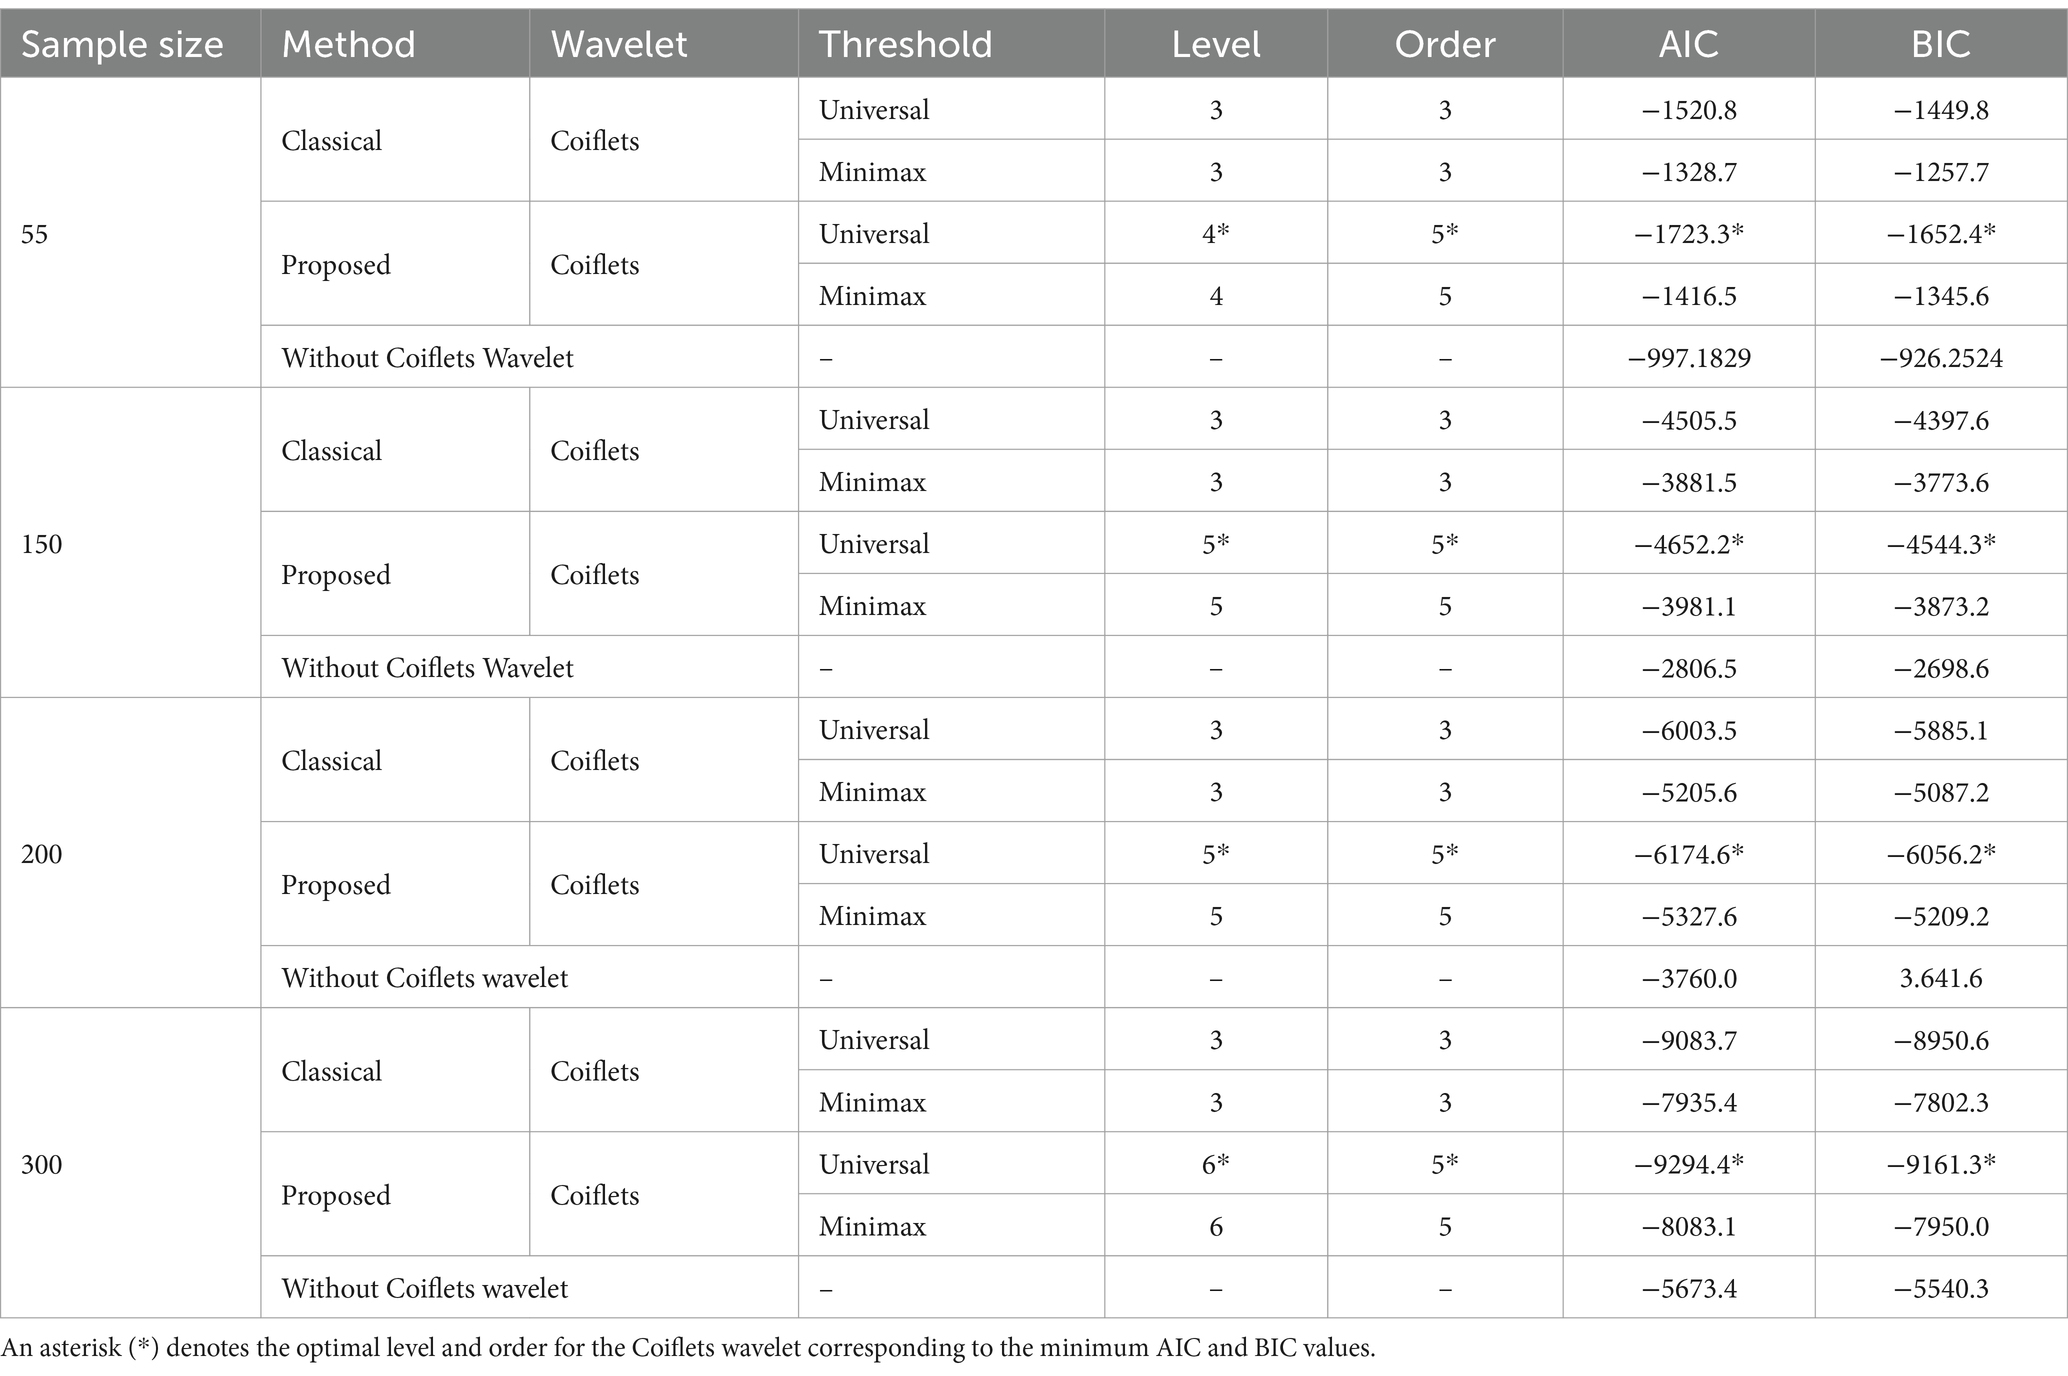
Table 1. Average AIC and BIC criteria for a four-dimensional VAR (2) model (10% noise).
Case (2): Average AIC and BIC criteria for a four-dimensional VAR (2) model, with the remaining 30% representing noise data in the method without Coiflets wavelet transformation, as shown in Table 2.
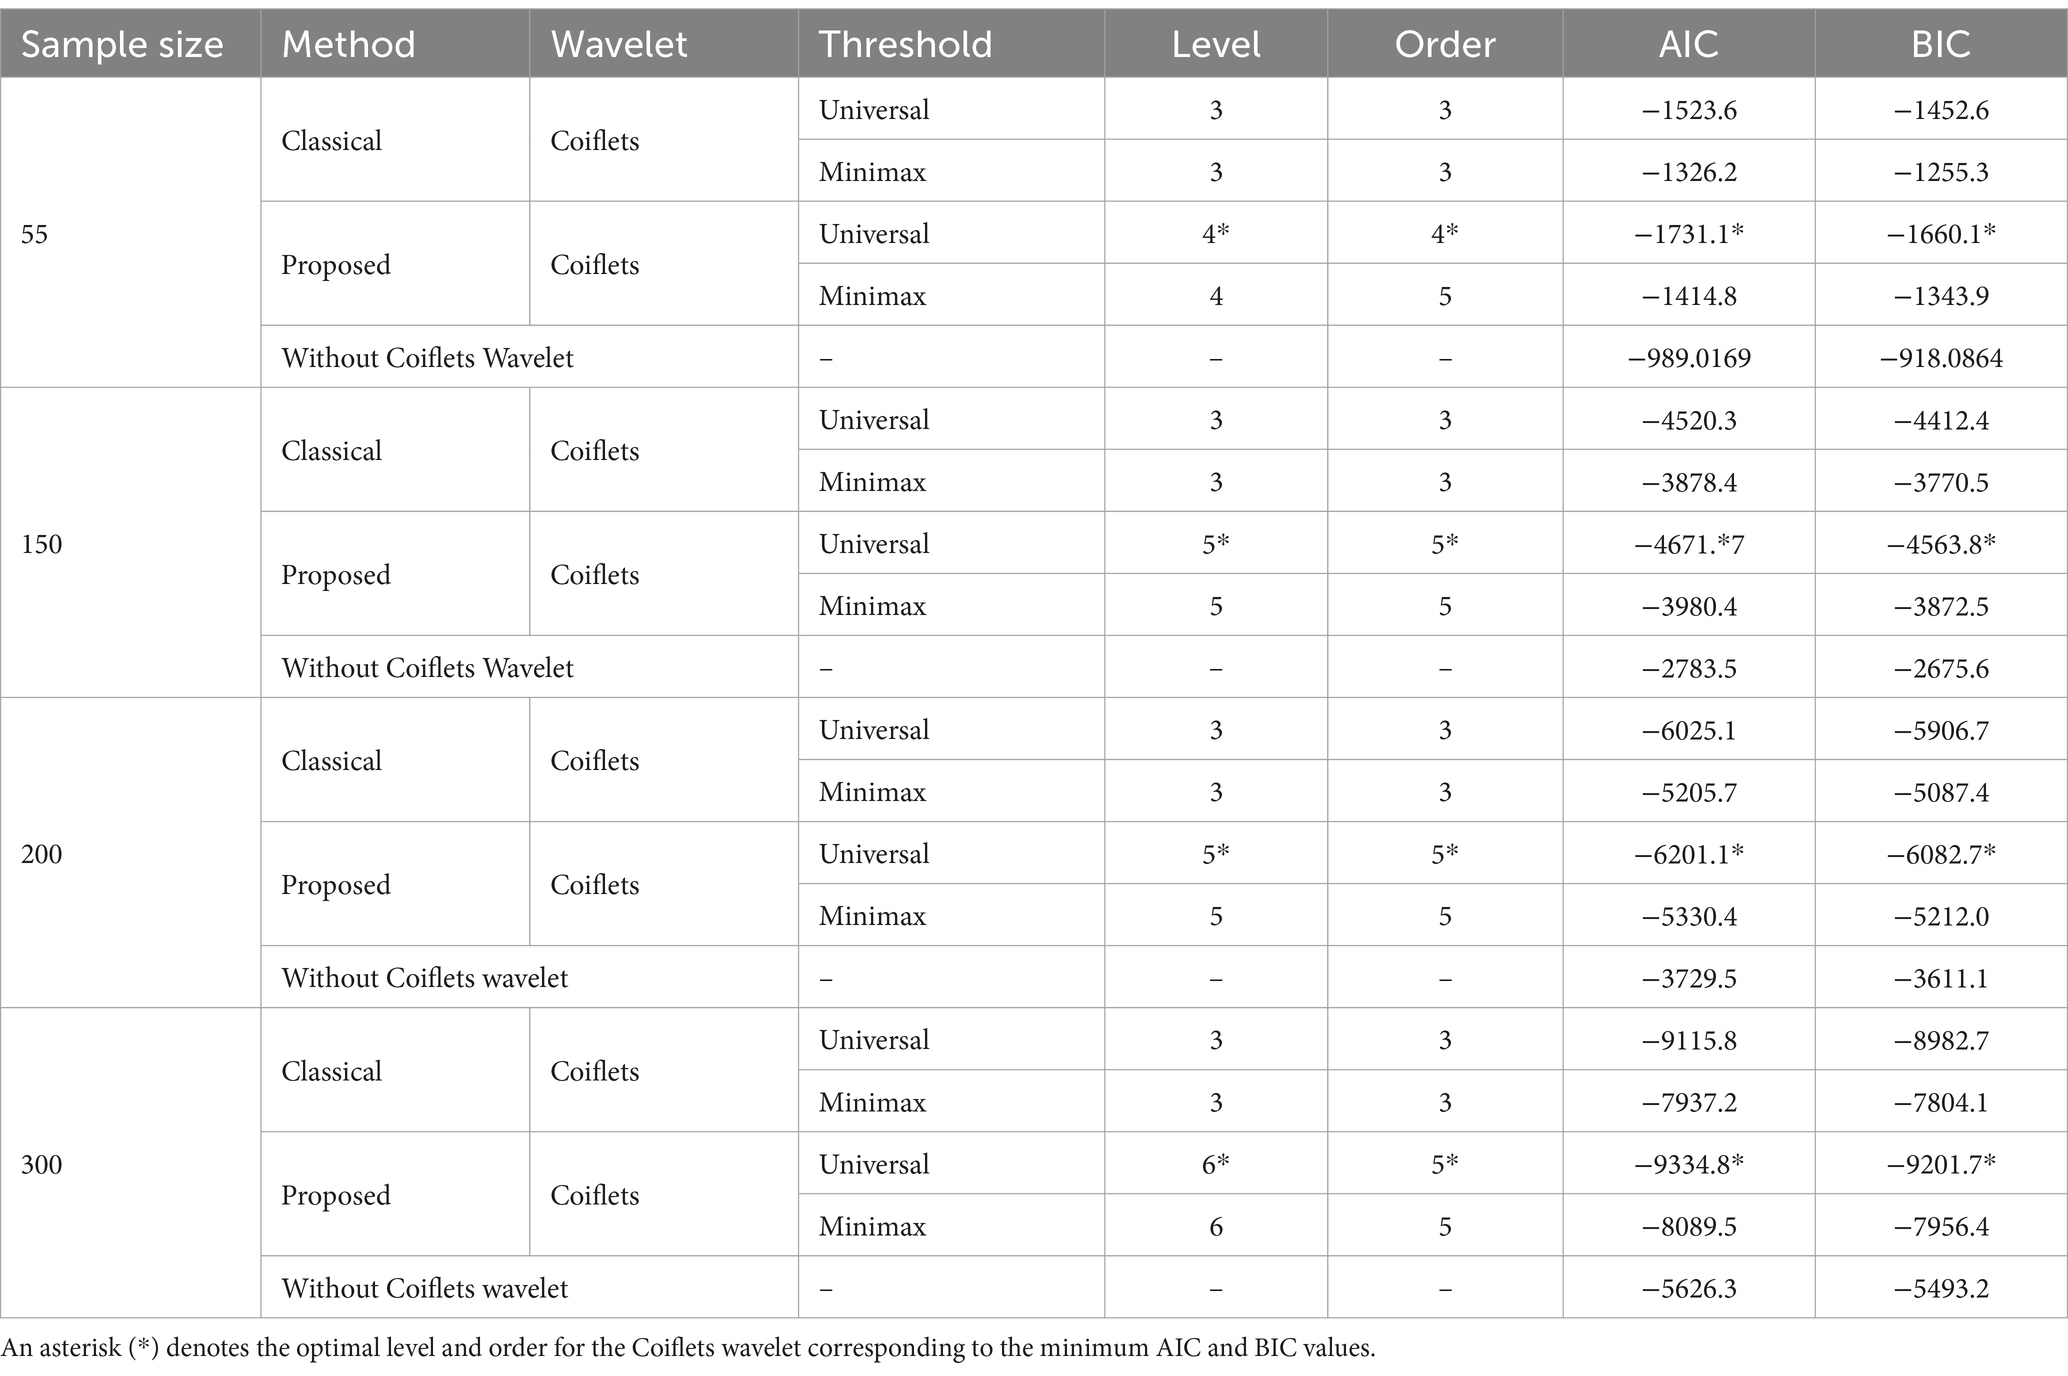
Table 2. Average AIC and BIC criteria for a four-dimensional VAR (2) model (30% noise).
Case (3): Average AIC and BIC criteria for a four-dimensional VAR (2) model, with the remaining 100% representing noise data in the method without the Coiflets wavelet transformation, as shown in Table 3.
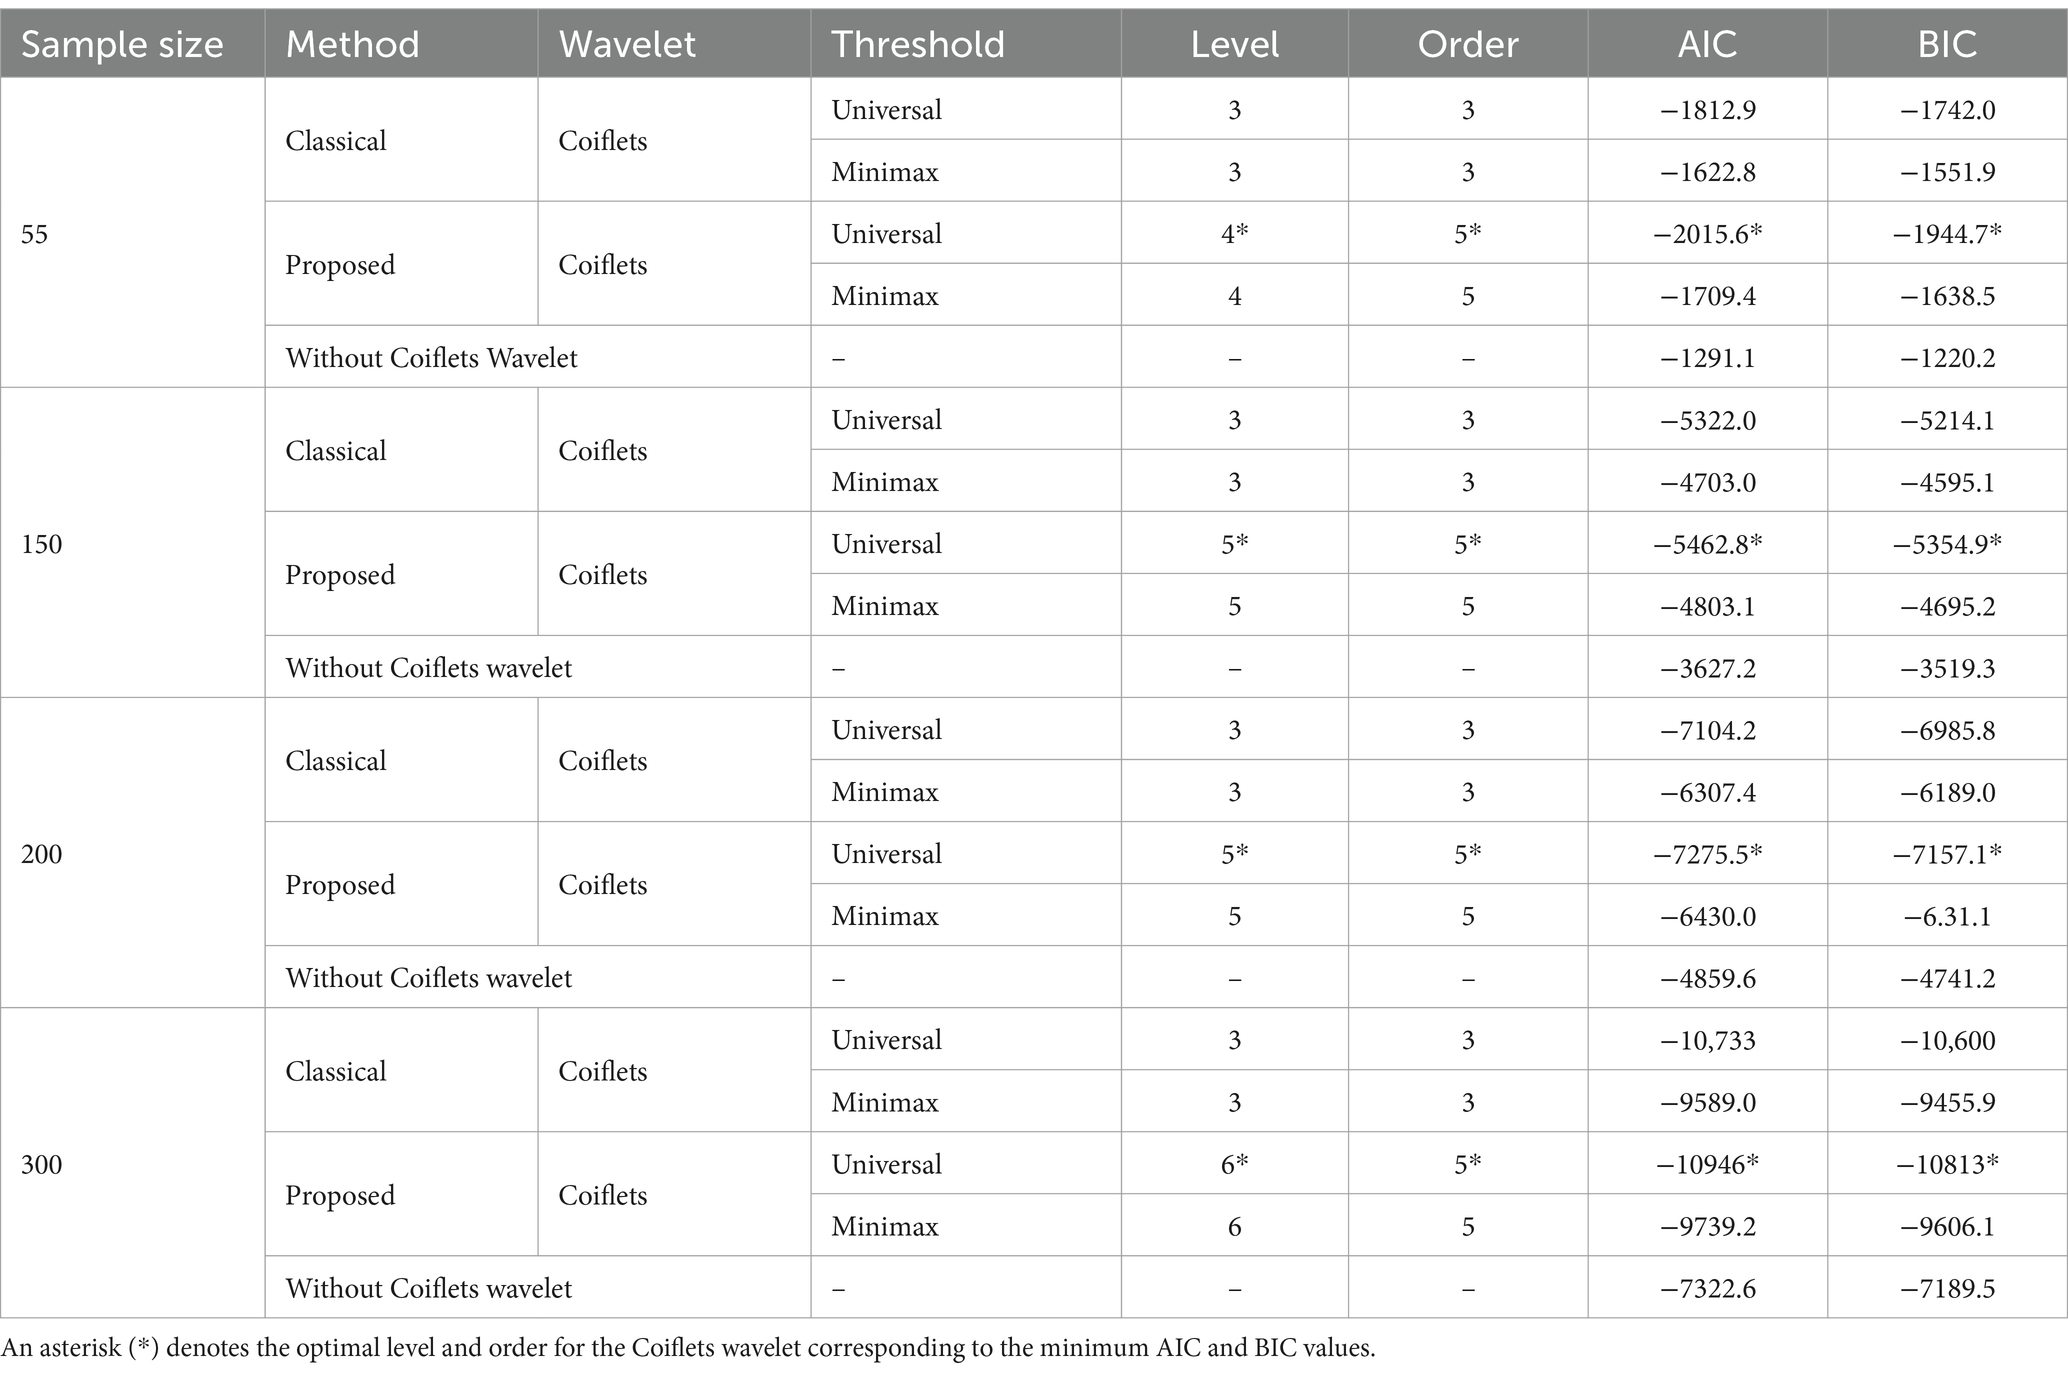
Table 3. Average AIC and BIC criteria for a four-dimensional VAR (2) model (100% noise).

Table 4. Optimal performance (L, N) based on lowest AIC and BIC criteria for a four-dimensional VAR (2) model.
For all cases presented in Tables 1–3, the results demonstrate that for each sample size (55,150, 200, and 300), the proposed method using universal thresholding consistently achieved the lowest AIC and BIC values, denoted with an asterisk (*). This indicates that the method achieved optimal performance at an optimal level (L) of 4 [where the maximum level is (5), depending on the sample size (55)]. Additionally, the method achieved an optimal level (L) of 5 (where the maximum level is (7, 7), depending on the sample size (150, 200), respectively, and an optimal level (L) of 6 [where the maximum level is (8), depending on the sample size (300)], alongside the optimal order (N) of 5 for each sample size (150, 200, and 300) while an optimal order (N) of 5 for Tables 1, 3, and an optimal order (N) of 4 for Table 2, based on the sample size (55), highlighting its effectiveness in denoising VAR time series data. For Table 1, the remaining 10% represents noise data; for Table 2, the remaining 30% represents noise data; and for Table 3, the remaining 100% represents noise data in the method without the Coiflets wavelet transformation, in the context of a 4-dimensional VAR (2) model. The results are as follows Table 4:
In each scenario, the lowest AIC and BIC values correspond to the specified optimal levels (L) and orders (N), highlighting the best model configurations for each sample size.
For all Tables 1–3 above, the classical method, though effective, did not perform as well as the proposed method. Without data denoise, which did not utilize Coiflets wavelet, exhibited higher AIC and BIC values, indicating lower efficiency and poorer model fit than the other methods. Without the application of the Coiflets wavelets, the model fails to result in accurate parameter estimation and forecasting capabilities. The denoise approach serves as a baseline, highlighting the significance of denoising methods in enhancing model performance and demonstrating the efficacy of wavelet-based denoising.
This study examines the performance of various denoising methods applied to a four-dimensional VAR (3) model across sample sizes of 55, 150, 200, and 300, with 1,000 repetitions for robustness. The efficiency of these methods is evaluated using AIC and BIC criteria. The Coiflets wavelets and different thresholding techniques are used to improve data fidelity, enhancing model accuracy and parameter estimation, as demonstrated in the following cases:
Case (1): The average Akaike Information Criterion (AIC) and Bayesian Information Criterion (BIC) for a four-dimensional VAR (3) model were evaluated using Johansen’s Danish dataset. The data were denoised using the Coiflets wavelet transformation, effectively treating contamination based on this method. Conversely, a method without the Coiflets wavelet transformation retained 10% of the data as noise. This process allows for the study of the effect of noise on model performance and the testing of noise removal techniques, as shown in Table 5.

Table 5. Average AIC and BIC criteria for a four-dimensional VAR (3) model (10% noise).
Case (2): Average AIC and BIC criteria for a four-dimensional VAR (3) model, with the remaining 30% representing noise data in the method without the Coiflets wavelet transformation, as shown in Table 6.
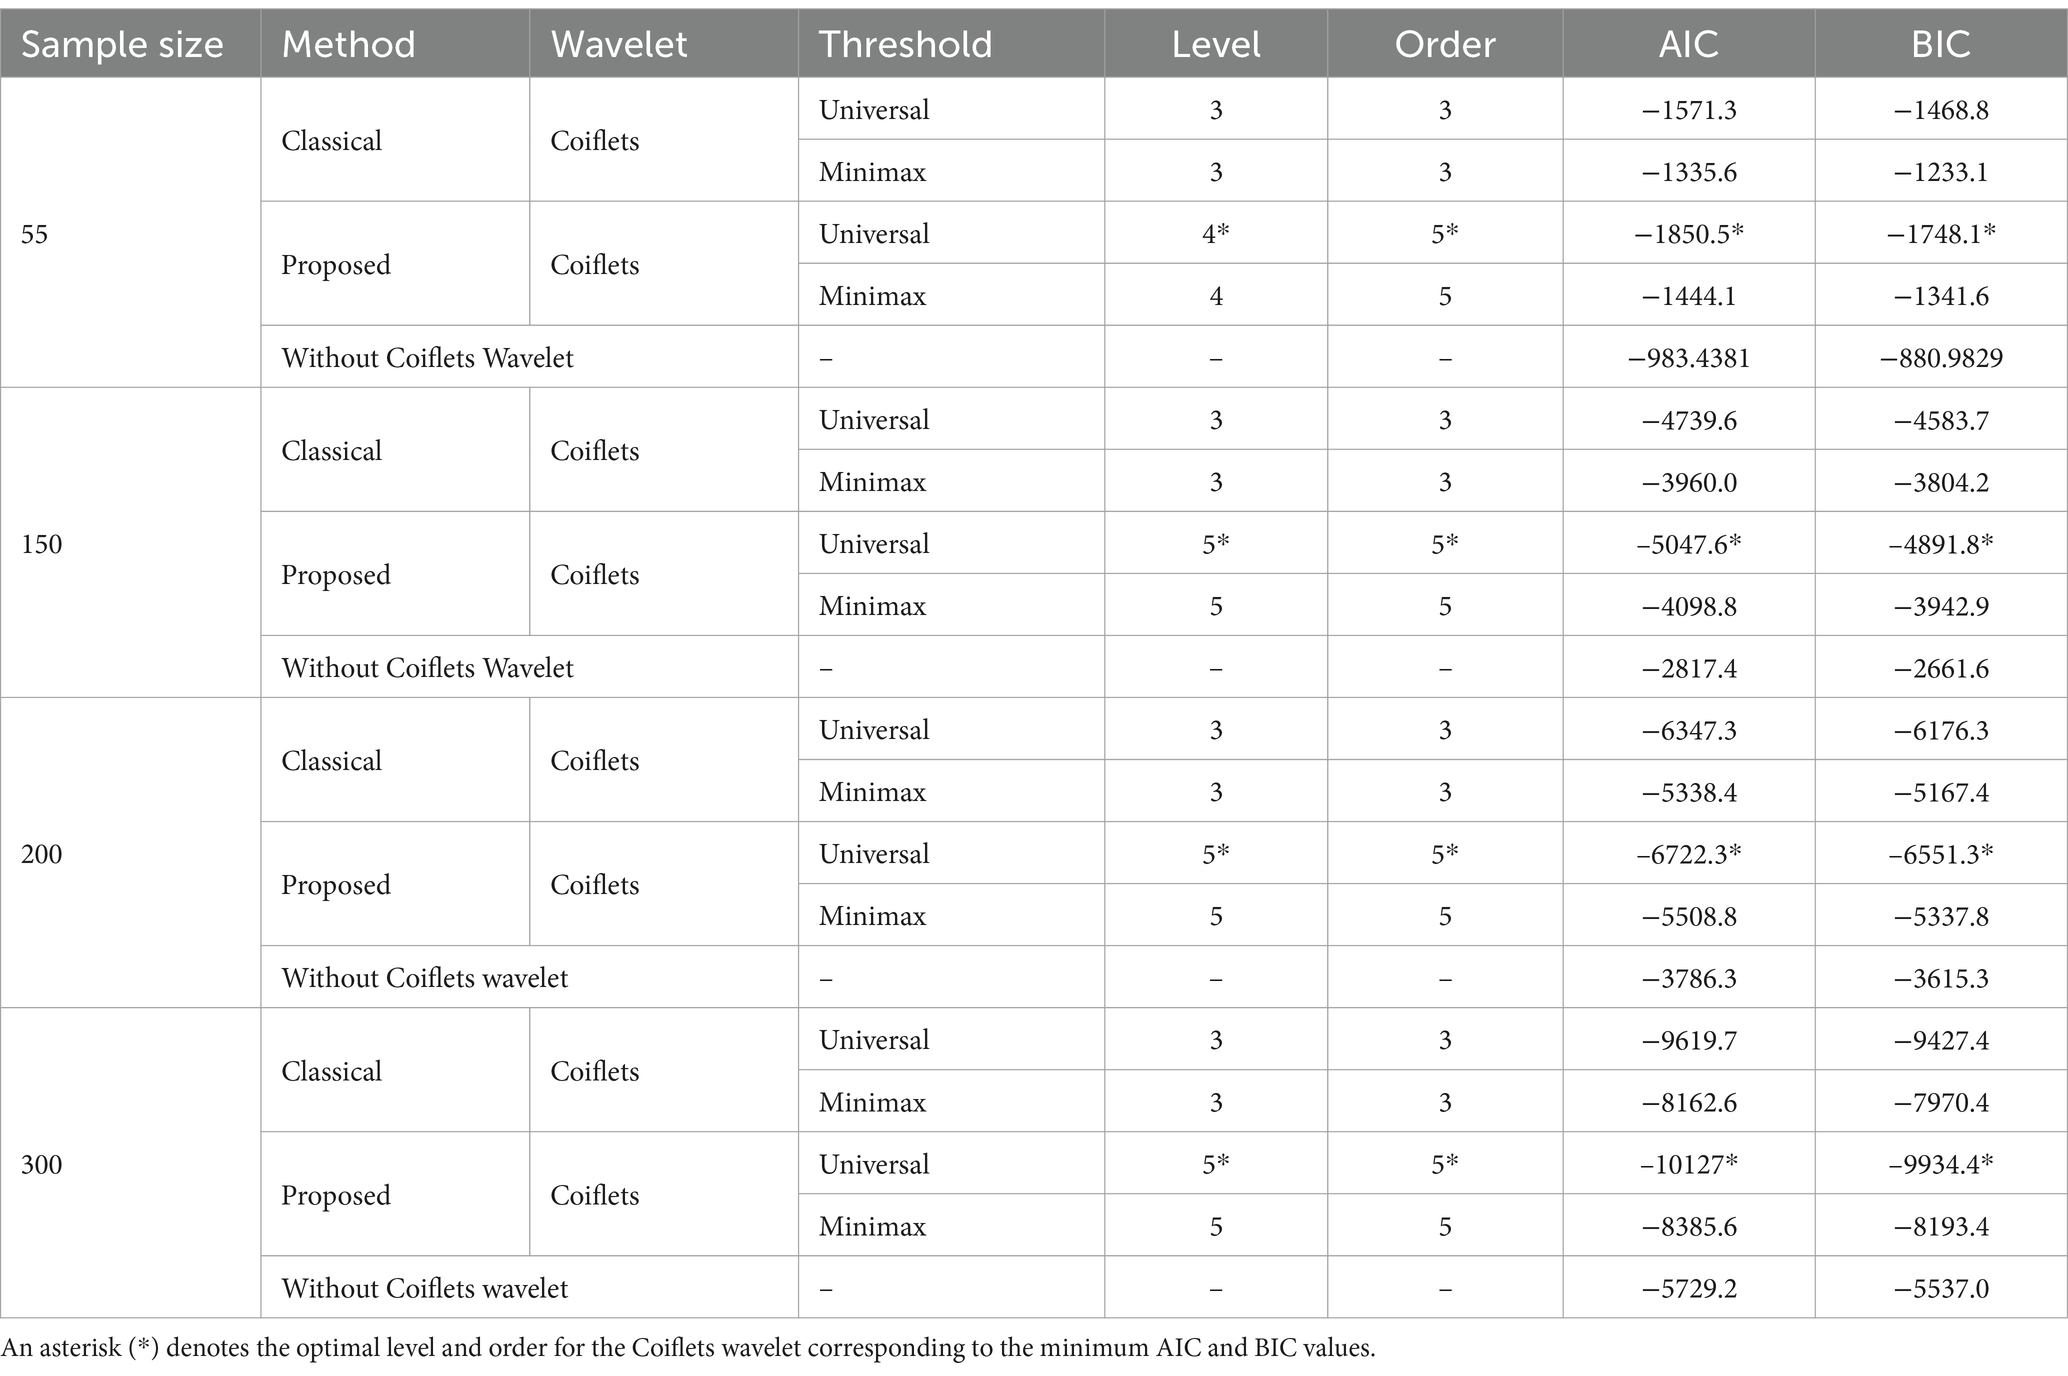
Table 6. Average AIC and BIC criteria for a four-dimensional VAR (3) model (30% noise).
Case (3): Average AIC and BIC criteria for a four-dimensional VAR (3) model, with the remaining 100% representing noise data in the method without Coiflets wavelet transformation, as shown in Table 7.

Table 7. Average AIC and BIC criteria for a four-dimensional VAR (3) model (100% noise).
For all cases presented in Tables 5–7, the results demonstrate that for each sample size (150, 200, and 300), the proposed method using universal thresholding consistently achieved the lowest AIC and BIC values, denoted with an asterisk (*). This indicates that the method achieved optimal performance at an optimal level (L) of 4 [where the maximum level is (5), depending on the sample size] (55). Additionally, the method achieved an optimal level (L) of 5 [where the maximum level is (7, 7, and 8), depending on the sample size (150, 200, and 300), respectively], alongside the optimal order (N) of 5 for each sample size (55, 150, 200, and 300), highlighting its effectiveness in denoising VAR time series data. For Table 5, the remaining 10% represents noise data; for Table 6, the remaining 30% represents noise data; and for Table 7, the remaining 100% represents noise data in the method without Coiflets wavelet transformation, in the context of a four-dimensional VAR (3) model. The results are as follows:
Across all tables, the lowest AIC and BIC values correspond to the optimal wavelet level (L = 5) and order (N = 5) for each sample size, indicating consistent model performance.
For all Tables 5–7 above, the classical method, though effective, did not perform as well as the proposed method. Without data denoise, which did not utilize Coiflets wavelet, exhibited higher AIC and BIC values, indicating lower efficiency and poorer model fit than the other methods. Without the application of the Coiflets wavelets, the model fails to result in accurate parameter estimation and forecasting capabilities. The denoise approach serves as a baseline, highlighting the significance of denoising methods in enhancing model performance and demonstrating the efficacy of wavelet-based denoising.
For all Tables 1–3, 5–7 above, the efficiency of these methods is assessed using the Akaike information criterion (AIC) and the Bayesian information criterion (BIC), which establish their minimum values. The results demonstrate that for each sample size (55,150, 200, and 300), both AIC and BIC values decrease as the percentage of noise or contamination in the data increases. These findings, presented in Table 1, through Table 8 support this observed trend. Thus, the inverse relationship between the level of noise and the AIC and BIC values is underscored across all tables.
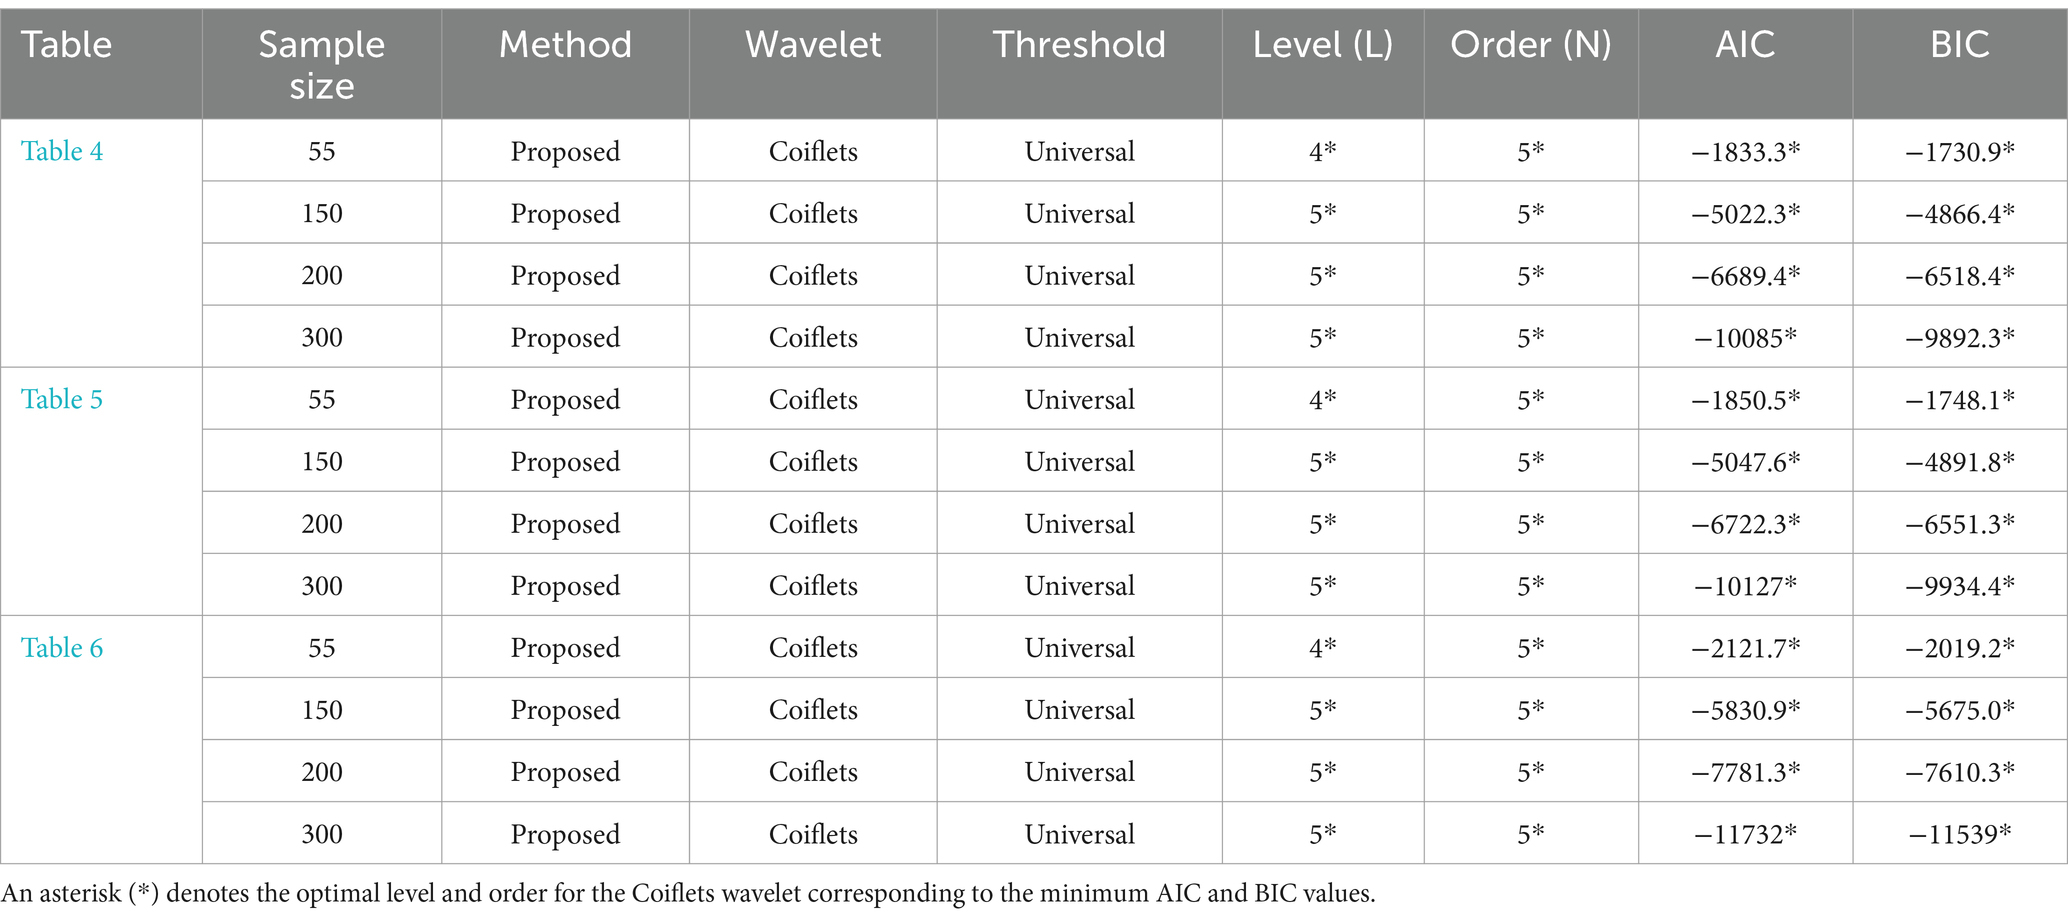
Table 8. Optimal performance (L, N) based on lowest AIC and BIC criteria for a four-dimensional VAR (3) model.
Finally, for all cases presented in Tables 5–7, the results demonstrate that for each sample size (55,150, 200, and 300), the proposed method using universal thresholding with the soft rule to determine the optimal level and optimal order shows superior performance in terms of the Akaike Information Criterion (AIC) and the Bayesian Information Criterion (BIC). This method consistently achieved the lowest AIC and BIC values, denoted with an asterisk (*). Specifically, the four-dimensional VAR (3) time series model demonstrates more efficient performance, indicating an improved model fit, with lower AIC and BIC values than the 4-dimensional VAR (2) time series model, as shown in Tables 1–3.
The displayed graphs depict time series data from Johansen’s Danish dataset, focusing on key economic indicators: log real money (M2), log real income (Y), bond rate (IB), and bank deposit rate (ID) spanning the period from January 1974 to July 1987. A crucial first step in time series analysis is to plot the observations over time, commonly referred to as a time series plot (Figures 1, 2). This is a critical aspect of the analytical process, and researchers are consistently encouraged to generate such plots for any time series under investigation. By doing so, an initial insight can be gained into the potential characteristics of the series, particularly regarding its stability, by examining the patterns of fluctuations and identifying whether a secular trend is present. Furthermore, recognizing the existence or absence of seasonal variations is of equal importance. This preliminary evaluation provides the groundwork for conducting more precise stability tests. To ascertain whether these time series are stationary, we will closely examine their visual properties and inherent trends.
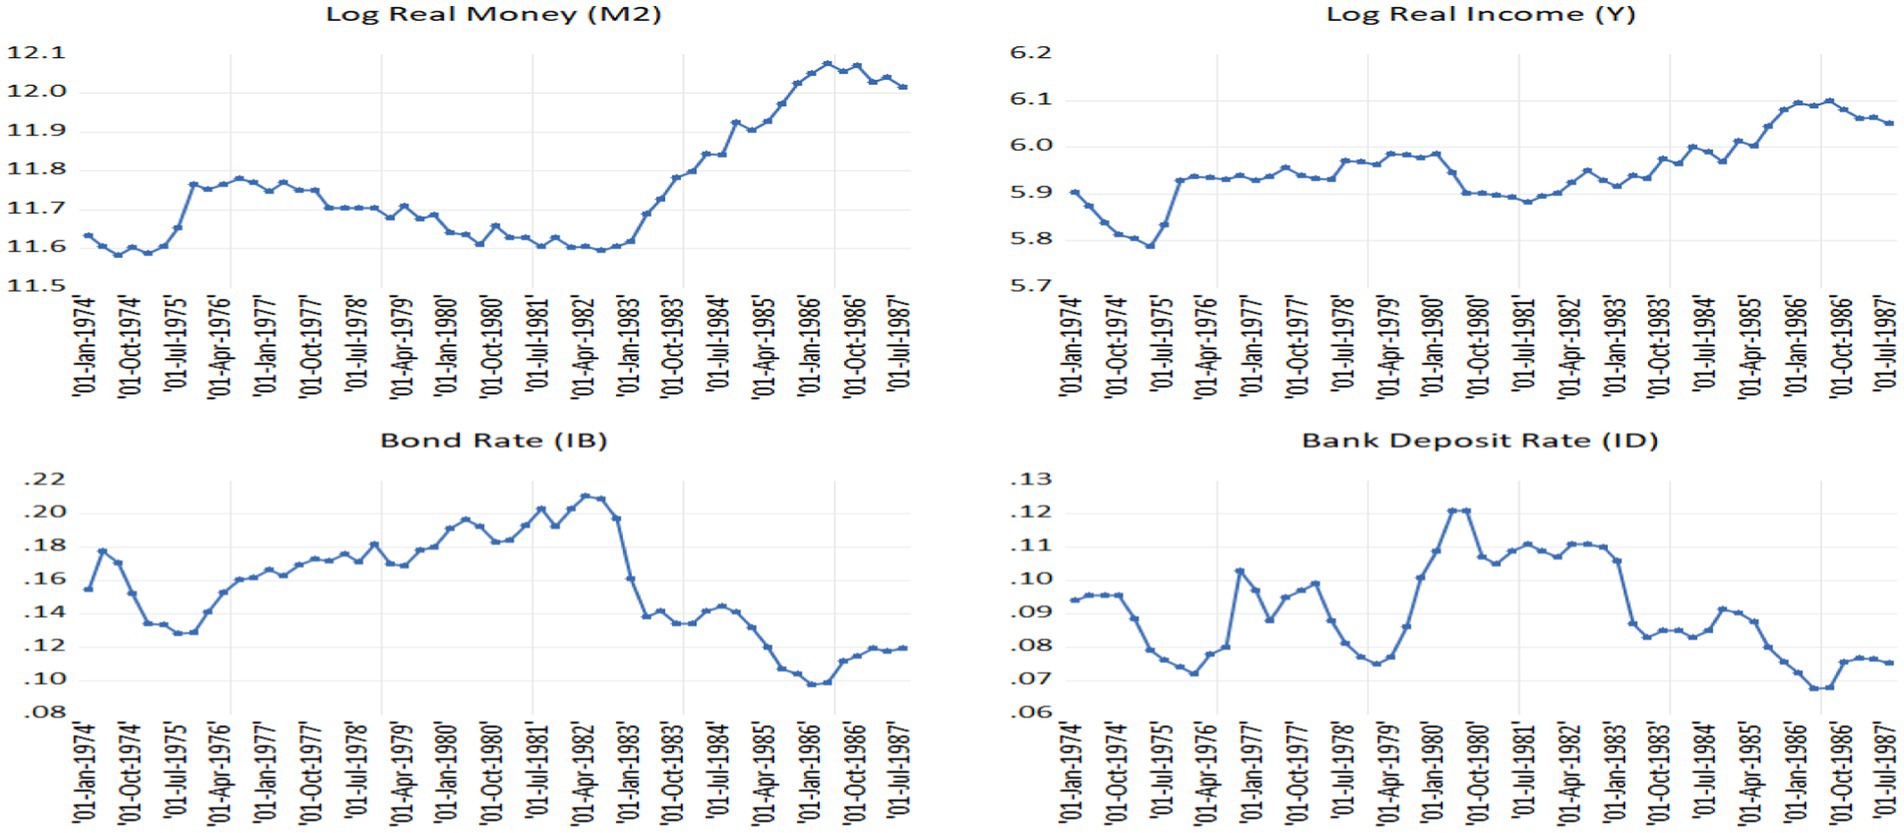
Figure 1. Time series plot using Johansen’s Danish dataset.
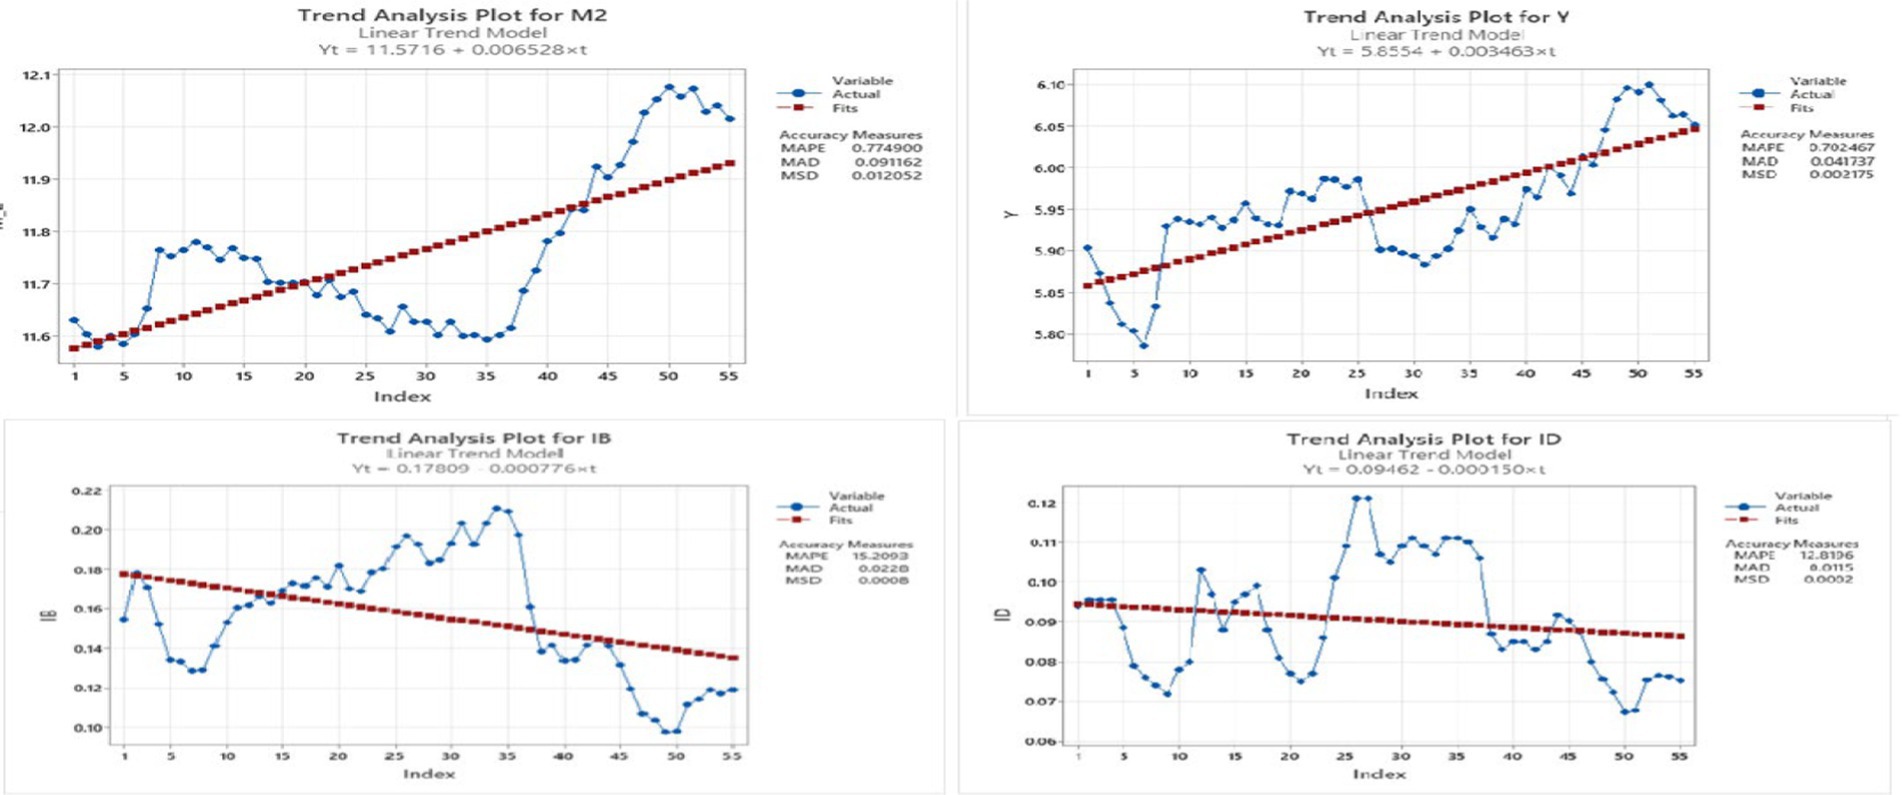
Figure 2. Analysis of the general trend using Johansen’s Danish dataset.
Visual inspection of Figures 1, 2 above suggests that all four-time series are non-stationary in the mean, indicating a trend despite being stationary in variance. Trends, level shifts, and varying volatility are observed over the 55 quarters. To verify this, stationarity tests such as the augmented Dickey––Fuller (ADF) should be applied. Additionally, the Perron test for structural breaks can be employed to identify any significant structural changes in the data, such as shifts in the mean or variance, which might indicate non-stationarity caused by external shocks or policy changes. If non-stationarity is confirmed, differing data, such as taking first differences, can remove trends and stabilize the variance. This step also mitigates the impact of structural breaks if detected. Subsequent analysis, including vector autoregression (VAR) modeling, should then be conducted on the differenced data to ensure accurate and reliable outcomes.
Specialized tests, such as the augmented Dickey–Fuller (ADF) tests, are employed to evaluate the stationarity of time series data. These tests are conducted based on the optimal lag periods, as shown in Table 9, to determine whether a time series is stable around a mean or linear trend or if it remains unstable due to the presence of a unit root. The hypotheses tested are as follows:
• Null Hypothesis H0: The data contain a unit root (it is non-stationary).
• Alternative Hypothesis H1: The data do not contain a unit root (it is trend stationary).

Table 9. Augmented Dickey–Fuller test for Johansen’s Danish dataset.
Stationary I(1) *: The null hypothesis is rejected ( ) at a significance level = 0.05. Or p 0.05.
Table 9 shows the ADF stationarity test results showing that all variables (M2, Y, IB, and ID) are non-stationary at their levels as the null hypothesis of unit root cannot be rejected. However, when these variables differ for the first time, the null hypothesis is rejected, indicating that the first differences of all variables are stationary and integrated from the first order, I(1). The ADF stationarity test results are as follows:
• First Difference for M2 (log real money): The absolute test statistic is 3.027991, greater than the absolute critical value of 1.947248 (the p-value is 0.0031 < 0.05), indicating that the null hypothesis is rejected. Therefore, the first difference of M2 is stationary I(1).
• First Difference for Y (log real income): The absolute test statistic is 6.041139, greater than the absolute critical value of 1.947119 (the p-value is 0.0000 < 0.05), indicating that the null hypothesis is rejected. Therefore, the first difference of Y is stationary [I (1)].
• First Difference for IB (bond rate): The absolute test statistic is 5.300421, greater than the absolute critical value of 1.947119 (the p-value is 0.0000 < 0.05), indicating that the null hypothesis is rejected. Therefore, the first difference of IB is stationary [I (1)].
• First Difference for ID (bank deposit rate): The absolute test statistic is 5.292583, greater than the absolute critical value of 1.947119 (the p-value is 0.0000 < 0.05), indicating that the null hypothesis is rejected. Therefore, the first difference of ID is stationary [I (1)].
This observation strongly suggests that the series achieve stationarity at their first differences. This is confirmed by the results of the augmented Dickey–Fuller test.
Purpose of the Perron test, when working with time series data, it is often observed that a change has occurred in the behavior of a variable of interest (normally at its mean). The event may occur due to a change in the economic environment or the data environment. The test uses the augmented Dickey–Fuller test to identify the specific time when a single shift occurs. Once the date (or dates) of a unit root change is revealed, the researcher can take the structural adjustment into account. The structural adjustment arises by considering different patterns of the series, adding an intercept or a trend to the model, carrying out a dummy regression, or applying a weighted average to the time series (8, 28). In this study, the Perron test was applied to identify potential structural breaks in the time series data. This test serves as a critical tool for detecting significant changes in variable behavior, which may indicate structural shifts that affect the stability and predictive accuracy of the model. According to the results, if the absolute value of the T-Stat exceeds 1.96, a structural break is detected. However, all variables in this study showed no significant structural breaks at the 5% significance level, as shown in Table 10.
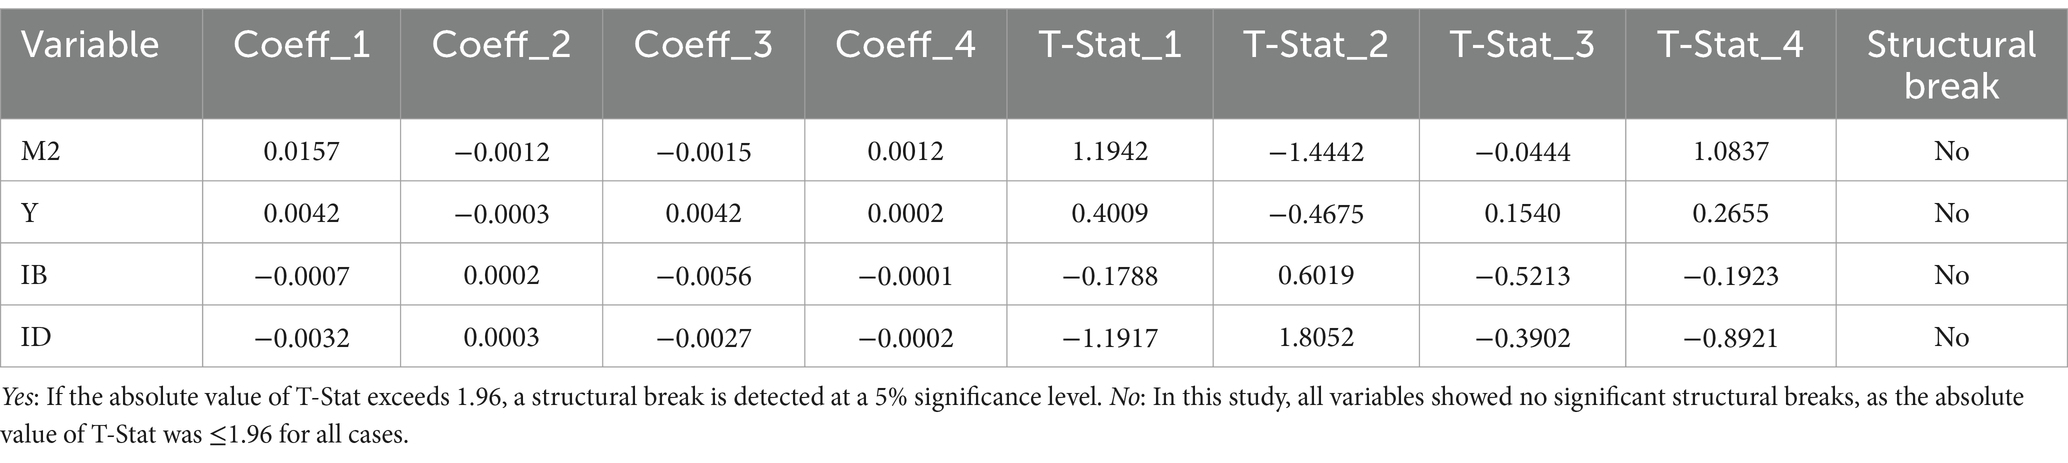
Table 10. Perron test for structural breaks using Johansen’s Danish dataset.
Table 10 displays the results of the Perron test, confirming the absence of significant structural breaks in all variables (M2, Y, IB, and ID). The absolute T-statistics for each variable were below the critical threshold of 1.96, indicating no structural break at the 5% significance level. The specific values are as follows:
• M2: T-Stat values are 1.1942, −1.4442, −0.0444, and 1.0837. All are below 1.96, confirming no structural break.
• Y: T-Stat values are 0.4009, −0.4675, 0.1540, and 0.2655, well below 1.96.
• IB: T-Stat values are −0.1788, 0.6019, −0.5213, and − 0.1923, none of which exceed 1.96.
• ID: T-Stat values are −1.1917, 1.8052, −0.3902, and − 0.8921, all below the threshold.
These findings suggest that the time series data for all variables remained stable during the analyzed period. The absence of structural breaks supports the assumption that the first differencing successfully addressed potential non-stationarity, enhancing the reliability of the VAR model in capturing dynamic relationships among the variables. This stability underscores the robustness of the model and its suitability for accurate time series forecasting.
Figure 3 represents the structural break analysis for the four economic variables (M2, Y, IB, and ID) using the Perron test. The blue line illustrates the stability of the time series after applying the first difference, whereas the red dashed line indicates the hypothetical structural break point at observation 28 (the midpoint of the total 55 observations). Visual inspection reveals no significant changes or abrupt breaks in the trends before or after this point, suggesting the absence of major structural breaks.
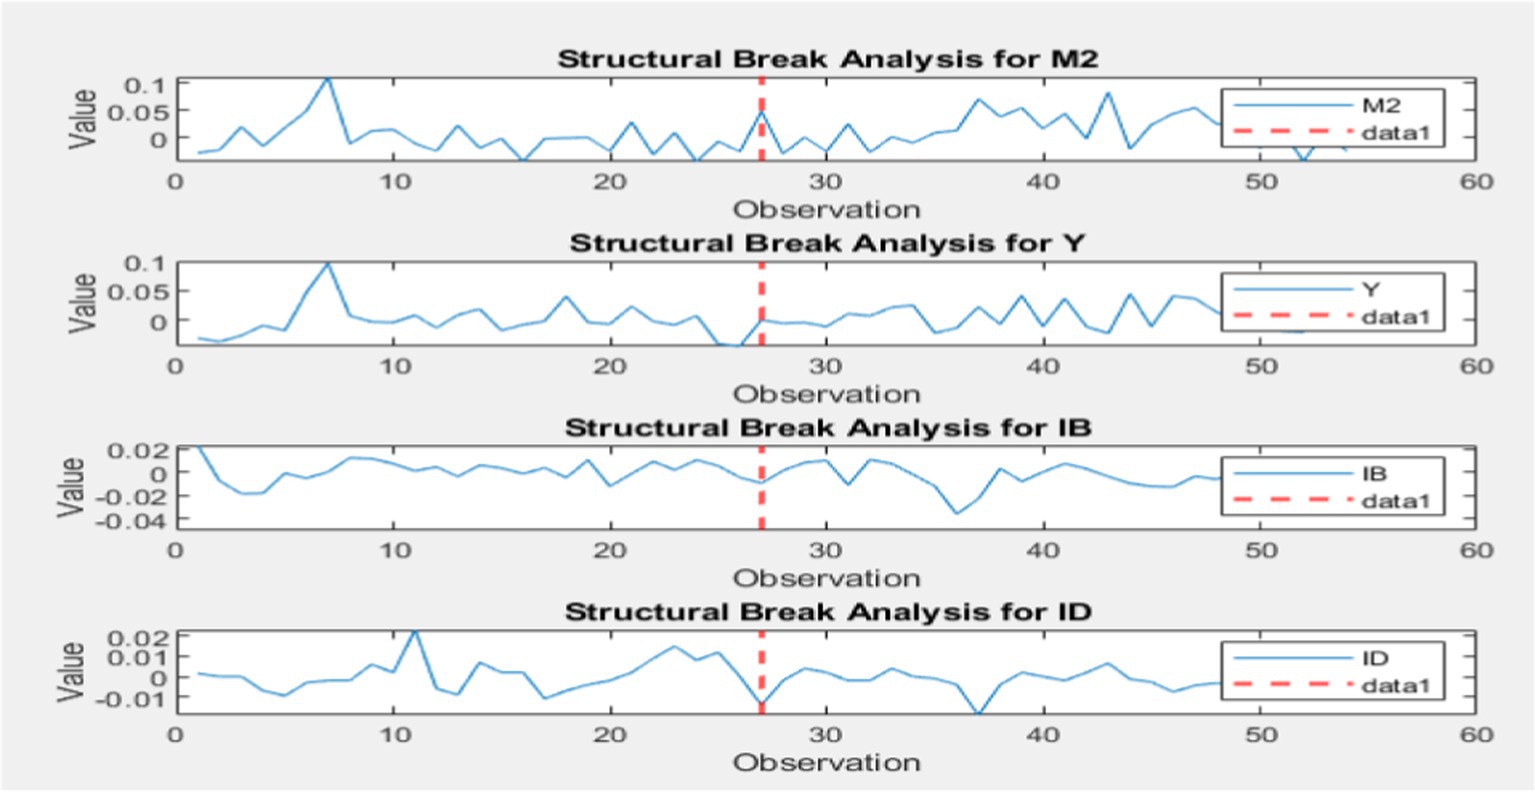
Figure 3. Perron test for structural breaks plot using Johansen’s Danish dataset.
The results in Table 10 support this analysis, with the absolute values of the T-statistics (T-Stat) as follows:
• M2: (1.1942, 1.4442, 0.0444, 1.0837)
• Y: (0.4009, 0.4675, 0.1540, 0.2655)
• IB: (0.1788, 0.6019, 0.5213, 0.1923)
• ID: (1.1917, 1.8052, 0.3902, 0.8921)
All values are below the critical threshold of 1.96, indicating no significant structural breaks. This confirms the stability of the data and supports the reliability of the VAR model in analyzing the dynamic relationships between variables.
These findings are essential in constructing a vector autoregressive (VAR) model, as VAR models typically require stationary data to produce accurate and interpretable results.
This study evaluates the effectiveness of Coiflets transforms and thresholding strategies on a 4D vector autoregressive model for the Danish Johansen dataset. The aim is to identify the optimal model by using the Akaike Information Criterion (AIC) and Bayesian Information Criterion (BIC) to determine the optimal level and order of the Coiflets wavelets to remove noise within the VAR framework, ensuring stationarity for reliable and steady model estimates and interpretations, as demonstrated in Table 11. Sample sizes for n = 55 were used in the actual data experiment. These sample sizes were defined as , where j is a positive integer that represents the level and L is the maximum level. For instance, n = 32, which is a lower sample size than the original sample size of n = 55, is obtained when j = 5 (max L = 5).
Table 11. Average AIC and BIC criteria for a four-dimensional VAR models.
Table 11 shows that the proposed method using the Coiflets wavelet transforms with universal thresholding at the optimal level (L = 5) and order (N = 5) for the VAR (3) model outperforms other VAR models with different orders (1 and 2), as indicated by an asterisk (*). This method achieves the lowest AIC and BIC values of −3293.7 and − 3191.3, respectively, underscoring its effectiveness in removing noise and improving model fit than both the classical approach and the approach without wavelet transforms. Although the classical method remains effective, it provides higher AIC and BIC values, and models without Coiflets transforms perform even worse. These results indicate that the proposed method is highly effective for noise removal and provides greater model accuracy, making it an optimal choice for analyzing complex time series data. Proposed AR (3) model for stationary time series data.
As described in the theoretical framework, the AR (3) model for stationary time series data, using the proposed method, demonstrates superior performance, particularly when applying Coiflets wavelet transformations and universal thresholding at the optimal level (L = 5) and order (N = 5). Consequently, the four-dimensional VAR (3) model with a constant term was selected based on achieving the lowest AIC and BIC values. Table 11 presents the estimation results for this model, and the mathematical form of the VAR (3) model is as follows:
Table 12 presents the estimation results of the VAR (3) model, highlighting statistically significant coefficients. For instance, the constant for the first variable () has a T-statistic of 3.0143 and a p-value of 0.0026, while the AR {3} (1,1) coefficient shows a T-statistic of 39.6224 and a p-value of 0, demonstrating strong significance. Additionally, AR {3} (4,4) with a T-statistic of 3.7853 and a p-value of 0.00015 indicates a substantial effect of the third lag on the fourth variable. These results underline the importance of lags in explaining temporal dynamics and support the reliability of the VAR (3) model in capturing relationships among variables.
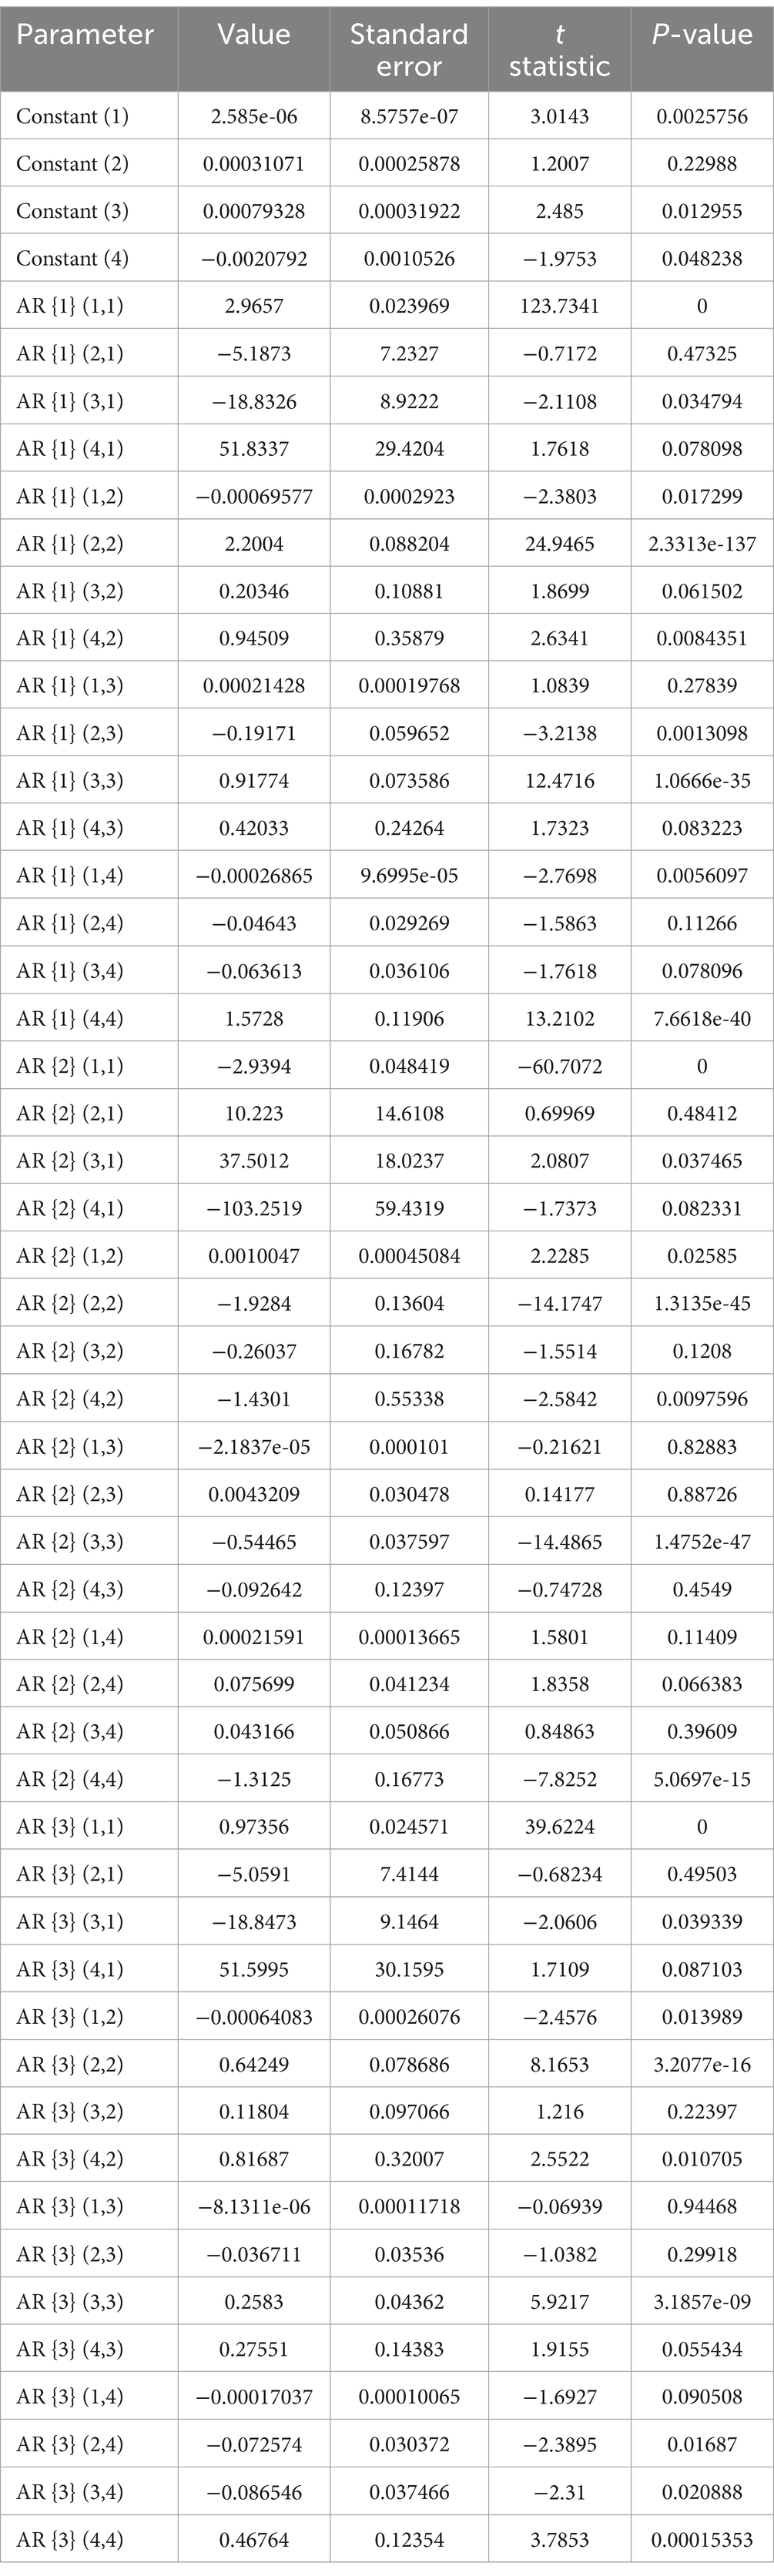
Table 12. Presents the estimation results for the AR-stationary 4-dimensional VAR (3) model.
Figure 4 compares observed data (blue lines) with predictions (red lines) for four time series variables (yo1, yo2, yo3, and yo4). The model shows strong performance for yo1 and yo2, effectively capturing the dynamics, while slight deviations in yo3 and yo4 suggest room for refinement. Overall, the VAR (3) model, incorporating the Coiflets wavelet transformations and universal thresholding, remains robust, although further optimization could improve accuracy for certain variables.
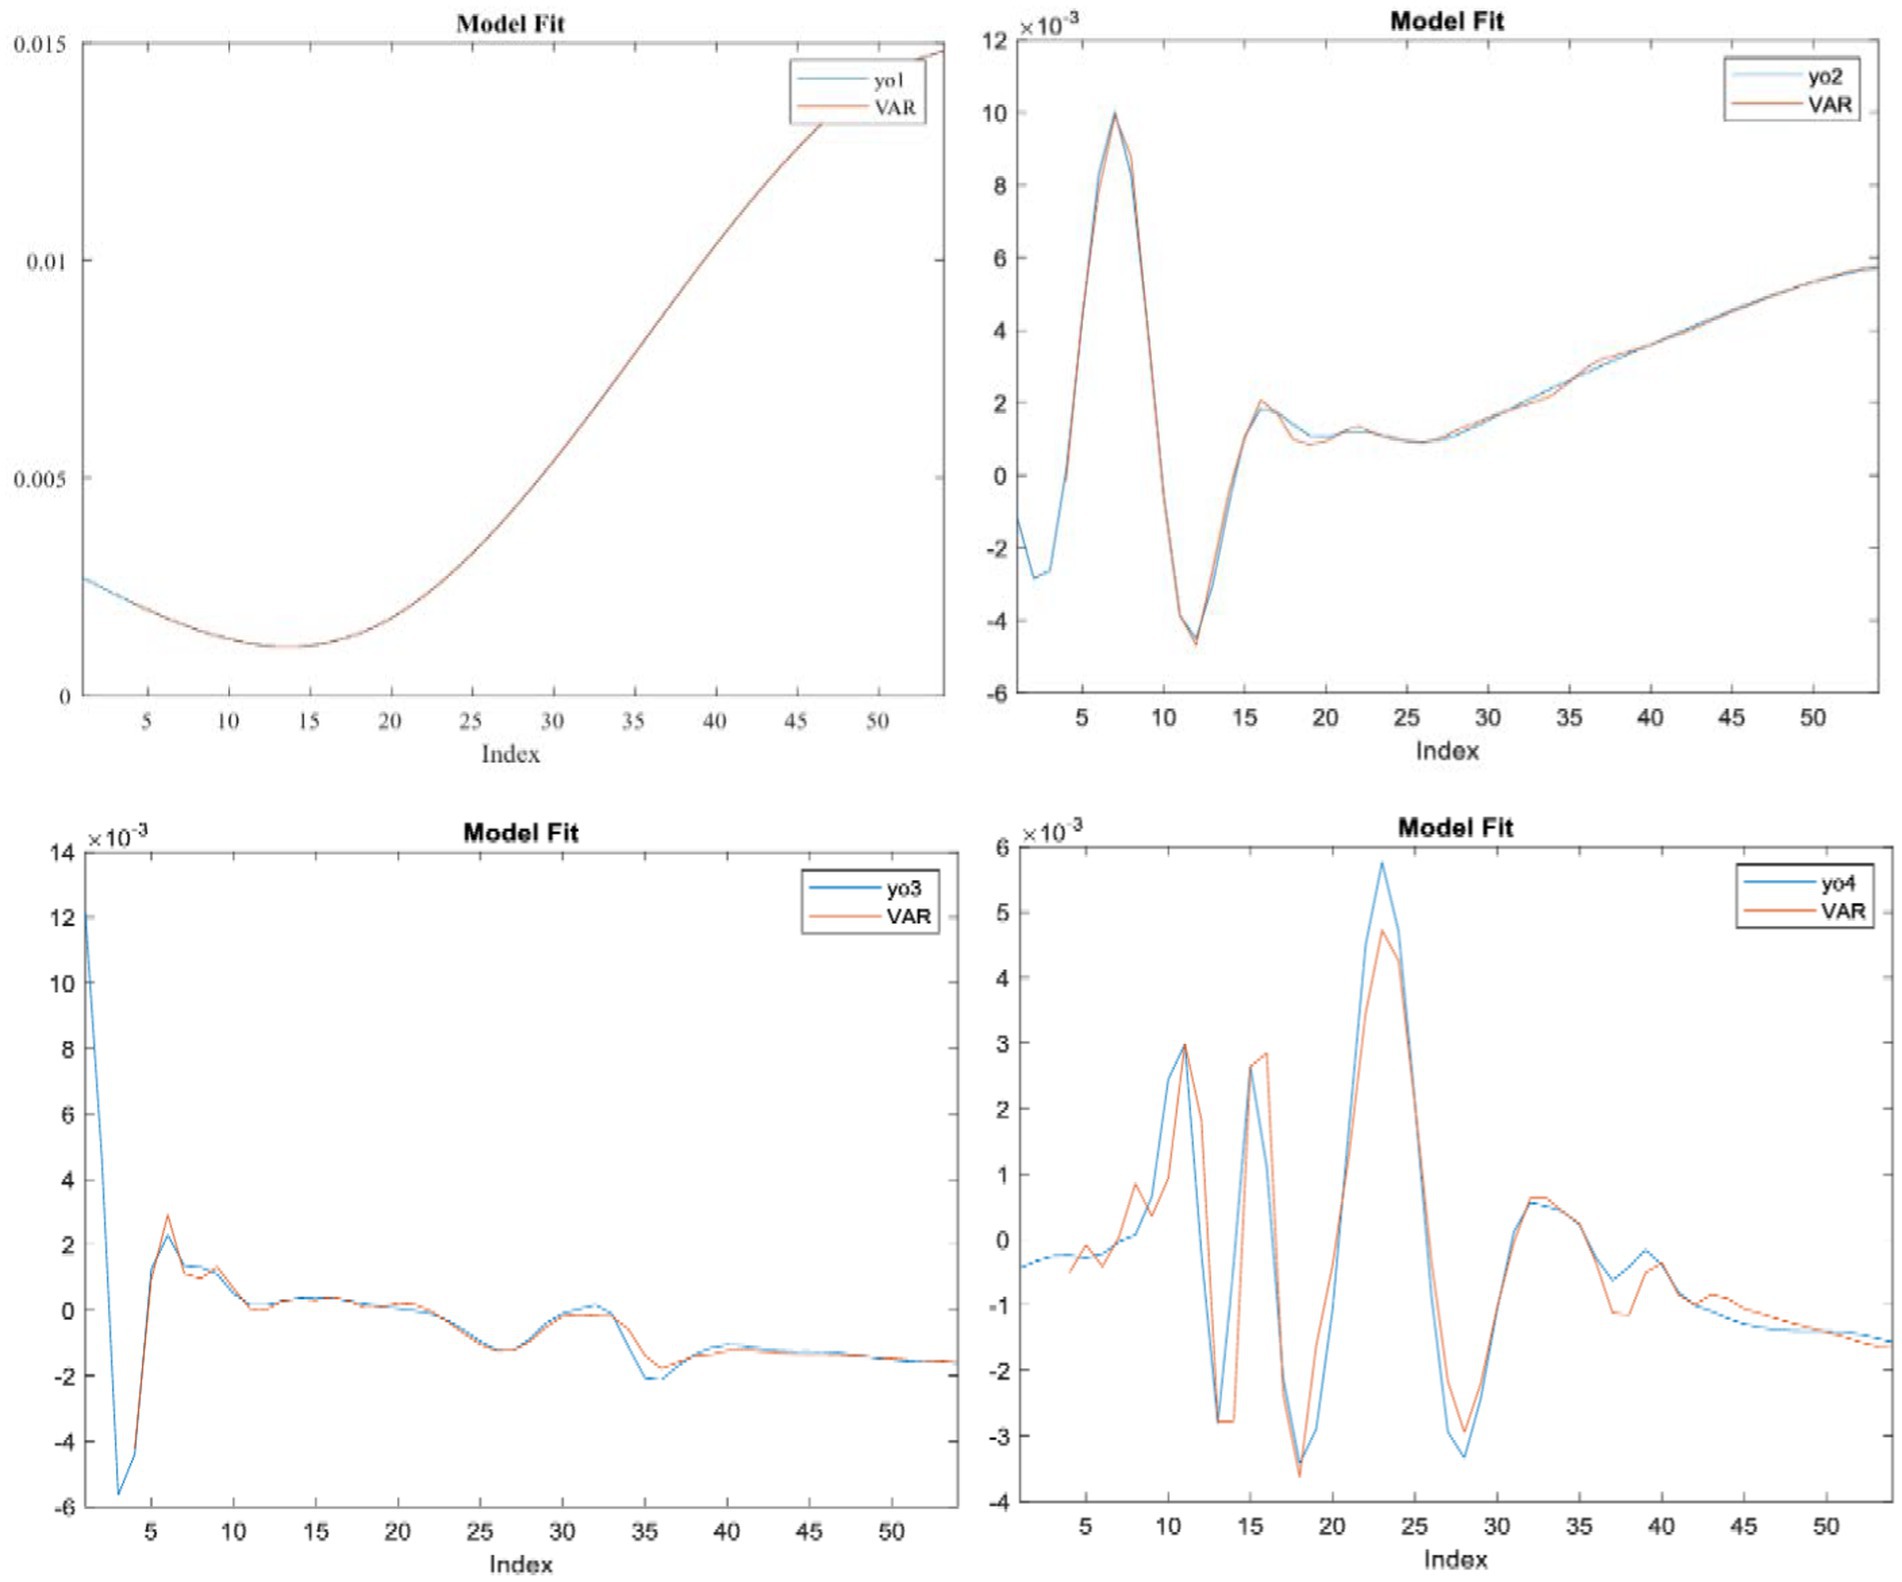
Figure 4. Fit of the proposed VAR (3) model across four different time series variables.
Figure 5 presents the diagnostic results for the residuals of the proposed VAR (3) model, confirming that it is well-specified and effectively captures the dynamics of the data. Residuals for all variables (M2, Y2, IB, and ID) fluctuate around the zero line, indicating no systematic bias in predictions. Most autocorrelation coefficients fall within the confidence intervals, demonstrating uncorrelated residuals and stable error variance. These findings validate the model’s suitability for forecasting and its reliability in analyzing complex time series data.
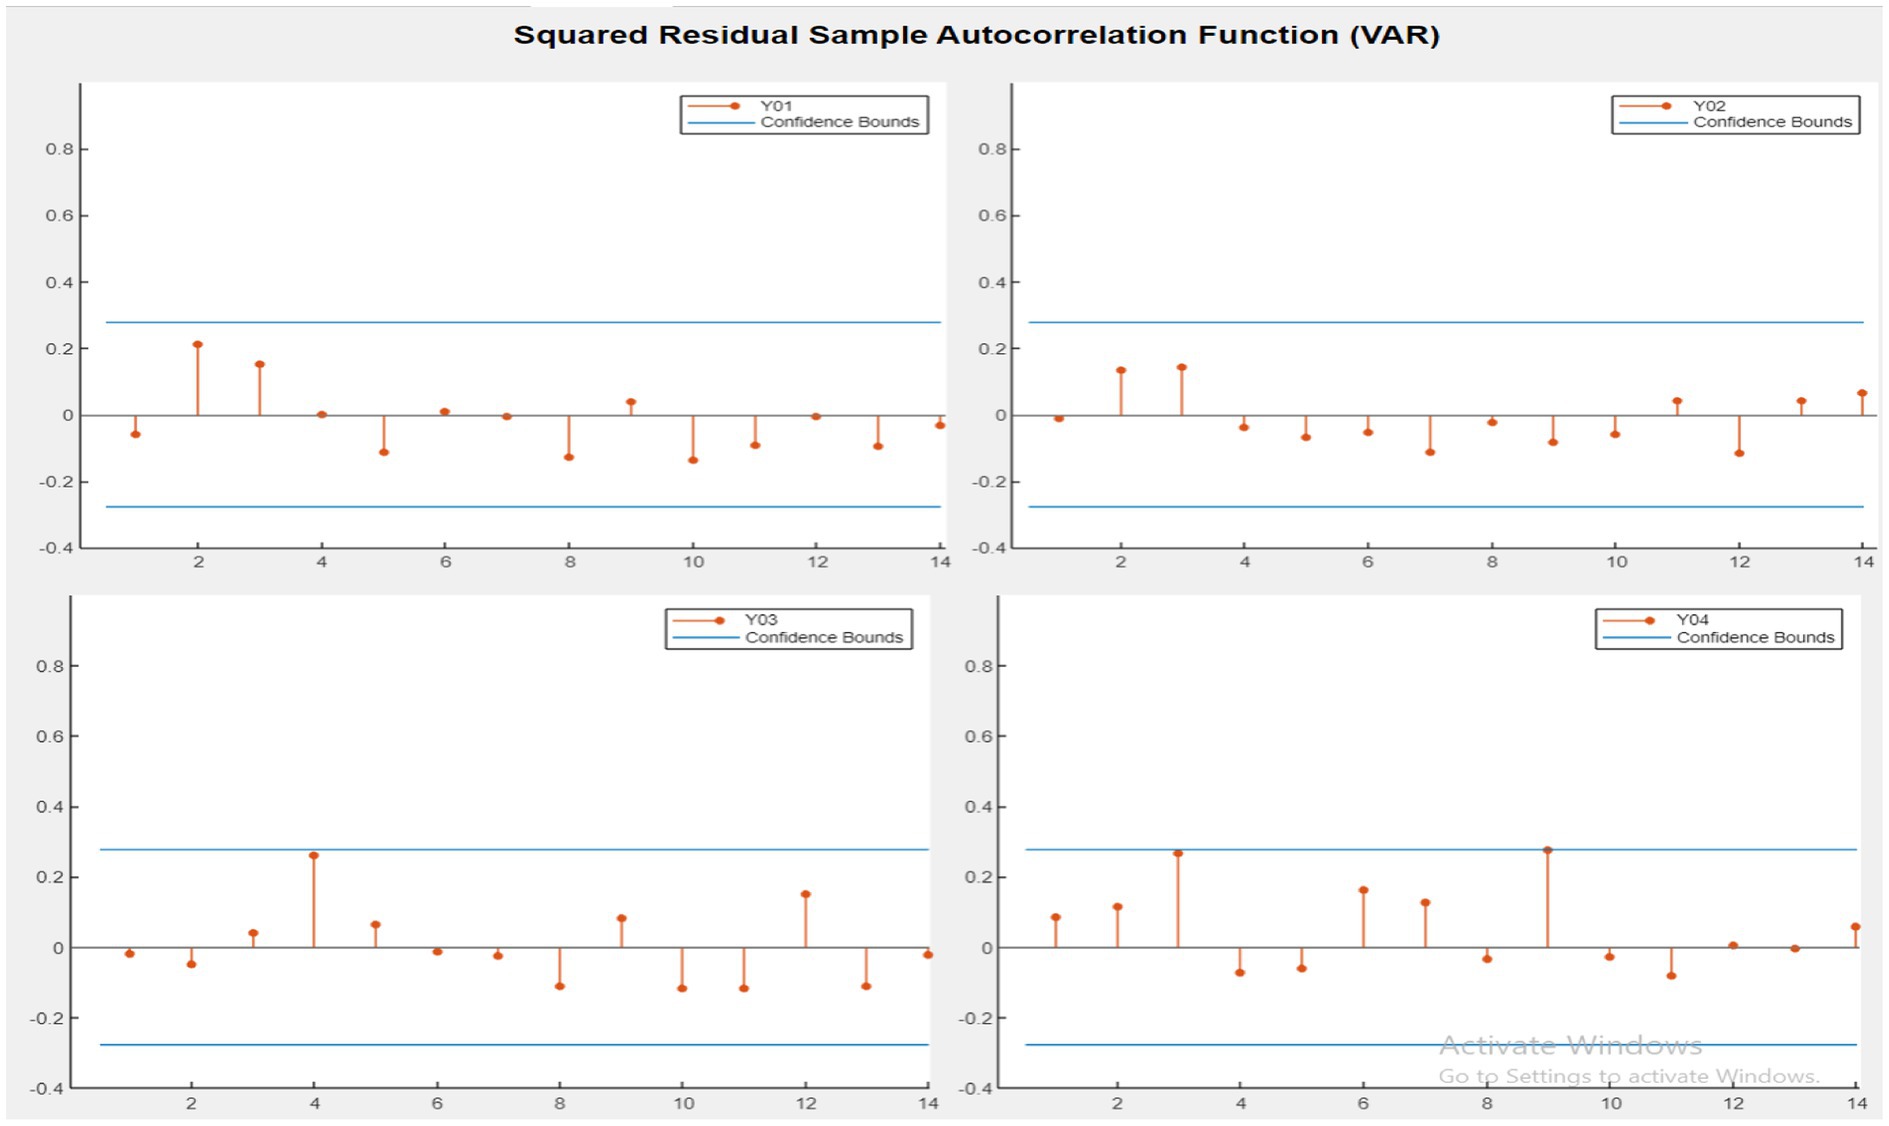
Figure 5. Square residual sample autocorrelation function the proposed AR (3) model.
The research presents many important conclusions in the analysis of both the simulation study and the real data. The research led to the main conclusion from the simulation study analysis, which is that the proposed method with universal thresholding consistently outperforms the classical and without the Coiflets wavelet transformations methods, achieving the lowest AIC and BIC values for all sample sizes (55, 150, 200, and 300) in the VAR (2) and VAR (3) models. While the classical method is effective, it underperforms compared to the proposed approach. Higher AIC and BIC values in models without Coiflets wavelet application highlight the importance of wavelet-based denoising for enhancing model accuracy in parameter estimation and forecasting.
This study shows that Coiflets wavelet transformations effectively denoised the data, demonstrating robustness even in the presence of outliers. The universal threshold method consistently presented better AIC and BIC results across all sample sizes than the minimax threshold, especially in larger samples where it shows superior model fit and accuracy. In addition, optimal wavelet levels and orders were identified, with the proposed method achieving the best performance in reducing noise across all contamination levels, as evidenced in Tables 1–6. As noise levels increase, AIC and BIC values decrease across all models and sample sizes, demonstrating an inverse relationship consistently supported by the data.
From real data analysis, it becomes obvious that treating instability by differencing is necessary to obtain reliable estimates for the VAR model. This supports the augmented Dickey–Fuller tests, which prove that the variables become stationary after the first differentiation and show insignificant autocorrelations. From this study, we concluded that higher order VAR models (p = 1, 2, 3) consistently achieve lower AIC and BIC values, which indicates their strong effectiveness in capturing the underlying time series dynamics. Based on the Coiflets wavelet transformations and universal thresholds, the proposed method consistently gives a superior approach that achieves the lowest AIC and BIC values. The noise removal wavelet-based is necessary to significantly improve the model performance, as the VAR (3) model shows the best fit and accurately captures the time series dynamics. Diagnostic tests validated the model’s robustness, confirming an absence of autocorrelation and substantial heterogeneity, enhancing the reliability of the predictions. Universal thresholding outperformed the minimax method, establishing itself as the most efficient technique for wavelet-based noise removal in complex time series data. This adaptability of the method suggests it can be effectively applied to other intricate time series datasets that require accurate noise reduction and precise modeling for improved predictive outcomes.
• Utilize the proposed wavelet method even in the absence of data contamination to continuously improve the performance and accuracy of the model.
• Explore alternative wavelet families, including Coiflets, Daubechies, Symlets, Biorthogonal, and Reverse Biorthogonal, to identify the most effective levels and orders for noise removal in complex time series.
• Employ higher order VAR models for analyzing complex economic data to better capture dynamic patterns in time series.
• Future studies should focus on integrating wavelet shrinkage techniques, which address noise in both time and frequency domains, with the adaptive Kalman filter. The adaptive Kalman filter is particularly known for its ability to handle system uncertainties and its iterative capabilities in real-time parameter estimation. This integration aims to develop a more robust, precise, and efficient model for noise reduction and improved forecasting, particularly in dynamic and uncertain environments. Such an approach holds significant potential for applications in economic systems, where accurate time series forecasting is critical for policymaking, and in climate modeling, where reducing noise in complex datasets can significantly enhance prediction reliability.
IE: Writing – original draft, Writing – review & editing. TA: Writing – review & editing, Writing – original draft, Conceptualization, Supervision.
The author(s) declare that no financial support was received for the research, authorship, and/or publication of this article.
The authors declare that the research was conducted in the absence of any commercial or financial relationships that could be construed as a potential conflict of interest.
The author(s) declare that no Gen AI was used in the creation of this manuscript.
All claims expressed in this article are solely those of the authors and do not necessarily represent those of their affiliated organizations, or those of the publisher, the editors and the reviewers. Any product that may be evaluated in this article, or claim that may be made by its manufacturer, is not guaranteed or endorsed by the publisher.
1. Brockwell, PJ, and Davis, RA. Time series: Theory and methods. 2nd ed. New York, NY: Springer-Verlag (1991).
2. Weng, J, Liu, X, Zhou, Y, and Wang, J. An explicit wavelet method for solution of nonlinear fractional wave equations. Mathematics. (2022) 10:4011. doi: 10.3390/math10214011
3. Donoho, DL. De-noising by soft-thresholding. IEEE Trans Inf Theory. (1995) 41:613–27. doi: 10.1109/18.382009
4. Donoho, DL, and Johnstone, IM. Minimax estimation via wavelet shrinkage. Ann Stat. (1998) 26:879–921. doi: 10.1214/aos/1024691081
5. Özbek, L, and Aliev, FA. Comments on adaptive fading Kalman filter with an application. Automatica. (1998) 34:1663–4. doi: 10.1016/S0005-1098(98)80025-3
6. Percival, DB, and Walden, AT. Wavelet methods for time series analysis. Cambridge: Cambridge University Press; (2000). 1–19.
8. Özbek, L, and Efe, M. An adaptive extended Kalman filter with application to compartment models. Commun Stat Simulation Comput. (2004) 33:145–58. doi: 10.1081/SAC-120028438
9. Liu, X, Liu, H, Guo, Q, and Zhang, C. Adaptive wavelet transform model for time series data prediction. Soft Comput. (2020) 24:5877–84. doi: 10.1007/s00500-019-04400-w
10. Peng, L, Chen, K, and Li, N. Predicting stock movements: using multiresolution wavelet reconstruction and deep learning in neural networks. Information. (2021) 12:388. doi: 10.3390/info12100388
11. Dastgerdi, AK, and Mercorelli, P. Investigating the effect of noise elimination on LSTM models for financial markets prediction using Kalman filter and wavelet transform. WSEAS Trans Bus Econ. (2022) 19:432–41. doi: 10.37394/23207.2022.19.39
12. Nafisi-Moghadam, M, and Fattahi, S. A hybrid model of VAR-DCC-GARCH and wavelet analysis for forecasting volatility. Eng Proc. (2022) 18:6. doi: 10.3390/engproc2022018006
13. Tamilselvi, C, Yeasin, M, and Paul, R. Can denoising enhance the prediction accuracy of learning models? A case of wavelet decomposition approach. Forecasting. (2024) 6:81–99. doi: 10.3390/forecast6010005
14. Ali, TH, Raza, MS, and Abdulqader, QM. VAR time series analysis using wavelet shrinkage with application. Sci J Univ Zakho. (2024) 12:345–55. doi: 10.25271/sjuoz.2024.12.3.1304
15. Haydier, EA, Albarwari, NHS, and Ali, TH. The comparison between VAR and ARIMAX time series models in forecasting. Iraqi J Stat Sci. (2023) 20:249–62. doi: 10.33899/IQJOSS.2023.0181260
16. Zivot, E, and Wang, J. Vector autoregressive models for multivariate time series. New York, NY: Springer (2003).
17. Haslbeck, JM, Bringmann, LF, and Waldorp, LJ. A tutorial on estimating time-varying vector autoregressive models. Multivar Behav Res. (2021) 56:120–49. doi: 10.1080/00273171.2020.1743630
18. Burnham, KP, and Anderson, DR. Multimodel inference: understanding AIC and BIC in model selection. Sociol Methods Res. (2004) 33:261–304. doi: 10.1177/0049124104268644
19. Acquah, HDYG, and Carlo, M. Comparison of Akaike information criterion (AIC) and Bayesian information criterion (BIC) in the selection of an asymmetric price relationship. J Dev Agric Econ. (2010) 2:1–6.
20. Mallat, S. A wavelet tour of signal processing: The sparse way. 3rd ed. New York, NY: Academic Press (2009).
21. Ali, TH, Albarwari, NHS, and Ramadhan, DL. Using the hybrid proposed method for quantile regression and multivariate wavelet in estimating the linear model parameters. Iraqi J Stat Sci. (2023) 20:9–24. doi: 10.33899/iqjoss.2023.0178679
22. Ali, TH, and Saleh, DM. Proposed hybrid method for wavelet shrinkage with robust multiple linear regression model: with simulation study. Qalaai Zanist J. (2022) 7:920–37.
23. Ali, TH, and Mustafa, Q. Reducing the orders of mixed model (ARMA) before and after the wavelet de-noising with application. J Hum Sci. (2016) 20:433–42.
24. Karamikabir, H, Afshari, M, and Lak, F. Wavelet threshold based on Stein’s unbiased risk estimators of restricted location parameter in multivariate normal. J Appl Stat. (2021) 48:1712–29. doi: 10.1080/02664763.2020.1772209
25. Jalal, SA, Saleh, DM, Sedeeq, BS, and Ali, TH. Construction of the Daubechies wavelet chart for quality control of the single value. Iraqi J Stat Sci. (2024) 21:160–9. doi: 10.33899/iqjoss.2024.183257
26. Li, X, Liao, K, He, G, and Zhao, J. Research on improved wavelet threshold denoising method for non-contact force and magnetic signals. Electronics. (2023) 12:1244. doi: 10.3390/electronics12051244
27. Omer, AW, Sedeeq, BS, and Ali, TH. A proposed hybrid method for multivariate linear regression model and multivariate wavelets (simulation study). Polytechnic J Humanity Soc Sci. (2024) 5:112–24.
28. Ahmed, M, Irfan, M, Meero, A, Tariq, M, Comite, U, Abdul Rahman, AA, et al. Bubble identification in the emerging economy fuel Price series: evidence from generalized sup augmented dickey–fuller test. PRO. (2021) 10:65. doi: 10.3390/pr10010065
Keywords: time series, VAR model, Coiflets wavelet, level and order wavelet, threshold
Citation: Elias II and Ali TH (2025) Optimal level and order of the Coiflets wavelet in the VAR time series denoise analysis. Front. Appl. Math. Stat. 11:1526540. doi: 10.3389/fams.2025.1526540
Edited by:
Francoise Argoul, Centre National de la Recherche Scientifique (CNRS), FranceReviewed by:
Levent Özbek, Ankara University, TürkiyeCopyright © 2025 Elias and Ali. This is an open-access article distributed under the terms of the Creative Commons Attribution License (CC BY). The use, distribution or reproduction in other forums is permitted, provided the original author(s) and the copyright owner(s) are credited and that the original publication in this journal is cited, in accordance with accepted academic practice. No use, distribution or reproduction is permitted which does not comply with these terms.
*Correspondence: Taha Hussein Ali, dGFoYS5hbGlAc3UuZWR1LmtyZA==
Disclaimer: All claims expressed in this article are solely those of the authors and do not necessarily represent those of their affiliated organizations, or those of the publisher, the editors and the reviewers. Any product that may be evaluated in this article or claim that may be made by its manufacturer is not guaranteed or endorsed by the publisher.
Research integrity at Frontiers
Learn more about the work of our research integrity team to safeguard the quality of each article we publish.