- 1The Innovation Centre of Ruminant Precision Nutrition and Smart Farming, Jilin Agricultural Science and Technology University, Jilin, China
- 2Department of Veterinary Sciences, University of Turin, Turin, Italy
- 3Jilin Inter-Regional Cooperation Centre for the Scientific and Technological Innovation of Ruminant Precision Nutrition and Smart and Ecological Farming, Jilin, China
- 4Grasslands Research Centre, AgResearch Limited, Palmerston North, New Zealand
Introduction: Distiller’s dried grains with solubles (DDGS), a by-product of grain fermentation for ethanol production, are extensively used in livestock feed. Given their nutrient composition, DDGS could potentially influence methane (CH4) emissions, a significant greenhouse gas concern in ruminant production systems. This study utilized a multilevel random-effects meta-analysis to assess the impact of DDGS inclusion in cattle diets on CH4 production and yield.
Methods: The literature search was conducted on 23 July 2024. Studies reporting CH4 emissions and dry matter intake (DMI) in cattle fed DDGS-based diets were identified, and data extraction was performed. The meta-analysis calculated the mean difference (MD) for DMI and CH4 yield and the relative mean difference (RMD) for CH4 production across the selected studies.
Results: A total of k = 25 effect sizes from 10 studies were included in the DMI meta-analysis. DDGS had no significant effect on DMI in dairy or beef cattle (p = 0.770, MD = 0.070, 95% confidence interval [CI] from −0.420 to 0.561). For CH4 production, k = 24 effect sizes from 10 studies were analyzed, revealing no significant effect (p = 0.759, RMD = −1.045, 95% CI: from −8.025 to 5.935). Similarly, the meta-regression model indicated that the diet’s ether extract (EE) had no significant influence (p = 0.815, 95% CI from −1.121 to 1.409) on CH4 production. For CH4 yield, k = 23 effect sizes from 10 studies were included, with results showing no significant effect (p = 0.475, MD = −0.434 g/kg DMI, 95% CI: from −1.673 to 0.805). The regression model for the EE content of the diet also showed no significant impact on CH4 yield (p = 0.311, 95% CI: from −0.366 to 0.122).
Discussion: The findings suggest that the inclusion of DDGS does not significantly affect DMI, enteric CH4 production, or CH4 yield in cattle. Moreover, the EE content in DDGS-containing diets does not significantly influence CH4 outcomes. These results indicate that DDGS can be incorporated into cattle diets without exacerbating CH4 emissions, contributing to sustainable livestock feeding practices.
1 Introduction
Distiller’s dried grains with solubles (DDGS) are widely utilized as a feed ingredient in livestock systems due to their abundant availability and robust nutritional profile. As a by-product of ethanol production through grain fermentation, DDGS is produced when two-thirds of the corn starch is converted to ethanol, leaving behind nutrients concentrated in the stillage (1). These nutrients are then recovered and processed into DDGS, resulting in a product with significantly enhanced nutritional content compared to the original grain. Specifically, the fermentation process triples the concentrations of protein, fiber, fat, and phosphorus in DDGS relative to corn, with typical DDGS compositions including 10–30% crude protein (CP), 4–12% fat, 12–36% neutral detergent fiber (NDF), and 0.3–0.9% phosphorus on a dry matter (DM) basis (2). The growing demand for bioethanol has led to increased production of DDGS, making it an increasingly important component of livestock feed. For instance, in 2023 alone, the United States exported 10.8 million metric tons of DDGS (3). The widespread adoption of DDGS in feed not only reduces reliance on imported soybean meal and cereals but also contributes to lowering the carbon footprint and enhancing food security (4). Corn DDGS is particularly well-established in dairy cattle diets, with inclusion levels of up to 300 g/kg of diet DM reported without adverse effects on milk yield (5). Due to its high protein content, DDGS is primarily used as a protein source for ruminants (6). However, there is limited research exploring the impact of DDGS on enteric methane (CH4) emissions in dairy and beef cattle.
Methane emissions are a critical issue in livestock production due to their significant contribution to greenhouse gases and their impact on climate change (7). Studies have shown mixed effects of DDGS inclusion on CH₄ emissions. In dairy cows, for instance, DDGS has been shown to reduce enteric CH₄ emissions without negatively impacting feed intake or milk production (8). However, DDGS inclusion has also been associated with increased manure CH4 emissions by up to 15% (9). In beef cattle, high levels of DDGS supplementation (40% on a DM basis) can reduce CH4 emissions but may simultaneously increase nitrous oxide emissions, highlighting a trade-off between different greenhouse gases (10).
Several studies have reported reductions in CH4 emissions when feeding DDGS to beef (11, 12) and dairy cattle (8). Hünerberg et al. (10) also reviewed that DDGS consistently resulted in lower CH4 emissions. The potential mechanism behind this reduction could be attributed to the higher fat content in DDGS (2), which can negatively affect ruminal fiber degradation, alter the acetate-to-propionate ratio, and reduce protozoa numbers, thereby decreasing CH4 production (8).
Due to inconsistencies in the literature, with some studies indicating that CH4 emissions are unaffected by varying levels of DDGS inclusion (13), animal nutritionists, policymakers, and farmers struggled to make informed decisions regarding the inclusion of DDGS as a CH4-mitigating feed ingredient in dairy and beef ration. Therefore, this meta-analysis was conducted to quantify the effect of DDGS inclusion in the diet on CH4 production and yield. Additionally, this study aimed to evaluate whether any reductions observed in CH4 emissions in dairy or beef cattle-fed DDGS are associated with the fat content of the diet.
2 Materials and methods
2.1 Search strategy and data processing
The literature search was conducted on 23 July 2024, with no time restrictions applied. We selected two databases, PubMed1 and Scopus,2 along with Google Scholar, for our search. For PubMed and Scopus, we used the following keywords: DDGS OR dried distiller’s grains with solubles AND methane OR CH4 AND cattle OR cows OR beef OR steer OR cow OR heifer. For Google Scholar, the keywords were dried distiller’s grains with solubles OR DDGS AND methane. The detailed information on the search strategy is presented in the PRISMA flowchart (Figure 1) (14).
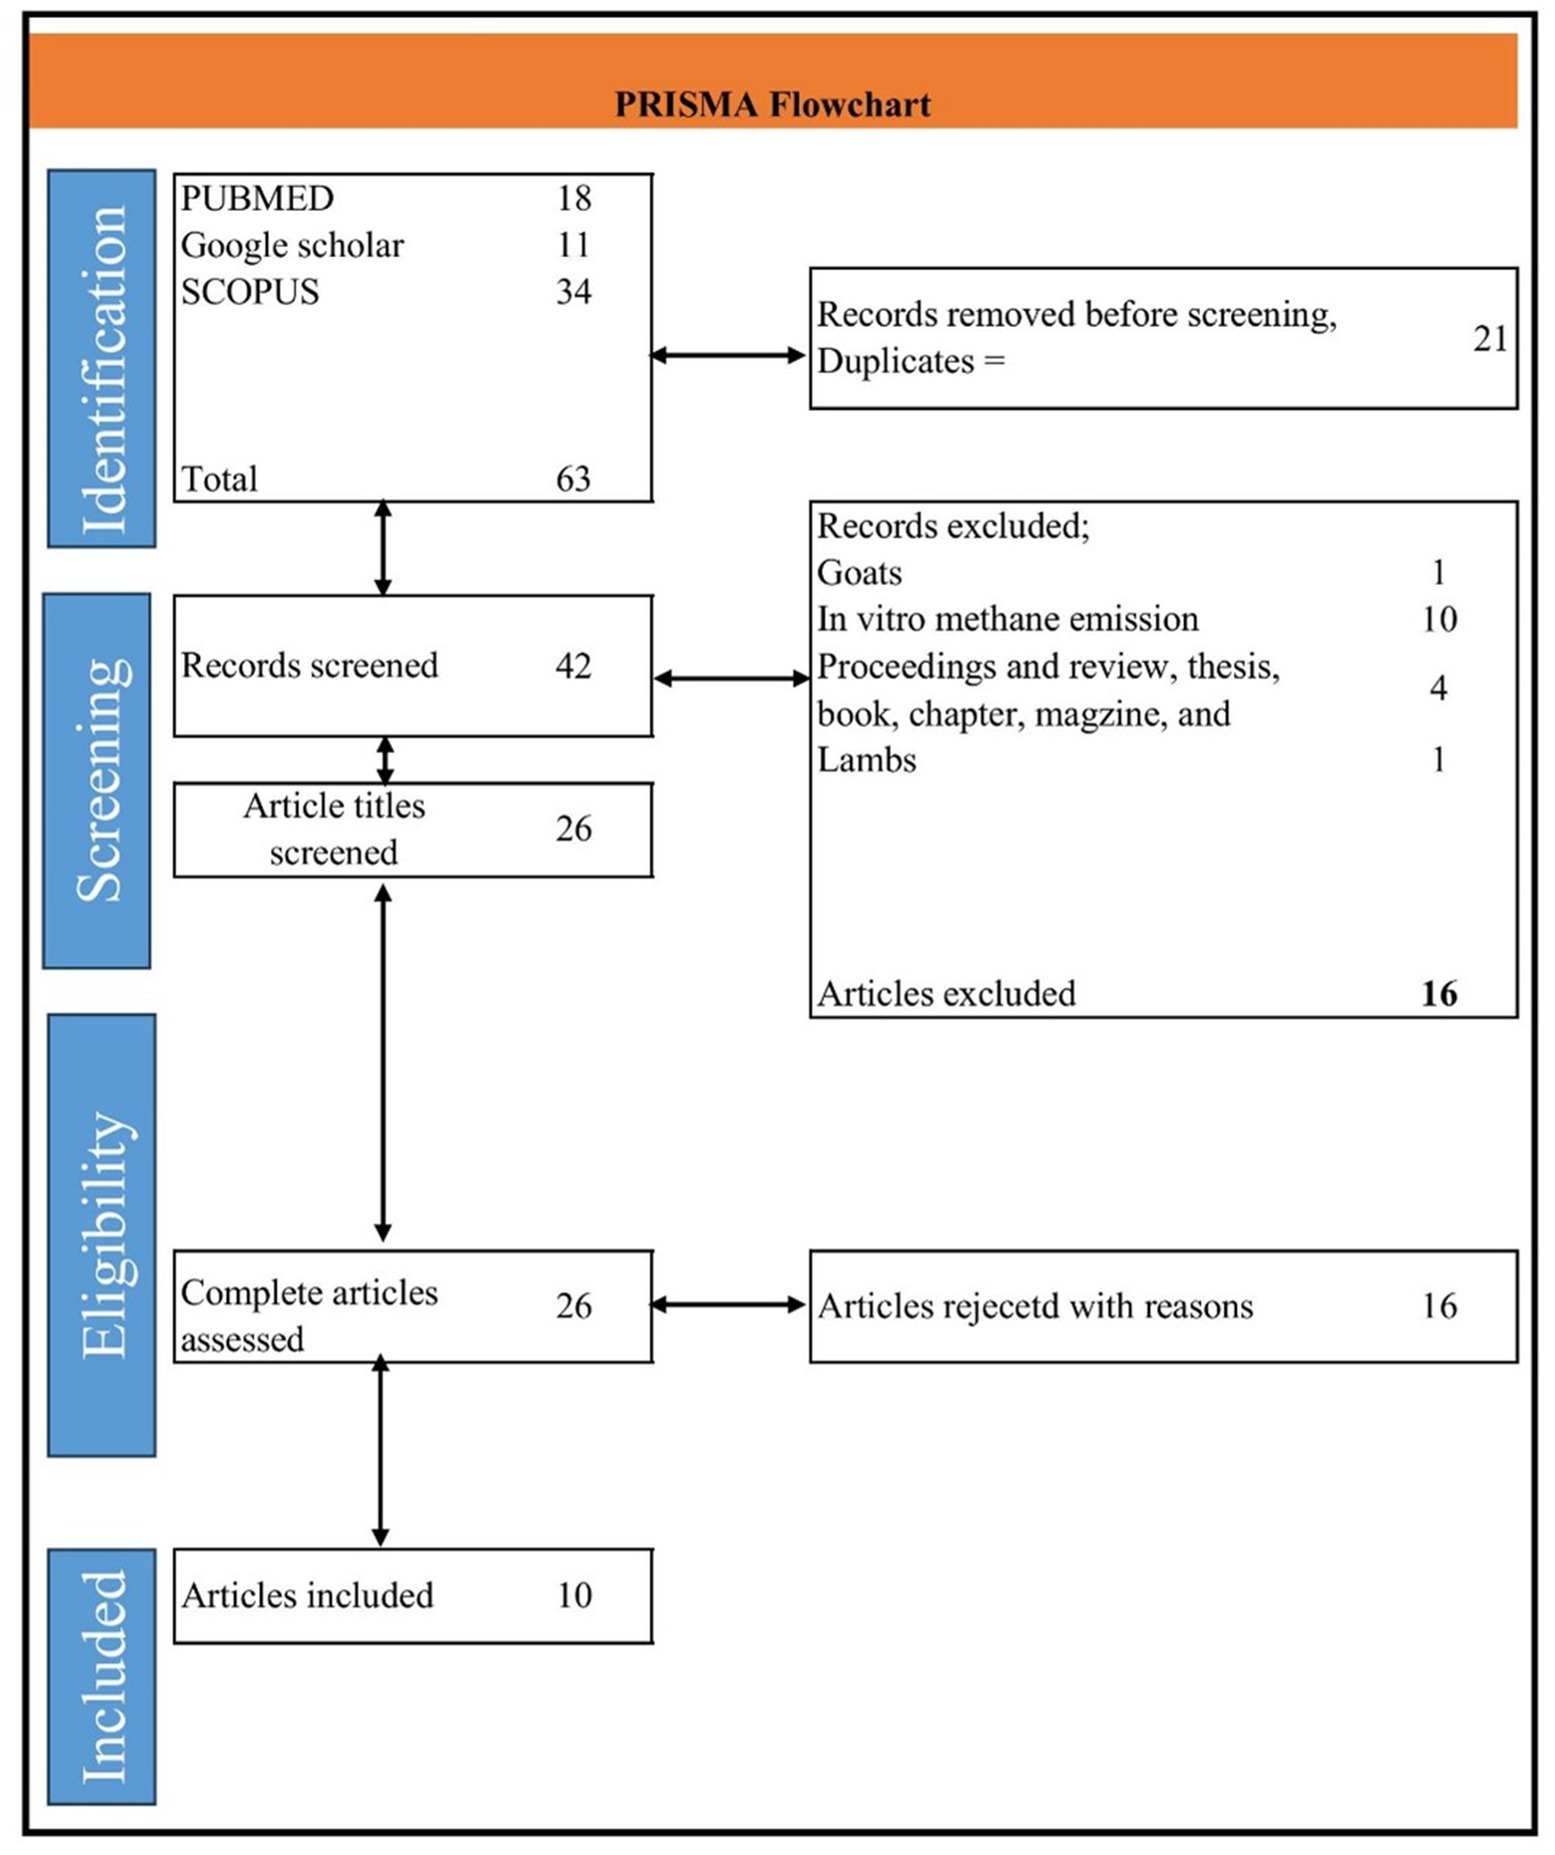
Figure 1. The preferred reporting items for systematic reviews and meta-analyses (PRISMA) flowchart for search strategy and details of study inclusion and exclusion.
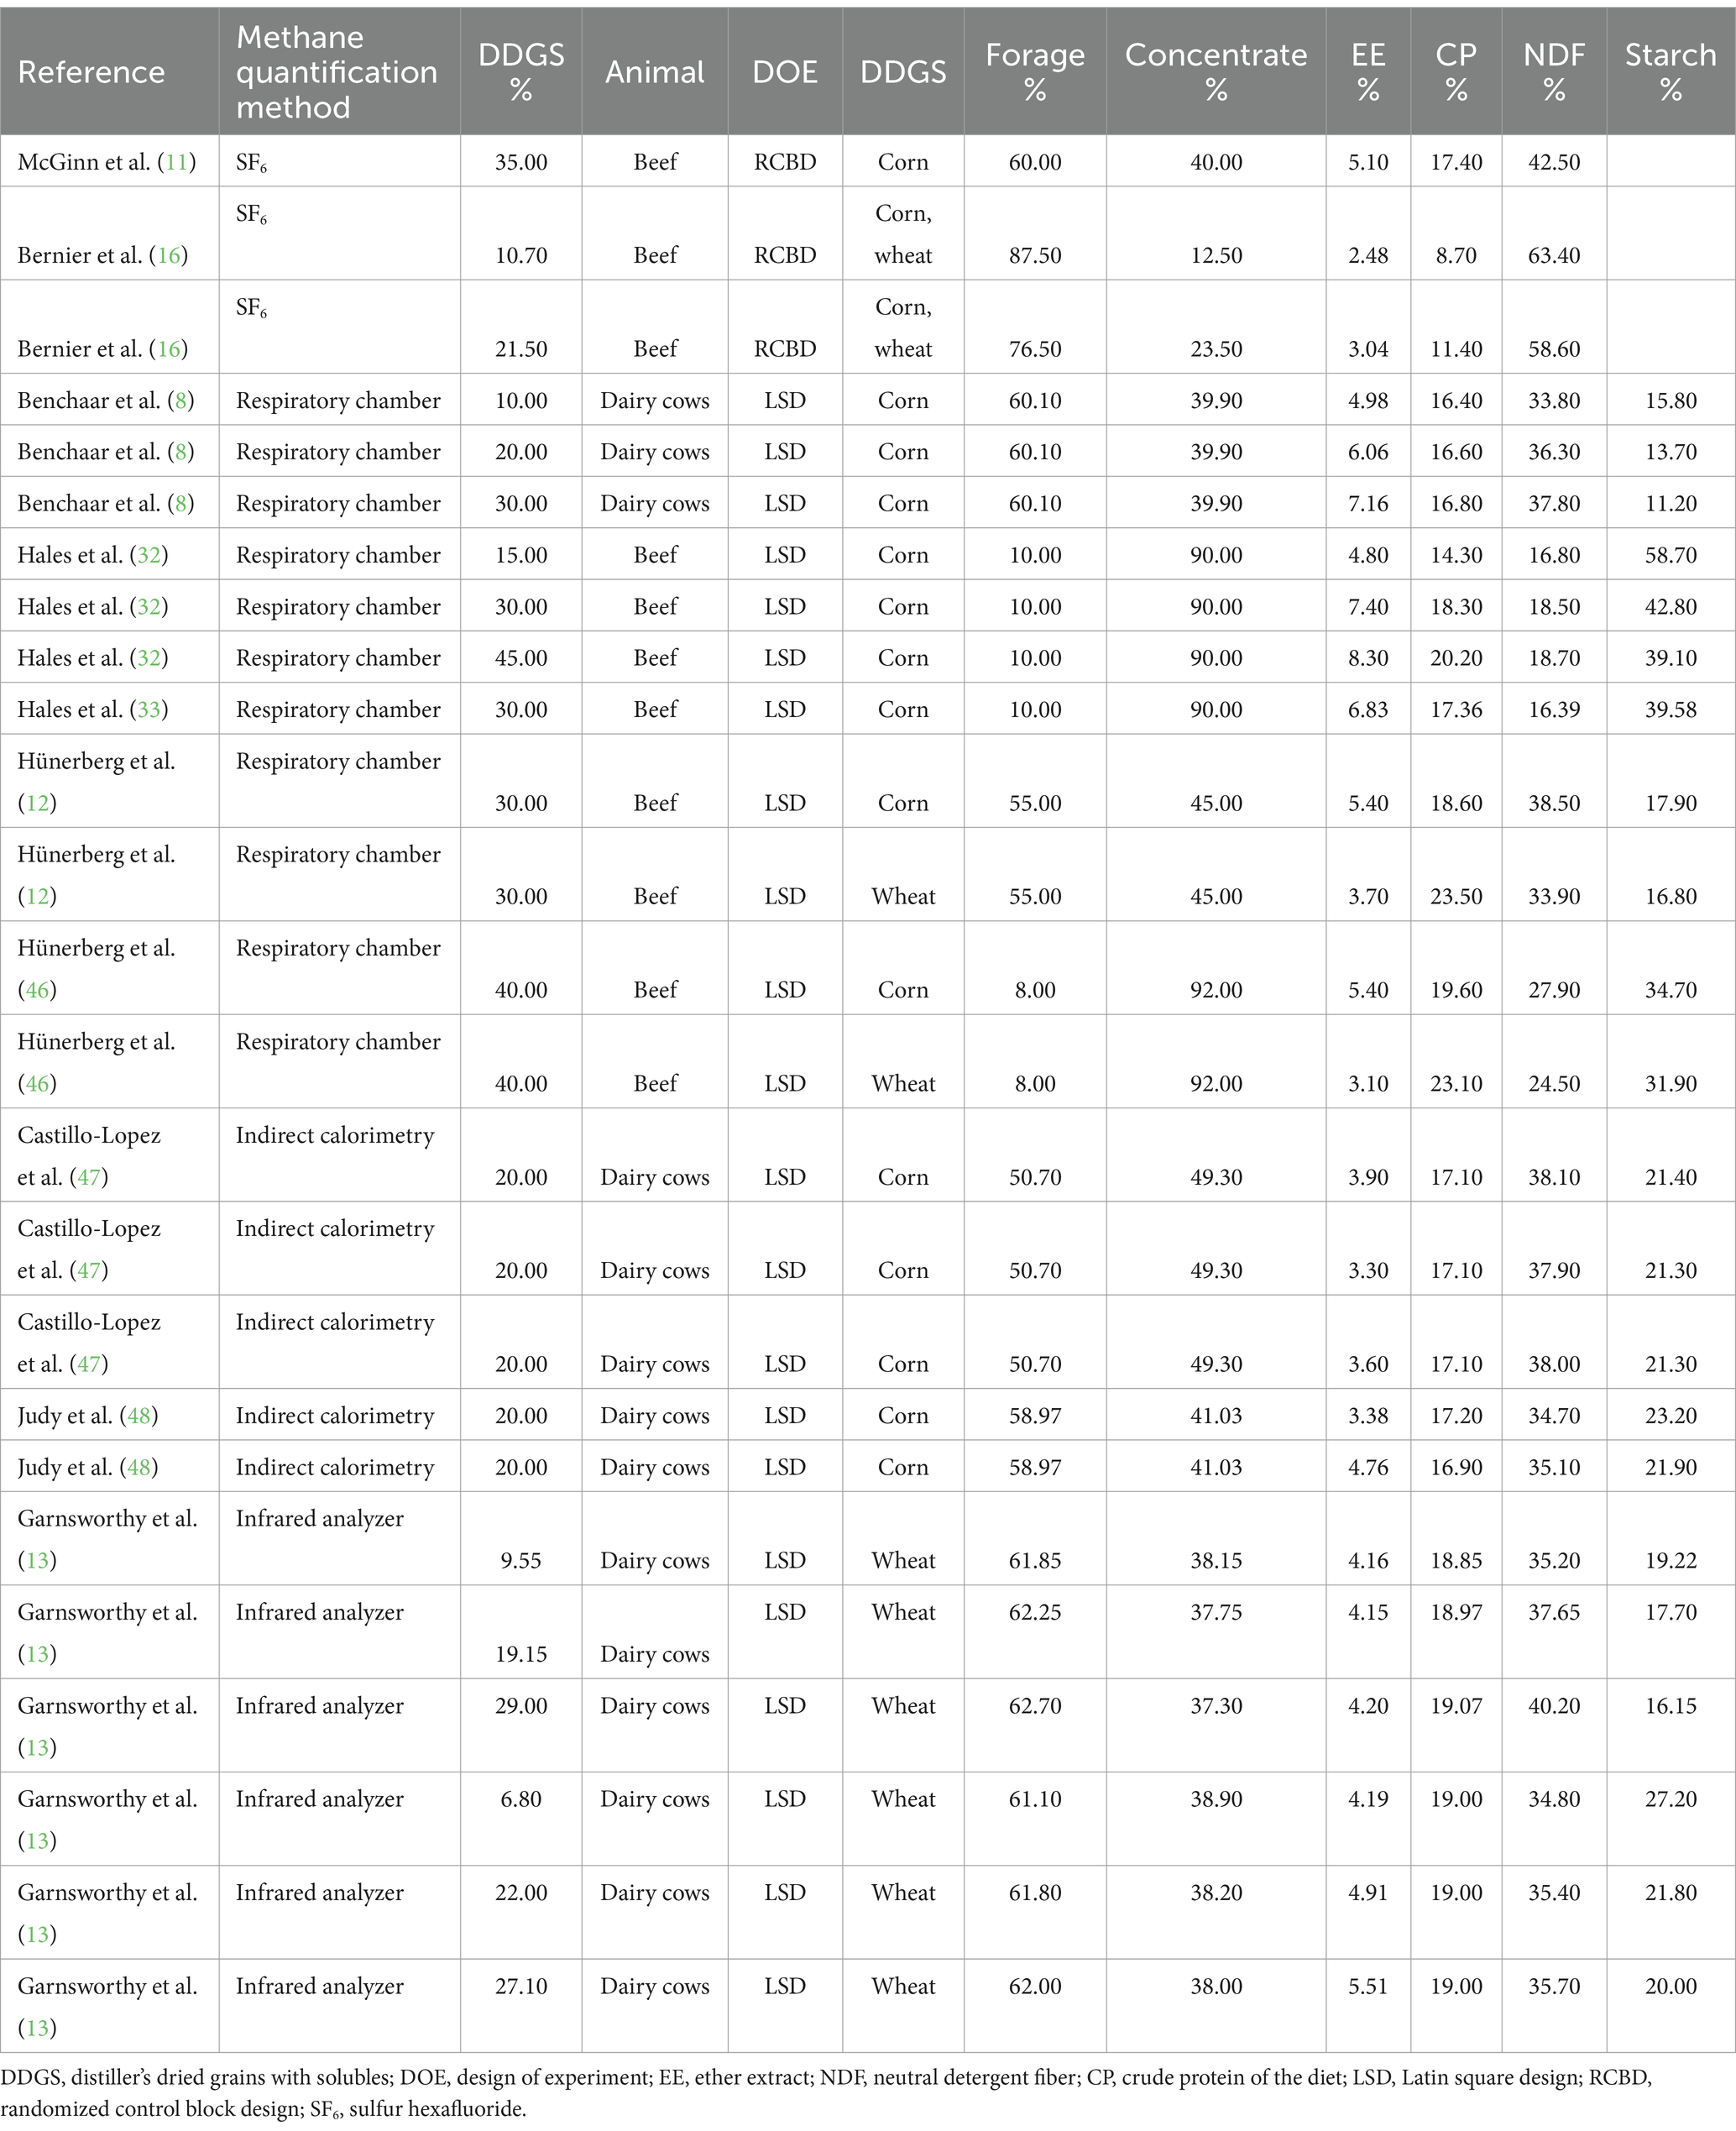
Only English-language, peer-reviewed articles were included, and studies reporting enteric CH4 emissions were selected. Articles that reported CH4 emissions from in vitro studies were excluded. Eligible studies had to involve dairy cattle, heifers, or beef cattle (either steers or heifers) and provide CH4 emission data. Data for CH4 emissions (g/day) were considered as CH4 production, and CH4 yield was reported as grams per kilogram of dry matter intake (DMI). We extracted data for CH4 production, CH4 yield, and DMI, acetate, propionate, and butyrate, along with sample size, standard deviation (SD), or standard error of the mean (SEM). For studies providing variance as SED, we used the RevMan calculator (Version 5.4, 15) to compute the SEM. Study characteristics, such as experimental design, diet composition (including % of forage in the diet, % of concentrate in the diet, NDF, EE, CP, starch, % of DDGS in the diet, and types of DDGS: wheat or corn), and types of animals were extracted (Table 1). For the study by Bernier et al. (16), where EE of the diet was not reported, it was calculated using the nutritional dynamic system (NDS) Professional Software. Methane production and yield reported in liters were converted to g/day and g/kg DMI, respectively. Liters per day were converted to grams per day, assuming that a mole of CH4, weighing 16.0 g, has a volume of 22.4 L (17).
2.2 Data analysis
The analysis utilized mean difference (MD) as the outcome measure for DMI and CH4 yield (treatment mean – control mean). Methane production was calculated as relative mean difference (RMD) = [(treatment mean – control mean)/(control mean)] × 100. The RMD, a dimensionless variable, was used to account for large variations and is particularly useful for expressing percentage changes in methane production, which is of greater interest to readers (18). The standardized mean difference (SMD) for volatile fatty acids is a statistical technique commonly employed in meta-analyses to compare and synthesize findings from different studies that use varying measurement scales (19, 20). To calculate the SMD, the mean of the control group is subtracted from the mean of the treatment group, and the result is divided by the pooled standard deviation (19). A positive SMD indicates that the treatment group had a higher mean than the control group, while a negative SMD suggests the opposite. We applied a multilevel random-effects model to address the dependency of effect sizes from the same study. This three-level meta-analytical model is appropriate for handling dependence and heterogeneity among studies. In this model, effect sizes extracted from the same study are considered nested within higher levels, making it suitable for scenarios with varying degrees of variation both within and between studies. The multilevel meta-analysis technique provides more precise effect sizes of treatment effects and helps identify sources of heterogeneity. The variance distribution in the model is as follows: level 1 = sampling variance, level 2 = effect sizes extracted from the same study, and level 3 = variance between studies. By accounting for the varying levels of variation within and between studies, the multilevel meta-analysis technique can provide more precise effect sizes of treatment effects and aid in identifying the sources of heterogeneity (21, 22). We applied an equal effect model for acetate, as the limited number of studies prevented the multilevel model from converging. Convergence refers to the optimizer’s ability to identify the best-fitting parameters for the applied model. Successful convergence occurs when the algorithm effectively minimizes or maximizes the target function. Conversely, failure to converge can result from issues, such as poorly specified models, insufficient data, or constraints, that hinder the optimizer’s ability to find an optimal solution. Additionally, a subgroup analysis was conducted based on the types of DDGS fed to the animals, with subgroups created for wheat and corn DDGS.
Heterogeneity (τ2) was estimated using the DerSimonian-Laird estimator (23), and the I2 statistic (24) was reported and calculated as follows:
where Q is the χ2 statistic and k is the number of studies included in the meta-analysis.
A prediction interval for the true outcomes was also provided (25). The Knapp and Hartung adjustment method was used for the tests and confidence intervals (26). Potential outliers and influential studies were assessed using studentized residuals and Cook’s distances (27). Meta-regression was performed to test the hypothesis that CH4 emissions decreased with increased EE contents in the diet, with EE included as a continuous variable in the multilevel random-effects meta-regression model. Studies with studentized residuals larger than the 100 × [1–0.05/(2 × k)] percentile of a standard normal distribution were considered potential outliers (Bonferroni correction with two-sided α = 0.05 for k studies). Studies with Cook’s distances larger than the median plus 6 times the interquartile range were deemed influential. Sensitivity analyses assessed the robustness of the results by removing statistical outliers with 95% confidence intervals lying outside the pooled effect size (27). Funnel plot asymmetry was checked using the rank correlation test (28) and the regression test by Sterne and Egger (29), with the standard error of observed outcomes as the predictor. Data analysis was performed using R (version 4.4.0) (30) and the metafor package (version 4.6.0) (31).
3 Results
3.1 Database characteristics
The data analysis included 6 studies on beef cattle and 4 studies on dairy cattle, yielding 11 effect sizes for beef and 14 effect sizes for dairy. The experimental design was a randomized complete block design (RCBD) in two studies and a Latin square design (LSD) in the remaining eight. Two types of DDGS were used: wheat-based DDGS in three studies and corn-based DDGS in seven. Methane quantification methods varied, with the sulfur hexafluoride (SF6) trace gas technique used in one study, an infrared analyzer in another, indirect calorimetry in two, and a respiratory chamber in five (Table 1).
On average, the inclusion rate of DDGS was 29.74% for beef cattle and 19.54% for dairy cattle, with concentrate levels at 64.54 and 41.28%, respectively (Table 2). For dairy cattle, forage averaged 58.71% of the diet, with CP at 17.79%, NDF at 36.47%, and starch at 19.41%. In contrast, beef cattle diets had a higher DDGS content (29.74%) and more variable forage levels (35.45%), with CP averaging at 17.49%, NDF lower at 32.69%, and starch higher at 35.18% (Table 2).
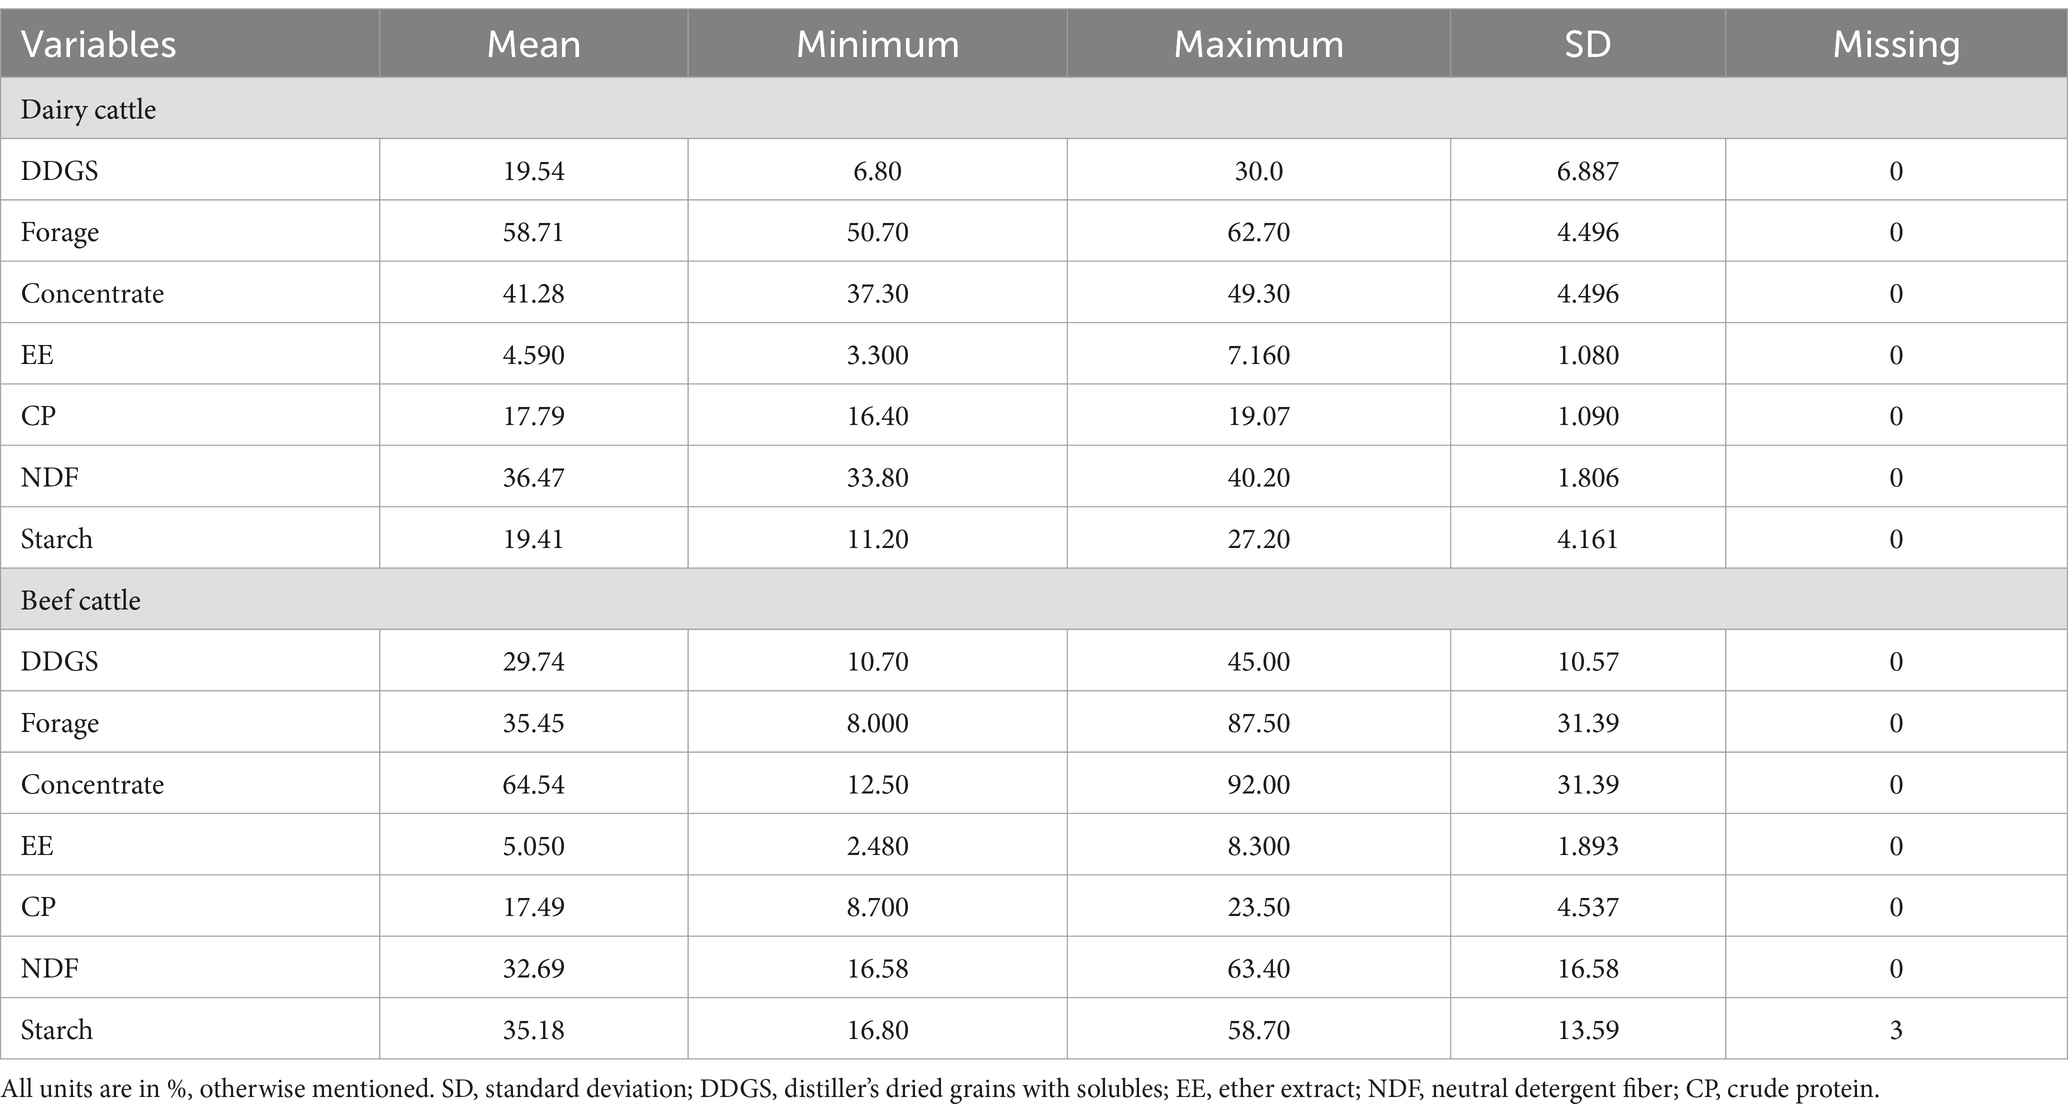
Table 2. Descriptive statistics for the dietary characteristics of the studies included in the meta-analysis.
A summary of the multilevel random-effects meta-analysis and meta-regression for DMI and methane production and yield is provided in Table 3, offering a concise overview of the statistical results.
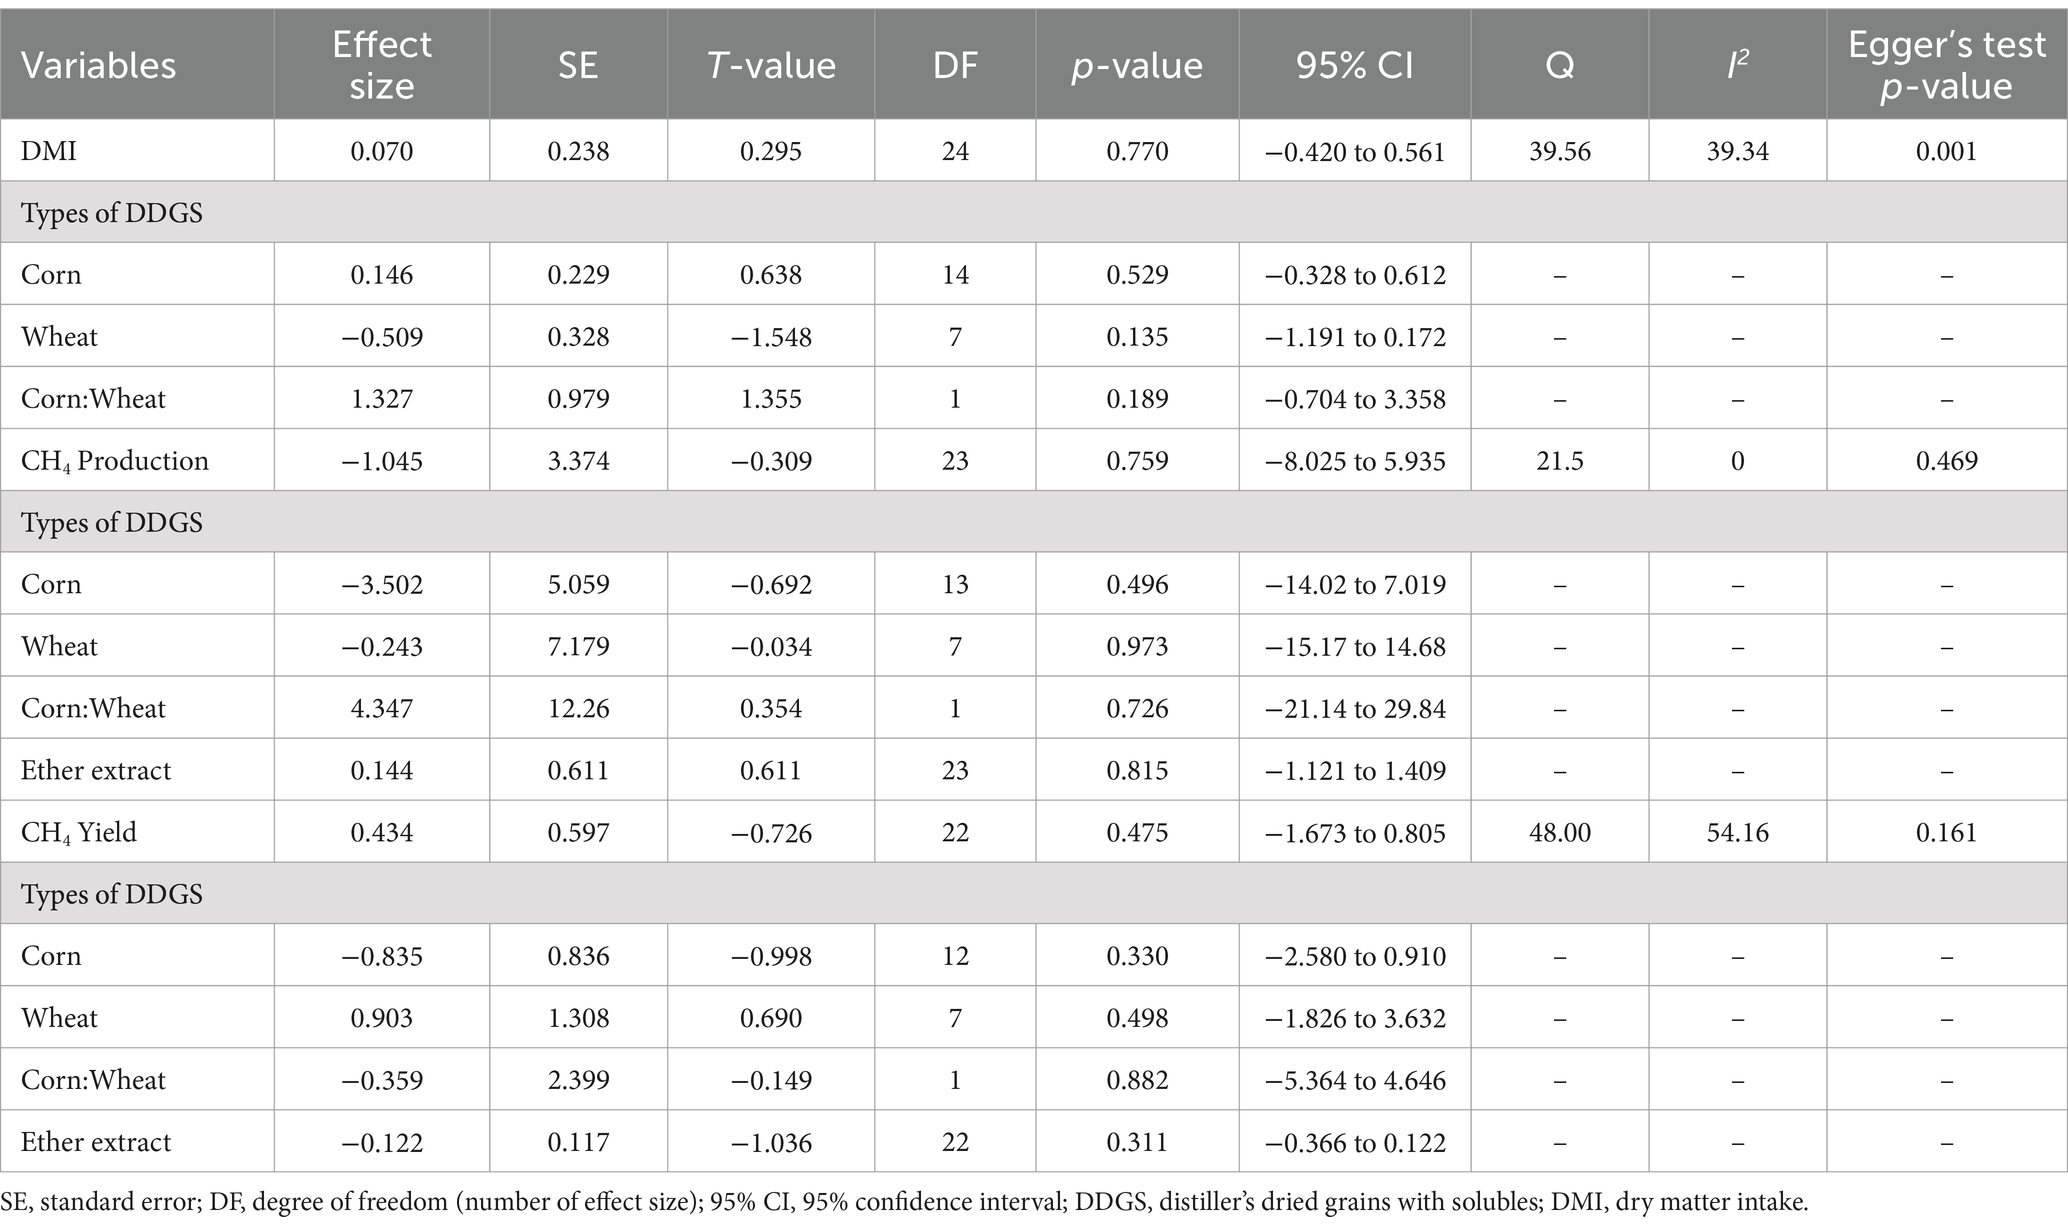
Table 3. Summary statistics of the multilevel random effects meta-analysis and meta-regression for dry matter intake and methane production and yield.
3.2 Dry matter intake
A total of k = 25 effect sizes from 10 studies were included in the analysis. The observed mean differences ranged from −0.92 to 4.60, with 48% of the effect sizes being negative. The multilevel random-effects meta-analysis indicated that DDGS had no significant effect on DMI in dairy or beef cattle (p = 0.770, MD = 0.070, 95% CI: from −0.420 to 0.561). An orchard plot illustrating the observed outcomes and the effect size from the multilevel random-effects model is presented in Figure 2. The subgroup analysis for the different types of DDGS was also non-significant (p > 0.05) for corn, wheat, or a mixture of both. The effect sizes were as follows: corn DDGS (p = 0.529, MD = 0.146, 95% CI = from −0.328 to 0.612), wheat DDGS (p = 0.135, MD = −0.509, 95% CI = from −1.191 to 0.172), and a mixture of corn and wheat DDGS (p = 0.189, MD = 1.327, 95% CI = from −0.704 to 3.358). The Q-test revealed heterogeneity among the true outcomes (Q = 39.56, p = 0.023, τ2 = 0.148, I2 = 39.34%). Since the heterogeneity (I2) was below 40% and the primary outcome was non-significant, meta-regression was not conducted, as adding covariates would be meaningless. An examination of studentized residuals showed no outliers, with no values exceeding ±3.09. Additionally, Cook’s distances indicated that none of the studies were overly influential. The funnel plot of the effect sizes, shown in Figure 3, indicated potential asymmetry, supported by the rank correlation and Egger’s regression tests (p = 0.009 and p = 0.001, respectively).
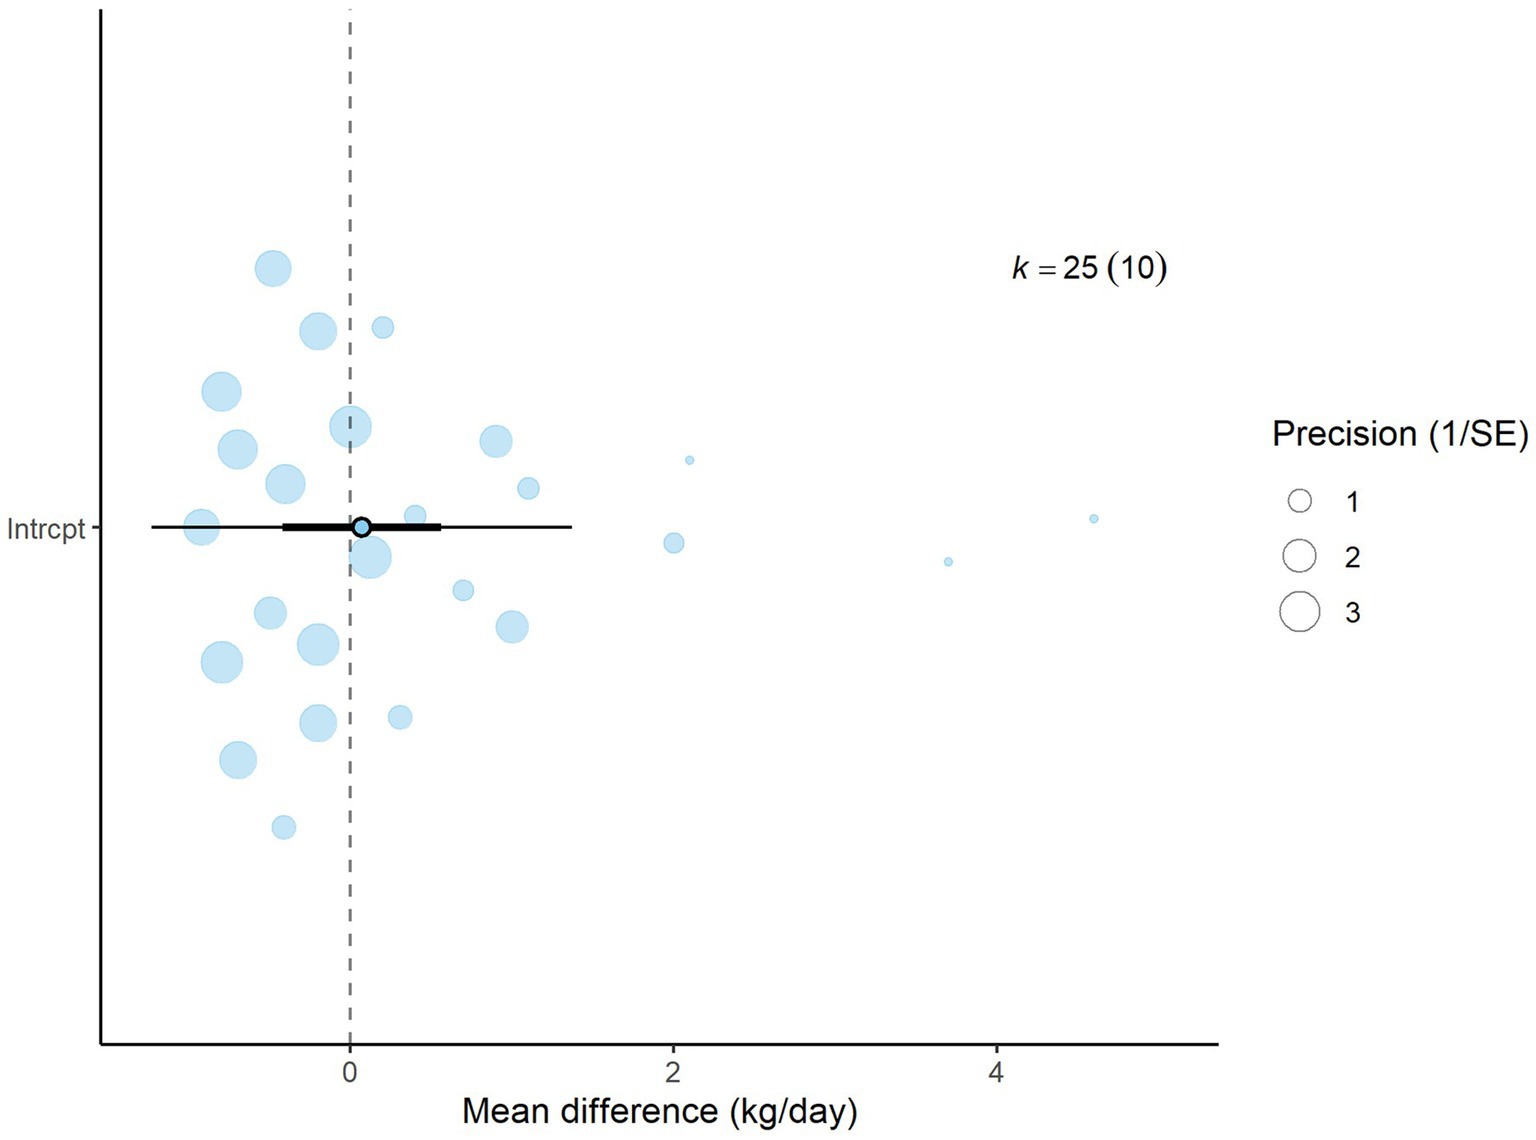
Figure 2. Orchard plot for dry matter intake (DMI): The overall effect size from a multilevel random-effects meta-analysis of 25 effect sizes is centered on zero, with a 95% confidence interval (CI) spanning the line of no effect (dotted line). The thick black horizontal line indicates the prediction interval, while the dotted vertical line marks the line of no effect.
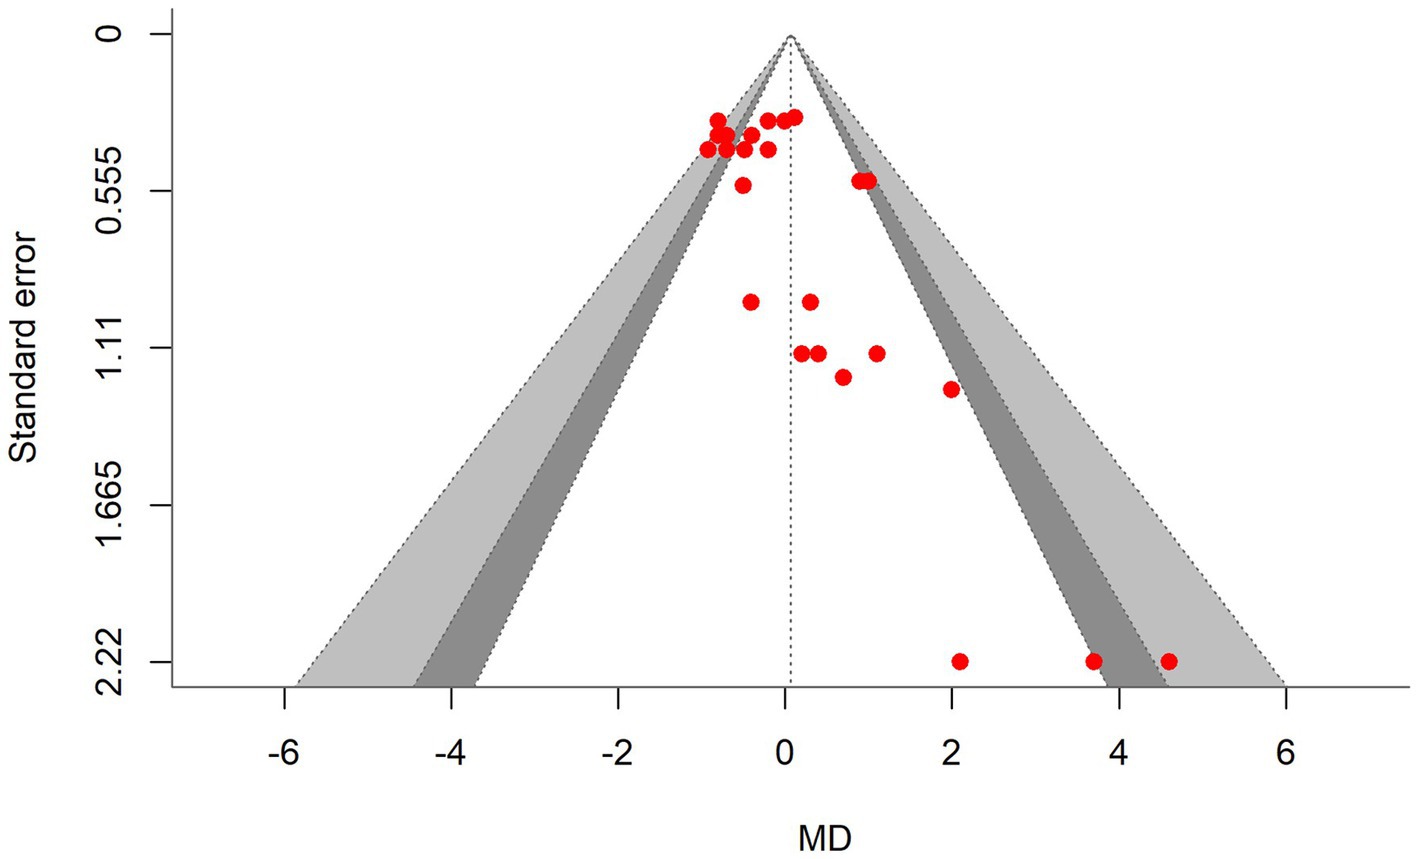
Figure 3. Contour-enhanced funnel plot showing asymmetrical distribution of effect sizes around the standard error, indicating bias in the dry matter intake (DMI) meta-analysis. MD, the mean difference.
3.3 Methane production
A total of k = 24 effect sizes from 10 studies were analyzed. Sensitivity analysis identified a treatment with 45% distiller grains as an outlier and overly influential, leading to its exclusion from the final analysis (32). The observed RMD was −1.045%, with 52% of the effect sizes being positive. Methane production was found to be non-significant (p = 0.759, RMD = −1.045, 95% CI: from −8.025 to 5.935). An orchard plot showing the observed outcomes and the prediction interval is presented in Figure 4. The subgroup analysis of different types of DDGS showed no significant impact on methane production. For corn-based DDGS, the effect size was non-significant (p = 0.496, RMD = −3.502, 95% CI = from −14.02 to 7.019). Similarly, wheat-based DDGS had no notable effect (p = 0.937, RMD = −0.243, 95% CI = from −15.17 to 14.68). The combination of corn and wheat DDGS also showed no significant influence (p = 0.726, RMD = 4.347, 95% CI = from −21.14 to 29.84). The regression model indicated that the EE of the diet had no significant effect on CH4 production (p = 0.815, 95% CI: from −1.121 to 1.409), with an increase of 0.144% in CH4 production per unit increase in EE. The Q-test suggested homogeneity among the true outcomes (Q = 21.5, p = 0.550, τ2 = 0, I2 = 0), indicating no heterogeneity. The funnel plot in Figure 5 showed no asymmetry, as confirmed by the rank correlation and Egger’s regression tests (p = 0.549 and p = 0.469, respectively).
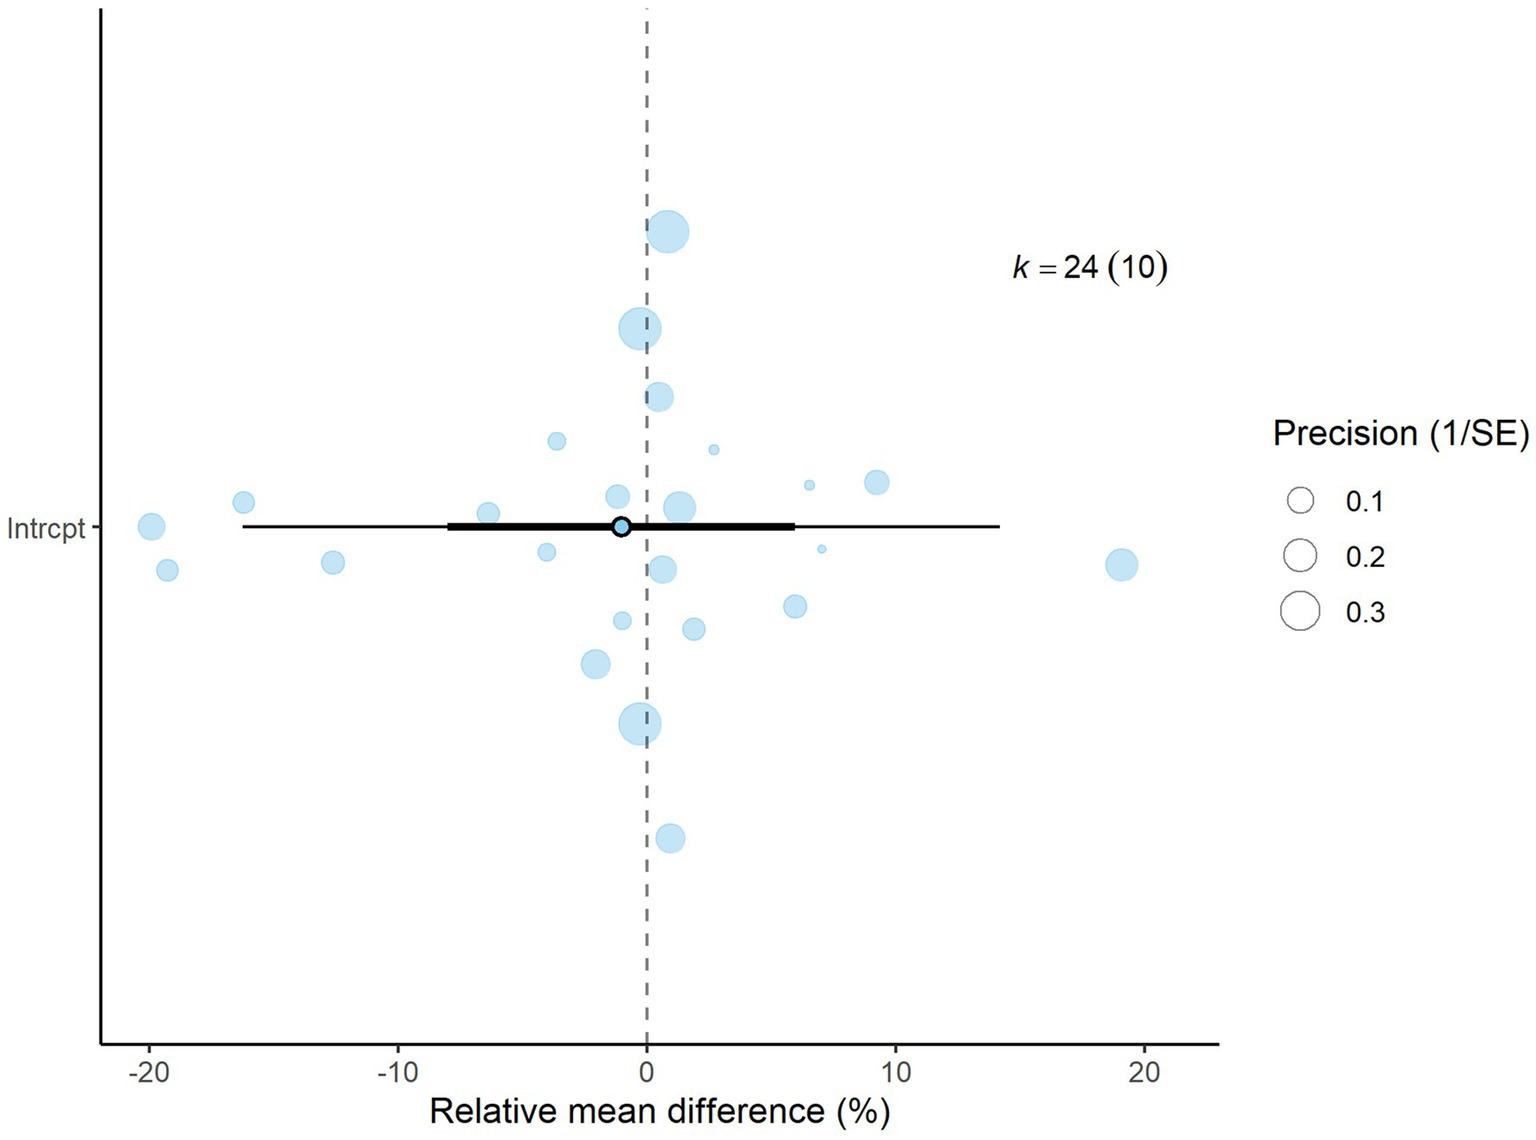
Figure 4. Orchard plot for methane production % (relative mean difference): The overall effect size from a multilevel random-effects meta-analysis of 24 effect sizes is centered on zero, with a 95% confidence interval (CI) spanning the line of no effect (dotted line). The thick black horizontal line represents the prediction interval, while the dotted vertical line marks the line of no effect.
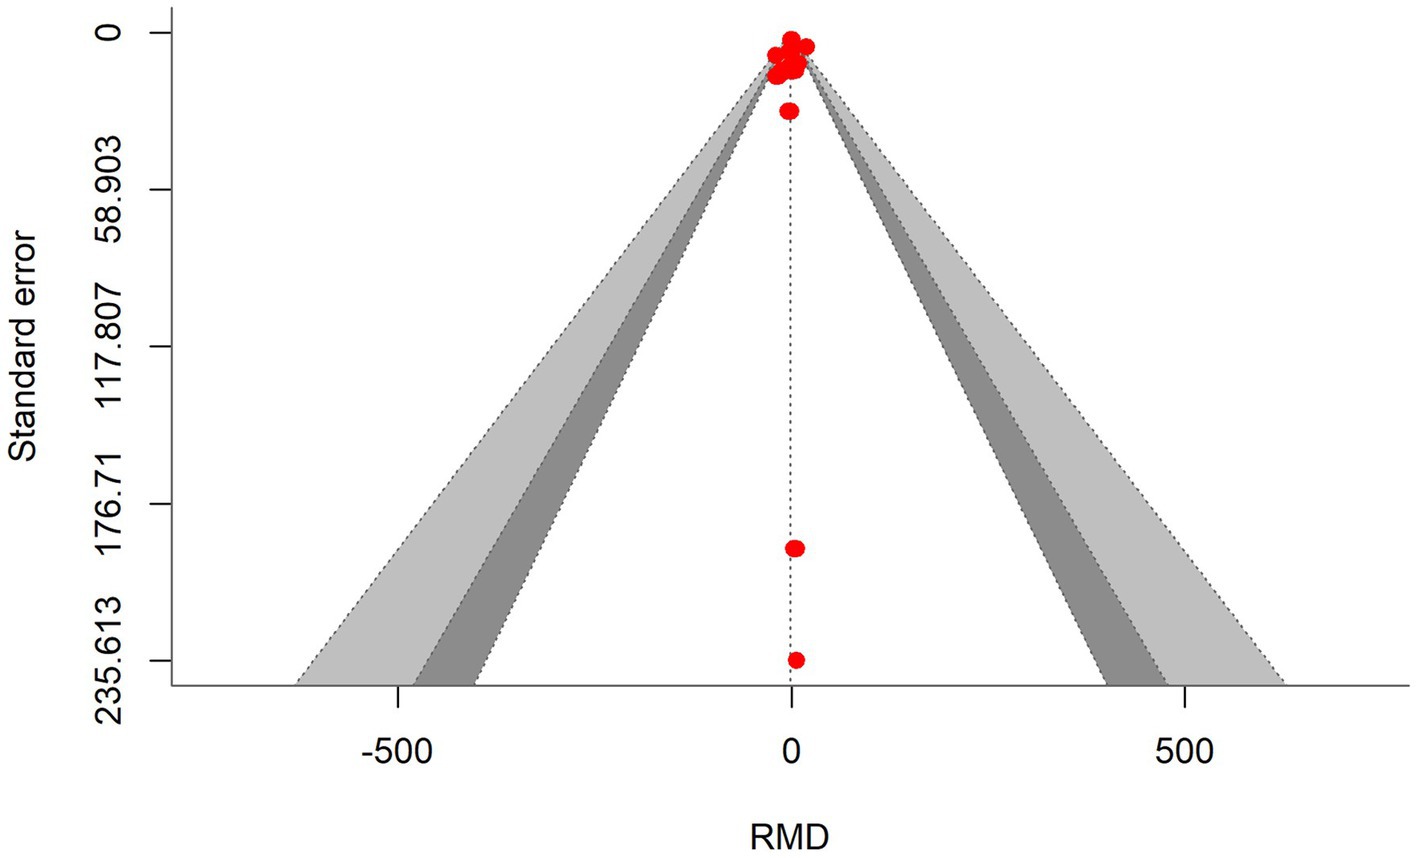
Figure 5. Contour-enhanced funnel plot showing symmetrical distribution of effect sizes around the standard error, indicating no bias in the methane production meta-analysis.
3.4 Methane yield
A total of k = 23 effect sizes from 10 studies were included in the analysis. Sensitivity analysis identified two treatments with 30 and 45% distiller grains as outliers, which were subsequently removed from the final analysis (32). The observed mean differences for CH4 yield ranged from −3.90 to 3.63, with 57% of the effect sizes being negative. Methane yield was found to be non-significant (p = 0.475, MD = −0.434 g/kg DMI, 95% CI: from −1.673 to 0.805). An orchard plot depicting the observed outcomes and the prediction interval is shown in Figure 6. The regression model for EE indicated no significant effect on CH4 yield (p = 0.311, 95% CI: from −0.366 to 0.122), with a − 0.122 g/kg DMI increase in CH4 yield per unit increase in EE. The subgroup analysis for types of DDGS suggests that DDGS types have no significant effect on methane yield. The effect sizes were as follows: corn DDGS (p = 0.330, MD = −0.835, 95% CI = from −2.580 to 0.910), wheat DDGS (p = 0.498, MD = 0.903, 95% CI = from −1.826 to 3.632), and a mixture of corn and wheat DDGS (p = 0.882, MD = −0.359, 95% CI = from −5.364 to 4.646). The Q-test indicated heterogeneity among the true outcomes (Q = 48, p = 0.001, τ2 = 0.55, I2 = 54.16%). The funnel plot in Figure 7 showed no significant asymmetry, supported by the rank correlation and Egger’s regression tests (p = 0.183 and p = 0.161, respectively) (Figure 8).
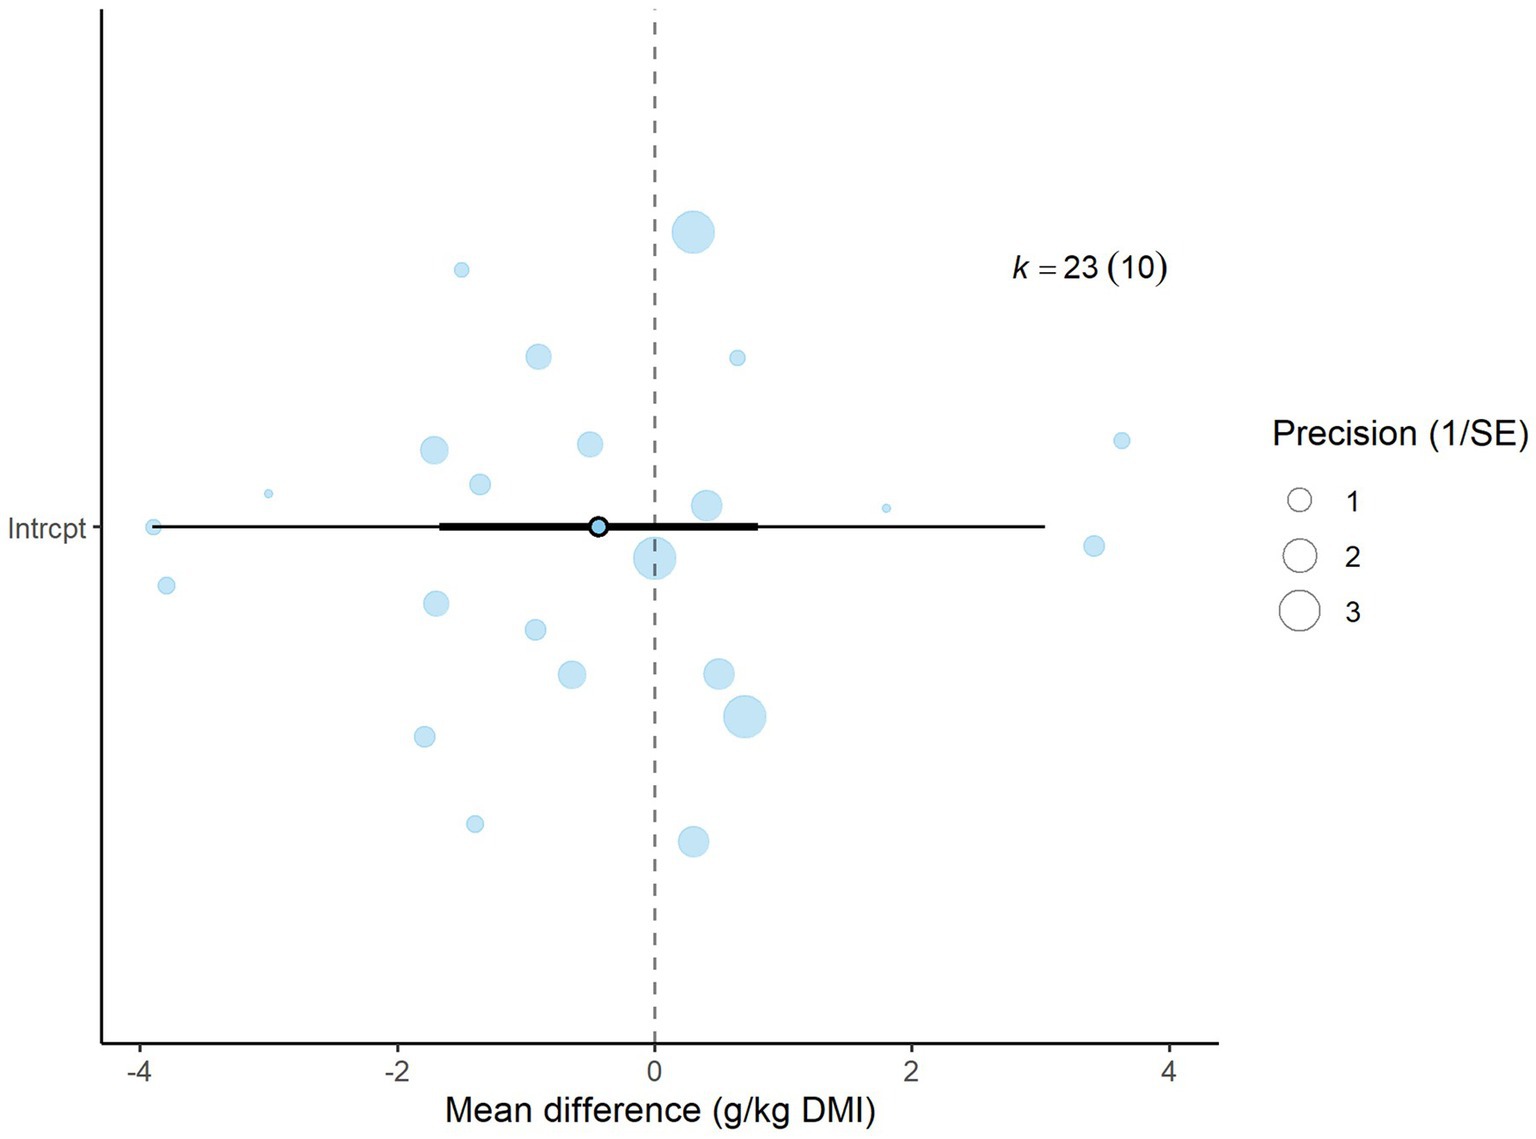
Figure 6. Orchard plot for methane yield: The overall effect size from a multilevel random-effects meta-analysis of 23 effect sizes is centered on zero, with a 95% confidence interval (CI) spanning the line of no effect (dotted line). The thick black horizontal line represents the prediction interval, while the dotted vertical line marks the line of no effect. SE, standard error.
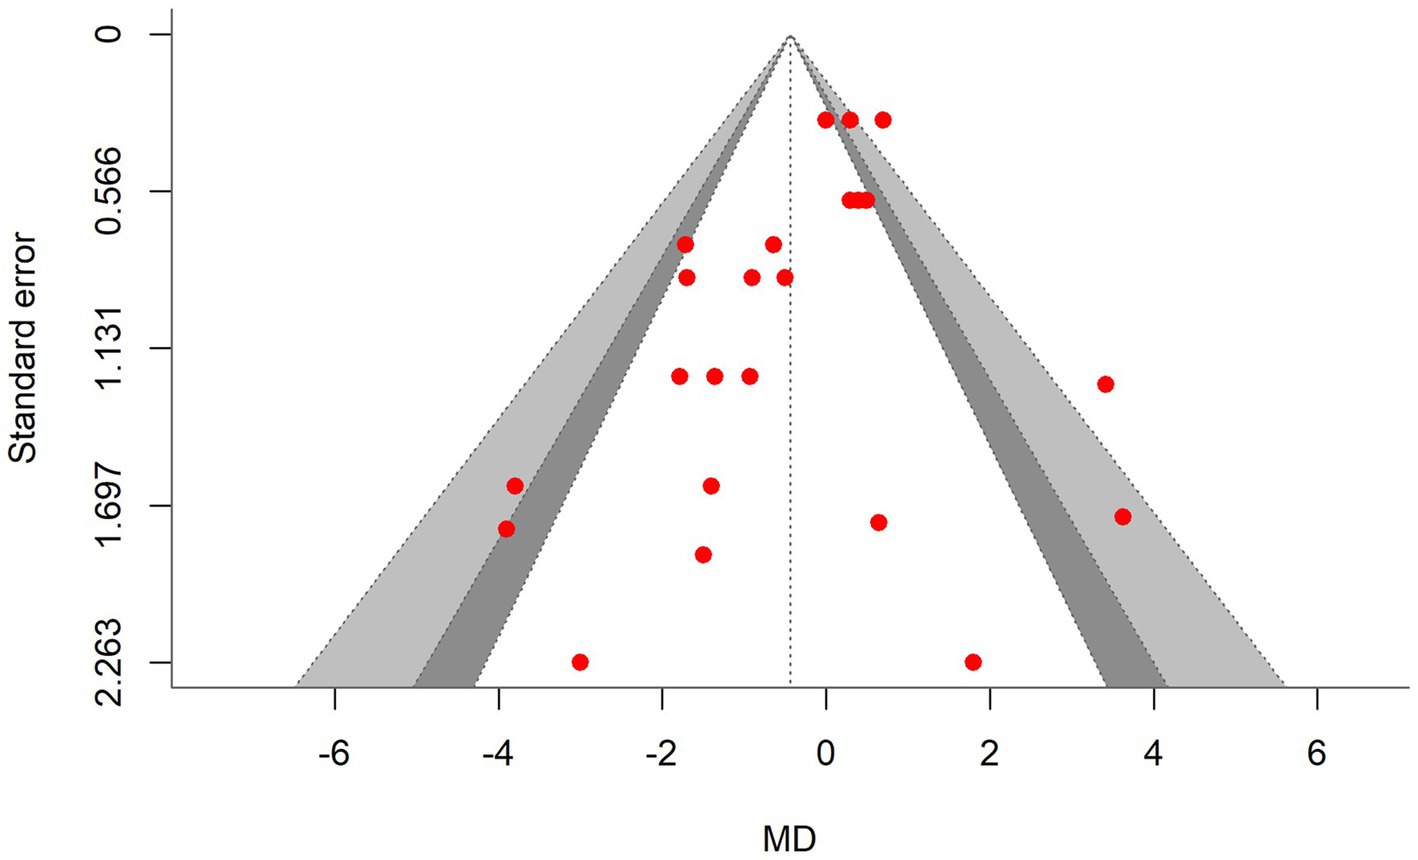
Figure 7. Contour-enhanced funnel plot for studies included in the methane yield meta-analysis: symmetrical distribution of effect sizes around the standard error indicates no bias.
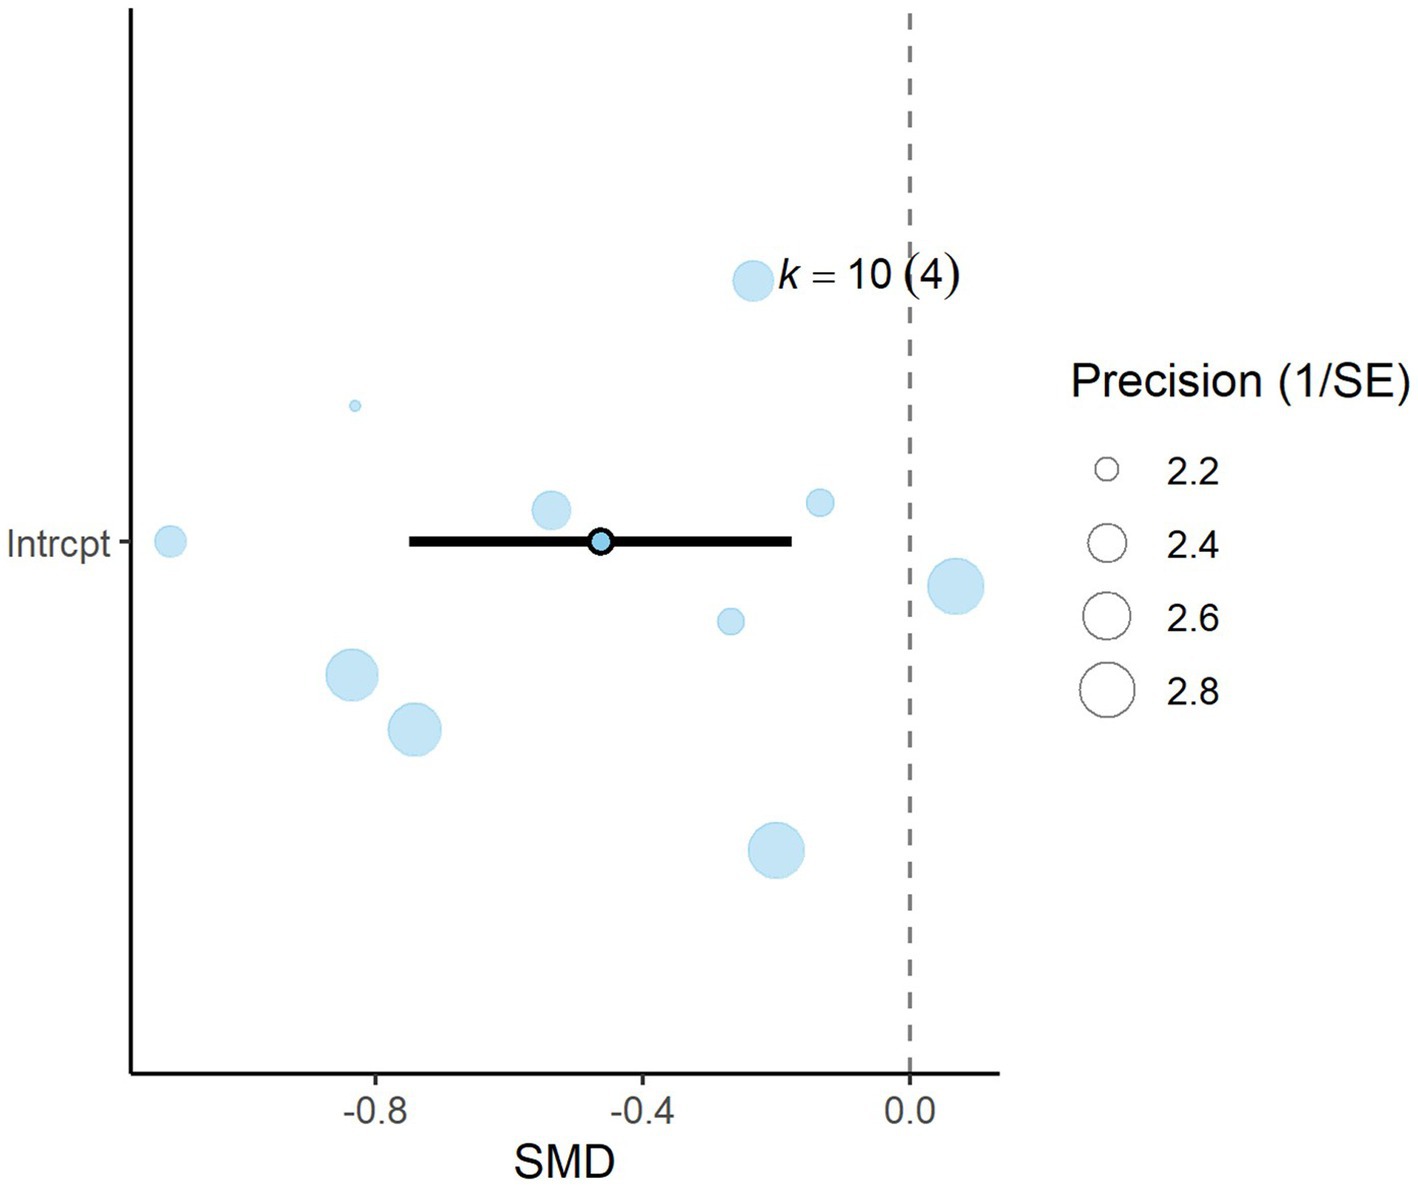
Figure 8. Orchard plot for acetate: The overall effect size from a multilevel random-effects meta-analysis of 10 effect sizes is centered on zero, with a 95% confidence interval (CI) spanning the line of no effect (dotted line). The thick black horizontal line represents the prediction interval, while the dotted vertical line marks the line of no effect. SE, standard error.
3.5 Acetate
A total of k = 10 effect sizes from four studies were included in the analysis. The observed SMD for acetate was found to be significant (p = 0.005, SMD = −0.463, 95% CI: from −0.749 to −0.176). Subgroup analysis by DDGS type indicated that corn DDGS significantly decreased rumen acetate production, with an effect size of (p = 0.001, SMD = −1.048, 95% CI: from−1.526 to −0.570) (Table 4). In contrast, wheat DDGS showed no significant difference (p = 0.176, SMD = −0.313, 95% CI: from −0.801 to 0.173). Due to the substantially reduced acetate production, a meta-regression was conducted to identify potential moderators influencing acetate levels. We found that increasing the inclusion level of DDGS in dairy cattle diets significantly reduced acetate (p = 0.005, SMD = −0.024, 95% CI: from −0.040 to −0.009). Similarly, the inclusion of EE had a significant effect on rumen acetate production (p = 0.002, SMD = −0.102, 95% CI: −0.159 to 0.046). The Q-test indicated no significant heterogeneity among the true outcomes (Q = 8.28, p = 0.506, τ2 = 0, I2 = 0%). Funnel plot asymmetry was also non-significant, as supported by both the rank correlation and Egger’s regression tests (p = 0.216 and p = 0.461, respectively).

Table 4. Summary statistics for the equal effect meta-analysis and meta-regression for rumen acetate production.
3.6 Butyrate
A total of k = 10 effect sizes from four studies were analyzed. Rumen butyrate production was found to be non-significant (p = 0.159, SMD = 0.569, 95% CI: from −0.270 to 1.409) (Figure 9). Subgroup analysis by DDGS type showed no significant impact on butyrate production (Table 5). For corn-based DDGS, the effect size was non-significant (p = 0.102, SMD = 0.784, 95% CI: from −0.198 to 1.766), and wheat-based DDGS also showed no notable effect (p = 0.384, SMD = 0.389, 95% CI: from −0.586 to 1.365). The regression model indicated that the EE of the diet had no significant effect on CH₄ production (p = 0.067, SMD = 0.131, 95% CI: from −0.011 to 0.274). The Q-test suggested significant heterogeneity among the true outcomes (Q = 32.33, p = 0.0002, τ2 = 0.563, I2 = 76.58%). The funnel plot showed asymmetry; the rank correlation test was non-significant (p = 0.216), while Egger’s regression test was significant (p = 0.006).

Table 5. Summary statistics for the multilevel random effects meta-analysis and meta-regression for rumen butyrate production.
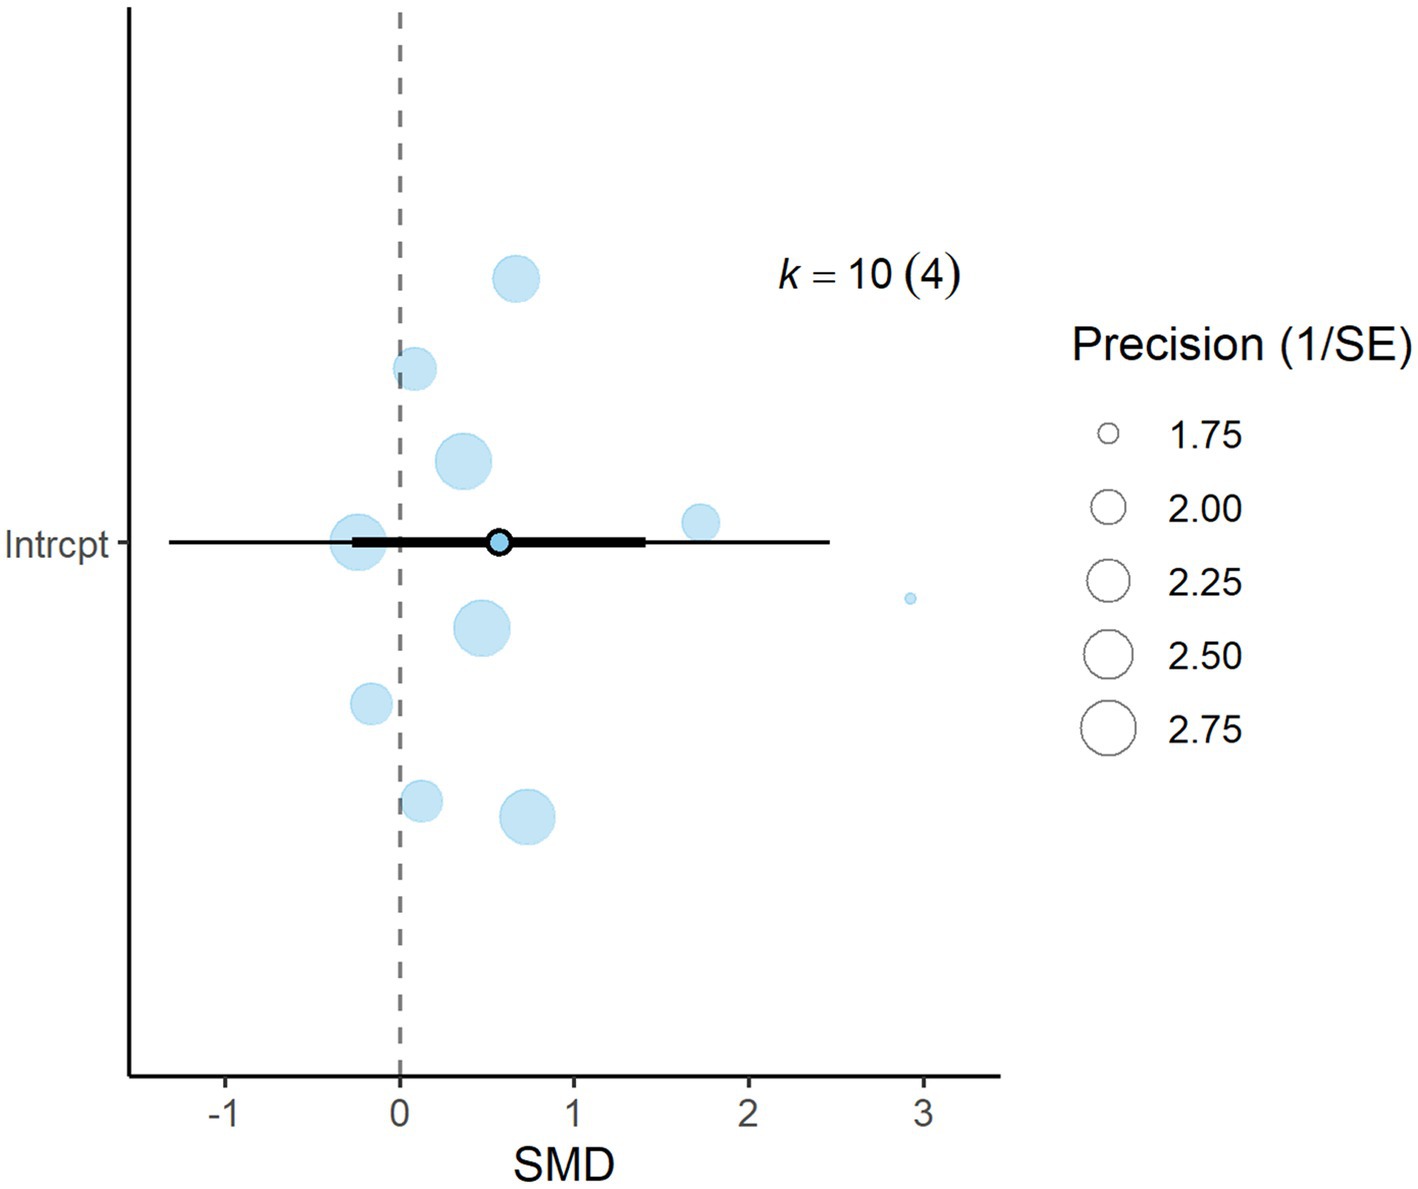
Figure 9. Orchard plot for butyrate: The overall effect size from a multilevel random-effects meta-analysis of 10 effect sizes is centered on zero, with a 95% confidence interval (CI) spanning the line of no effect (dotted line). The thick black horizontal line represents the prediction interval, while the dotted vertical line marks the line of no effect. SE, standard error.
3.7 Propionate
A total of k = 10 effect sizes from four studies were included in the analysis. The observed SMD for acetate was found to be non-significant (p = 0.508, SMD = −0.125, 95% CI: from −0.538 to −0.286) (Figure 10). Subgroup analysis by DDGS type indicated that corn DDGS had no effect on rumen propionate production (p = 0.622, SMD = 0.116, 95% CI: from −0.408 to 0.641). Similarly, wheat DDGS showed no significant difference (p = 0.139, SMD = −0.382, 95% CI: from −0.920 to 0.155) (Table 6). EE also had no significant effect on rumen propionate production (p = 0.913, SMD = −0.004, 95% CI: from −0.087 to 0.079). The Q-test indicated no significant heterogeneity among the true outcomes (Q = 9.99, p = 0.350, τ2 = 0.029, I2 = 30.73%). Funnel plot asymmetry was non-significant, as confirmed by the rank correlation and Egger’s regression tests (p = 1.0 and p = 0.417, respectively).

Table 6. Summary statistics for the multilevel random effect meta-analysis and meta-regression for rumen propionate production.
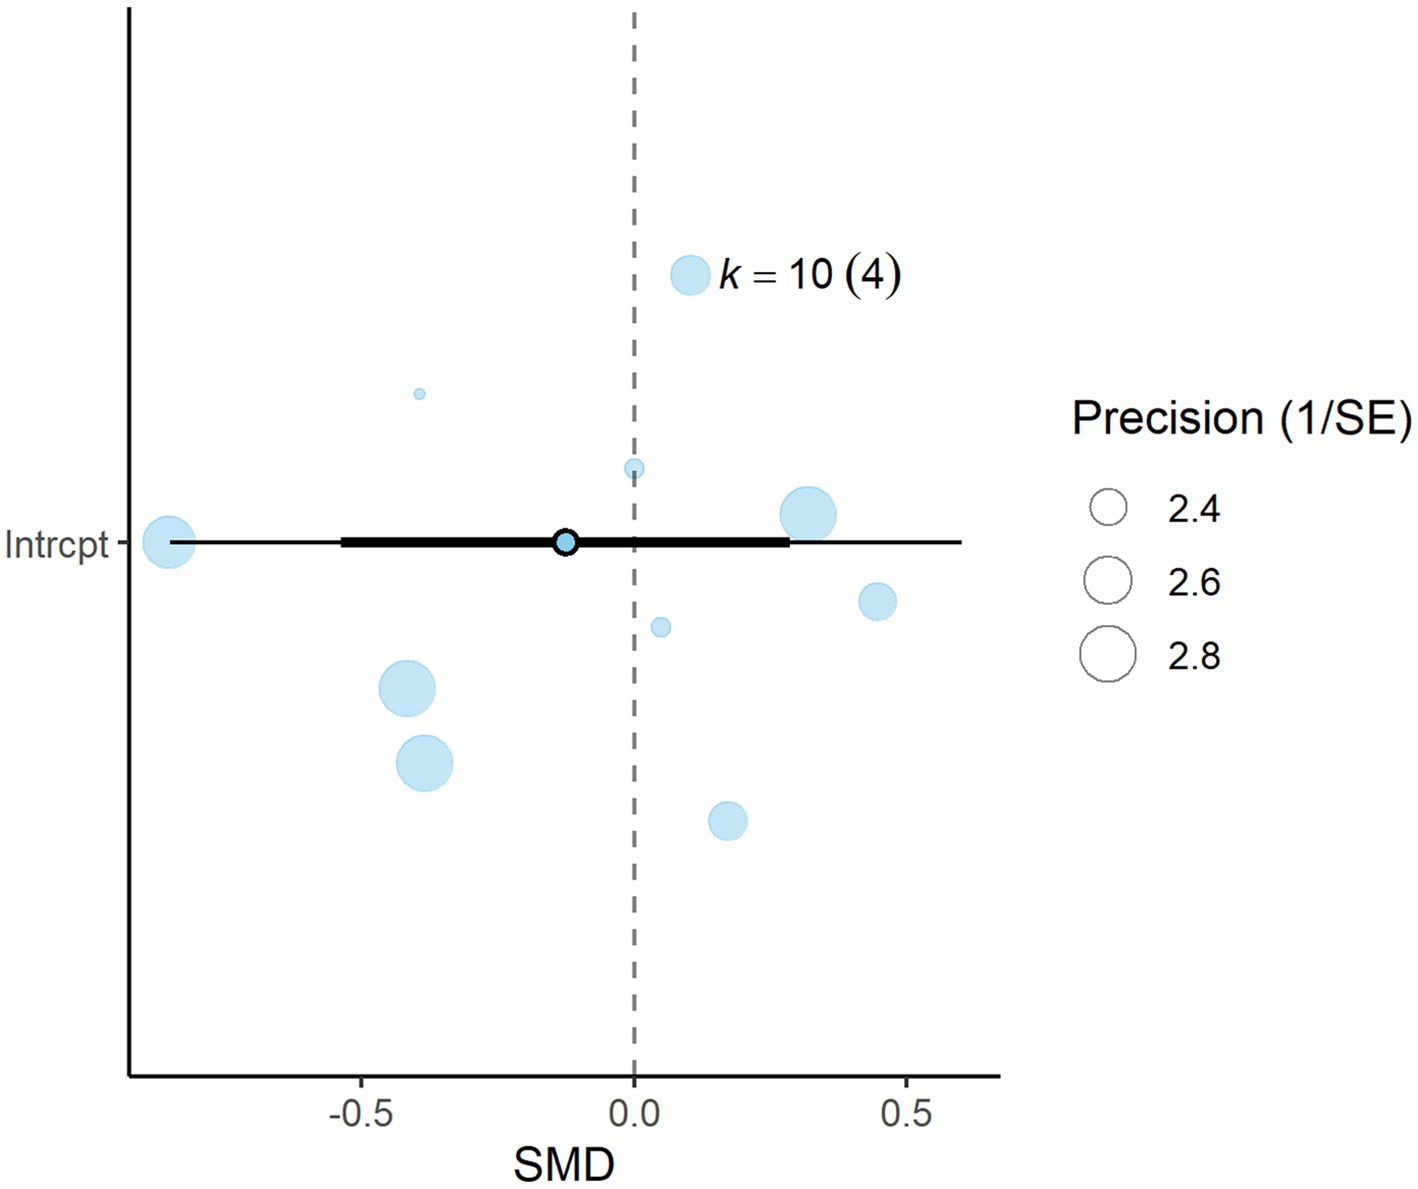
Figure 10. Orchard plot for propionate: The overall effect size from a multilevel random-effects meta-analysis of 10 effect sizes is centered on zero, with a 95% confidence interval (CI) spanning the line of no effect (dotted line). The thick black horizontal line represents the prediction interval, while the dotted vertical line marks the line of no effect. SE, standard error.
4 Discussion
Methane emissions from livestock production are a significant contributor to climate change, posing a major challenge among atmospheric pollutants. It is well established that CH4 emissions are influenced by both the quantity and type of nutrients fermented in the rumen. Typically, CH4 production increases with DMI, and the specific nutrients fermented play a crucial role in rumen methanogenesis.
Our findings suggest that DDGS have no significant effect on DMI in both dairy and beef cattle, consistent with previous studies in beef cattle (11, 33) and dairy cattle (16). However, this is in contrast to other studies that observed increased DMI when DDGS replaced soybean meal and corn in dairy cattle diets (34). The discrepancy may be attributed to our study’s focus on literature that specifically evaluates enteric CH4 emissions, potentially excluding studies that might have reported positive effects on DMI without examining CH4 outcomes (8). This limitation highlights the need for a more comprehensive analysis that includes a broader range of studies.
Our meta-analysis found that both CH4 yield and production were non-significant, indicating that DDGS does not influence CH4 emissions in dairy or beef cattle. This finding contrasts with some studies that suggest DDGS can impact these emissions (11, 33). For instance, research has shown that feeding DDGS to dairy cows can mitigate enteric CH4 emissions without negatively affecting intake and milk production (8). In beef cattle, DDGS inclusion has also been associated with reduced CH4 emissions (11, 33), attributed to the high EE (EE) content of DDGS (12.7% of DM), which can range from 2.0 to 5.1% of DM (11).
The reduction in CH4 production in these studies is often linked to increased EE supply from DDGS, which affects ruminal fiber degradation, the ratio of acetate to propionate, and protozoa numbers. These factors collectively contribute to lower CH4 production. However, our meta-regression analysis did not find a significant influence of EE on CH₄ production or yield, contradicting the hypothesis that higher fat content from DDGS would reduce CH4 emissions. This suggests that the relationship between dietary fat content in DDGS-supplemented cows and CH4 emissions may be more complex than previously thought and warrants further investigation. Another potential mechanism could be related to sulfur concentration. Buckner et al. (35) analyzed 1,200 DDGS (corn =400 and wheat = 800) samples from six ethanol processing facilities over 10 months, reporting an average sulfur content of 0.78%. Higher sulfur content may reduce CH4 emissions by redirecting ruminal H2 from methanogenesis for CH4 production (36) toward hydrogen sulfide (H2S) production. Hydrogen sulfide has been shown to inhibit methanogenic archaea directly (37). The activity of sulfate-reducing bacteria (SRB) depends on the availability of H2 and sulfate levels, as these bacteria use sulfate as a terminal electron acceptor in anaerobic respiration (38, 39). By increasing the sulfate level in the rumen, the capacity of SRB to outcompete methanogens as an H2 sink is enhanced, which could further reduce CH₄ emissions (40). This suggests that sulfur and sulfate levels in DDGS may influence the microbial dynamics, favoring pathways that reduce CH₄ production. Our findings suggest that dietary fat is not responsible for CH4 reduction in DDGS-supplemented cows. The reduction in CH4 emissions reported in some studies might be associated with higher sulfur contents, and variations in sulfur levels due to regional and processing differences could explain the differing results across studies.
The findings of the current meta-analysis suggest that acetate production decreases significantly in cows supplemented with DDGS, which aligns with previous studies in dairy cattle (8, 41, 42). This reduction in acetate may be linked to a decline in ruminal fiber digestion and a decrease in the ruminal degradability of hay as the proportion of DDGS in the diet increases (8). These results are further supported by the meta-regression model, which shows a linear decrease in acetate production with increasing DDGS inclusion. In contrast, butyrate and propionate production were not influenced by the percentage or type of DDGS. The literature shows inconsistencies regarding butyrate and propionate production. Leupp et al. (43) reported a decrease in acetate molar proportion alongside an increase in propionate, with no effect on butyrate in beef cattle. Meanwhile, Anderson et al. (44) observed a numerical decrease in acetate and increases in both propionate and butyrate molar proportions in dairy cows fed DDGS diets. There was evidence of publication bias in both DMI and butyrate. This bias may be linked to the unilaterally skewed effect sizes observed in the meta-analysis. Additionally, meta-analyses with a smaller number of studies are more susceptible to publication bias than those with a larger number of studies, which can affect the reliability and representativeness of the findings (45). The implications of our findings for livestock management and CH4 mitigation are significant. Although DDGS may not consistently reduce CH4 emissions, their diet inclusion offers other nutritional benefits, such as improved nitrogen utilization. However, it is essential to consider the environmental impact of increased nitrogen excretion when evaluating the overall sustainability of DDGS in cattle diets (8). Future research should focus on identifying the conditions under which DDGS can effectively reduce CH4 emissions and exploring the underlying mechanisms in greater detail. Studies should also investigate the potential relationship between CH4 reduction and sulfur content in cattle diets, particularly when supplemented with DDGS. Given that DDGS is rich in both fats and sulfur, it is important to distinguish the individual effects of these components on CH4 emissions and overall cow health. Understanding how sulfur and fats interact within the rumen and their combined impact on CH4 reduction will be crucial in developing more sustainable cattle diets that mitigate environmental impact while ensuring animal health. Additionally, addressing the significant variability observed in the literature could provide clearer insights into the role of DDGS in CH4 mitigation.
5 Conclusion
Our meta-analysis indicates that the inclusion of DDGS has no significant impact on DMI in dairy or beef cattle in studies that evaluated enteric CH4 emissions. Similarly, DDGS supplementation in cattle diets does not influence enteric CH4 production or yield. Furthermore, the EE content of diets containing DDGS does not significantly affect CH4 production or yield in these cattle.
These findings have important implications for livestock producers and policymakers seeking to balance the nutritional benefits of DDGS with the need for effective CH4 mitigation strategies. Continued research is essential to refine our understanding of DDGS’s role in CH4 emissions and to explore alternative dietary strategies that can contribute to more sustainable livestock production systems.
A key limitation of this meta-analysis is the relatively small number of studies available on enteric CH4 emissions and rumen volatile fatty acids in dairy and beef cattle supplemented with DDGS. This limited dataset may reduce the statistical power and generalizability of the results, as fewer studies can increase variability and the potential for bias. Future research involving a larger body of studies would be valuable in validating and expanding upon the conclusions drawn here.
Data availability statement
The data analyzed in this study is subject to the following licenses/restrictions: Inquiries regarding the original data for the meta-analysis can be directed to Muhammad Irfan Malik, ZHIuaXJmYW4yNzlAZ21haWwuY29t.
Author contributions
MM: Conceptualization, Data curation, Formal analysis, Investigation, Methodology, Project administration, Validation, Visualization, Writing – original draft, Writing – review & editing. JL: Funding acquisition, Writing – review & editing. MC: Writing – review & editing. TH: Writing – review & editing. XS: Funding acquisition, Writing – original draft, Writing – review & editing.
Funding
The author(s) declare that financial support was received for the research, authorship, and/or publication of this article. This study was funded by the Department of Science and Technology of Jilin Province, China (grant no.: 20220202052NC).
Conflict of interest
The authors declare that the research was conducted in the absence of any commercial or financial relationships that could be construed as a potential conflict of interest.
The author(s) declared that they were an editorial board member of Frontiers, at the time of submission. This had no impact on the peer review process and the final decision.
Publisher’s note
All claims expressed in this article are solely those of the authors and do not necessarily represent those of their affiliated organizations, or those of the publisher, the editors and the reviewers. Any product that may be evaluated in this article, or claim that may be made by its manufacturer, is not guaranteed or endorsed by the publisher.
Footnotes
References
1. Belyea, RL, Rausch, KD, and Tumbleson, ME. Composition of corn and distillers dried grains with solubles from dry grind ethanol processing. Bioresour Technol. (2004) 94:293–8. doi: 10.1016/j.biortech.2004.01.001
2. Klopfenstein, TJ, Erickson, GE, and Bremer, VR. Board-invited review: Use of distillers by-products in the beef cattle feeding industry. J Anim Sci. (2008) 86:1223–31. doi: 10.2527/jas.2007-0550
3. USDA. (2023). Ethanol and distillers' dried grains with solubles transportation dashboard. Available at: https://agtransport.usda.gov/stories/s/Ethanol-and-DDGS-exports/dvd5-axr4/ (Accessed July 23, 2024).
4. Crawshaw, R. Co-product feeds in Europe: Animal feeds derived from industrial processing. Morrisville, NC: Lulu. Com (2019).
5. Schingoethe, D, Kalscheur, K, Hippen, A, and Garcia, A. Invited review: The use of distillers products in dairy cattle diets. J Dairy Sci. (2009) 92:5802–13. doi: 10.3168/jds.2009-2549
6. Klopfenstein, T, Waller, J, Merchen, N, and Petersen, L. Distillers grains as a naturally protected protein for ruminants. Dist. Feed Res. Council Proc. (1978) 33:38–45.
7. Gerber, PJ, Hristov, AN, Henderson, B, Makkar, H, Oh, J, Lee, C, et al. Technical options for the mitigation of direct methane and nitrous oxide emissions from livestock: A review. Animal. (2013) 7:220–34. doi: 10.1017/s1751731113000876
8. Benchaar, C, Hassanat, F, Gervais, R, Chouinard, P, Julien, C, Petit, H, et al. Effects of increasing amounts of corn dried distillers grains with solubles in dairy cow diets on methane production, ruminal fermentation, digestion, N balance, and milk production. J Dairy Sci. (2013) 96:2413–27. doi: 10.3168/jds.2012-6037
9. Massé, DI, Jarret, G, Benchaar, C, and Hassanat, F. Effects of adding corn dried distiller grains with solubles (DDGS) to the dairy cow diet and effects of bedding in dairy cow slurry on fugitive methane emissions. Animals. (2014) 4:767–78. doi: 10.3390/ani4040767
10. Hünerberg, M, Little, SM, Beauchemin, KA, McGinn, SM, O’Connor, D, Okine, EK, et al. Feeding high concentrations of corn dried distillers’ grains decreases methane, but increases nitrous oxide emissions from beef cattle production. Agric Syst. (2014) 127:19–27. doi: 10.1016/j.agsy.2014.01.005
11. McGinn, S, Chung, Y-H, Beauchemin, K, Iwaasa, A, and Grainger, C. Use of corn distillers’ dried grains to reduce enteric methane loss from beef cattle. Can J Anim Sci. (2009) 89:409–13. doi: 10.4141/CJAS08133
12. Hünerberg, M, McGinn, S, Beauchemin, K, Okine, E, Harstad, O, and McAllister, T. Effect of dried distillers grains plus solubles on enteric methane emissions and nitrogen excretion from growing beef cattle. J Anim Sci. (2013) 91:2846–57. doi: 10.2527/jas.2012-5564
13. Garnsworthy, PC, Marsden, M, Goodman, JR, and Saunders, N. Inclusion of wheat dried distillers’ grains with solubles from bioethanol plants in diets for dairy cows. Animals. (2021) 11:70. doi: 10.3390/ani11010070
14. Liberati, A, Altman, DG, Tetzlaff, J, Mulrow, C, Gøtzsche, PC, Ioannidis, JP, et al. The PRISMA statement for reporting systematic reviews and meta-analyses of studies that evaluate health care interventions: explanation and elaboration. Ann Intern Med. (2009) 151:136. doi: 10.7326/0003-4819-151-4-200908180-00136
15. The Cochrane Collaboration. (2020). The nutritional dynamic system (NDS) Professional Software version 3.9.9.05 (RUM&N Sas, Reggio Emilia, Italy).
16. Bernier, J, Undi, M, Plaizier, J, Wittenberg, K, Donohoe, G, and Ominski, K. Impact of prolonged cold exposure on dry matter intake and enteric methane emissions of beef cows overwintered on low-quality forage diets with and without supplemented wheat and corn dried distillers’ grain with solubles. Can J Anim Sci. (2012) 92:493–500. doi: 10.4141/cjas2012-040
17. Appuhamy, JRN, Strathe, A, Jayasundara, S, Wagner-Riddle, C, Dijkstra, J, France, J, et al. Anti-methanogenic effects of Monensin in dairy and beef cattle: A meta-analysis. J Dairy Sci. (2013) 96:5161–73. doi: 10.3168/jds.2012-5923
18. Feng, X, Dijkstra, J, Bannink, A, Van Gastelen, S, France, J, and Kebreab, E. Antimethanogenic effects of nitrate supplementation in cattle: A meta-analysis. J Dairy Sci. (2020) 103:11375–85. doi: 10.3168/jds.2020-18541
19. Andrade, C. Mean difference, standardized mean difference (SMD), and their use in meta-analysis: As simple as it gets. J Clin Psychiatr. (2020) 81:11349. doi: 10.4088/JCP.20f13681
20. Cohen, J. Statistical power analysis for the behavioral, Sciences. New York, NY: Academic Press (2013).
21. Cheung, MW-L. Modeling dependent effect sizes with three-level meta-analyses: A structural equation modeling approach. Psychol Methods. (2014) 19:211–29. doi: 10.1037/a0032968
22. Assink, M, and Wibbelink, CJ. Fitting three-level meta-analytic models in R: A step-by-step tutorial. Quant Methods Psychol. (2016) 12:154–74. doi: 10.20982/tqmp.12.3.p154
23. DerSimonian, R, and Laird, N. Meta-analysis in clinical trials. Control Clin Trials. (1986) 7:177–88. doi: 10.1016/0197-2456(86)90046-2
24. Higgins, JP, and Thompson, SG. Quantifying heterogeneity in a meta-analysis. Stat Med. (2002) 21:1539–58. doi: 10.1002/sim.1186
25. Riley, RD, Higgins, JP, and Deeks, JJ. Interpretation of random effects meta-analyses. BMJ. (2011) 342:d549. doi: 10.1136/bmj.d549
26. Knapp, G, and Hartung, J. Improved tests for a random effects meta-regression with a single covariate. Stat Med. (2003) 22:2693–710. doi: 10.1002/sim.1482
27. Viechtbauer, W, and Cheung, MWL. Outlier and influence diagnostics for meta-analysis. Res Synth Methods. (2010) 1:112–25. doi: 10.1002/jrsm.11
28. Begg, CB, and Mazumdar, M. Operating characteristics of a rank correlation test for publication bias. Biometrics. (1994) 50:1088–101. doi: 10.2307/2533446
29. Sterne, JA, and Egger, M. Regression methods to detect publication and other bias in meta-analysis. Pub Bias Meta-Anal Prev Assessment Adjust. (2005) 22:99–110. doi: 10.1002/0470870168.ch6
30. R Core Team. (2020). R: A language and environment for statistical computing. Vienna, Austria: R Foundation for Statistical Computing. Available at: https://www.R-project.org/
31. Viechtbauer, W. Conducting meta-analyses in R with the metafor package. J Stat Softw. (2010) 36:1–48. doi: 10.18637/jss.v036.i03
32. Hales, K, Cole, N, and MacDonald, J. Effects of increasing concentrations of wet distillers grains with solubles in steam-flaked, corn-based diets on energy metabolism, carbon-nitrogen balance, and methane emissions of cattle. J Anim Sci. (2013) 91:819–28. doi: 10.2527/jas.2012-5418
33. Hales, K, Cole, N, and Varel, V. Effects of corn processing method and dietary inclusion of corn wet distillers grains with solubles on odor and gas production in cattle manure. J Anim Sci. (2012) 90:3988–4000. doi: 10.2527/jas.2011-4679
34. Kleinschmit, D, Schingoethe, D, Kalscheur, K, and Hippen, A. Evaluation of various sources of corn dried distillers grains plus solubles for lactating dairy cattle. J Dairy Sci. (2006) 89:4784–94. doi: 10.3168/jds.S0022-0302(06)72528-0
35. Buckner, C, Vanness, S, Erickson, G, Klopfenstein, T, and Benton, J. Nutrient composition and variation among wet and modified distillers grains plus solubles. J Anim Sci. (2008) 86:84
36. Zhao, Y, and Zhao, G. Decreasing ruminal methane production through enhancing the sulfate reduction pathway. Anim Nutr. (2022) 9:320–6. doi: 10.1016/j.aninu.2022.01.006
37. Van Zijderveld, S, Gerrits, W, Apajalahti, J, Newbold, J, Dijkstra, J, Leng, R, et al. Nitrate and sulfate: Effective alternative hydrogen sinks for mitigation of ruminal methane production in sheep. J Dairy Sci. (2010) 93:5856–66. doi: 10.3168/jds.2010-3281
38. Jiang, G, Gutierrez, O, Sharma, KR, and Yuan, Z. Effects of nitrite concentration and exposure time on sulfide and methane production in sewer systems. Water Res. (2010) 44:4241–51. doi: 10.1016/j.watres.2010.05.030
39. Singh, SB, and Lin, HC. Hydrogen sulfide in physiology and diseases of the digestive tract. Microorganisms. (2015) 3:866–89. doi: 10.3390/microorganisms3040866
40. Bryant, M, Campbell, LL, Reddy, C, and Crabill, M. Growth of desulfovibrio in lactate or ethanol media low in sulfate in association with H2-utilizing methanogenic bacteria. Appl Environ Microbiol. (1977) 33:1162–9. doi: 10.1128/aem.33.5.1162-1169.1977
41. Kelzer, JM, Kononoff, PJ, Gehman, A, Tedeschi, L, Karges, K, and Gibson, M. Effects of feeding three types of corn-milling coproducts on milk production and ruminal fermentation of lactating Holstein cattle. J Dairy Sci. (2009) 92:5120–32. doi: 10.3168/jds.2009-2208
42. Sasikala-Appukuttan, A, Schingoethe, D, Hippen, A, Kalscheur, K, Karges, K, and Gibson, M. The feeding value of corn distillers solubles for lactating dairy cows. J Dairy Sci. (2008) 91:279–87. doi: 10.3168/jds.2007-0250
43. Leupp, J, Lardy, G, Karges, K, Gibson, M, and Caton, J. Effects of increasing level of corn distillers dried grains with solubles on intake, digestion, and ruminal fermentation in steers fed seventy percent concentrate diets. J Anim Sci. (2009) 87:2906–12. doi: 10.2527/jas.2008-1712
44. Anderson, J, Schingoethe, D, Kalscheur, K, and Hippen, A. Evaluation of dried and wet distillers grains included at two concentrations in the diets of lactating dairy cows. J Dairy Sci. (2006) 89:3133–42. doi: 10.3168/jds.S0022-0302(06)72587-5
45. Borenstein, M, Hedges, LV, Higgins, JP, and Rothstein, HR. Introduction to Meta-Analysis. New York, NY: John Wiley & Sons (2021). 276–292.
46. Hünerberg, M, McGinn, S, Beauchemin, KA, Okine, E, Harstad, OM, and McAllister, TA. Effect of dried distillers’ grains with solubles on enteric methane emissions and nitrogen excretion from finishing beef cattle. Can J Anim Sci. (2013) 93:373–85. doi: 10.4141/cjas2012-151
47. Castillo-Lopez, E, Jenkins, C, Aluthge, N, Tom, W, Kononoff, P, and Fernando, SC. The effect of regular or reduced-fat distillers grains with solubles on rumen methanogenesis and the rumen bacterial community. J Appl Microbiol. (2017) 123:1381–95. doi: 10.1111/jam.13583
Keywords: distillers dried grains with solubles, methane, dairy cows, cattle, meta-analysis
Citation: Malik MI, Li J, Capucchio MT, Hassan T and Sun X (2024) Effects of distiller’s dried grains with solubles on enteric methane emissions in dairy and beef cattle: a meta-analysis. Front. Vet. Sci. 11:1480682. doi: 10.3389/fvets.2024.1480682
Edited by:
Valiollah Palangi, Ege University, TürkiyeReviewed by:
Zoey Durmic, University of Western Australia, AustraliaBabak Darabighane, Semnan University, Iran
Copyright © 2024 Malik, Li, Capucchio, Hassan and Sun. This is an open-access article distributed under the terms of the Creative Commons Attribution License (CC BY). The use, distribution or reproduction in other forums is permitted, provided the original author(s) and the copyright owner(s) are credited and that the original publication in this journal is cited, in accordance with accepted academic practice. No use, distribution or reproduction is permitted which does not comply with these terms.
*Correspondence: Xuezhao Sun, eHVlemhhb3NAaG90bWFpbC5jb20=
 Muhammad Irfan Malik
 Jianping Li
 Maria Teresa Capucchio
 Talal Hassan
 Xuezhao Sun