 Weisi Zhang
 Lin Wu
 Lulu Ji
94% of researchers rate our articles as excellent or good
Learn more about the work of our research integrity team to safeguard the quality of each article we publish.
Find out more
ORIGINAL RESEARCH article
Front. Sustain. Food Syst., 05 February 2025
Sec. Agricultural and Food Economics
Volume 9 - 2025 | https://doi.org/10.3389/fsufs.2025.1550985
This article is part of the Research TopicHarnessing Digital Innovation for Sustainable Agricultural DevelopmentView all 13 articles
Fresh products are characterized by a certain deterioration rate, and the fresh supply chain typically relies on third-party cold chain logistics companies (3PLs) for transportation. This study constructs a fresh supply chain composed of supplier, retailer, and third-party cold chain logistics company, where shipping costs are borne by either the supplier or the retailer. The shipping costs bearer considers whether to adopt blockchain technology to enhance the transparency of fresh logistics and improve consumers’ perceived value. Using game theory, the paper attempts to explore who should bear the shipping costs (supplier or retailer), clarifying the shipping costs bear’s blockchain adoption strategy. The results indicate that: First, the 3PL’s profit is negatively correlated with the research and development (R&D) cost coefficient of carbon emission reduction (CER) and the deterioration rate of fresh products, while it is positively correlated with consumer low-carbon preferences. When the R&D cost coefficient of CER is high, or the deterioration rate of fresh products is low, or consumer low-carbon preferences are low, the 3PL prefers RCB model, otherwise SNB model. Additionally, the 3PL’s carbon reduction level is higher when blockchain technology is adopted, especially with low R&D cost coefficient of CER and high consumer low-carbon preferences. Second, regarding who should bear the shipping costs, when blockchain technology is not adopted, it is optimal for the supplier to bear the shipping costs, maximizing the overall profit of the supply chain. In contrast, when blockchain technology is adopted, having the retailer bear the shipping costs maximizes the overall profit of the supply chain. Specifically, when the R&D cost coefficient of CER is high, regardless of blockchain adoption, the supplier bearing the shipping costs maximizes the overall profit of the supply chain. Finally, concerning whether the bearer should invest in blockchain technology, when the R&D cost coefficient of CER is low and consumer low-carbon preferences are high, adopting blockchain technology leads to Pareto optimal profits for both the supplier and the retailer, regardless of who bears the shipping costs. This study provides a decision framework for optimizing cost allocation and technology adoption in sustainable cold chain management, particularly relevant for perishable goods with short shelf lives.
As consumers’ economic strength and purchasing potential continue to rise, the demand for fresh products in the market has significantly increased. Data shows that in 2023, the market size of fresh agricultural products in China reached approximately 94,371.4 billion RMB, a year-on-year growth of 2.84%.1 However, these products are highly prone to quality deterioration during transportation and storage, making it difficult to meet consumers’ high standards for freshness. To address this challenge, cold chain logistics has emerged. The export of high-quality agricultural products from China (such as cherries, lobsters, etc.) has extremely high requirements for freshness during transportation. With the aid of cold chain technologies such as vacuum pre-cooling and modified atmosphere packaging, these high-value products can maintain freshness during long-distance transport. For example, Shandong cherries, which are exported to Europe and America, rely on a well-established cold chain system. Cold chain logistics, through a series of temperature control measures such as temperature regulation, preservation technologies, and facilities like cold storage, refrigerated trucks, and refrigerated containers, effectively reduce the deterioration rate of fresh products during transportation, ensuring product freshness. As a result, it has become the mainstream method for transporting fresh products.
Meanwhile, given the severe challenges posed by global climate change, there has been an increasing emphasis at the national level on carbon reduction, and promoting green, low-carbon development has become a societal consensus (García-Muros et al., 2022). For example, Cainiao Network, a subsidiary of Alibaba Group, has implemented several green logistics initiatives aimed at reducing carbon emissions.2 Cainiao Network has gradually shifted to transportation methods with lower carbon emissions, such as rail and sea transport, particularly on routes connecting Asia and Europe, achieving low-carbon transportation through the China-Europe Railway Express. Additionally, Cainiao Network has launched the “Green Package” project, which promotes the green transformation of the logistics industry by sharing packaging materials with partners, optimizing transport routes, and reducing unnecessary transportation. In this context, third-party cold chain logistics companies, as a crucial part of the logistics industry, are actively responding to the national call and incorporating carbon reduction into their corporate strategies. For example, JD Logistics has been promoting the strategic “Qingliu Plan,” focusing on the three pillars of “Planet,” “People,” and “Profits.” This plan encourages collaboration with industry and society to advance green sustainable development, aiming to reduce the environmental impact of logistics activities and achieve a win-win outcome for both economic and social benefits.3
In supply chain management, due to information asymmetry during transportation, there can be situations where the freight payer incurs losses. As a result, the selection of the freight payer becomes a critical factor. Typically, the freight costs can be borne by either the supplier or the retailer. On B2B e-commerce platforms, such as Alibaba, suppliers often provide transportation options, including cases where the supplier covers the shipping costs. For example, in JD Fresh, some suppliers, to attract buyers and ensure the prompt and fresh delivery of fresh products, offer pricing options that include shipping costs. In this scenario, the supplier is responsible not only for pricing and quality control but also for the entire logistics cost from the warehouse to the buyer’s designated location. On the other hand, Hema Fresh, with its business model, has developed a unique factory-style logistics system. After receiving an order via its app, Hema Fresh handles on-site picking, packaging, shipment, and delivery, meaning that Hema Fresh (the retailer) bears the delivery costs from the store to the consumer’s hands.
To improve the transparency and traceability of the supply chain, blockchain technology has become a powerful tool. Blockchain is an emerging technology that enhances the traceability of fresh food products by leveraging decentralization, encryption, and transparency. It allows for real-time tracking and data sharing throughout the logistics process, which is crucial for maintaining the quality and safety of perishable goods. By providing all parties with access to the current status of fresh products, blockchain ensures data accuracy and security, reducing the risk of fraud. The real-time updates and automation offered by blockchain help streamline the management of the cold chain, minimizing inventory buildup and preventing delays in transportation, which are critical for maintaining the freshness and quality of the products. To address the problem of fresh product deterioration and allocate corresponding costs reasonably, many companies have built blockchain-based traceability platforms in their supply chains. For example, Shunfeng Express, using blockchain technology, has partnered with institutions like SF Express to jointly establish an agricultural product data alliance chain, solving the major pain points of traditional traceability, such as centralized data storage and product misplacement, and effectively ensuring product quality.4 Implementing such strategies is crucial for promoting full traceability of information between supply chain members (Zhang T. et al., 2023). Specifically, when investigating the deterioration of fresh products, the transparent platform built by blockchain technology can quickly retrieve and present detailed records, which precisely pinpoint the specific responsibilities and operational details of each participant in the supply chain. For instance, Walmart, an active adopter of blockchain technology, attaches detailed manufacturing information labels to all products. These labels not only include precise time and geographical data regarding the product’s movement but also record in detail any inspections, quarantines, and anomaly findings, ensuring accurate responsibility traceability.5
However, the construction of cold chain logistics systems faces high costs, which present significant financial challenges for emerging fresh product companies. To address this issue, many companies have turned to partnering with specialized third-party cold chain logistics companies (3PLs) to outsource operations and alleviate operational pressure. Although 3PLs offer professional services, extensive networks, and efficient management, the complexity and uncontrollability of cold chain logistics remain significant. During long-distance and multiple transfers, fresh products are vulnerable to temperature fluctuations, improper humidity, and transport delays, leading to high deterioration rates (defined as the proportion of quality loss due to natural decay, spoilage, or loss of freshness over a specified period). This not only reduces the quality of the products but also negatively impacts the company’s reputation. Even more troublesome is the lack of precise information tracking and monitoring between the various stages of the supply chain, making it difficult for companies to proactively address quality and safety issues. The inability to monitor product status in real-time means that it is difficult to take timely actions to ensure freshness and safety. This lack of transparency in information exacerbates operational risks for businesses and hinders the overall progress of the cold chain logistics industry. Therefore, the current cold chain logistics system urgently needs to address issues related to ensuring product freshness, reducing deterioration rates, and enhancing supply chain transparency.
In the existing academic research, literature on fresh product transportation primarily focuses on analyzing the impact on the profits of upstream and downstream supply chain participants when a single entity (supplier or retailer) bears the shipping costs and further explores the potential contribution of blockchain technology to supply chain profits in this context. These research findings provide a solid theoretical foundation for understanding fresh product transportation strategies and their economic effects. However, current studies exhibit significant limitations in three areas. First, there is a lack of comparative analysis to determine which model, whether the supplier or retailer bears the shipping costs, results in greater supply chain profits. Second, there is a scarcity of systematic and comprehensive research exploring whether the adoption of blockchain technology, once the shipping costs bearer is determined, can help a 3PL reduce carbon emissions and enhance upstream and downstream supply chain profits. Third, existing literature rarely considers the factors influencing the profits of the 3PL, making the research incomplete. This research gap not only limits our understanding of the comprehensive effects of fresh product transportation strategies but also hinders the deeper exploration of blockchain technology applications in supply chain management. Therefore, this paper constructs a market consisting of the supplier, retailer, third-party cold chain logistics company, and consumer. In this market, the overall supply chain decisions are considered: the selection of the shipping costs payer and whether to adopt blockchain technology, leading to the establishment of four models: supplier bears the shipping costs and does not adopt blockchain (SNB), supplier bears the shipping costs and adopts blockchain (SCB), retailer bears the shipping costs and does not adopt blockchain (RNB), and retailer bears the shipping costs and adopts blockchain (RCB).
Through model solving and comparative analysis, we aim to address the following questions: (1) What is the impact of various factors on the profit of the third-party cold chain logistics company? How does the adoption of blockchain technology affect the carbon reduction level of the third-party cold chain logistics company? (2) How does the adoption of blockchain technology affect the optimal profit of the supplier and retailer? (3) Which party bearing the shipping costs will maximize the overall profit of the supply chain?
The main findings of this study are as follows. First, the 3PL’s profit is negatively correlated with the R&D cost coefficient of CER and the deterioration rate of fresh products, while it is positively correlated with consumer low-carbon preferences. When the R&D cost coefficient of CER is high, or the deterioration rate of fresh products is low, or consumer low-carbon preferences are low, the 3PL achieves the highest profit under the RCB model due to high shipping revenue. Conversely, the 3PL achieves the highest profit under the SNB model, where the blockchain-induced compensation losses for fresh product deterioration are eliminated. Additionally, the 3PL’s carbon reduction level is higher when blockchain technology is adopted, especially with low the R&D cost coefficient of CER and high consumer low-carbon preferences. In contrast, when blockchain technology is not adopted, the savings from the compensation for fresh product deterioration can be used for further carbon reduction, achieving a higher carbon reduction level. Second, regarding who should bear the shipping costs, when blockchain technology is not adopted, it is optimal for the supplier to bear the shipping costs, maximizing the overall profit of the supply chain. In contrast, when blockchain technology is adopted, having the retailer bear the shipping costs maximizes the overall profit of the supply chain. Specifically, when the R&D cost coefficient of CER is high, regardless of blockchain adoption, the supplier bearing the shipping costs maximizes the overall profit of the supply chain. Finally, concerning whether the bearer should invest in blockchain technology, when the R&D cost coefficient of CER is low and consumer low-carbon preferences are high, adopting blockchain technology leads to Pareto optimal profits for both the supplier and the retailer, regardless of who bears the shipping costs.
The contributions of this paper can be summarized as follows: First, the research examines the operational mechanisms and cost structures of supply chains under different freight cost-bearing models, providing theoretical insights for optimizing supply chain operations and decision-making. The study also clarifies the impact of these models on the interests of various stakeholders. Second, the research deepens the understanding of green supply chain management by analyzing the role of blockchain technology in improving the transparency, traceability, and efficiency of green fresh product supply chains. This provides a strong foundation for both theoretical and practical development in green supply chain management. Lastly, the study investigates the influence of freight cost-bearing mechanisms on carbon reduction effects and promotes the digital transformation of the fresh product supply chain.
The remainder of this paper is structured as follows. Section 2 provides a review of the relevant literature. Section 3 introduces the model. Section 4 analyzes the profits of the 3PL, supplier, and retailer under the four different models. Section 5 compares the results across various models, examining in detail how factors such as consumer low-carbon preferences, the deterioration rate of fresh products, and the R&D cost coefficient of CER influence the profits of upstream and downstream supply chain entities, as well as the carbon reduction level. Section 6 concludes the paper. Proofs for all lemmas and propositions are presented in the Supplementary Material.
The literature highly relevant to this study encompasses four main streams: deterioration rate of fresh product, blockchain technology, consumer low-carbon preference and shipping costs.
The deterioration rate of fresh products refers to the proportion of quality loss due to natural decay, spoilage, or loss of freshness over a given period. This metric measures the product loss during the process from production to sale, helping supply chain businesses assess shelf life and optimize inventory and transportation management. In Brazil, the lack of cold-chain infrastructure for transporting fresh produce results in a 30–40% loss of fruits and vegetables, both in quantity and quality, due to inadequate temperature-controlled storage and transport, impacting farmers’ revenue and increasing consumer costs.6 The report by the World Wildlife Fund indicates that the loss rate in the logistics chain of aquatic products in China is between 25 and 30%, with the primary cause being the lack of cold-chain logistics facilities.7 Quantity and quality losses are the key characteristics of fresh agricultural products during long-distance transportation (Cai et al., 2010). Liu et al. (2015) developed an inventory model for deteriorating food to determine optimal strategies for dynamic pricing and investment in preservation technology. Zheng et al. (2019) studied the optimal pricing decision of suppliers and the optimal procurement decision of retailers under quantity discount contracts, considering the impact of deterioration rate on supply chain profits. Factors such as the initial product quality level, deterioration rate, cost optimization coefficients, and the cost of adopting technology by each supply chain member all influence the profitability of the supply chain participants (Dey et al., 2024). Yu and Nagurney (2013) captured both quantity and quality losses in fresh agricultural products and used cold chain services to mitigate these losses. Wu et al. (2015) defined the characteristics of fresh agricultural products in terms of both quantity and quality losses. Claassen et al. (2024) extended the classical and commonly used Economic Order Quantity (EOQ) model, applying it to multi-tier supply chains for highly perishable products. Yu et al. (2020) modeled product deterioration by multiplying order quantities by the loss rate. To cope with product spoilage during long-distance transportation, suppliers or retailers may make additional purchases from the spot market. Wang and Chen (2017) examined the pricing and coordination of call options in fresh product supply chains, where fresh products captured the circulation loss in quantity. Xu et al. (2017) investigated the deteriorating item inventory issue in a two-warehouse system, assuming constant demand and deterioration rates. This paper explores the economic losses caused by fresh product deterioration due to factors such as third-party logistics cold chain service levels during transportation, and analyzes the countermeasures taken by suppliers and retailers to address these losses. Additionally, the paper further investigates the impact of the deterioration rate on decisions made by 3PLs.
Blockchain technology, as an emerging traceability tool, offers advantages such as decentralization, encryption protection, and openness and transparency. To address product deterioration issues and optimize cost distribution, many companies have built blockchain-based traceability platforms in their supply chains, driving strategic digital transformation. The cross-channel effects and the application of blockchain significantly impact optimal decision-making and coordination outcomes (Xu et al., 2023). Zhang X. et al. (2023) studied the impact of blockchain technology on cold supply chains involving manufacturers, retailers, and third-party logistics (3PL) providers in the context of digital transformation, providing several managerial insights. Zhu et al. (2024) considered two types of companies, high-quality and low-quality brand enterprises, and examined the effects of blockchain use on carbon emission reduction (CER) and profits. Niu et al. (2023) developed a game theory model to analyze the motivations of e-retailers participating in upstream brand blockchains, ensuring consumer trust, but potentially reducing the revenue e-retailers share from imitation sales. Li et al. (2022) found that fairness issues related to the green sensitivity of retailers and consumers can influence the use of blockchain. Niu et al. (2021) studied how companies and governments use blockchain technology to combat counterfeiting, showing that blockchain applications may benefit manufacturers in certain cases. Naoum-Sawaya et al. (2023) pointed out that blockchain is not always financially beneficial and suggested that manufacturers could strategically balance product quality and blockchain investment. Due to its high energy consumption, blockchain has a negative environmental impact. When consumer trust is high, businesses may opt not to use blockchain, but when consumer trust is low, blockchain is adopted (Biswas et al., 2023). Dong et al. (2023) developed a three-tier supply chain with multiple suppliers and explored the impact of traceability technology on the incentives of supply chain members. Awasthy et al. (2025) built a binary supply chain consisting of buyers and suppliers and analyzed their traceability and pricing decisions to study when blockchain adoption is beneficial for the supply chain. Unlike the above studies, this paper analyzes the different scenarios of third-party logistics costs and blockchain cost bearers, combining the freshness of fresh products and transportation losses, and explores the impact of blockchain adoption by supply chain members on their individual profits and the overall supply chain benefits.
Consumer low-carbon preference refers to the tendency of consumers to choose products or services with lower carbon emissions and minimal environmental impact, reflecting their concern for sustainability and climate change. In recent years, supply chain optimization under carbon policies has become a key research focus, particularly the issue of carbon emissions in cold chain logistics, which has drawn significant academic attention. Xia et al. (2023) studied the impact of low-carbon preferences on supply chain decisions, examining how market competition intensity and consumer low-carbon preferences affect equilibrium decisions and business profits. Meng et al. (2021) considered both low-carbon and channel preferences, finding that the demand for low-carbon products is proportional to the consumer’s low-carbon preference level and offline channel preference level. Drent et al. (2023) explored how companies selling multiple products make inventory and transportation decisions under two supply modes, aiming to minimize costs while ensuring that carbon emissions are kept within target levels. Bai et al. (2019) assumed that the demand for fresh products is a linear function of price and green emission reduction levels, while carbon emissions depend on green technology levels. They studied the impact of carbon policies on cold chain decisions in a vendor-managed inventory system involving manufacturers and two competing retailers. Cai and Jiang (2023) analyzed the effects of consumer low-carbon preferences, total regulation and transaction supervision, and power structures on supply chain members’ optimal pricing and carbon reduction decisions. Tiwari et al. (2018) assumed that carbon emissions during the storage process of fresh products depend on inventory levels and energy consumption, and studied the inventory strategy for fresh products under carbon policies. Du et al. (2015) found that in emission-sensitive markets, emission reductions not only lead to higher production costs but also stimulate reverse demand functions. Zou et al. (2021) examined manufacturers’ financing and ordering decisions, as well as suppliers’ pricing decisions with or without carbon reduction investments, when product output is uncertain, and consumers have low-carbon preferences. Building on these findings, this paper investigates the impact of consumer low-carbon preferences on equilibrium decisions and business profits.
During the logistics transportation process, the party responsible for paying the shipping costs can have a significant impact on the supply chain’s efficiency. Yenipazarli (2017) pointed out that large retailers require suppliers to improve environmental performance while ensuring quality and reducing prices, which forces suppliers to make large-scale investments in packaging and energy consumption. Although the cost savings partially offset the initial investment, the final profits are primarily gained by the retailer, while the supplier bears most of the costs and fails to recover the initial investment. Zhang et al. (2023) explored the impact of blockchain-driven digital transformation on manufacturers, retailers, and third-party logistics providers (3PLs) in the cold chain supply chain. Manufacturers are responsible for product production, 3PLs handle transportation to retailers, and the final product is resold to the market, with the shipping costs paid by the retailer to the 3PL. Fang et al. (2024) examined the interaction between retailer pricing decisions and supply chain members’ blockchain investment decisions, studying who should bear the investment costs when both manufacturers and retailers can afford the blockchain costs. This paper divides the models into two scenarios based on the shipping costs bearer: one where the supplier bears the shipping costs and one where the retailer bears the shipping costs and solves the models accordingly.
Based on the review of the existing literature, several key insights emerge. First, most studies fail to provide a comparative analysis of how the responsibility for shipping costs, whether borne by suppliers or retailers, influences the supply chain’s profitability. This paper addresses this gap by comparing two scenarios and investigating which party bearing the shipping costs leads to a more favorable outcome for the entire supply chain or its individual members. Second, there is a lack of comprehensive research that examines how the adoption of blockchain technology can enhance the profits of both upstream and downstream supply chain members, once the shipping costs bearer is determined. Lastly, in studies on 3PLs’ carbon reduction efforts, very few have simultaneously considered the impact of fresh product deterioration rates, blockchain technology adoption, and consumer low-carbon preferences. This paper, however, integrates all these factors.
In light of these gaps, this paper aims to apply a game theory-based model to construct a supply chain involving 3PLs, suppliers, and retailers. By exploring issues such as product deterioration, the choice of shipping costs bearer, the application of blockchain technology, and consumer low-carbon preferences, this paper systematically analyzes how these factors affect decision-making and overall supply chain profitability. The introduction of cold chain services and blockchain platforms not only enhances the quality control and transparency of fresh products but also provides new avenues for companies to manage carbon emissions and meet the growing consumer demand for low-carbon products.
To clearly demonstrate the distinctions between our research and previous studies, Table 1 highlights the key contributions of this paper. The table includes categories such as blockchain, shipping costs, stackelberg game, low-carbon preferences, and deterioration of fresh products.
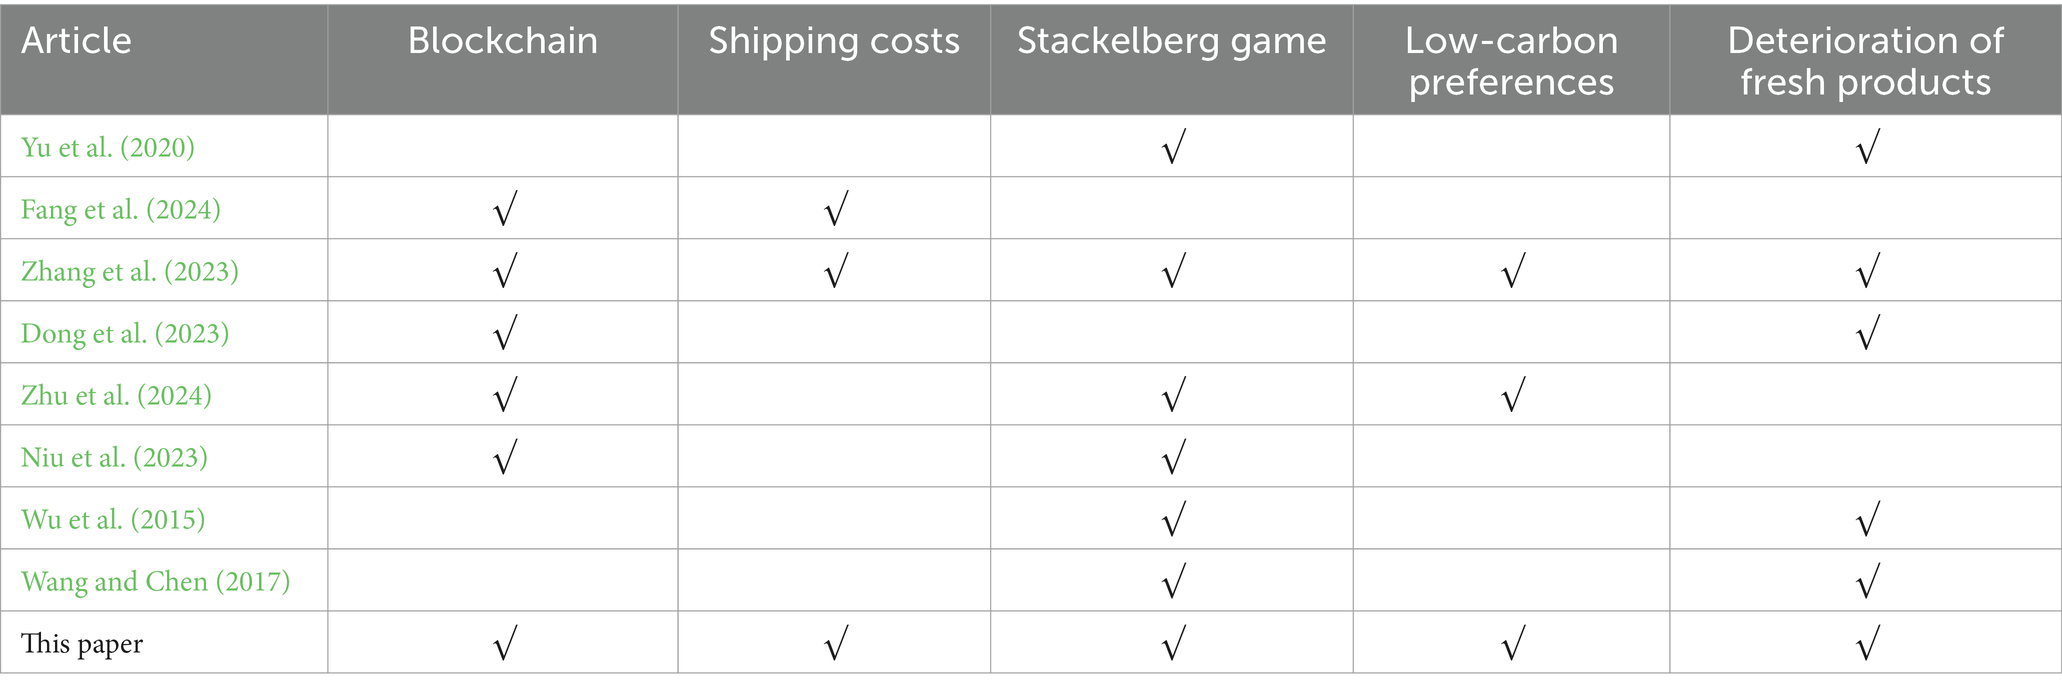
Table 1. Comparison of our study with existing related research.
This paper studies the supply chain consisting of supplier ( ), retailer ( ), and third-party cold chain logistics company ( ), focusing on the selection of the shipping costs bearer (supplier or retailer) during the transportation of fresh products and whether blockchain technology should be adopted (or not). Based on the Stackelberg game model, the equilibrium results and strategic choices of the participants are compared and analyzed under four different scenarios: SNB model (supplier bears shipping costs without blockchain), SCB model (supplier bears shipping costs with blockchain), RNB model (retailer bears shipping costs without blockchain), and RCB model (retailer bears shipping costs with blockchain). We choose the game theory model because it effectively captures the strategic interactions among the supplier, retailer, and third-party cold chain logistics company, which significantly impact supply chain efficiency. This model allows for quantifying these interactions and analyzing the balance between competition and cooperation. Unlike review-based or policy-oriented approaches, which lack precision in modeling individual decision-making and conflicts of interest, game theory provides a robust framework to explore equilibrium strategies under different scenarios. It enables a deeper understanding of how shipping costs allocation and blockchain adoption affect participants’ outcomes, offering actionable insights to optimize supply chain performance. All symbols and expressions are summarized in Table 2.
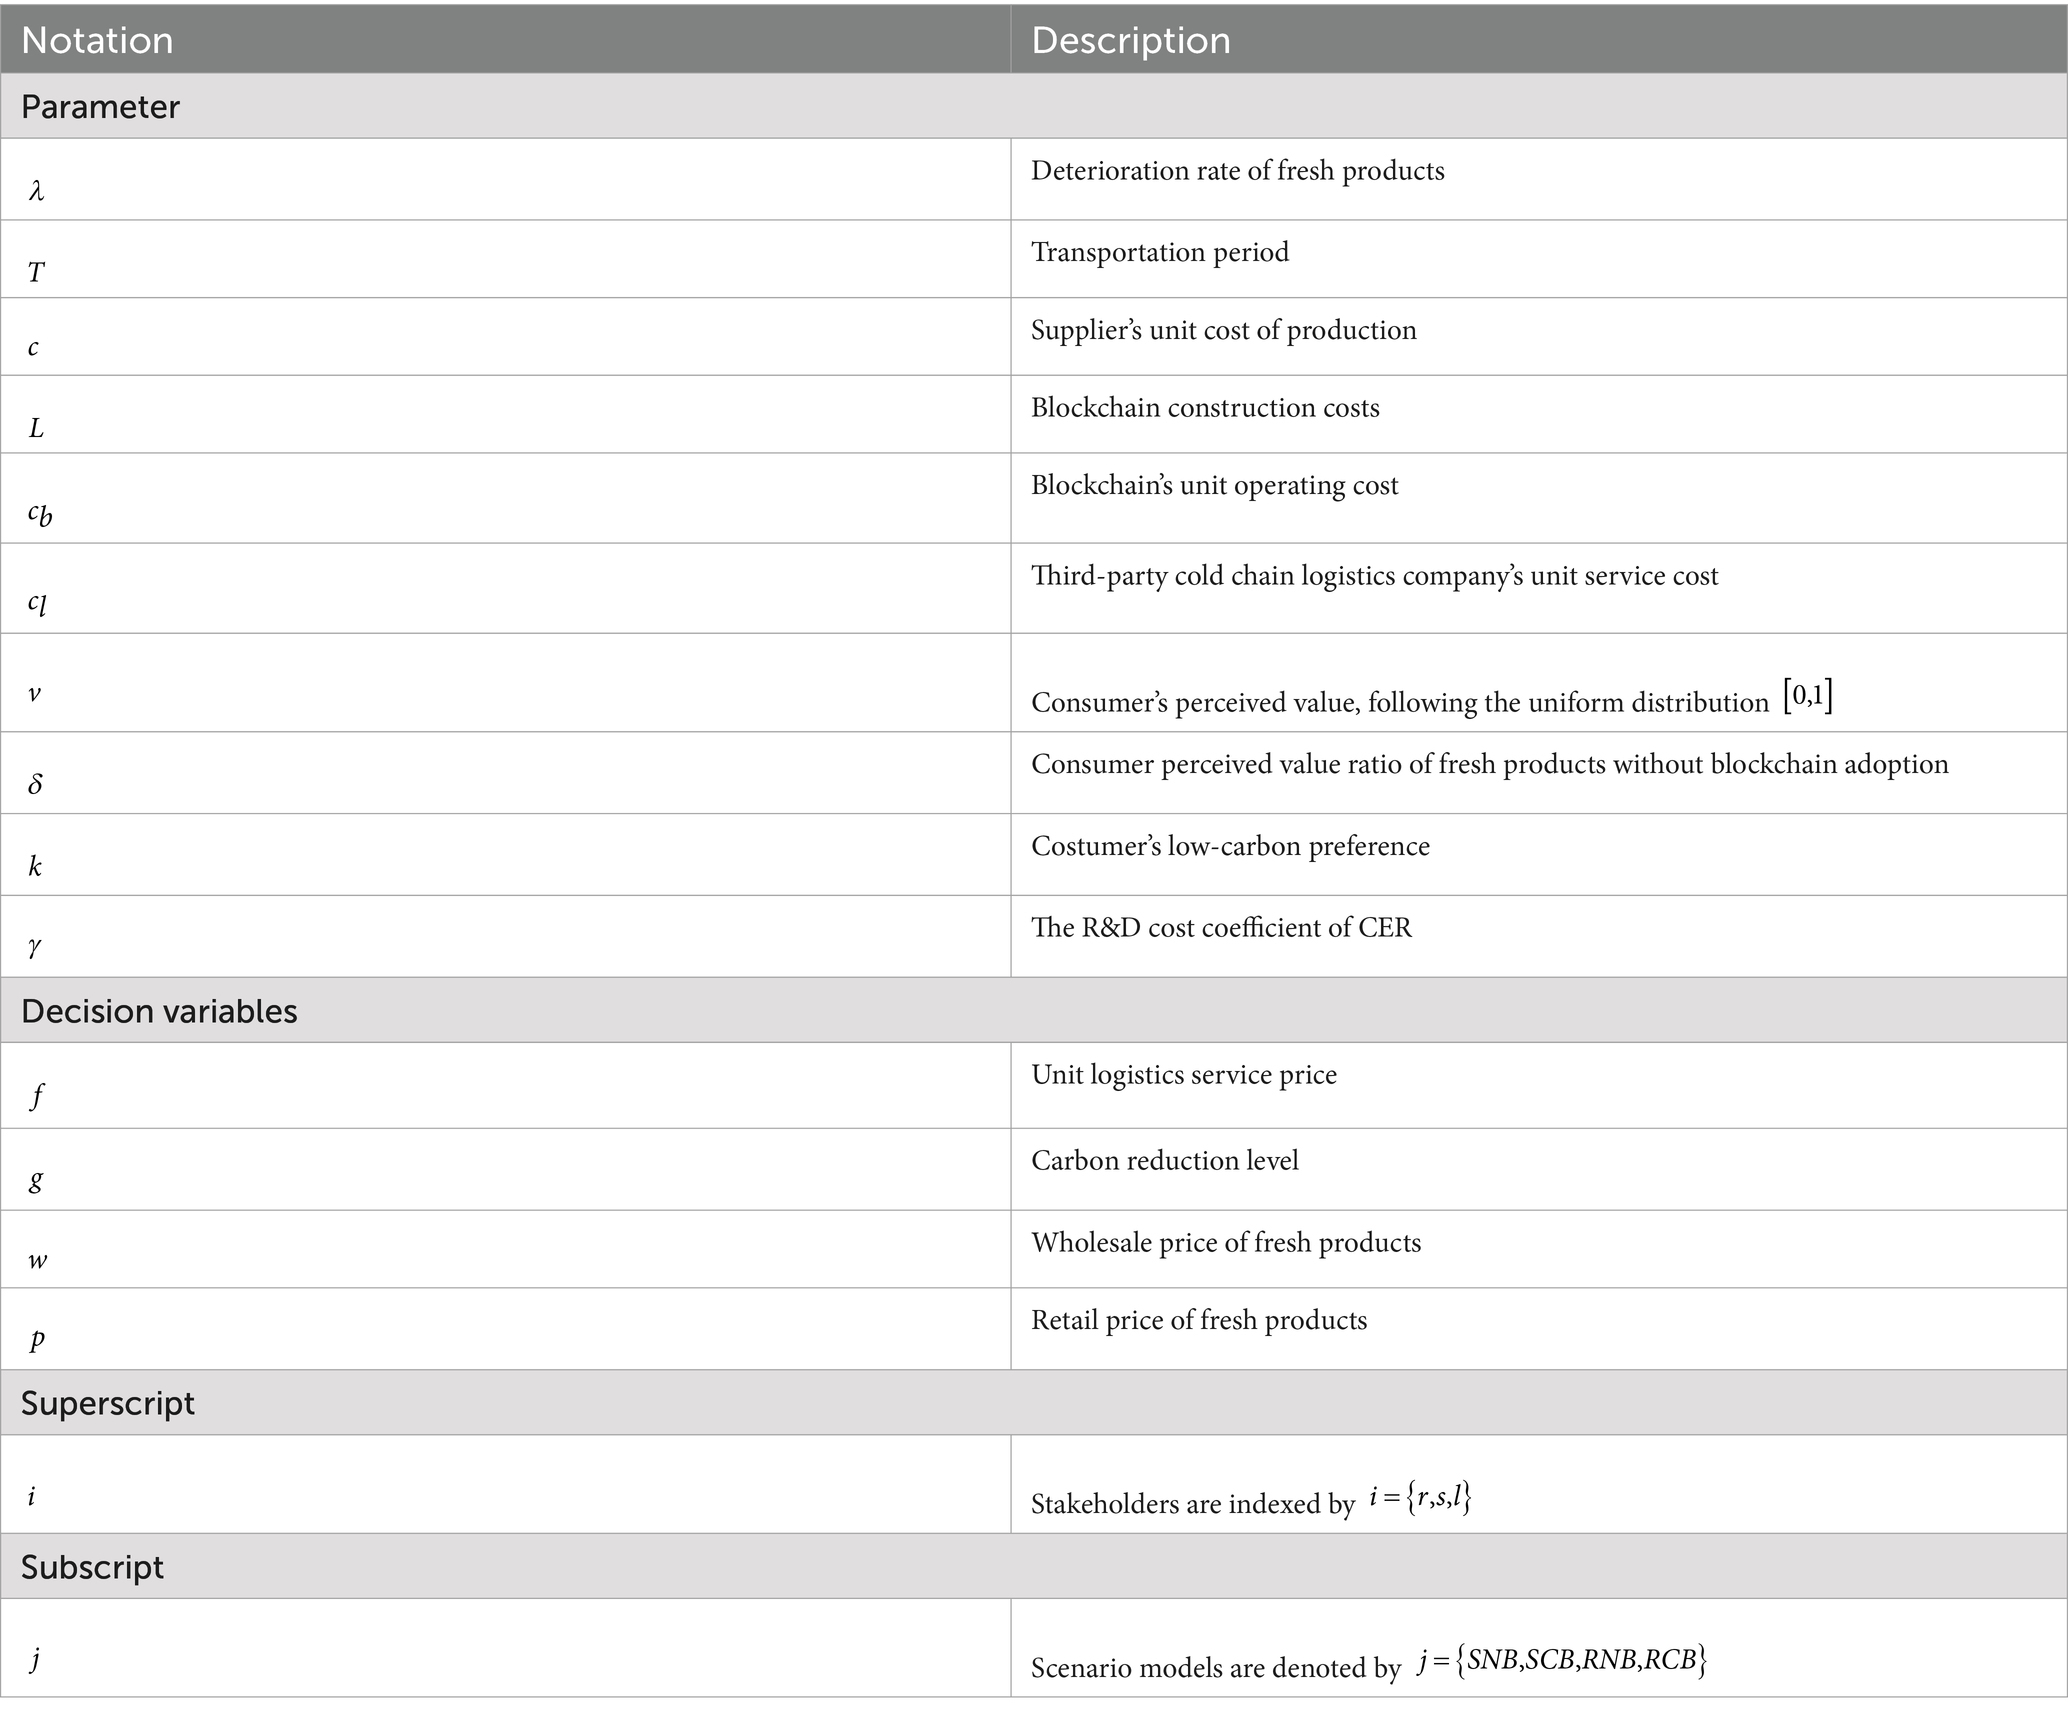
Table 2. Summary of notations.
According to Zhu et al. (2024), we define the R&D cost of CER as , where is the R&D cost coefficient for CER (Carbon Emission Reduction), representing the difficulty of CER development. It directly impacts the complexity and challenges of the R&D process. This expression indicates that as carbon reduction efforts increase, the R&D cost grows quadratically, reflecting the significant increase in both the difficulty of achieving higher reduction targets and the resource requirements in the process of technological development.
Consumer utility is typically assumed to be influenced by the consumer’s low-carbon preference and the level of Carbon Emission Reduction (CER) (Zhu et al., 2024). Therefore, the utility without blockchain technology (NB) and with blockchain technology (CB) are as follows: , and . Therefore, the corresponding demand function is , and , respectively.
In recent years, with the rapid development of fresh e-commerce and chain supermarkets, the deterioration of fresh products during transportation from suppliers to retailers has become an increasingly prominent issue. For example, before the 2021 Chinese New Year, JD Fresh imported a large quantity of Chilean cherries and entrusted a third-party cold chain logistics company for long-distance transportation. However, due to a malfunction in the cold chain truck’s temperature control system and transportation delays, approximately 5% of the cherries deteriorated, softening and spoiling upon arrival at the retailer. Similarly, in the summer of 2022, seafood purchased by Walmart supermarkets from coastal cities faced similar issues. Due to poor cooling performance of the cold chain trucks and rough roads, approximately 3% of the seafood lost freshness and quality by the time it arrived at the supermarket and had to be sold at a discounted price or discarded. Based on the above realistic background, we assume that the remaining rate of fresh products after deterioration during the transportation period is , where represents the deterioration rate of fresh products, based on previous studies (Blackburn and Scudder, 2009; Yu and Nagurney, 2013; Wu et al., 2023). We consider that the retailer faces deterministic demand . To meet the demand , the retailer usually increases the order quantity to account for product loss, so the actual order quantity becomes .
Blockchain technology provides accurate quality traceability and accountability in the fresh product supply chain, enhancing consumer trust in product transparency and safety, thereby increasing utility. However, the high construction and operational costs of blockchain, including platform development, equipment deployment, maintenance expenses, and system construction, represent significant barriers to widespread adoption (Ding et al., 2020; Zhang et al., 2023). When blockchain technology is implemented in a supply chain, two types of costs are involved. represents the operational expenses of blockchain, while reflects the construction costs of the blockchain system. While blockchain ensures the accurate recording and sharing of data from devices, its role is limited to these functions and does not directly impact the actual conditions during transportation. For instance, blockchain can track shipments in real-time and provide visibility into delays or issues but cannot address root causes such as congestion, customs problems, or other logistical bottlenecks. While it helps identify issues, resolving them still relies on external systems and human intervention. Thus, in the absence of blockchain, losses due to product deterioration during transportation are typically borne by the supplier or retailer. A balance must be sought between the benefits and costs of adopting blockchain technology.
However, when the retailer adopts blockchain technology, if deterioration occurs during transportation, the blockchain record clearly assigns responsibility, and the 3PL is required to compensate the retailer for order losses and transportation costs incurred. Similarly, when the supplier adopts blockchain technology, the 3PL must bear the order loss and shipping costs incurred by the supplier due to product deterioration (Zhang et al. 2023).
Generally, the 3PL holds the priority in decision-making. Due to the significant lead time required for cold chain services, the 3PL cannot quickly adjust their capabilities. In contrast, suppliers and retailers can flexibly adjust the wholesale and retail prices after observing the decisions made by the 3PL. The cold chain services provided by the 3PL can increase the supplier’s supply volume and the retailer’s market demand, which in turn directly affects the profits of both parties. Therefore, it is reasonable for the 3PL to set the cold chain service level before the supplier and retailer (Yu et al., 2020).
The decision sequence is as follows: First, the 3PL determines the optimal cold chain service price and the optimal carbon reduction level . Second, the supplier determines the optimal wholesale price for fresh products. Finally, the retailer sets the optimal retail price . Figure 1 illustrates the model framework and decision sequence.
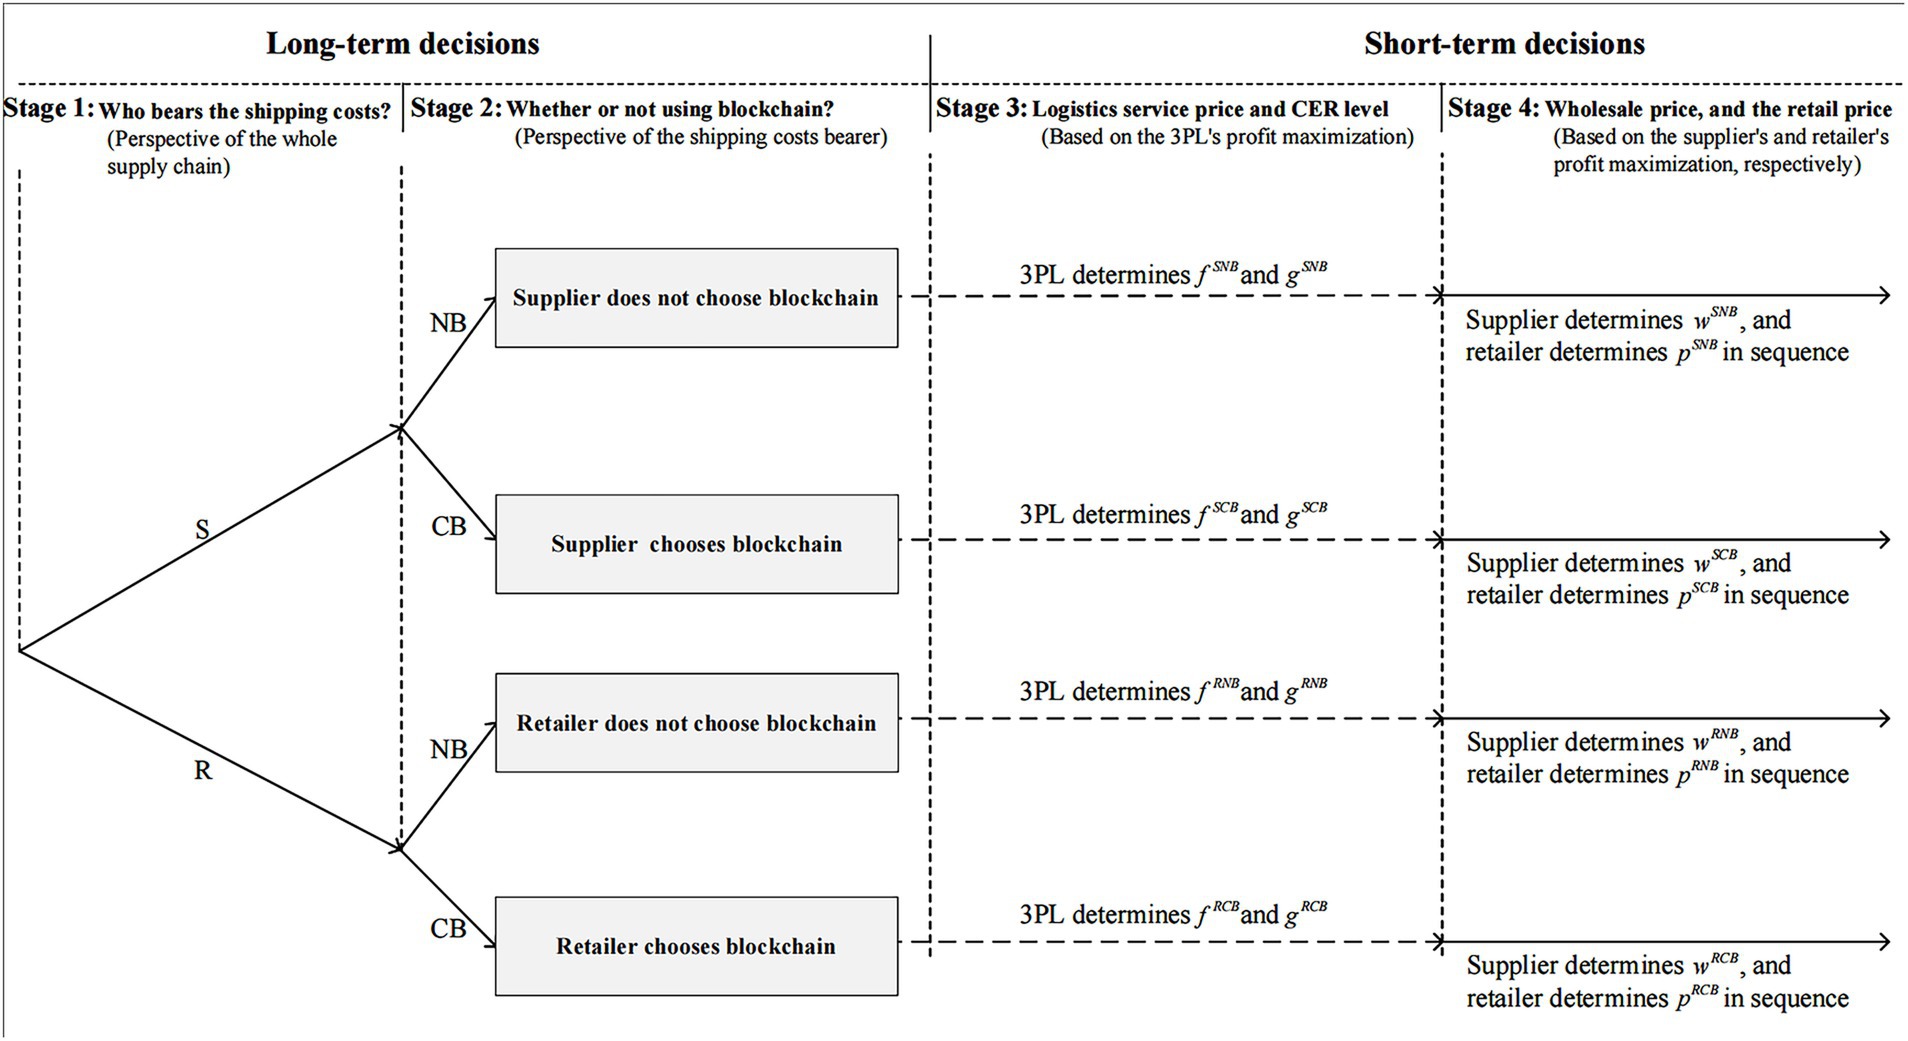
Figure 1. Model framework and decision sequence.
In this model, the supplier bears the shipping costs for fresh products and opts not to invest in blockchain technology. As a result, any losses incurred due to product deterioration during transportation will be borne by the supplier. Consequently, the profits for the 3PL, the supplier, and the retailer are shown in Equations (1–3):
The profit of the 3PL consists of two parts: the first part is the profit from cold chain services, and the second part is the investment cost for carbon reduction. The supplier’s profit consists of two parts: the first part is the actual profit from selling the fresh products, and the second part is the production cost and shipping costs of the deteriorated fresh products.
Lemma 1. Equilibrium outcomes under the SNB model can be expressed as follows: The optimal logistics service price for the 3PL is , and the optimal carbon reduction level is . The supplier’s optimal unit wholesale price is , and the retailer’s optimal unit retail price is .
Note: The superscript * denotes the equilibrium solution, and the equilibrium profits of the supply chain members are provided in Table 3 of the Supplementary Material. For the proof of Lemma 1, please refer to the Supplementary Material.
Corollary 1. In the SNB model, the consumer’s low-carbon preference and the R&D cost coefficient of CER have a certain impact on the carbon reduction level of the 3PL, and the deterioration rate of fresh products has a certain impact on the unit logistics service price.
(1) ;
(2) .
According to Corollary 1, in the SNB model, the consumer’s low-carbon preference and the R&D cost coefficient of CER have a certain impact on the carbon reduction level of the 3PL, while the deterioration rate of fresh products has a certain impact on the logistics service price. When the consumer’s acceptance of non-blockchain products exceeds a certain threshold , the 3PL’s carbon reduction level increases with the consumer’s low-carbon preference. This may be because when consumers have a high acceptance of non-blockchain products, the pressure on the company to reduce carbon emissions is lower, and as the low-carbon preference increases, the company can more easily increase its carbon reduction investments to enhance the carbon reduction level. On the other hand, when the consumer’s low-carbon preference increases, the 3PL’s carbon reduction level may decrease. This is likely due to the fact that an increase in low-carbon preference requires the company to invest more in carbon reduction, but when consumer acceptance of non-blockchain products is low, the company faces higher cost pressures and tends to reduce carbon reduction investments to maintain competitiveness and profitability.
When the consumer’s acceptance of non-blockchain products exceeds a certain threshold , the carbon reduction level of the 3PL decreases as the R&D cost coefficient for carbon reduction increases. This may occur because, when consumers have higher acceptance of non-blockchain products, the market pressure on businesses is smaller. Consequently, their motivation for carbon reduction becomes more dependent on the controllability of R&D costs. If supply chain costs are low or the impact of product deterioration is minimal, an increase in R&D costs may suppress the incentive for carbon reduction. While low-carbon preferences promote carbon reduction, as R&D costs rise, companies may reduce their investments due to cost pressures, thus limiting the improvement in carbon reduction levels. The reverse is also true.
The deterioration rate of fresh products has an impact on the unit logistics service price. When the consumer’s low-carbon preference exceeds the threshold , the unit logistics service price increases with the rise in the deterioration rate of fresh products. This is because, with a stronger low-carbon preference from consumers, the demand for low-carbon cold chain services increases significantly. Even if the deterioration rate of fresh products increases, the 3PL can still raise the logistics price to meet the needs of retailers. Conversely, the opposite also holds true.
In this model, the supplier bears the shipping costs for fresh products, and the supplier chooses to invest in blockchain technology. In this case, the losses due to the deterioration of fresh products will be borne by the 3PL. Consequently, the profits for the 3PL, the supplier, and the retailer are shown in Equations (4–6):
The profit of the 3PL consists of three parts: the first part is the profit from cold chain services, the second part is the compensation paid to the supplier for the revenue that would have been earned and the transportation cost of the deteriorated fresh products, and the third part is the investment cost for carbon reduction. The profit of the supplier consists of two parts: the first part is the expected profit from the sale of fresh products, and the second part is the construction and operating costs of adopting blockchain technology.
Lemma 2. Equilibrium outcomes under the SCB model can be expressed as follows: The optimal logistics service price of the 3PL is , the optimal carbon reduction level is . The optimal wholesale price of the supplier is , and the optimal retail price of the retailer is .
Corollary 2. Under the SCB model, the consumer’s low-carbon preference and the R&D cost coefficient for carbon reduction technology have a certain impact on the carbon reduction level of the 3PL. We set the and to satisfy the constraint conditions.
The impact of the consumer’s low-carbon preference on the carbon reduction level of the 3PL is as shown in Corollary 2. The underlying intuition is presented as follows. In the first scenario, as the consumer’s low-carbon preference increases, the carbon reduction level of the 3PL also increases. This may be because, under the SCB model, blockchain enhances the transparency and traceability of the supply chain, reducing the loss of fresh products. As consumers’ low-carbon preferences increase, blockchain technology boosts consumer acceptance of low-carbon products, prompting the 3PL to improve their carbon reduction levels and optimize supply chain efficiency. In the second scenario, as consumers’ low-carbon preferences increase, the carbon reduction level of the 3PL decreases. This could be because after adopting blockchain technology, the transparency and traceability of the supply chain improve, which to some extent reduces the risks and costs associated with product loss. As a result, the 3PL may reduce their reliance on additional carbon reduction measures. Moreover, after weighing the benefits and costs, the 3PL may decrease their investment in carbon reduction efforts.
The effect of the R&D cost coefficient of CER on the carbon reduction level of the 3PL is shown in Corollary 2, with the underlying intuition explained as follows. In the first scenario, as the R&D cost coefficient of CER increases, the carbon reduction level of the 3PL decreases. This may be because the increase in the R&D cost coefficient of CER raises the marginal cost of technology, thereby reducing the input–output ratio for carbon reduction. Although blockchain technology can mitigate the loss issue, higher R&D costs weaken the 3PL’s incentive to increase its carbon reduction level. As a result, the company tends to reduce its investment in carbon reduction to optimize profits, balancing costs and benefits. In the second scenario, as the R&D cost coefficient of CER increases, the carbon reduction level of the 3PL increases. This may be because, although the R&D costs for carbon reduction technology rise, the benefits in terms of reducing fresh product losses and enhancing supply chain efficiency also significantly increase. Therefore, the 3PL will weigh the investment and benefits, choosing to further enhance carbon reduction levels to reduce the potential losses from spoilage and improve competitiveness.
In a practical operation case within the fresh product supply chain, JD Fresh (as a fresh e-commerce platform and retailer) closely collaborates with Dalian Bingfeng Cold Chain Logistics Co., Ltd. (a well-known third-party cold chain logistics service provider) and upstream fresh product suppliers. JD Fresh purchases a variety of fresh products, including seafood, meat, and vegetables, from various suppliers. To maintain the freshness and quality of these products, Dalian Bingfeng Cold Chain Logistics Co., Ltd. is selected as the partner responsible for transporting the fresh products from the suppliers through professional cold chain logistics to JD Fresh’s warehouses or directly to the delivery points designated in online orders. In this collaboration model, JD Fresh chooses to bear the shipping costs incurred by the 3PL service as part of its strategy to enhance customer satisfaction and maintain high product quality. This strategy not only ensures that fresh products are delivered quickly and safely to consumers, but also further strengthens JD Fresh’s competitiveness in the fresh e-commerce sector, providing consumers with a more convenient and reliable fresh shopping experience. Similar assumptions can be found in existing related studies (Zhang X. et al., 2023).
In this model, the retailer bears the shipping costs for fresh products and chooses not to invest in blockchain technology. As a result, the losses due to the deterioration of fresh products will be incurred by the retailer. Consequently, the profits for the 3PL, the supplier, and the retailer are shown in Equations (7–9):
The 3PL’s profit consists of two parts: the first part is the profit from cold chain services, and the second part is the investment cost for carbon reduction. The retailer’s profit consists of two parts: the first part is the actual profit from selling the fresh products, and the second part is the cost of purchasing the deteriorated fresh products along with the shipping costs.
Lemma 3. The equilibrium outcomes under the RNB model can be expressed as follows: The optimal logistics service price for the 3PL is , and the optimal carbon reduction level is . The optimal unit wholesale price for the supplier is , and the optimal unit retail price for the retailer is .
Corollary 3. Under the RNB model, the consumer’s low-carbon preference and the R&D cost coefficient for carbon reduction technology have a certain impact on the carbon reduction level of the 3PL. The deterioration rate of fresh products has a certain effect on the unit retail price.
(1) ;
(2) .
In the RNB model, the influence of the consumer’s low-carbon preference and the R&D cost coefficient for carbon reduction technology on the carbon reduction level of the 3PL is similar to that in the SNB model.
The deterioration rate of fresh products affects the unit retail price. The combined effect of the consumer’s low-carbon preference and carbon reduction R&D costs plays a crucial role in adjusting the unit retail price. When consumers’ low-carbon preferences are either low or high, as the deterioration rate of fresh products increases, the unit retail price also increases. This may be because, when consumers have a low low-carbon preference, the retailer can adjust prices to meet demand and ensure profitability in response to the increased deterioration rate. On the other hand, when consumer demand for low-carbon products is stronger, the retailer can raise the retail price to offset the increased costs resulting from the higher deterioration rate. However, when consumers’ low-carbon preference is moderate, as the deterioration rate increases, the unit retail price tends to decrease. This may be due to the higher deterioration rate causing a decline in product value, which in turn reduces consumer willingness to purchase. To maintain market share and attract consumers, retailers may lower the price to compensate for consumers’ expectations of lower quality. Especially when consumers’ low-carbon preferences are moderate and price sensitivity is higher, retailers are likely to reduce the retail price to remain competitive.
In this model, the retailer bears the shipping costs for fresh products and opts to invest in blockchain technology. As a result, the losses caused by the deterioration of fresh products will be incurred by the 3PL. Consequently, the profits for the 3PL, the supplier, and the retailer are shown in Equations (10–12):
The 3PL’s profit is composed of three parts: the profit from providing cold chain services, the compensation paid to the retailer for the losses associated with deteriorated products and their shipping costs, and the costs associated with carbon reduction investments. The retailer’s profit comes from two sources: the expected profit from selling fresh products and the construction and operational costs incurred from implementing blockchain technology.
Lemma 4. The equilibrium outcomes under the RCB model can be expressed as follows: The optimal transportation price for the 3PL is and the optimal carbon reduction level is . The optimal unit wholesale price for the supplier is , and the optimal unit retail price for the retailer is .
Corollary 4. Under the RCB model, the consumer’s low-carbon preference and the R&D cost coefficient of CER have an impact on the 3PL’s carbon reduction level. We specify and to satisfy the constraint conditions.
Under the RCB model, the impact of the consumer’s low-carbon preference on the carbon reduction level of the 3PL is as shown in Corollary 4. The underlying intuition is presented as follows. In the typical scenario, as the consumer’s low-carbon preference increases, the carbon reduction level of the 3PL also increases. This is because, under this model, blockchain technology makes logistics companies bear more of the transportation loss risk, thus they pay more attention to the consumer’s low-carbon preference. As the low-carbon preference increases, consumer recognition of carbon reduction improves, enhancing the market attractiveness and competitiveness of low-carbon logistics services, prompting logistics companies to invest more in carbon reduction to meet demand and increase profits. However, in another scenario, as the consumer’s low-carbon preference increases, the 3PL’s carbon reduction level decreases. This may be because, under these conditions, despite the increase in consumer low-carbon preference, the 3PL, facing higher deterioration rates and larger costs (such as production and blockchain costs), chooses to reduce carbon reduction investment to maximize profits, as they are unable to effectively cover costs. Therefore, although low-carbon preference boosts demand, the 3PL reduces carbon reduction levels due to cost pressures.
Conversely, under the RCB model, the effect of the R&D cost coefficient of CER on the carbon reduction level of the 3PL is shown in Corollary 4, with the underlying intuition explained as follows. In the typical scenario, as the R&D cost coefficient of CER increases, the carbon reduction level of the 3PL decreases. This may be due to the diminishing marginal returns from increasing R&D costs, leading logistics companies to reduce carbon reduction investment under high costs. Although low-carbon preference increases consumer demand, high R&D and operational cost pressures make logistics companies choose to reduce carbon reduction efforts to maintain profits. In another scenario, as the R&D cost coefficient of CER increases, the 3PL’s carbon reduction level increases. This may be because the cost structure faced by logistics companies makes increasing carbon reduction R&D investment significantly enhance the benefits of carbon reduction. The cost savings and efficiency improvements brought about by carbon reduction become more pronounced, especially in the transportation of fresh products, where the need to reduce deterioration and losses is more urgent. Therefore, in this situation, the 3PL chooses to increase carbon reduction investment to improve overall efficiency and reduce transportation losses.
Based on the equilibrium results and sensitivity analysis above, this section compares the profits and carbon reduction level of 3PL, supplier’s profits, retailer’s profits, and the profits of overall supply chain in different models. Due to the complexity of the model, some of the property analysis and comparison results are intricate. Therefore, in addition to theoretical analysis, numerical simulations are also introduced for intuitive demonstration. Drawing from the relevant introduction of De Xun Logistics Company8 and literature (Zhu et al., 2024; Yu et al., 2020), the model parameters are set as follows: , , , , , . varies from , varies from , varies from .
In this subsection, we explore the effects of the R&D cost coefficient of CER , the deterioration rate of fresh products , and consumer low-carbon preference on the profits of the 3PL under different models. The following proposition summarize our findings, as illustrated in Figure 2, with proofs provided in the Supplementary Material.
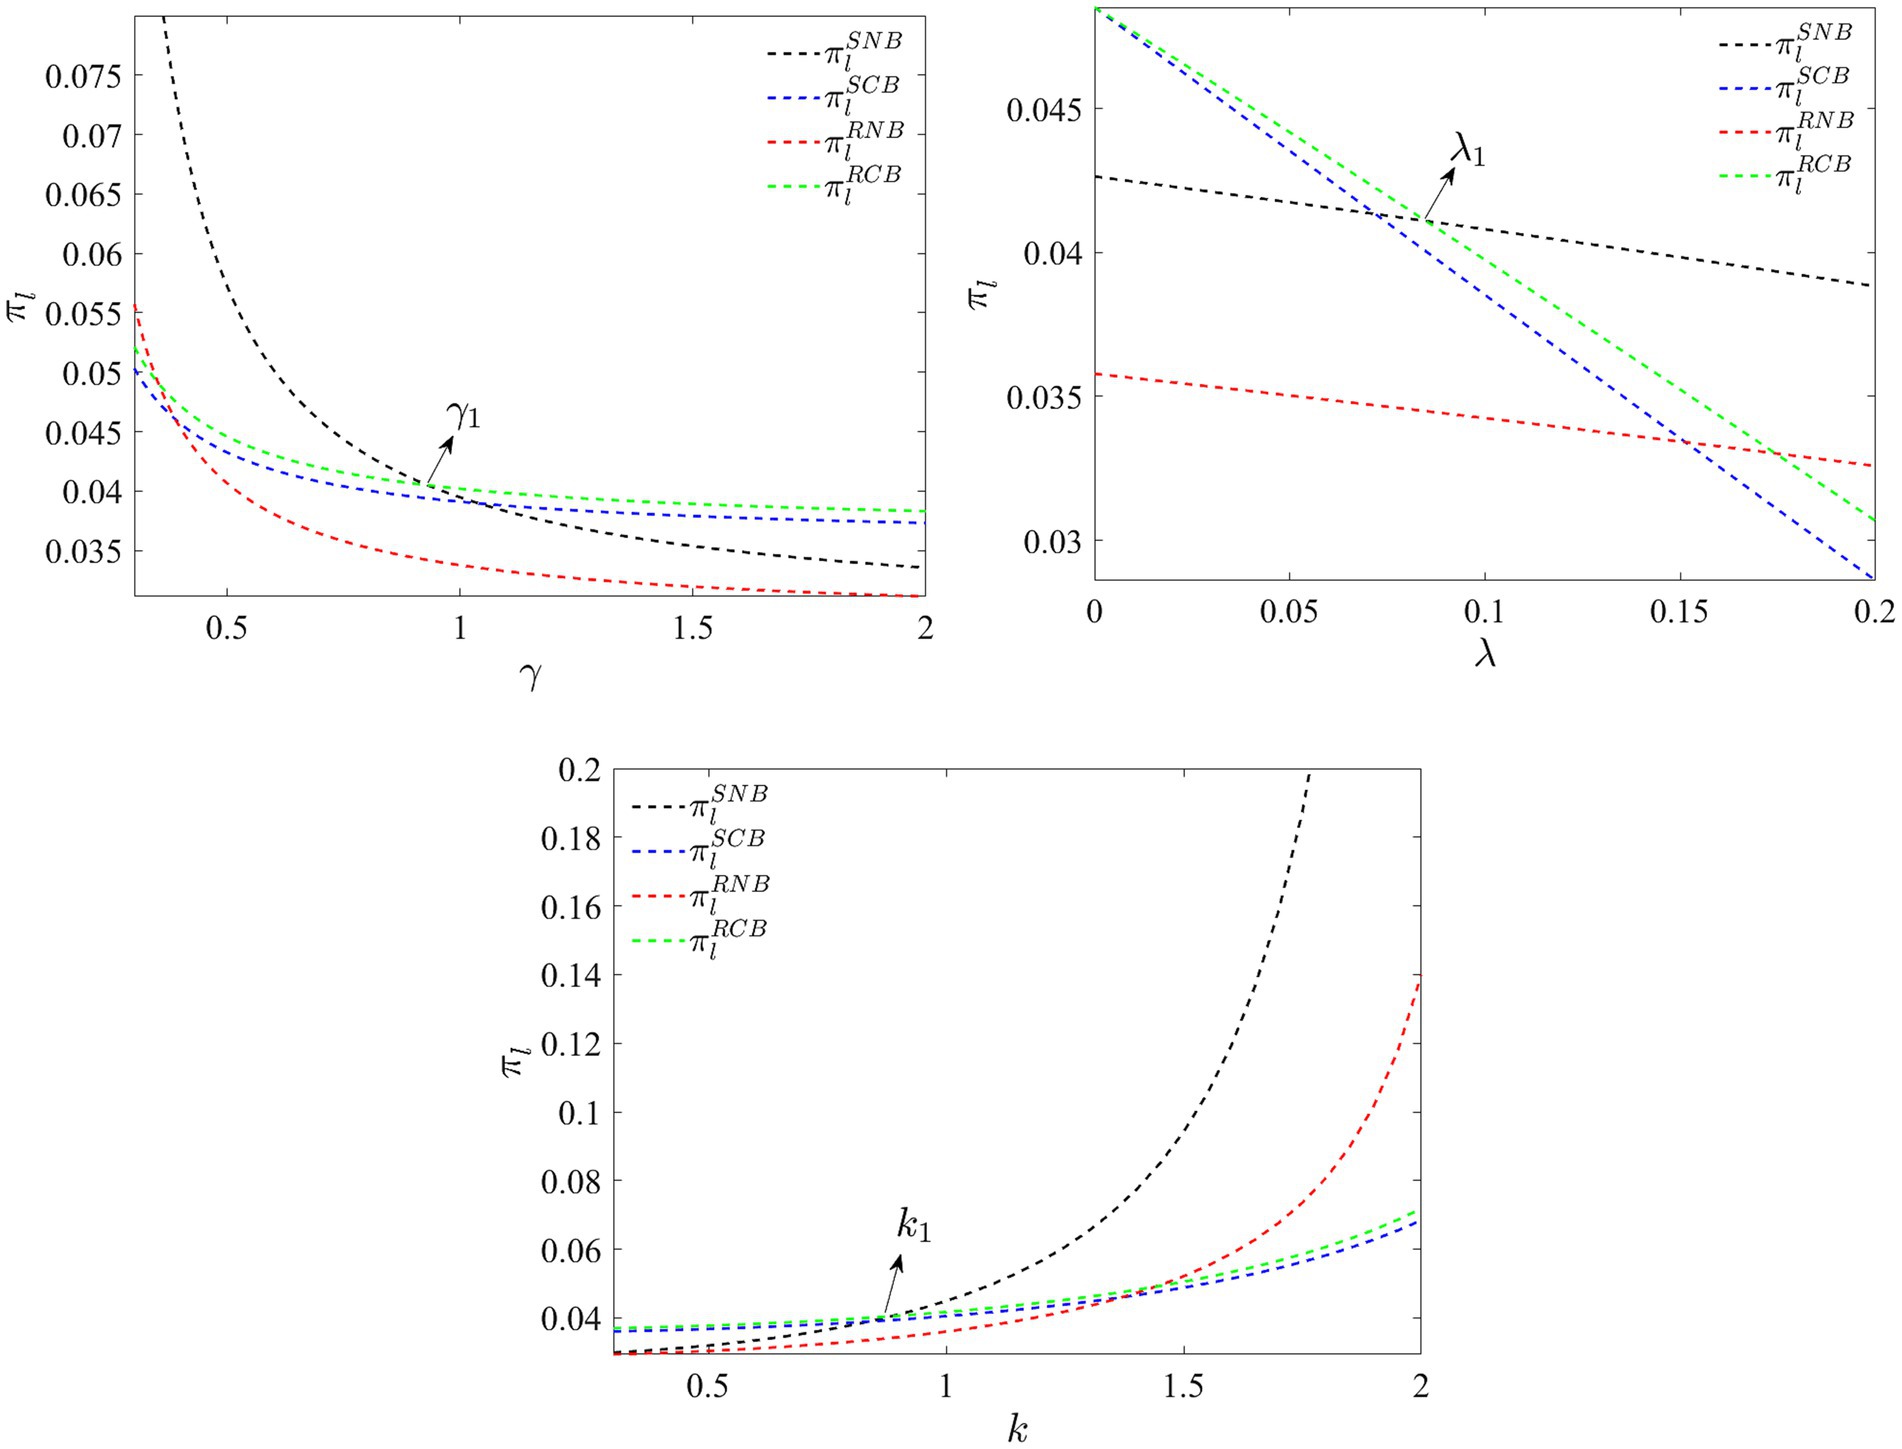
Figure 2. The trends of third-party logistics company's profits under different models.
Proposition 1. The change trend and comparison of profits for the 3PL with the factors vary are as follows:
(1) When , ; when , ;
(2) When , ; when , ;
(3) When , ; when , .
Proposition 1 reveals that both the R&D cost coefficient for carbon reduction and the deterioration rate of fresh products negatively impact the profits of the 3PL, while consumer low-carbon preference has a positive effect on their profits. In scenarios where the R&D cost coefficient for carbon reduction is relatively high, the deterioration rate of fresh products is low, or consumer low-carbon preference is low, the 3PL achieves higher profits under the RCB model. This is because, although the adoption of blockchain technology in the supply chain requires the 3PL to bear certain indirect technology investment costs initially, the higher freight revenue is sufficient to offset these losses. More importantly, under the RCB model, the fresh product losses that the 3PL has to bear for retailers are much lower than the losses they must bear for suppliers in the SCB model, further improving their overall profits.
Conversely, when the R&D cost coefficient for carbon reduction is relatively low, the deterioration rate of fresh products is high, or consumer low-carbon preference is high, the 3PL can achieve greater profits under the SNB model. In this case, although the non-adoption of blockchain technology in the supply chain results in lower freight revenue, it avoids the significant profit compression caused by indirect blockchain losses. Additionally, compared to the RNB model, the total demand in the SNB model is higher to meet the needs of retailers, which further enhances the overall revenue of the 3PL.
In this subsection, we compare and analyze the carbon reduction levels of the 3PL under different shipping costs bearers in the fresh product supply chain, considering the joint impact of the R&D cost coefficient for carbon reduction and consumer low-carbon preference . The following proposition summarizes our research findings, and Figure 3 provides an intuitive illustration, with proof provided in the Supplementary Material.
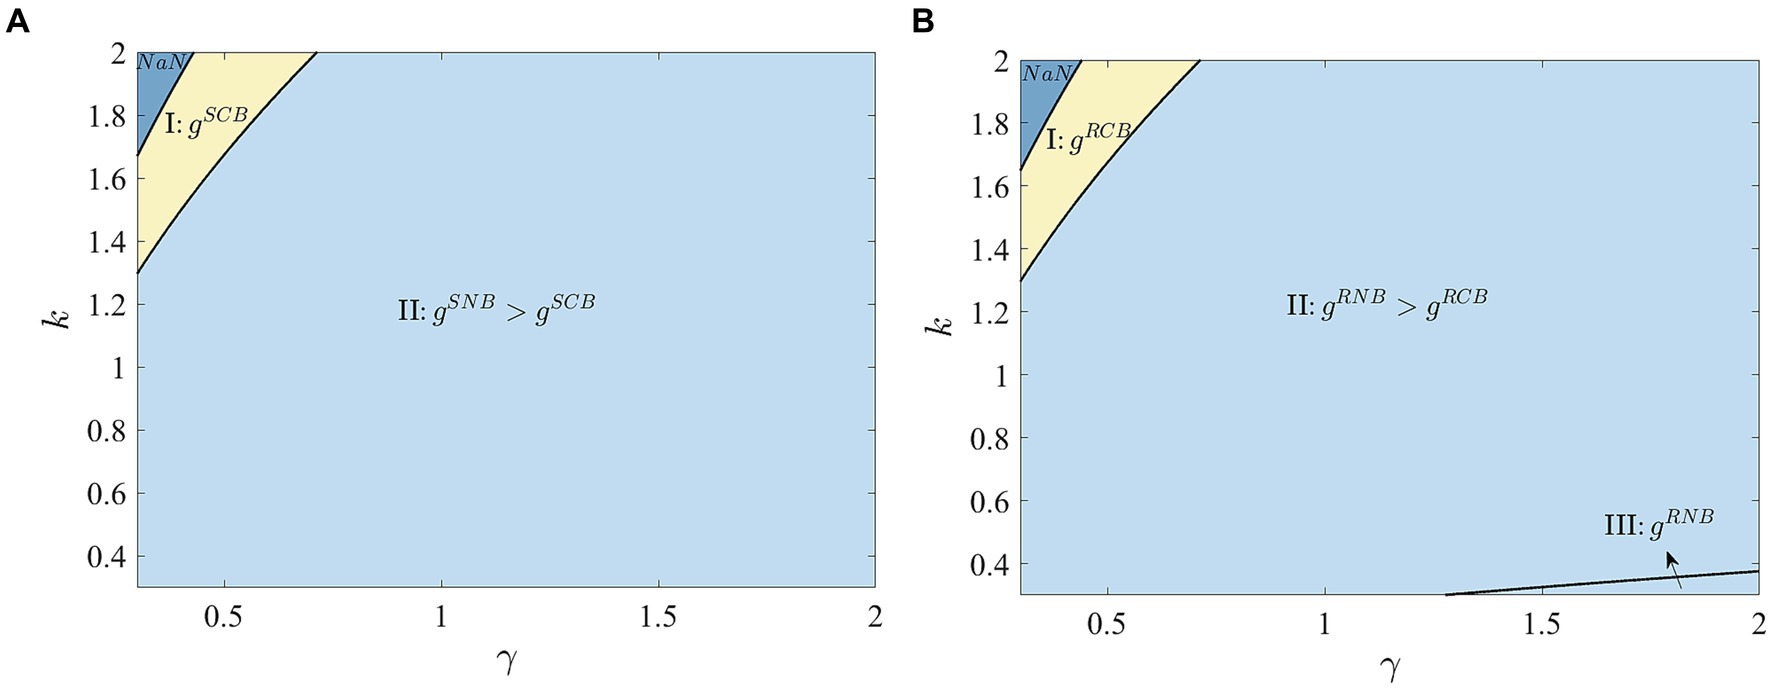
Figure 3. Third-party logistics company's carbon reduction level with or without blockchain adoption. (A) Supplier bears shipping costs. (B) Retailer bears shipping costs.
Proposition 2. The effect of whether the shipping costs bearer adopts blockchain technology on the 3PL’s carbon reduction level varies across different shipping costs bearing scenarios. The specific impacts are as follows:
(1) If the supplier bears the shipping costs: when and , ; when and , .
(2) If the retailer bears the shipping costs: when and , ; when and , ; when and , .
Proposition 2 highlights the findings in Region I: When consumers have a high preference for low-carbon products and the R&D cost coefficient for carbon reduction is low, the carbon emission reduction level of third-party cold chain logistics companies is higher when blockchain technology is adopted, regardless of who bears the shipping costs. This is because blockchain’s transparency enables the recording and transmission of carbon reduction information, which helps meet consumer trust demands for low-carbon products. Additionally, lower R&D costs allow the 3PL to achieve significant carbon emission reductions with minimal investment, and blockchain further enhances these economic benefits.
In Region II, it is shown that when both SNB and SCB models are available, ; and when both RNB and RCB models are present, . This indicates that when blockchain is not adopted, the carbon emission reduction level of the 3PL is higher. The reason is that an increase in the R&D cost coefficient for carbon reduction raises the carbon reduction costs for 3PLs. In this case, adopting blockchain adds to the economic burden, causing 3PLs to prefer not using blockchain and instead focus on using limited resources to improve carbon reduction levels.
In this subsection, we discuss the impact of consumer low-carbon preference and the R&D cost coefficient of CER on the overall supply chain profit under different shipping costs-bearing scenarios, both with and without the adoption of blockchain technology. The following proposition summarizes our research findings, and Figure 4 provides an intuitive illustration, with proof provided in the Supplementary Material.
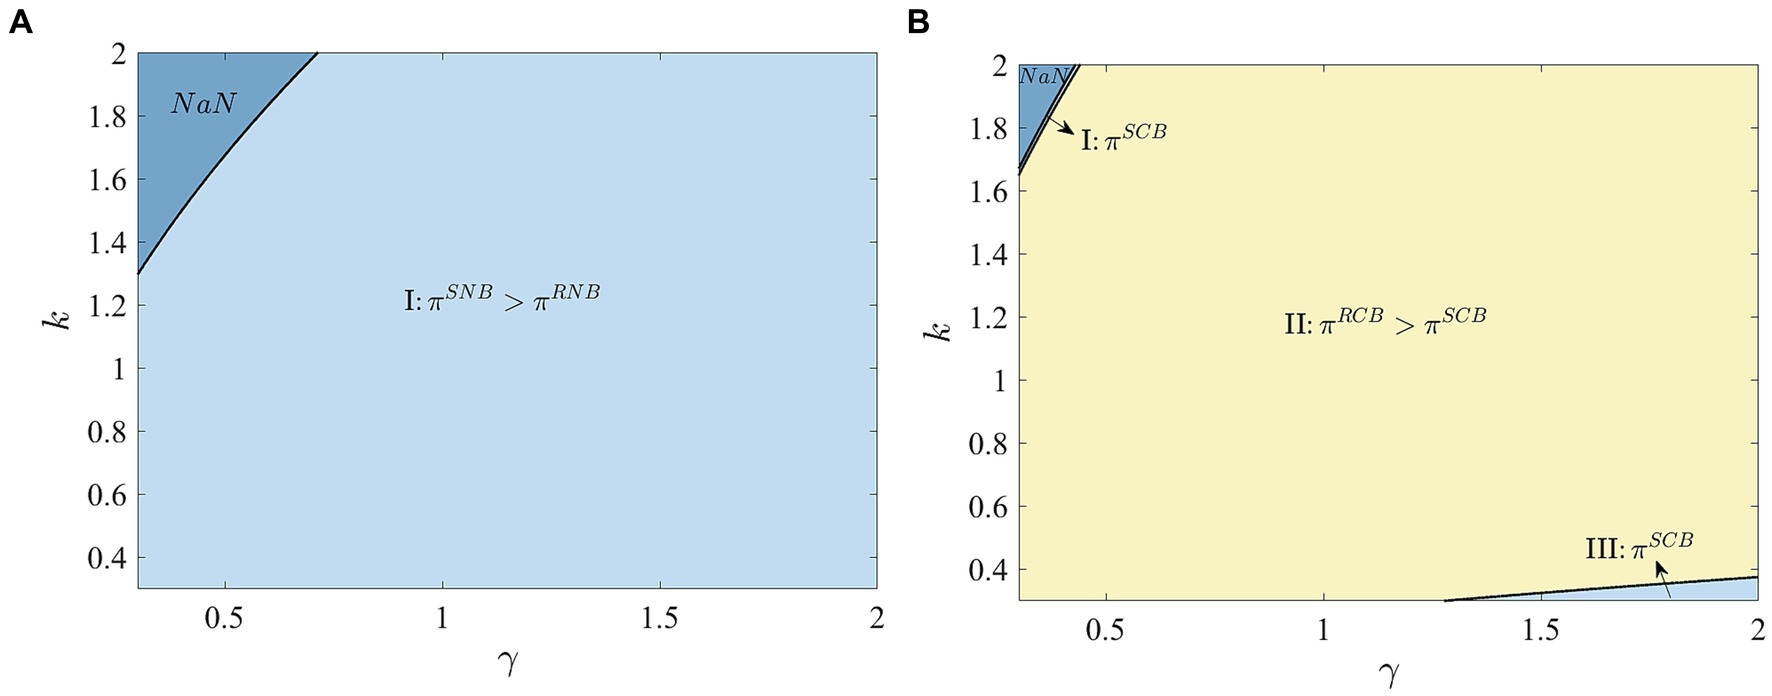
Figure 4. Supply chain's total profits under different shipping costs bearers. (A) Without adopting blockchain technology. (B) With adopting blockchain technology.
Proposition 3. By comparing the total supply chain profits, we present the analysis of whether the supplier or retailer should bear the shipping costs:
(1) If the shipping costs bearer does not adopt blockchain technology, when , .
(2) If the shipping costs bearer adopts blockchain technology, when and , ; when and or and , .
Figure 4A reveals that when blockchain is not adopted and both SNB and RNB exist, having the supplier bear the shipping costs results in the highest total supply chain profit. This is because, under these conditions, the only difference in the supply chain is the wholesale price, while all other factors remain the same. In the SNB model, transportation costs and the deterioration of fresh products have a significant impact on the wholesale price. A higher wholesale price may reflect the true cost of the product, including transportation costs. This pricing strategy helps ensure that the supplier can cover its costs and make a profit, while also providing the retailer with a reasonable profit margin. Furthermore, when the supplier bears the shipping costs, the coordination within the supply chain improves, as the supplier can adjust the wholesale price to incentivize the retailer, thereby enhancing overall supply chain efficiency. In contrast, in the RNB model, when the retailer bears the shipping costs, the retailer assumes the transportation expenses, and the supplier’s wholesale price reflects relatively lower transportation costs (due to the absence of additional shipping charges), thus resulting in a lower wholesale price. A lower wholesale price might mean that the retailer needs to add extra shipping costs to the retail price, which could affect its profit margin and the overall supply chain profit. Therefore, when blockchain is not adopted, having the supplier bear the shipping costs results in the highest total supply chain profit.
Figure 4B shows that when blockchain is adopted and both SCB and RCB exist, having the retailer bear the shipping costs results in the highest total supply chain profit. This is because the retailer bearing the shipping costs (RCB model) better incentivizes the retailer to invest in the supply chain, especially through the increased transparency of logistics enabled by blockchain technology. In this case, with reduced pressure on the supplier, the pricing becomes more competitive, which helps drive overall supply chain efficiency. In contrast, in the SCB model, when the supplier bears the shipping costs, the supplier’s costs become too high, which weakens the distribution of overall supply chain profits. Therefore, when blockchain is adopted, having the retailer bear the shipping costs results in the highest total supply chain profit.
In this subsection, we will discuss the impact of adopting blockchain technology on the profits of the supplier and the retailer, given the shipping costs bearers. The following Proposition 4 and Proposition 5 summarize our research findings, and Figures 5, 6 provide an intuitive illustration, with proof provided in the Supplementary Material.
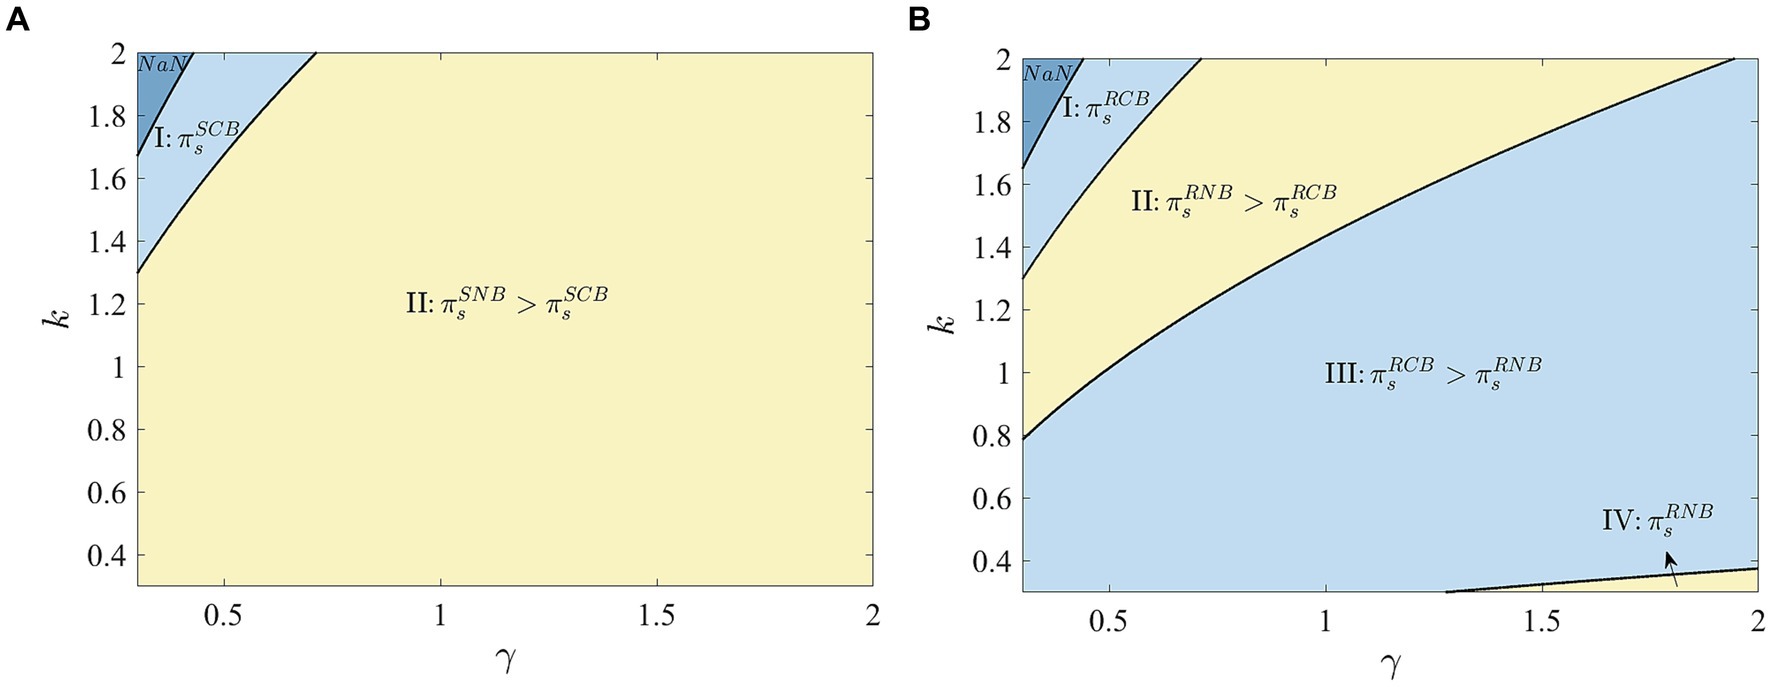
Figure 5. Comparison of supplier's profits with and without blockchain technology. (A) Supplier bears shipping costs. (B) Retailer bears shipping costs.
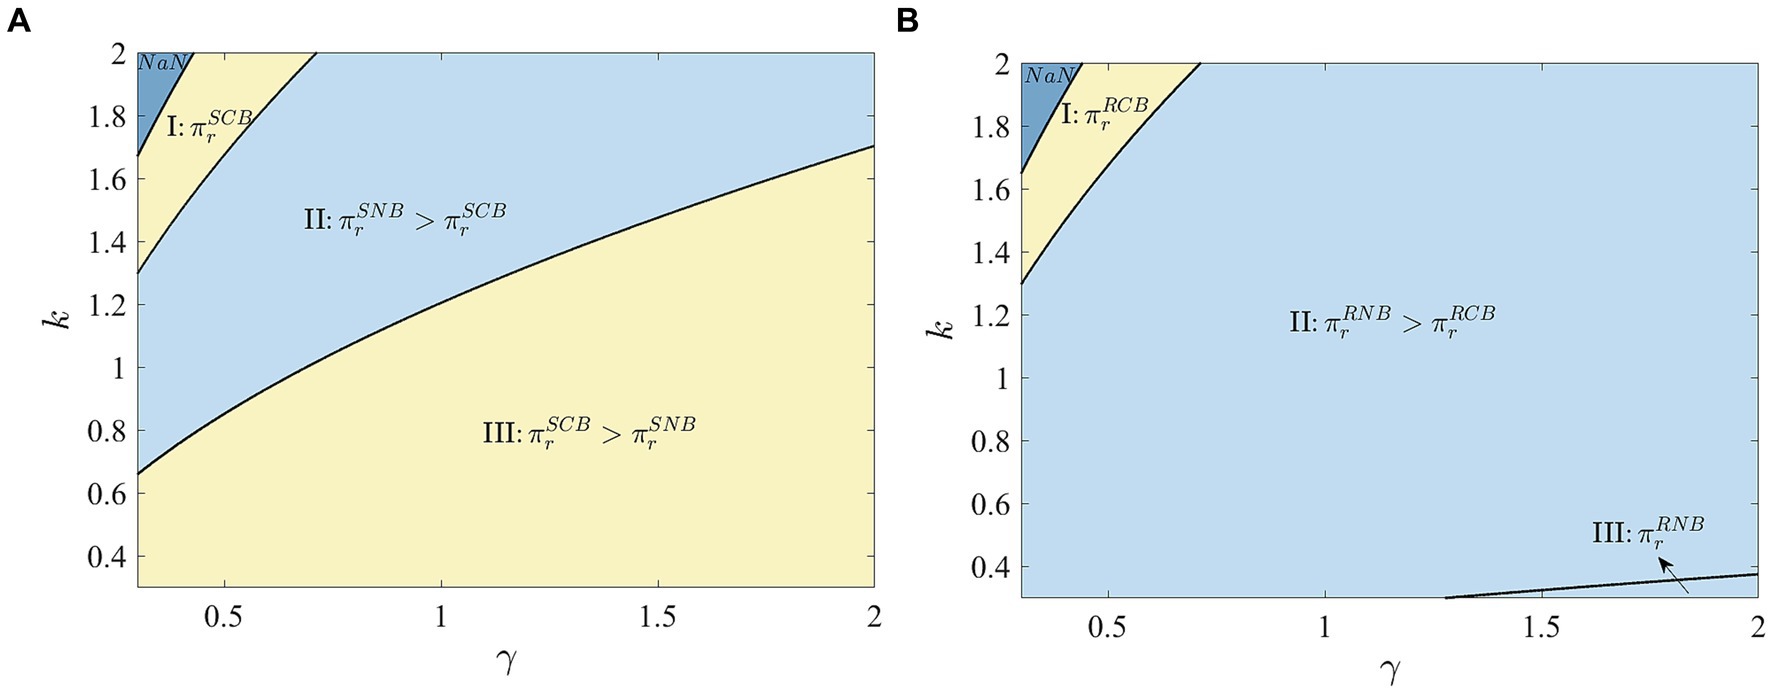
Figure 6. Comparison of retailer's profits with and without blockchain technology. (A) Supplier bears shipping costs. (B) Retailer bears shipping costs.
Proposition 4. The impact of whether the shipping costs bearer adopts blockchain technology on the supplier’s profit is as follows. This impact varies under different shipping costs bearer scenarios.
(1) If the supplier bears the shipping costs, when and , ; when and , .
(2) If the retailer bears the shipping costs, when and , ; when and , ; when and , ; when and , .
(3) Whether the bearer should adopt blockchain technology across different scenarios, when and , ; when and , .
Figure 5 shows that in Region I, where the R&D cost coefficient of CER is low and consumer low-carbon preference is high ( and ), adopting blockchain technology will maximize the supplier’s profit, regardless of who bears the shipping costs. In Region II, where consumer low-carbon preference is moderate ( and ), the supplier is more likely to avoid adopting blockchain technology, regardless of who bears the shipping costs. This is because, without blockchain, the supplier does not have to bear the costs associated with the technology. However, adopting blockchain requires the supplier to incur the costs of R&D and implementation. Despite the potential benefits of blockchain, the high technological investment reduces the supplier’s profit.
Proposition 5. The impact of whether the shipping costs bearer adopts blockchain technology on the retailer’s profit is as follows. This impact varies under different shipping costs bearer scenarios.
(1) If the supplier bears the shipping costs: when and , ; when , ; when and , .
(2) If the retailer bears the shipping costs: when and , ; when and , ; when and , .
(3) Whether the bearer should adopt blockchain technology across different scenarios: when and , ; when and , ; when and , , ; when and , , .
Figure 6 illustrates that in Region I, when the R&D cost coefficient of CER is low and the consumer’s low-carbon preference is high ( and ), the retailer is more likely to adopt blockchain technology, regardless of who bears the shipping costs. Furthermore, Region III in (a) indicates that when the consumer’s low-carbon preference is low, the retailer prioritizes adopting blockchain. This is because blockchain can enhance the transparency and credibility of carbon emission data, helping retailers showcase their environmental efforts, meet market demand for low-carbon products, and also boost the retailer’s sales. Region II reveals that when the consumer’s low-carbon preference is moderate ( and ), the retailer tends to avoid adopting blockchain, regardless of who bears the shipping costs. This is because, although blockchain technology enhances product transparency and low-carbon attributes, the consumer’s willingness to pay a premium for low-carbon products is relatively low. As a result, the increase in revenue from blockchain is limited. Additionally, the operational costs of blockchain (such as ) significantly increase the overall supply chain costs, indirectly compressing the retailer’s profits. When blockchain is not adopted, the retailer does not bear these indirect costs, making the pricing more competitive and resulting in higher profits.
Combining Proposition 4, there exists a specific range in which, regardless of who bears the shipping costs, both the supplier’s and retailer’s profits are maximized without adopting blockchain technology. However, when the consumer’s low-carbon preference is high and the R&D cost coefficient of CER is low, the supply chain will adopt blockchain technology, regardless of who bears the shipping costs.
With economic development and improvements in logistics, the demand for fresh products has rapidly increased, especially with the convenience provided by fresh e-commerce platforms and fresh supermarkets. Fresh products are characterized by a certain deterioration rate, and the fresh supply chain typically relies on third-party cold chain logistics companies for transportation, ensuring both the freshness of the products and carbon reduction levels. This study constructs a fresh supply chain composed of supplier, retailer, and third-party cold chain logistics company, where shipping costs are borne by either the supplier or the retailer. The shipping costs bearer considers whether to adopt blockchain technology to enhance the transparency of fresh logistics and improve consumers’ perceived value. Four scenarios are established: Supplier bears shipping costs and does not choose blockchain (SNB), Supplier bears shipping costs and chooses blockchain (SCB), Retailer bears shipping costs and does not choose blockchain (RNB), and Retailer bears shipping costs and chooses blockchain (RCB). Using game theory, the study explores the 3PL’s profits and carbon reduction level under different scenarios, clarifying who should bear the shipping costs (supplier or retailer) and discussing the shipping costs bear’s blockchain adoption strategy.
The main findings of this study are as follows. First, the 3PL’s profit is negatively correlated with the R&D cost coefficient of CER and the deterioration rate of fresh products, while it is positively correlated with consumer low-carbon preferences. When the R&D cost coefficient of CER is high, or the deterioration rate of fresh products is low, or consumer low-carbon preferences are low, the 3PL achieves the highest profit under the RCB model due to high shipping revenue. Conversely, the 3PL achieves the highest profit under the SNB model, where the blockchain-induced compensation losses for fresh product deterioration are eliminated. Additionally, the 3PL’s carbon reduction level is higher when blockchain technology is adopted, especially with low carbon reduction R&D cost coefficient and high consumer low-carbon preferences. In contrast, when blockchain technology is not adopted, the savings from the compensation for fresh product deterioration can be used for further carbon reduction, achieving a higher carbon reduction level. Second, regarding who should bear the shipping costs, when blockchain technology is not adopted, it is optimal for the supplier to bear the shipping costs, maximizing the overall profit of the supply chain. In contrast, when blockchain technology is adopted, having the retailer bear the shipping costs maximizes the overall profit of the supply chain. Specifically, when the R&D cost coefficient of CER is high, regardless of blockchain adoption, the supplier bearing the shipping costs maximizes the overall profit of the supply chain. Finally, concerning whether the bearer should invest in blockchain technology, when the R&D cost coefficient of CER is low and consumer low-carbon preferences are high, adopting blockchain technology leads to Pareto optimal profits for both the supplier and the retailer, regardless of who bears the shipping costs.
Based on the results of this study, the following management insights are proposed. Supply chain companies should flexibly choose the shipping costs-bearing model and blockchain technology application according to the market environment and consumer low-carbon preferences, in order to balance benefits and costs. Efforts should be made to raise consumer awareness of low-carbon practices through education, stimulating market demand. Strengthening upstream and downstream collaboration, through joint R&D and policy support, can help reduce carbon reduction costs. The strategic positioning of 3PLs should be optimized to respond flexibly to changes in carbon reduction R&D costs and the deterioration rate of fresh products. Additionally, a detailed cost–benefit analysis system should be established, and supply chain models should be adjusted based on regional characteristics and market demand to achieve the dual goals of low-carbon environmental protection and efficient operations.
This study has some limitations and provides interesting directions for future research. First, the study assumes a simplified supply chain model and does not consider other potential external factors, such as policy changes, market competition, etc., which may influence the decision-making of stakeholders. Therefore, future research could further extend the model by incorporating more external variables and real-world situations to more comprehensively analyze decision-making behaviors in the supply chain. Additionally, future studies could explore how emerging technologies such as artificial intelligence and big data can be integrated with blockchain and carbon reduction measures to enhance the intelligence level and carbon reduction efficiency of supply chains.
The original contributions presented in the study are included in the article/Supplementary material, further inquiries can be directed to the corresponding author.
WZ: Conceptualization, Funding acquisition, Methodology, Supervision, Validation, Writing – review & editing. LW: Formal analysis, Investigation, Software, Visualization, Writing – original draft, Writing – review & editing. LJ: Formal analysis, Methodology, Supervision, Writing – review & editing.
The author(s) declare that financial support was received for the research, authorship, and/or publication of this article. This research was supported by Humanities and Social Sciences Youth Foundation of Ministry of Education of China (No. 20YJC630215).
The authors thank the editor and reviewers for their numerous constructive comments and encouragement that significantly improved our paper.
The authors declare that the research was conducted in the absence of any commercial or financial relationships that could be construed as a potential conflict of interest.
The author(s) declare that no Gen AI was used in the creation of this manuscript.
All claims expressed in this article are solely those of the authors and do not necessarily represent those of their affiliated organizations, or those of the publisher, the editors and the reviewers. Any product that may be evaluated in this article, or claim that may be made by its manufacturer, is not guaranteed or endorsed by the publisher.
The Supplementary material for this article can be found online at: https://www.frontiersin.org/articles/10.3389/fsufs.2025.1550985/full#supplementary-material
1. ^https://www.sohu.com/a/833732904_120950077
2. ^https://www.yicai.com/news/102290970.html
3. ^https://www.jdl.com/green/
4. ^https://www.zhiding.cn/dxinsight/art/24327/3156767
5. ^https://www.crypto-news-flash.com/vechain-walmart-china-join-forces-a-blockchain-traceability-dream-team/
6. ^https://www.unep.org/zh-hans/xinwenyuziyuan/xinwengao/lianheguobaogaoquanshijiemeitianlangfeideshiwuchaoguo10yican?
Awasthy, P., Haldar, T., and Ghosh, D. (2025). Blockchain enabled traceability — an analysis of pricing and traceability effort decisions in supply chains. Eur. J. Oper. Res. 321, 760–774. doi: 10.1016/j.ejor.2024.10.019
Bai, Q., Jin, M., and Xu, X. (2019). Effects of carbon emission reduction on supply chain coordination with vendor-managed deteriorating product inventory. Int. J. Prod. Econ. 208, 83–99. doi: 10.1016/j.ijpe.2018.11.008
Biswas, D., Jalali, H., Ansaripoor, A. H., and De Giovanni, P. (2023). Traceability vs. sustainability in supply chains: the implications of blockchain. Eur. J. Oper. Res. 305, 128–147. doi: 10.1016/j.ejor.2022.05.034
Blackburn, J., and Scudder, G. (2009). Supply chain strategies for perishable products: the case of fresh produce. Prod. Oper. Manag. 18, 129–137. doi: 10.1111/j.1937-5956.2009.01016.x
Cai, X., Chen, J., Xiao, Y., and Xu, X. (2010). Optimization and coordination of fresh product supply chains with freshness-keeping effort. Prod. Oper. Manag. 19, 261–278. doi: 10.1111/j.1937-5956.2009.01096.x
Cai, J., and Jiang, F. (2023). Decision models of pricing and carbon emission reduction for low-carbon supply chain under cap-and-trade regulation. Int. J. Prod. Econ. 264:108964. doi: 10.1016/j.ijpe.2023.108964
Claassen, G. D. H., Van, A., Snels, J. C. M. A., and Beek, P. (2024). Integrating time-temperature dependent deterioration in the economic order quantity model for perishable products in multi-echelon supply chains. Omega 125:103041. doi: 10.1016/j.omega.2024.103041
Dey, S.K., Kundu, K., and Das, P. (2024) ‘Digital technology based game-theoretic pricing strategies in a three-tier perishable food supply chain’, Ann. Oper. Res. doi: 10.1007/s10479-024-06021-5. [Preprint].
Ding, P., Zhao, Z., and Li, X. (2020). Government subsidies in the power battery recycling industry. Ind. Manag. Data Syst. 120, 1059–1083. doi: 10.1108/IMDS-08-2019-0450
Dong, L., Jiang, P., and Xu, F. (2023). Impact of traceability technology adoption in food supply chain networks. Manag. Sci. 69, 1518–1535. doi: 10.1287/mnsc.2022.4440
Drent, M., Moradi, P., and Arts, J. (2023). Efficient emission reduction through dynamic supply mode selection. Eur. J. Oper. Res. 311, 925–941. doi: 10.1016/j.ejor.2023.06.004
Du, S., Zhu, J., Jiao, H., and Ye, W. (2015). Game-theoretical analysis for supply chain with consumer preference to low carbon. Int. J. Prod. Res. 53, 3753–3768. doi: 10.1080/00207543.2014.988888
Fang, C., Chi, M., Fan, S., and Choi, T. M. (2024). Who should invest in blockchain technology under different pricing models in supply chains? Eur. J. Oper. Res. 319, 777–792. doi: 10.1016/j.ejor.2024.07.006
García-Muros, X., Morris, J., and Paltsev, S. (2022). Toward a just energy transition: a distributional analysis of low-carbon policies in the USA. Energy Econ. 105:105769. doi: 10.1016/j.eneco.2021.105769
Li, Q., Ma, M., Shi, T., and Zhu, C. (2022). Green investment in a sustainable supply chain: the role of blockchain and fairness. Trans. Res. Part E Log. Transp. Rev. 167:102908. doi: 10.1016/j.tre.2022.102908
Liu, G., Zhang, J., and Tang, W. (2015). Joint dynamic pricing and investment strategy for perishable foods with price-quality dependent demand. Ann. Oper. Res. 226, 397–416. doi: 10.1007/s10479-014-1671-x
Meng, Q., Li, M., Liu, W., Li, Z., and Zhang, J. (2021). Pricing policies of dual-channel green supply chain: considering government subsidies and consumers’ dual preferences. Sustain. Prod. Consump. 26, 1021–1030. doi: 10.1016/j.spc.2021.01.012
Naoum-Sawaya, J., Elhedhli, S., and De Carvalho, P. (2023). Strategic blockchain adoption to deter deceptive counterfeiters. Eur. J. Oper. Res. 311, 373–386. doi: 10.1016/j.ejor.2023.04.031
Niu, B., Ruan, Y., and Xu, H. (2023). Turn a blind eye? E-tailer’s blockchain participation considering upstream competition between copycats and brands. Int. J. Prod. Econ. 265:109009. doi: 10.1016/j.ijpe.2023.109009
Niu, B., Shen, Z., and Xie, F. (2021). The value of blockchain and agricultural supply chain parties’ participation confronting random bacteria pollution. J. Clean. Prod. 319:128579. doi: 10.1016/j.jclepro.2021.128579
Tiwari, S., Daryanto, Y., and Wee, H. M. (2018). Sustainable inventory management with deteriorating and imperfect quality items considering carbon emission. J. Clean. Prod. 192, 281–292. doi: 10.1016/j.jclepro.2018.04.261
Wang, C., and Chen, X. (2017). Option pricing and coordination in the fresh produce supply chain with portfolio contracts. Ann. Oper. Res. 248, 471–491. doi: 10.1007/s10479-016-2167-7
Wu, X., Fan, Z., and Cao, B.-B. (2023). An analysis of strategies for adopting blockchain technology in the fresh product supply chain. Int. J. Prod. Res. 61, 3717–3734. doi: 10.1080/00207543.2021.1894497
Wu, Q., Mu, Y., and Feng, Y. (2015). Coordinating contracts for fresh product outsourcing logistics channels with power structures. Int. J. Prod. Econ. 160, 94–105. doi: 10.1016/j.ijpe.2014.10.007
Xia, T., Wang, Y., Lv, L., Shen, L., and Cheng, T. C. E. (2023). Financing decisions of low-carbon supply chain under chain-to-chain competition. Int. J. Prod. Res. 61, 6153–6176. doi: 10.1080/00207543.2021.2023833
Xu, X., Bai, Q., and Chen, M. (2017). A comparison of different dispatching policies in two-warehouse inventory systems for deteriorating items over a finite time horizon. Appl. Math. Model. 41, 359–374. doi: 10.1016/j.apm.2016.08.024
Xu, X., He, P., Zhou, L., and Cheng, T. C. E. (2023). Coordination of a platform-based supply chain in the marketplace or reselling mode considering cross-channel effect and blockchain technology. Eur. J. Oper. Res. 309, 170–187. doi: 10.1016/j.ejor.2023.01.057
Yenipazarli, A. (2017). To collaborate or not to collaborate: prompting upstream eco-efficient innovation in a supply chain. Eur. J. Oper. Res. 260, 571–587. doi: 10.1016/j.ejor.2016.12.035
Yu, M., and Nagurney, A. (2013). Competitive food supply chain networks with application to fresh produce. Eur. J. Oper. Res. 224, 273–282. doi: 10.1016/j.ejor.2012.07.033
Yu, Y., Xiao, T., and Feng, Z. (2020). Price and cold-chain service decisions versus integration in a fresh Agri-product supply chain with competing retailers. Ann. Oper. Res. 287, 465–493. doi: 10.1007/s10479-019-03368-y
Zhang, T., Dong, P., Chen, X., and Gong, Y. (2023). The impacts of blockchain adoption on a dual-channel supply chain with risk-averse members. Omega 114:102747. doi: 10.1016/j.omega.2022.102747
Zhang, X., Li, Z., and Li, G. (2023). Impacts of blockchain-based digital transition on cold supply chains with a third-party logistics service provider. Trans. Res. Part E Log. Transp. Rev. 170:103014. doi: 10.1016/j.tre.2023.103014
Zheng, Q., Zhou, L., Fan, T., and Ieromonachou, P. (2019). Joint procurement and pricing of fresh produce for multiple retailers with a quantity discount contract. Trans. Res. Part E Log. Transp. Rev. 130, 16–36. doi: 10.1016/j.tre.2019.08.013
Zhu, J., Feng, T., Lu, Y., and Jiang, W. (2024). Using blockchain or not? A focal firm’s blockchain strategy in the context of carbon emission reduction technology innovation. Bus. Strateg. Environ. 33, 3505–3531. doi: 10.1002/bse.3664
Keywords: fresh product, shipping costs, blockchain technology, stackelberg game, deterioration rate
Citation: Zhang W, Wu L and Ji L (2025) Blockchain technology adoption strategies for the shipping costs bearer in the fresh product supply chain. Front. Sustain. Food Syst. 9:1550985. doi: 10.3389/fsufs.2025.1550985
Edited by:
Siphe Zantsi, Agricultural Research Council of South Africa (ARC-SA), South AfricaReviewed by:
Solly Molepo, National Agricultural Marketing Council (NAMC), South AfricaCopyright © 2025 Zhang, Wu and Ji. This is an open-access article distributed under the terms of the Creative Commons Attribution License (CC BY). The use, distribution or reproduction in other forums is permitted, provided the original author(s) and the copyright owner(s) are credited and that the original publication in this journal is cited, in accordance with accepted academic practice. No use, distribution or reproduction is permitted which does not comply with these terms.
*Correspondence: Lulu Ji, MjAyMzMwNTEwMTg3QHN0dS5zaG10dS5lZHUuY24=
Disclaimer: All claims expressed in this article are solely those of the authors and do not necessarily represent those of their affiliated organizations, or those of the publisher, the editors and the reviewers. Any product that may be evaluated in this article or claim that may be made by its manufacturer is not guaranteed or endorsed by the publisher.
Research integrity at Frontiers
Learn more about the work of our research integrity team to safeguard the quality of each article we publish.