 Yalin Tang
 Maoran Zhu2,3†
- 1College of Economics and Management, Fujian Agricultural and Forestry University, Fuzhou, China
- 2China Center for Agricultural Policy, School of Advanced Agricultural Sciences, Peking University, Beijing, China
- 3Minmetals Capital Company Limited, Beijing, China
The development of the restaurant industry has disrupted food consumption patterns, while evidence on how restaurants impact dietary quality remains limited and inconsistent. This study is one of the first to demonstrate a non-linear, inverted U-shaped relationship between local restaurant density and dietary quality, leveraging data from four rounds of the China Health and Nutrition Survey (CHNS). To mitigate endogeneity issues, our analyses employ a LASSO-selected Instrumental Variable (IV) approach. Our results show that before reaching the threshold, the increase in neighborhood restaurant density, primarily driven by indoor restaurants, leads to improvements in residents’ dietary quality. However, once past the threshold, higher restaurant density reduces dietary quality, mainly driven by fast food restaurants. These effects are more pronounced among males with higher-income, and those living in urban and eastern China. The mechanisms underlying these relationships include the increased frequency of eating outside home (OH), with the similar inverted U-shaped relationship observed for dietary diversity further explaining our findings. We recommend supplementing neighborhoods with limited access to dining options through indoor restaurants, and mitigating the negative effects of excessive restaurants density, especially that of fast-food restaurants.
1 Introduction
Developing countries have recently experienced marked improvements in dietary quality and shifts in dietary patterns. As Miller et al. (2022) demonstrate, developing countries like Vietnam and China have seen an increase in their Alternative Healthy Eating Index (AHEI) since 1990. Taking China, one of the biggest developing countries in the world, for example, the Chinese Healthy Eating Index (CHEI) score increased from 40.8 in 1997 to 54.5 in 2011 (Gao et al., 2024). However, concerns persist regarding individual dietary patterns. For instance, the consumption of refined food diet, saturated fat and cooking oil has increased a lot (Tian and Yu, 2015; He P. et al., 2018). To meet the Sustainable Development Goals (SDGs) of universal access to safe, nutritious, and adequate food by 2030 (WHO, 2017), it is essential to understand the factors influencing dietary quality and explore policies to promote a healthy dietary transition.
With rising incomes and rapid urbanization, the restaurant industry in China has expanded significantly, though its role in dietary transformation remains unclear. The total revenue of Chinese restaurant industry has increased from 384 billion yuan in 2,000 to 4,672 billion yuan in 2019, as the number of restaurants grown from 120,000 in 1978 to 8 million in 2017 (China Cuisine Association, 2020). Aligned with the growth of the restaurant industry, dining out has become increasingly popular (Du et al., 2014; Patel et al., 2018). Given the significant role of restaurants in shaping individuals’ dietary patterns, existing studies remain limited and inconclusive.1 Some studies even found that restaurant access has been associated with an increased risk of obesity and cardiovascular disease (Burgoine et al., 2016; Currie et al., 2010; Strupat et al., 2021; Tian et al., 2016).
Theoretically, impacts of restaurant access on dietary quality may be non-linear, which helps explain the previously discussed ambiguous relationship. Given the insufficient accessibility of restaurants and other food markets, the community can be named as “food desert” (Cummins, 2014). The introduction of neighborhood restaurants in these community would offer more diverse food alternatives and balanced catering services, thereby facilitating the enhancement of individuals’ dietary quality. However, when the density of neighborhood restaurants undergoes a further increase, it could give rise to the phenomenon of “food swamp” (Rose et al., 2009). In this case, the overcrowded restaurant distribution is often accompanied by the escalation in the presence of fast-food chains and energy-dense foods, which might lead people to an unhealthier diet. Unfortunately, this kind of nonlinear relationship has been rarely discussed in the current research.
This study aims to explore the non-linear effects of neighborhood restaurant density on dietary quality among residents in China. It utilizes longitudinal data from 14,802 adults collected across four recent survey waves (2004, 2006, 2009, and 2011) of the China Health and Nutrition Survey (CHNS). Additionally, the analysis aligns with the key recommendations of the Chinese Dietary Guidelines 2016 (He Y. et al., 2018), we measure the dietary quality by dietary quality distance (DQD), with the lower score indicating higher dietary quality. We address these potential selection biases using an IV approach and draw on the cluster-Lasso method to select IV.
We have three main findings. First, neighborhood restaurant density is found to have an inverted U-shaped relationship with individual dietary quality. To be specific, the increase in restaurant density enhances dietary quality; however, once this density exceeds a certain threshold, it negatively impacts dietary quality. The above results are robust when using alternative measurements of restaurant density, decomposing DQD, the measure of dietary quality into the adjusted dietary balance index (DBI) of separate food groups and adjusting the setting of instrumental variable. Moreover, heterogeneous analyses indicate that, compared with their peers, the inverted U shape relationship is more sharped for males with higher income and those from urban residents from eastern China. Further investigation shows some evidence of underlying mechanisms. It is found that restaurant density affects individuals’ diet quality by improving their frequency of eating outside home (OH) and changing their dietary diversity. In particular, the lower dietary diversity and more imbalanced dietary structure when restaurant density exceeding the threshold explained the existence of the inverted U-shaped relationship.
We contribute to literature in the following three aspects. First, this paper adds to a growing literature on the determinants of dietary pattern transformation in the developing world. Although most previous studies focus on the effects of market access (Huang and Tian, 2019; Sibhatu et al., 2015; Usman and Haile, 2022), supermarket access (Debela et al., 2020; Ren et al., 2022; Rogus et al., 2018), or fast food store (An, 2016; Currie et al., 2010; Thornton et al., 2009) on dietary outcomes, our estimates highlight the dietary quality impact of restaurant access and provide insights relevant to public policies to improve the food environment and strengthen the supervision of the catering industry. In particular, as far as we know, we are one of the first revealing the inverted U-shaped link between neighborhood restaurant density and individuals’ dietary quality. This finding reminds further studies to take the potential non-linear effects into consideration when investigating the effects of market access on dietary outcomes.
Second, our findings address gaps in the literature on restaurant access by uncovering its causal impact on individuals’ dietary quality. The extent to which restaurant access and eating OH are related to dietary outcomes has been discussed in several previous studies (Asirvatham et al., 2019; Biermann and Rau, 2020; Thornton et al., 2009). However, many previous studies suffer from challenges related to reverse causality and omitted variable bias, even when leveraging longitudinal data with individual fixed effects. Some exceptions include Abrahamsson et al. (2023) and Ren et al. (2022), which use a cohort difference-in-differences (DID) strategy and IV approach, respectively. On the basis of Ren et al. (2022), we further improved the construction strategy of IV by machine learning methods, drawing on the LASSO-chosen IV to mitigate potential endogeneity issues of restaurant access.
In addition, we explore the potential working channels of density of neighborhood restaurants, which helps improve our understanding of why restaurant access matters for individual dietary outcomes. Our results first support the findings of Auchincloss et al. (2021) that access to higher density of restaurants might encourage people to eat OH more frequently and subsequently affect diet quality. Moreover, our findings that individuals’ dietary perception might change with restaurant introduction help improve the understanding of decision-making process underlying food consumption, which has not been fully discussed in relevant literature (Gordon-Larsen, 2014). Last but not least, our findings also help explain how restaurant access contributes to unhealthy outcomes such as obesity and weight gain (Burgoine et al., 2016; Currie et al., 2010; Tian et al., 2016).
The structure of this paper is as follows. Section 2 shows the data and methodology. Section 3 details and interprets the empirical results. Section 4 discusses the underlying mechanisms, and the final section provides the conclusions.
2 Materials and methods
2.1 Data
Our analyses draw on data from the China Health and Nutrition Survey (CHNS), spanning 10 survey waves from 1989 to 2015. The CHNS employed a multi-stage random cluster sampling method, ensuring representativeness of the Chinese population. Initially, nine provinces were selected, encompassing northern and southern regions as well as economically developed and less developed remote areas. In each province, two cities and then four counties were randomly chosen. Within each city, two urban and two rural communities were selected. Additionally, one community from the provincial capital and then three rural villages were randomly sampled within the selected counties. Finally, 20 households were randomly selected from each community or village for participation (Zhang et al., 2014). During its survey in 2011, 27,447 individuals from 5,884 households in 288 communities were surveyed.
A four-step procedure was employed to extract a subsample from the CHNS, specifically tailored to meet the objectives of our study. First, since dietary data since 2015 are not yet available, and the CHNS includes information on the restaurant environment from 2004 onwards. Therefore, we draw on the survey data in 2004, 2006, 2009, and 2011 waves for our analyses. Notably, our study draws on the survey waves covering the period during which the restaurant industry experienced rapid growth in China, which can provide us with the opportunity to examine the dietary benefits of accessing to restaurants. Second, our sample is limited to adult residents aged 18 years or older at the time of the survey, as their eating patterns are measured differently from those of minors. Third, samples with negative food consumption and beyond three standard deviations of the mean food consumption are excluded as outliers. Fourth, due to the lack of population data, which is necessary to construct restaurant density in this paper, samples from two communities are deleted. After these processes, we are left with 14,802 sample individuals from 217 neighborhoods.
2.2 Measures
2.2.1 Dietary quality distance
The Dietary Quality Distance (DQD) is used to measure individual dietary quality, which is constructed by the 2016 version of Chinese Diet Balance Index (DBI-16) and in line with the latest Chinese Dietary Guidance (CDG). We employ the following three-step procedure to construct the DQD score (Hua et al., 2022).
First, we calculate the DBI-16 score for each of the 11 energy levels, with each level having its recommended intake according to the 2016 CDG. The DBI-16 includes seven components, each scored between −12 and 12: (1) cereals; (2) vegetables and fruits; (3) dairy, soybeans, and their products; (4) animal-based foods (subdivided into meat, fish, and eggs); (5) empty-energy foods (such as cooking oils and alcoholic beverages); (6) condiments (including added sugar and salt); and (7) diet variety. A score of 0 for any component indicates that the food consumption aligns with the recommended intake levels outlined in the CDG. The positive or negative scores indicate the excessive or insufficient food intake (Su et al., 2020). Due to that CHNS did not investigate the alcohol and water intake, referring to relevant studies (Luo et al., 2015), we use the DBI measure excluding alcohol and water to calculate DQD. Appendix Table A1 shows details of the DBI score.
In the second step, we calculate the score of lower bound (LBS), and that of higher bound (HBS) based on the DBI score of each food group, and construct DQD according to LBS and HBS finally. The LBS, calculated as the sum of the absolute values of all negative scores, reflects insufficient food consumption and ranges from 0 to 60. Conversely, the HBS, as the sum of all positive scores, represents excessive food consumption and ranges from 0 to 40.
Finally, we add up the absolute values of the above scores to calculate overall DQD score, which represents to what extent the dietary pattern is healthy and well-balanced. The DQD ranges from 0 to 78 (without data of water and alcohol), where a higher score indicates a more imbalanced dietary intake and the lower score indicates more balanced diet (He Y. et al., 2018).
2.2.2 Adjusted DBI
The adjusted DBI measures the balance of intake for each food group. As part of the DQD construction process, the DBI evaluates the extent to which the intake of each food group aligns with recommended levels. It includes both the positive and negative score, with the score of zero meaning balanced diet. Based on this, we make the adjustment by taking the absolute value to construct adjusted DBI for each food group. Compared with the original DBI, the adjusted DBI is easier for us to measure the extent to which the intake of certain food groups deviates from the optimal level. In this case, the lower the score of adjusted DBI, the healthier diet in a certain food group.
2.2.3 Dietary diversity score
Dietary diversity is assessed using the Dietary Diversity Score (DDS), which is based on 24-h individual dietary intake data following the guidelines provided by the Food and Agriculture Organization of the United Nations (2011). The DDS considers the consumption of nine basic food groups: starchy staples, vitamin A-rich fruits and vegetables, dark-green leafy vegetables, other fruits and vegetables, organ meat, eggs, meat and fish, milk and dairy products, legumes, nuts, and seeds. Each distinct group consumed earns one point, with repeated consumption within the same group not contributing additional points. The DDS is calculated by adding the number of food groups consumed by residents in the previous 24 h, with scores ranging from 0 to 9, regardless of the quantity consumed.
2.2.4 Average calorie intakes
Considering the mechanisms through which restaurant access might influence nutritional intake, we constructed the measure of average calorie intake. We utilize food consumption data from the CHNS, collected over three consecutive days. Using the nutritional content of food items documented in the Chinese Food Nutrition Table (Yang et al., 2000), we calculated the daily total calorie (kcal) intake per person.
2.2.5 Healthy food preference
The score of healthy food consumption preference is used to measure individuals’ preference for a healthy diet. Since 2004, CHNS has collected consumers’ preference for food consumption for those above 12 years old. To be specific, respondents are asked to report their preferences for various food items, including salty snacks, fast food, soft drinks, fruits, vegetables, and sugared fruit beverages. The final score is derived from their responses, where the value of 1 indicates a healthy preference, −1 means an unhealthy preference, and 0 represents neutrality. Higher scores reflect healthier food preferences.
2.2.6 Frequency of eating OH
Information about dining spots comes from the dietary questionnaire of CHNS. Specifically, the sample adults reported where they eat as well as how much they eat for each kind of food. Given them, we divide the total amount of food not eaten at home by the total food consumption to calculate the frequency of eating OH.
2.2.7 Neighborhood restaurant density
We measure density of neighborhood restaurants by the number of restaurants per square kilometer in the neighborhood. Compared to previous studies that only considered the number of neighborhood restaurants (Du et al., 2014; Patel et al., 2018; Tian et al., 2016), this study seeks to characterize restaurant density more precisely. The number of neighborhood restaurants is recorded in the CHNS neighborhood survey. In urban areas, neighborhoods are defined as communities, while in rural areas, they correspond to villages. Based on the literature (Du et al., 2014; Tian et al., 2016), restaurants are categorized into fast-food outlets, indoor restaurants, and outdoor food stands. Fast-food restaurants refer to chains offering Western-style dishes; indoor restaurants are full-service establishments serving diverse meals and alcoholic beverages; and outdoor food stands include small, fixed stalls, mobile carts selling items like dumplings, steamed bread, and pancakes, as well as bakeries and vendors providing fried or other breakfast foods (Tian et al., 2016). We also adjusted for population density by using “No. of neighborhood restaurants per 100 people” as an alternative measure, which was then tested in robustness checks.
2.2.8 Covariates
Characteristics are controlled at the individual, household, and neighborhood levels that affecting residents’ dietary quality following the literature (Huang and Tian, 2019; Ren et al., 2022). To be specific, we control seven covariates at the individual level, including gender, age, square of age, years of schooling, Body Mass Index (BMI), minority, and marital status. We also control two household covariates, including household size and the average household income per person, together with the index of neighborhood social service, which is constructed by Zhang et al. (2014) to characterize the availability of preschool services for children under 3 years old and access to commercial, free, or neighborhood-provided medical insurance offered in the neighborhood. In addition, we include the county and survey year fixed effects to control for time trend and regional heterogeneity.
2.3 Empirical specification
To investigate the causal effects of neighborhood restaurant density on dietary quality, we address the issue of endogeneity in “Selection on unobservables.” Specifically, unobservable factors that influence both restaurant distribution and adults’ diets could create a spurious relationship. To mitigate this, we adopt a two-step approach. First, a fixed-effects model is employed to control for time-invariant and region-invariant unobservable confounders, as detailed in Equation 1.
Where denotes the DQD score of individual i in county c, neighborhood d and survey year t; denotes No. of neighborhood restaurants/km2 in neighborhood d and survey year t; and denotes other covariates, including individual characteristics (age, square of age, gender, years of schooling, Body Mass Index (BMI), ethnicity, and marital status), household characteristics (household size, average household income per person), and neighborhood characteristics (index of social service). and denote the survey year and county fixed effects, we use them to control for both the time-invariant social and geographic characteristics by counties and the county-invariant while time-varying confounding factors. We cluster the standard errors at the individual level. Statistical analyses are performed using the STATA software, version 17.1.
In the second step, to address potential endogeneity issues related to neighborhood restaurants and dietary quality, LASSO-chosen instruments are applied. Following previous studies (Debela et al., 2020; Huang and Tian, 2019; Asirvatham et al., 2019), we adopt array of potential instruments, including the availability of an open trade area, open city, or a special economic zone within 2 h by train from the neighborhood, the availability of a bus stop is in the neighborhood or a train station in the neighborhood, whether convenient telephone service is available in the neighborhood, the distance to the nearest bus stop, that to the nearest train station, and their interactions with the neighborhood average food price, respectively.2 We draw on the Cluster-Lasso method following Belloni et al. (2016) to select IV. Following Belloni et al. (2014), we used conventional standard errors and also added a single-instrument constraint. Appendix Table A2 presents the estimated regularization parameters for variable selection. Afterwards, the interaction of distance to the nearest train station ( ) and neighborhood food price is selected as the instrumental variable of density of neighborhood restaurant.3
With the LASSO-chosen IV, a two-step least squares (2SLS) approach is employed in Equations 2–3:
Where denotes the IV, and the rest are consistent with Equation 1. We delve into the validity of this IV in the following two evidence. First, the correlation condition requires that density of neighborhood restaurant is correlated to distance to transportation hub and local food price. The distance to transportation hubs is shown to be a significant predictor of food market development (Ren et al., 2022), and lower local food prices can also reduce the supply chain costs for restaurants. Moreover, it is noteworthy that the variation in distance to train stations is primarily geographic, rather than temporal, while food prices exhibit greater temporal variation, with relatively minor geographic differences. However, the interactions of them creates a neighborhood-level variable with substantial temporal variation, suitable for panel analysis (Appendix Figure A2). Panel B of Table 3 shows that our IV significantly predicts neighborhood restaurant density with the Cragg-Donald F statistics of above 24, suggesting that our estimates are not affected by a weak IV problem.
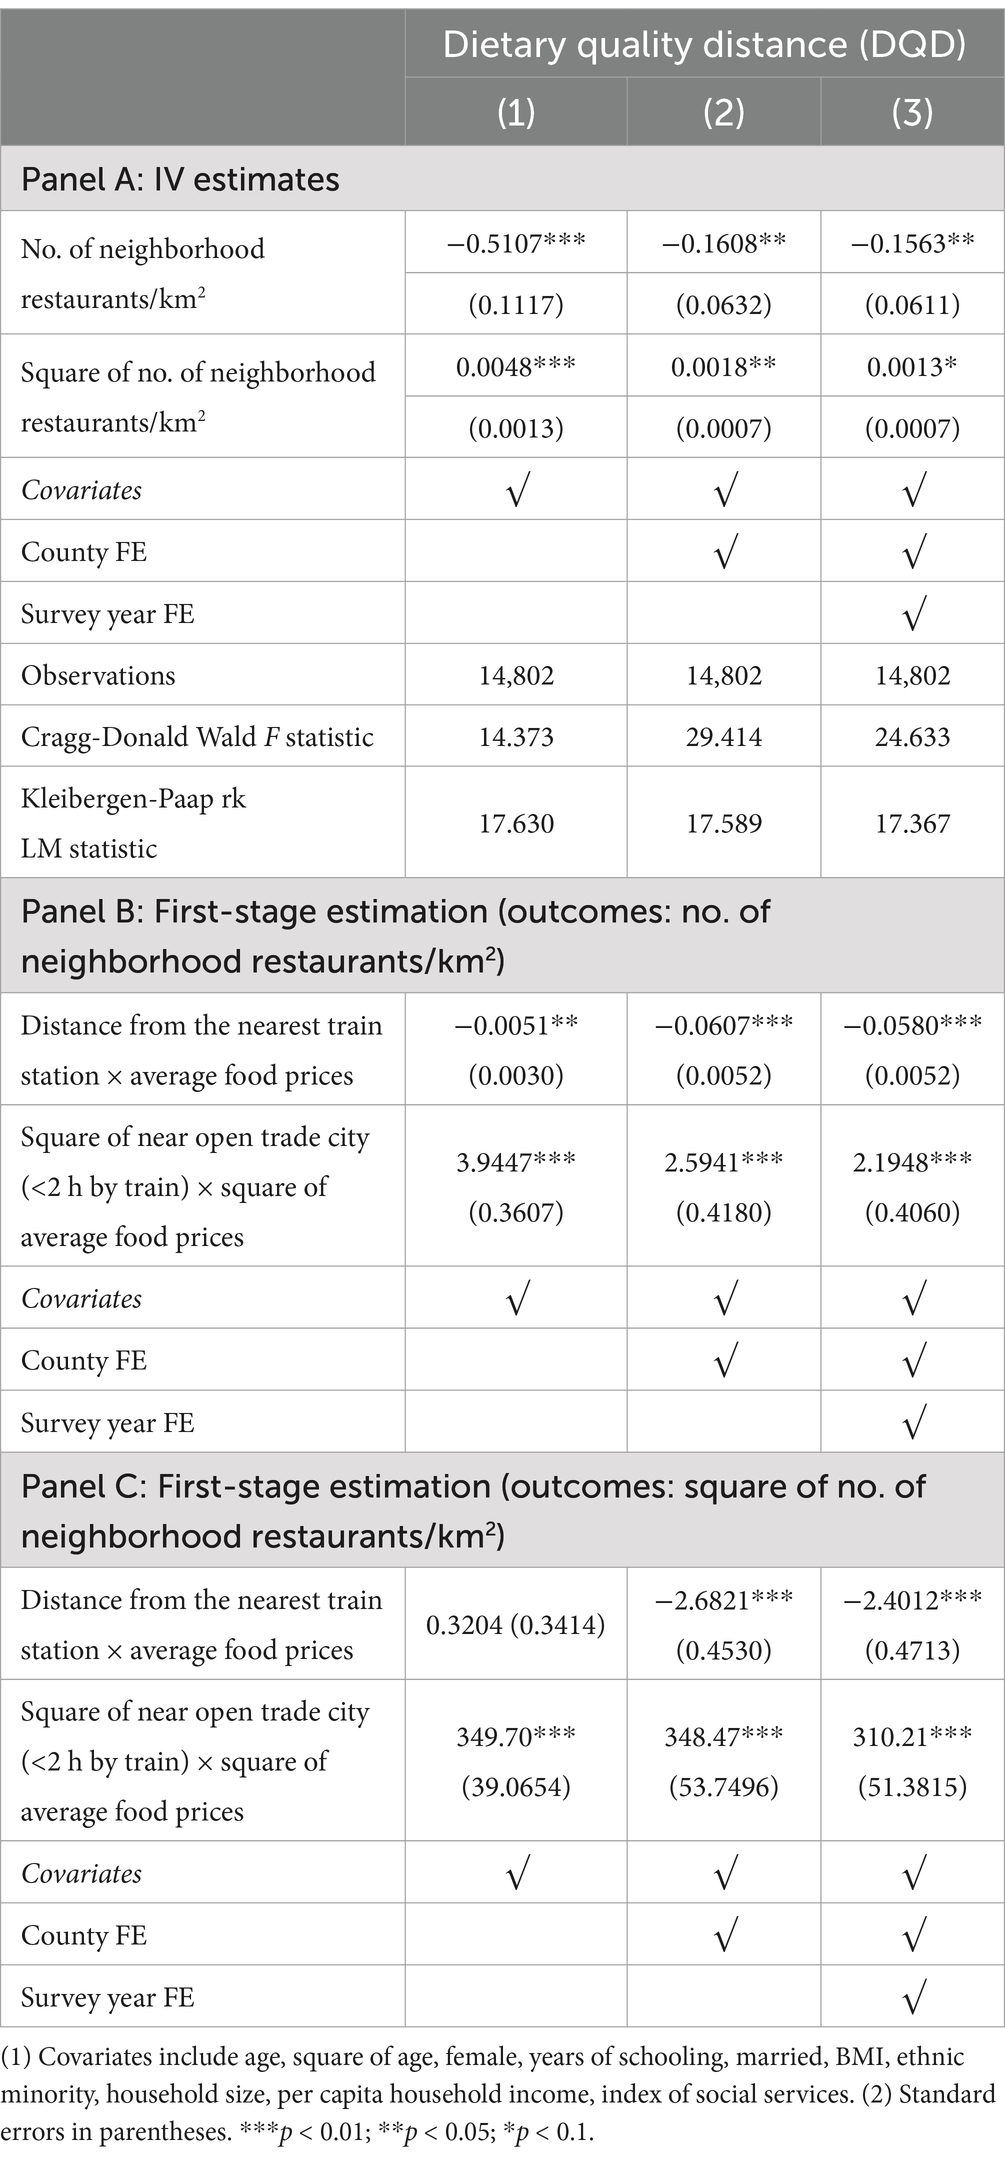
Table 3. Effects of neighborhood restaurant density on adults’ dietary quality.
Second, we present evidence to address potential concerns about violations of the IV exclusion assumption. One potential issue is that the LASSO-chosen IV could fail to meet the externality requirement if its effects are confounded by other factors influencing restaurant density. To mitigate this concern, we test the correlation between the restaurant density instrumented by the chosen IV and other aspects of the market environment. Appendix Table A3 shows that the restaurant density affected by the chosen IV does not significantly predict other market environments, suggesting that the concern raised earlier is unlikely to pose a problem.
3 Results
3.1 Descriptive analyses
Our descriptive analysis indicates that the dietary quality of Chinese adults falls within the category of a “moderate level of problem” (He Y. et al., 2018). Table 1 shows that the average DQD score of our sample adults is 33.5 with a SD of 6.30. Similarly, Miller et al. (2022) have shown that despite the progress over the past three decades, global dietary quality still needs to be improved, with an average score of 40.3 (ranging from 0 to 100). To be specific, as for the adjusted DBI score of 11 food groups, most kinds of food groups are under imbalanced intake. Before taken the absolute value, four groups of them (cereals, meat, oil, salt) are over intake and six groups of them (vegetables, fruits, milk, legumes, aquatic, eggs) are under intake. The over intakes of cereal and salt, together with the deficit intakes of vegetables, fruits, and milk are also shown in Shanghai of China (Zang et al., 2017) and India (Patel et al., 2018). Other countries in Latin America and East Asia have also witnessed increasing consumption of meat (Miller et al., 2022; Murakami et al., 2018).
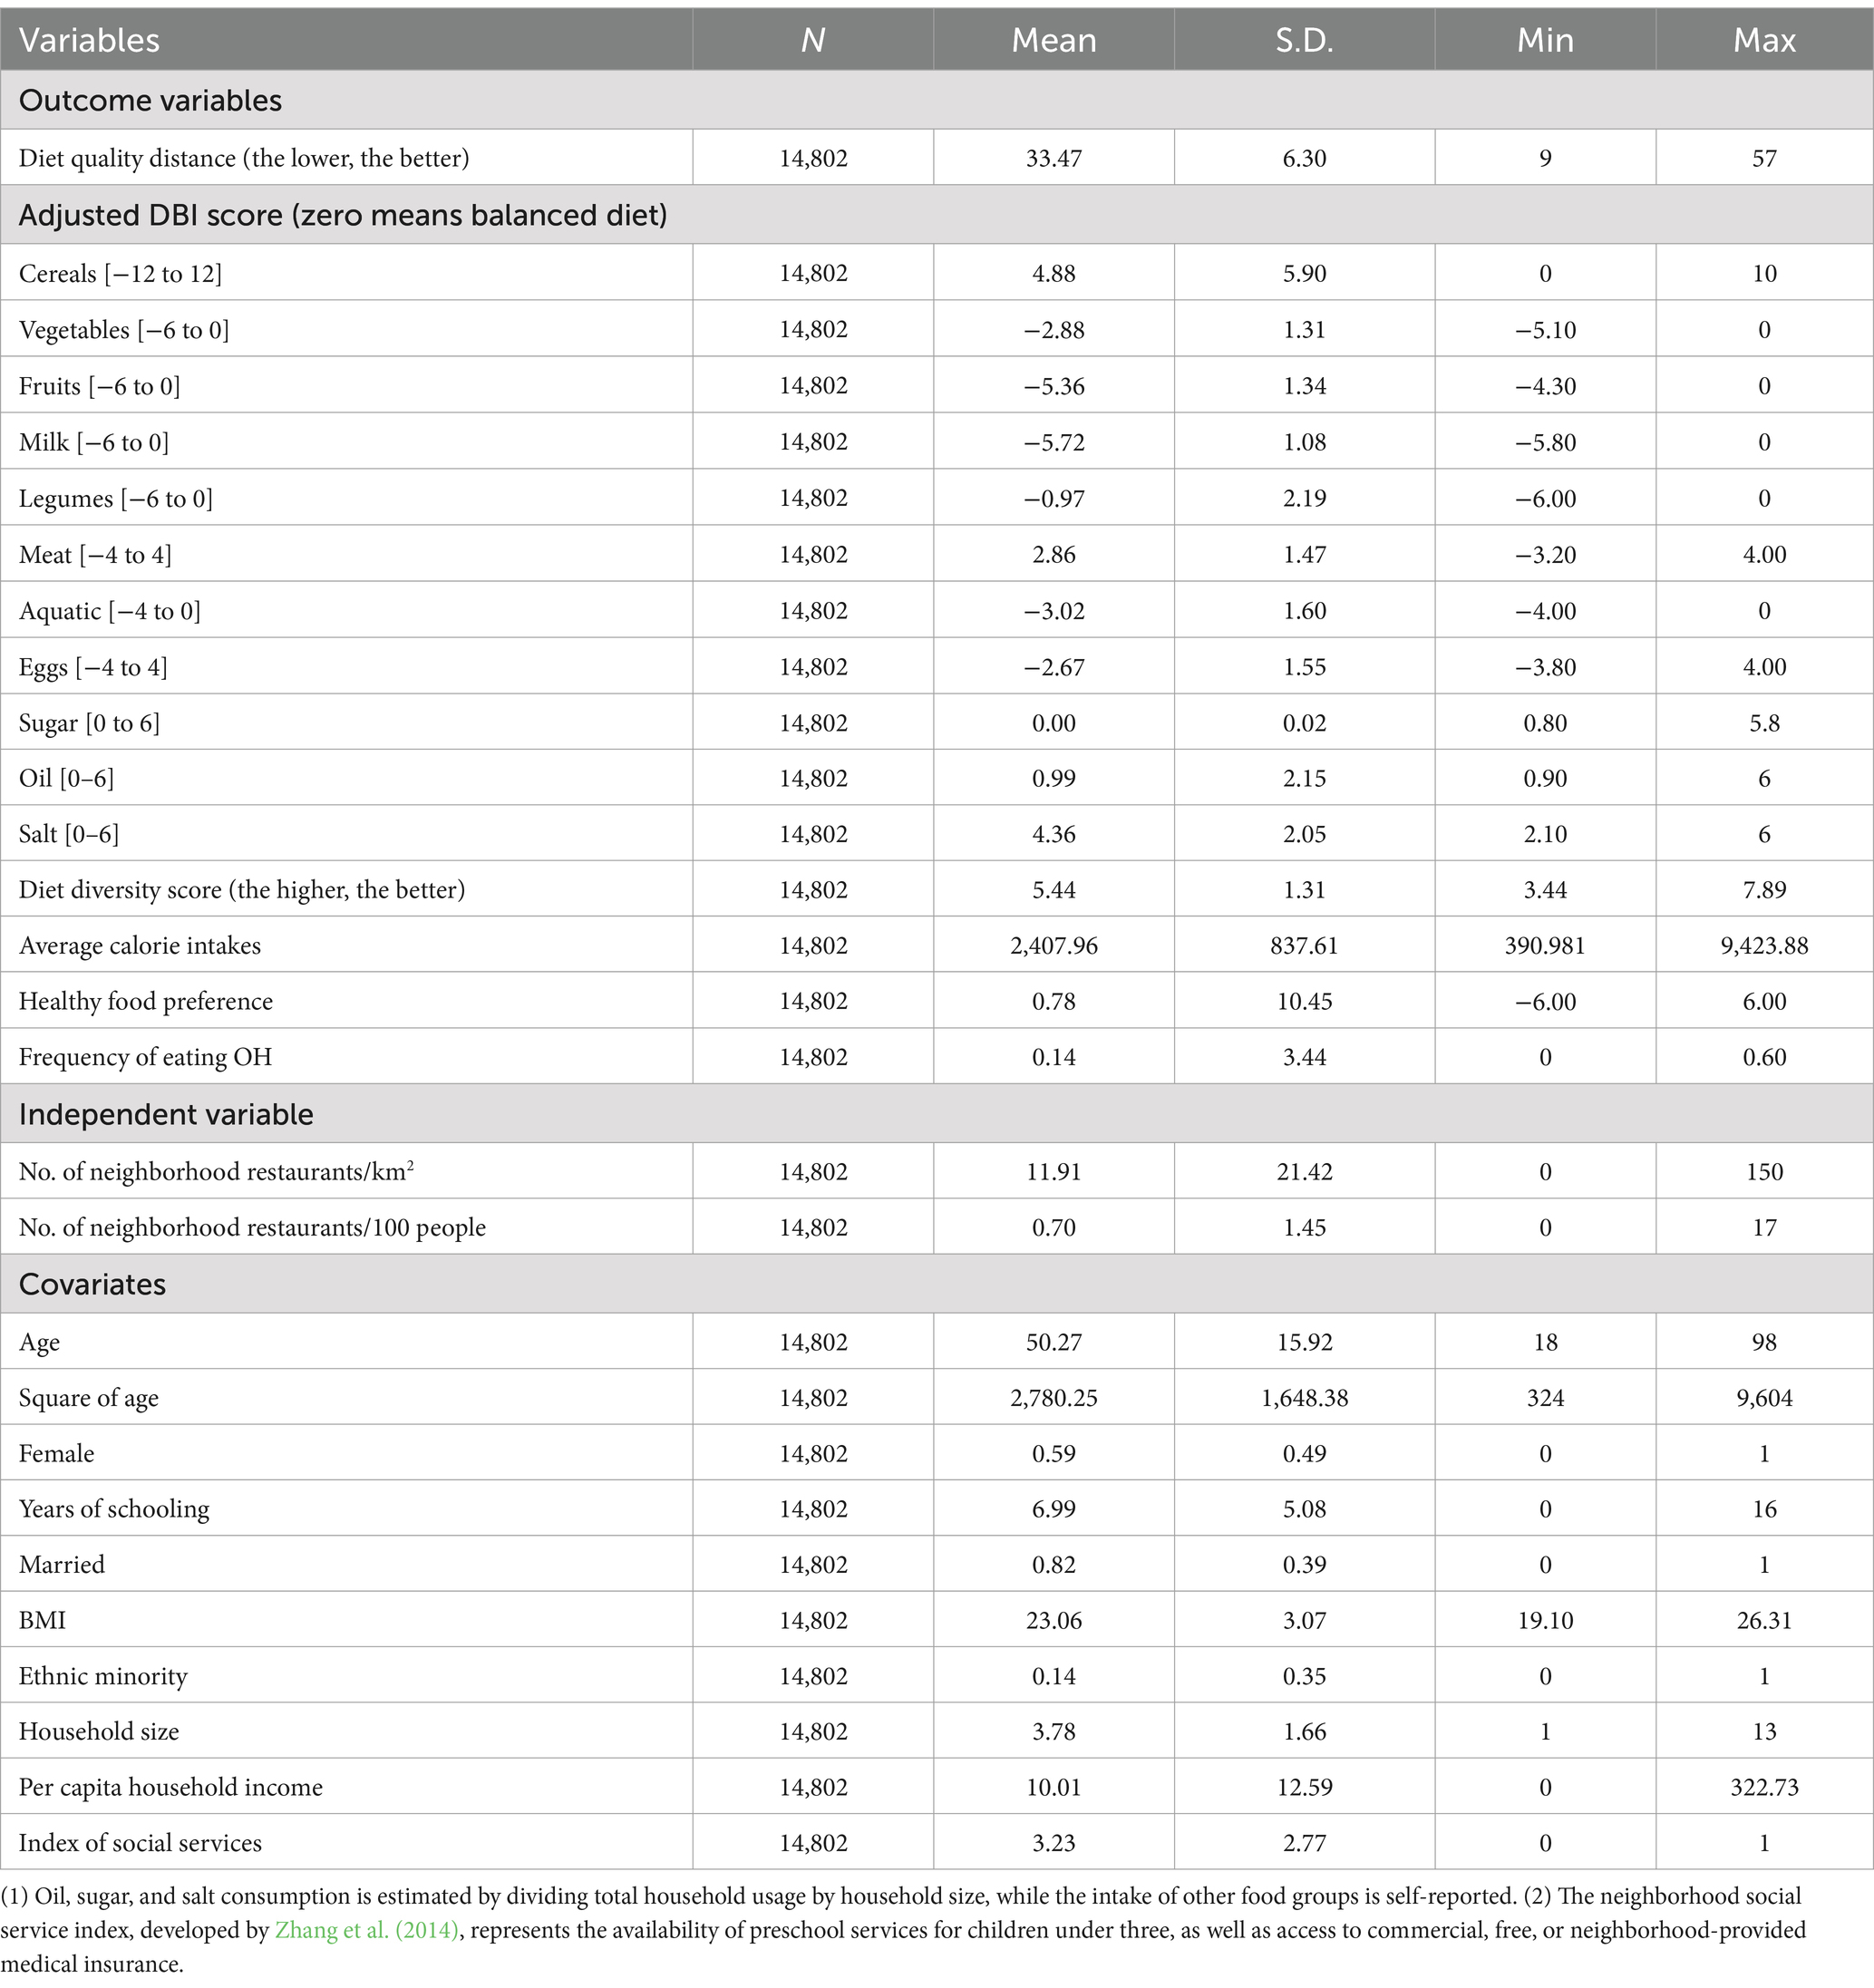
Table 1. Descriptive statistics.
In the meantime, within the neighborhood, there are 11.9 restaurants per square kilometers in the neighborhood on average (Table 1). On average, a sample adult is 50 years old, with less than 7 years of schooling, which is below the junior high school level. The average per capita household income is 10.0 thousand yuan (in 2011 prices). Additionally, 14% of them belongs to ethnic minorities, and 82% are married. Their average BMI is 23.1, and the average household size is 3.8.
3.2 Effects of neighborhood restaurant density on adults’ dietary quality
We first report ordinary least squares estimates as a baseline. In Column 1–3 of Table 2, the fixed effects model is used to test the linear relationship between restaurant density and adults’ dietary quality. We find that restaurant density tends to improve adults’ dietary quality significantly, inconsistent with two longitudinal studies showing insignificant relationships in the U.S. (Auchincloss et al., 2021; Madrigal et al., 2020). However, after adding the quadratic term in Column 4, we find a significant and robust inverted U-shaped relationship between the neighborhood restaurant density and the adults’ dietary quality. That said, the higher restaurant density helps increase adults’ dietary quality first followed by an unhealthier diet beyond a certain point.
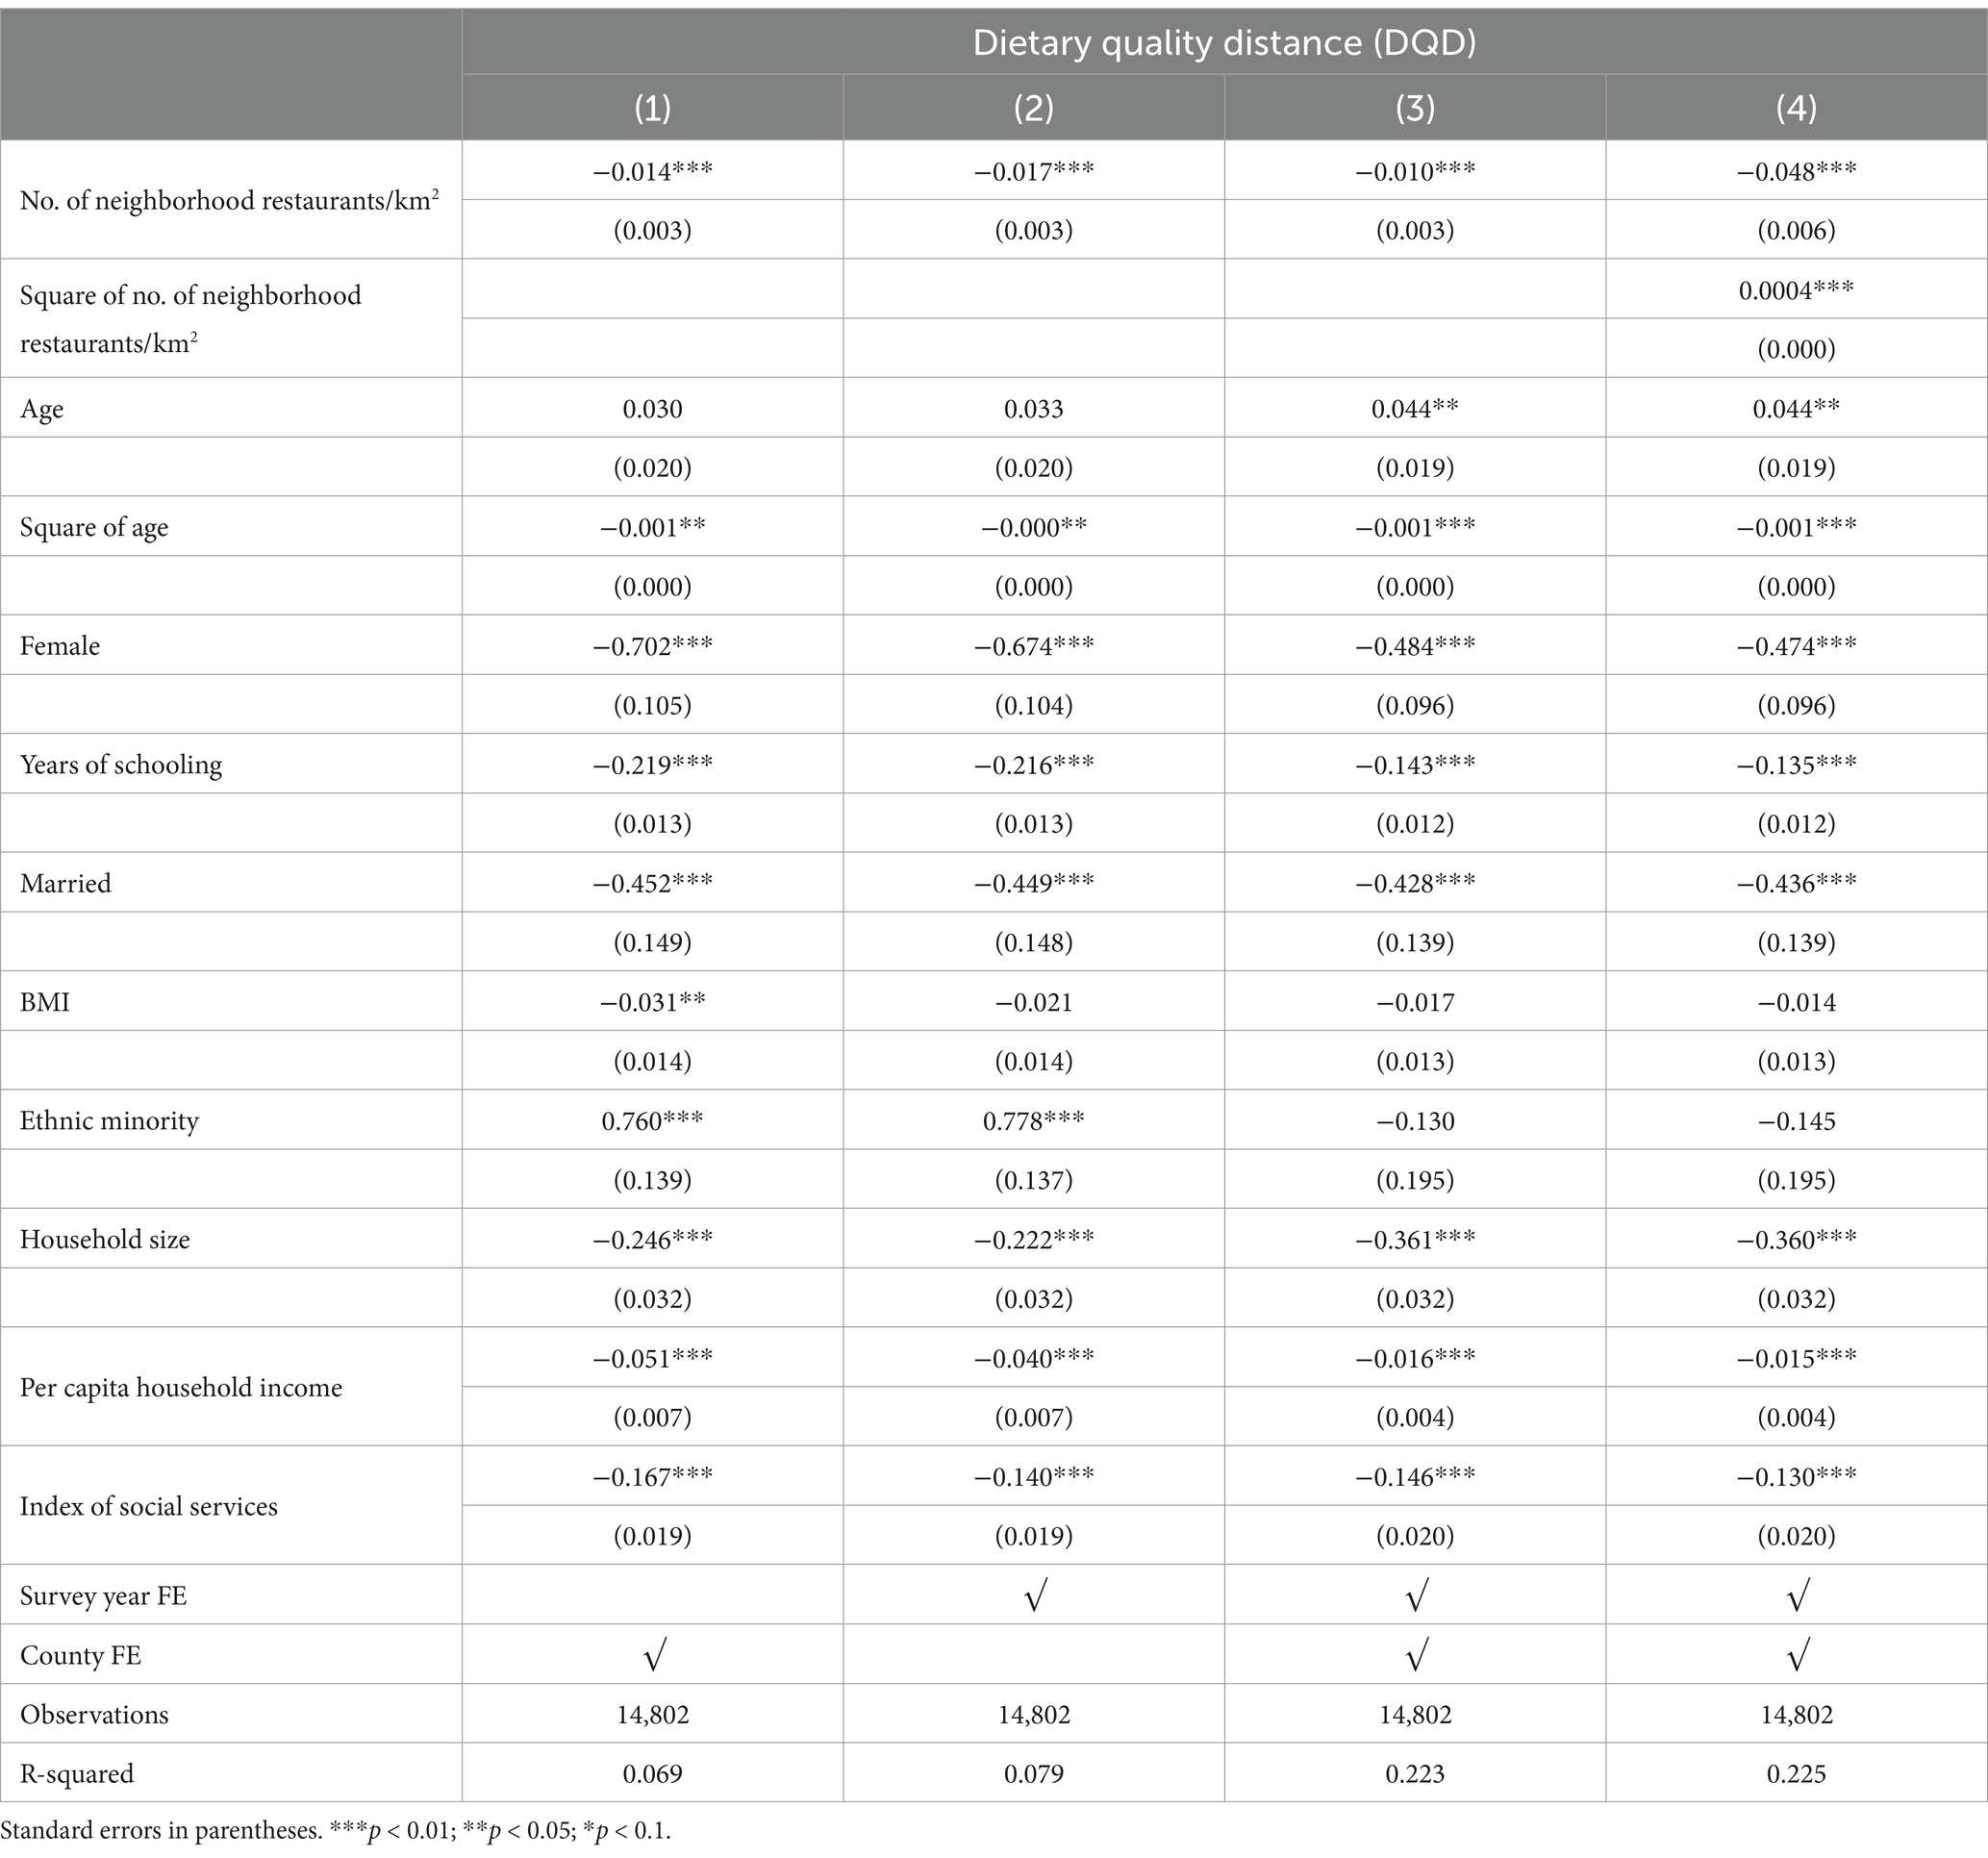
Table 2. Association between neighborhood restaurant density and adults’ dietary quality.
To address the potential endogeneity bias, we use the LASSO-chosen exogenous instrument for neighborhood restaurant density through the IV approach. In the first stage, the LASSO-selected IV significantly increases restaurant density, with a positive effect at the 1% significance level (Panel B and C, Table 3). Moreover, in the second stage, the inverted U-shaped relationship is further confirmed. These estimates give credence to our ordinary least squares (OLS) estimation results. To our knowledge, restaurant density in our sample neighborhood has not yet reached the threshold at which the effect begins to reverse. In other words, on average, the sample neighborhood stands to benefit from improvements in dietary quality as density of neighborhood restaurant increases.
Given the significant variation in food offerings across restaurant types, we further categorize density of neighborhood restaurant by its types in our extended analyses. Table 4 shows that different categories of restaurants exert varying influences on adults’ dietary quality. Overall, the benefits of increased restaurant density are primarily driven by indoor restaurants, which offer a wider range of food options than other types of restaurants. In contrast, fast food outlets provide no benefits and, once their density exceeds a certain threshold, significantly reduce adults’ dietary quality, both in statistical and economic terms. Indoor restaurants exhibit similar effects, but their negative impact is much smaller compared to that of the excessive concentration of fast-food restaurants. Outdoor food stalls, however, have no significant effect.
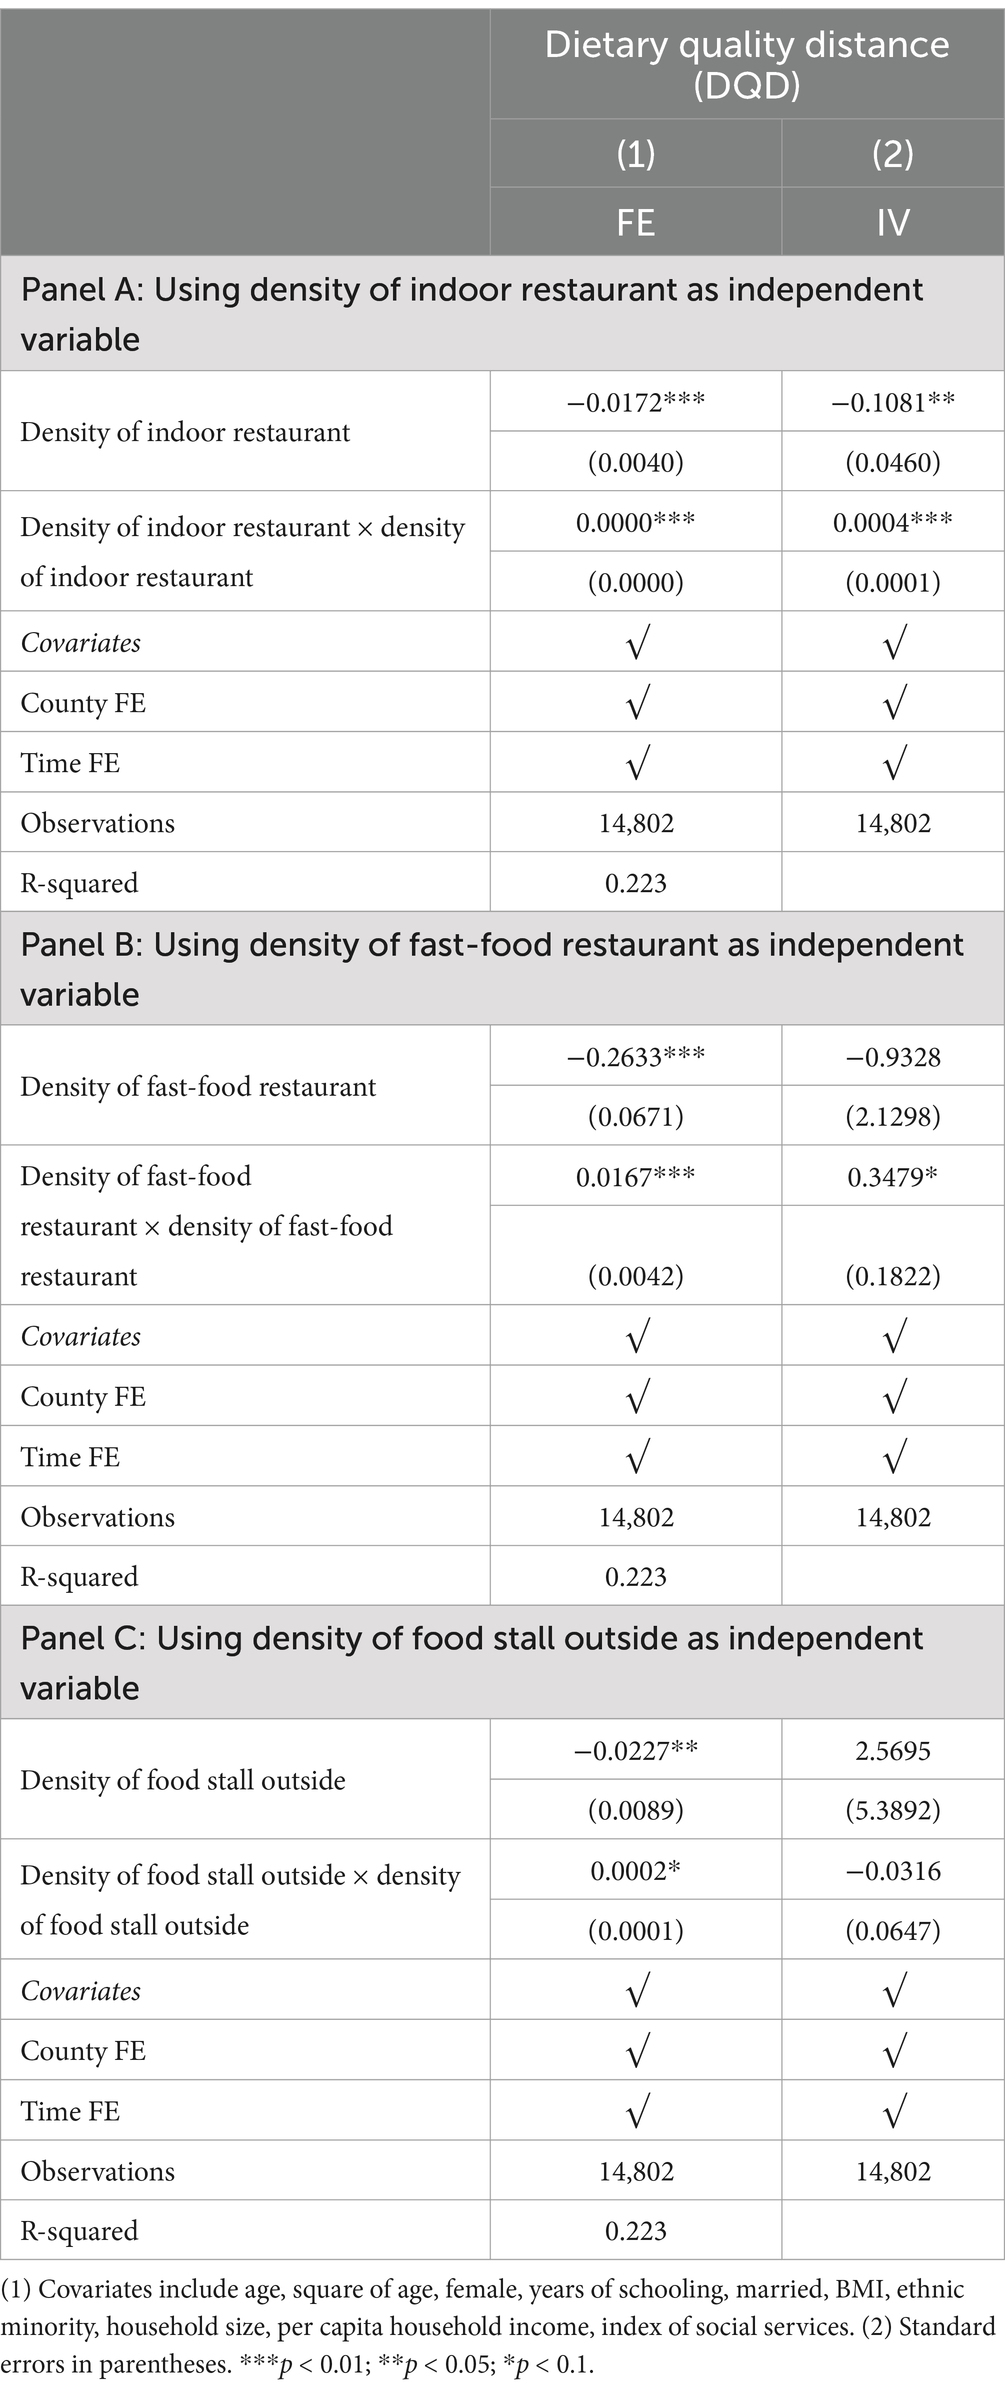
Table 4. Effects of density across different types of neighborhood restaurants on adults’ dietary quality.
3.3 Heterogeneous analyses
So far, we have demonstrated the inverted U-shaped relationship between restaurant density and adults’ dietary quality, could this relationship differ across sub-groups of residents? To answer the question, we perform heterogeneous analyses by sample adults’ gender (female/male), income (upper, middle and lower 1/3 of per capita household income), and region of residence (rural/urban, or east/west or central China). The aforementioned dummy variables are introduced into the above models and interact it with the neighborhood restaurant density and its square term prior to re-estimating the regressions.
Findings from the heterogeneous effects on adults’ dietary quality show some informative patterns from two perspectives (Tables 5, 6). In terms of individual characteristics, we find a sharper inverted U shape relationship between restaurant density and adults’ diet for males from wealthier households. However, for females and those with lower incomes, it seems that neighborhood restaurant density has no significant effect on adults’ dietary quality. Similarly, Du et al. (2014) and An (2016) have found that males exposed to more neighborhood restaurant have higher BMI index or daily nutrient intakes. One possible explanation might be that males with higher income tend to participate more frequently in social activities and eating out more often, and then more affected by neighborhood restaurants. Moreover, by different regions, inverted U shape relationship is more sharped for those from eastern China and urban areas than their peers. The regional differences in the impacts of restaurant density might also have to do with the regional difference in eating out preference.
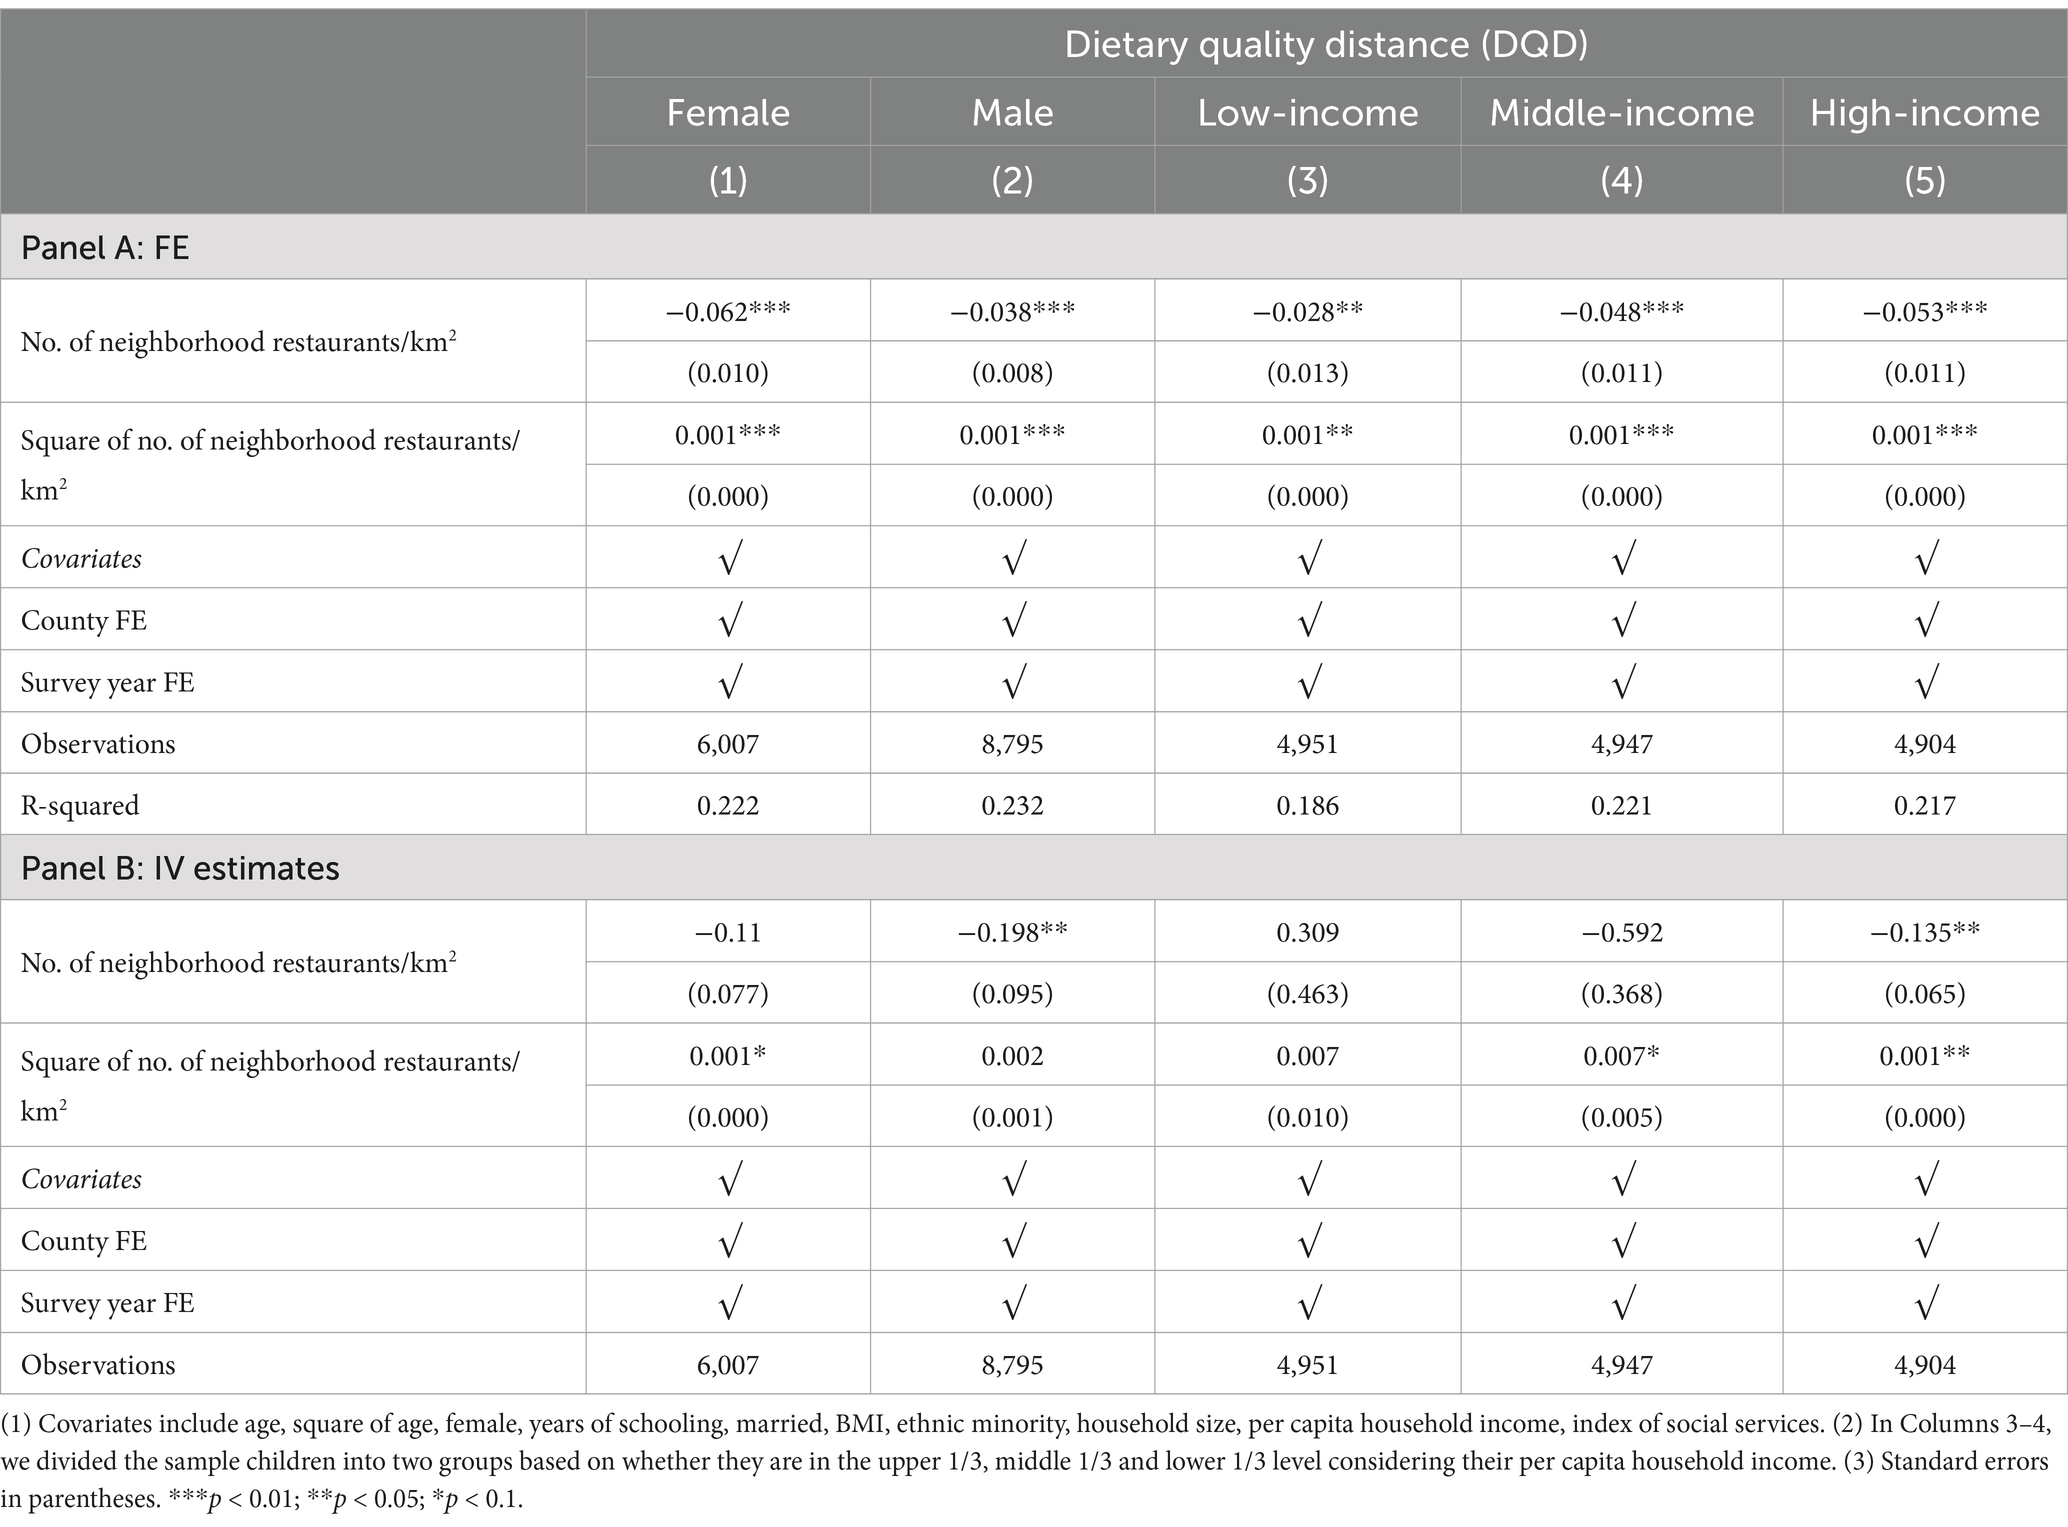
Table 5. Effects of neighborhood restaurant density on adults’ dietary quality, by personal characteristics.
3.4 Robustness checks
Appendix Tables A3, A4 present four types of robustness checks for our results. First, we replace the DQD with its decompositions, the absolute value of adjusted dietary balance index (DBI) for 11 kinds of food groups. Our results reveal the inverted U-shaped relationship between restaurant density and dietary balance in terms of most food groups (Appendix Table A4). Before reaching the threshold, higher restaurant density in the neighborhood promotes healthier diets, particularly for eggs, cereals, fruits, milk, and legumes. However, once restaurant density surpasses this threshold, the effect begins to reverse. In contrast, for vegetables and meat, increased restaurant density tends to encourage less balanced diets, likely due to the prevalence of meat- and protein-focused menu offerings in many restaurants.
We additionally examine the robustness of our findings by modifying the key independent variables and adjusting model specifications (Appendix Table A5). First, we redefine neighborhood restaurant density as the number of restaurants in the neighborhood per 100 people. We also use the number of neighborhood restaurants within a 5-kilometer radius as the alternative independent variable. Additionally, we address extreme values in restaurant density by applying a 5% truncation to the explanatory variable before reanalyzing. Lastly, we replace the IV with the second most suitable instrument selected by the LASSO method. The results show that our findings are robust across different measures and model specifications.
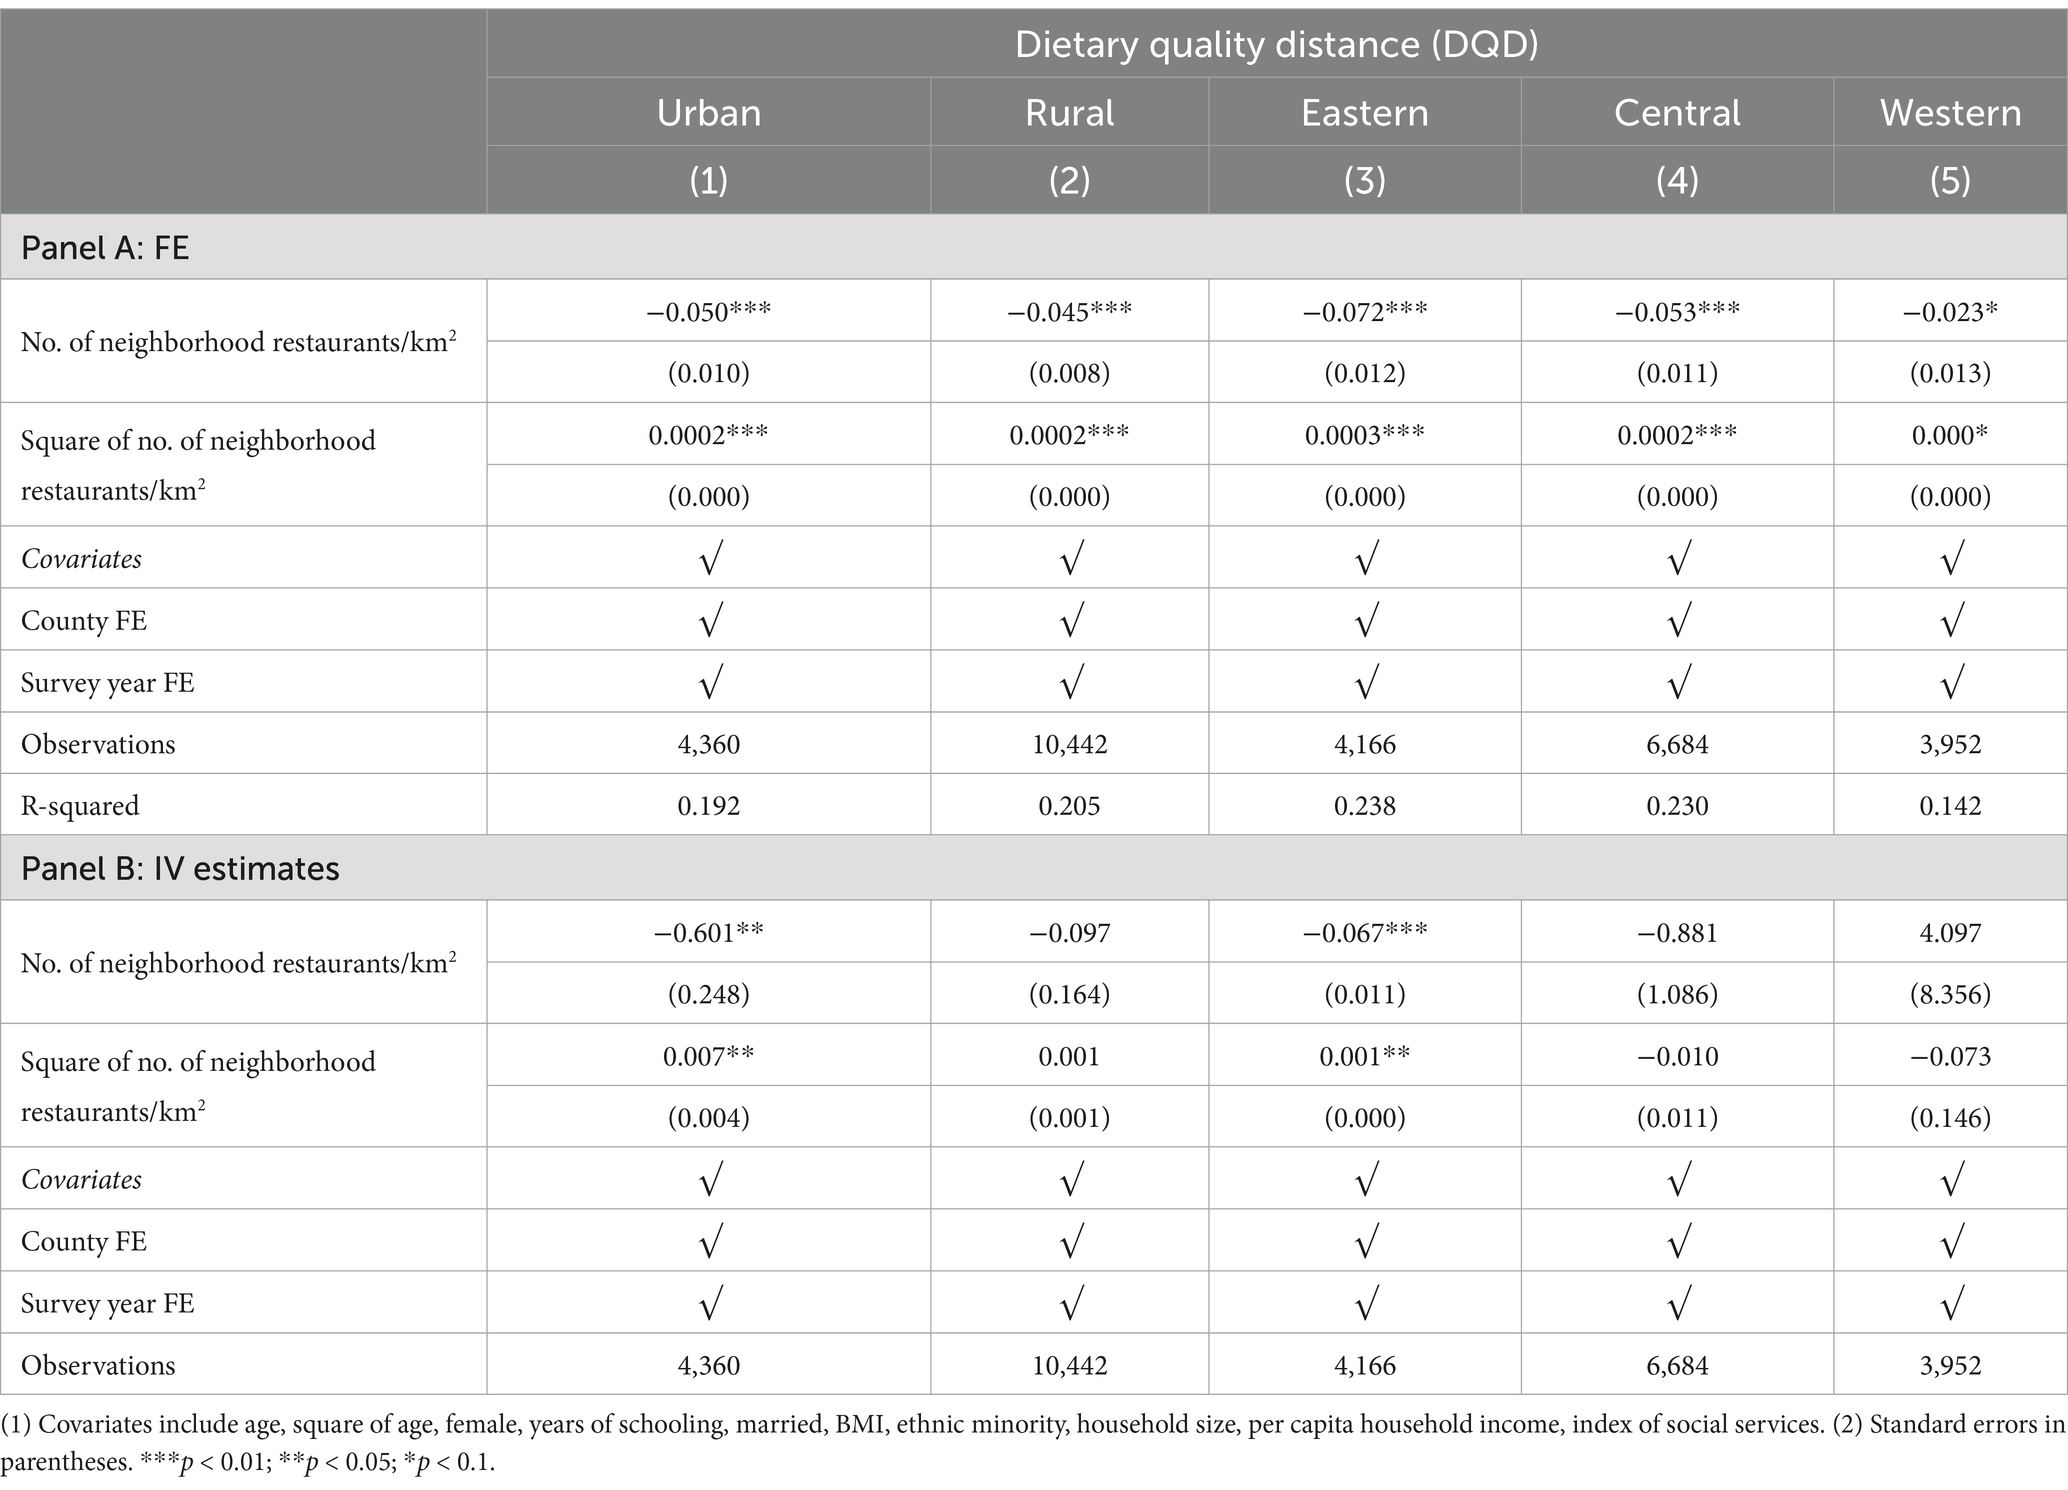
Table 6. Effects of neighborhood restaurant density on adults’ dietary quality, by regions.
4 Discussion
So far, our findings have revealed an inverted U-shaped relationship between neighborhood restaurant density and dietary quality among Chinese adults. Why is it like this? Recent studies suggest a two-stage causal pathway. In the first stage, access to restaurants influences individuals’ eating habits, particularly the frequency of OH, which subsequently affects their dietary patterns (Auchincloss et al., 2021). In the second stage, both supply- and demand-side factors contribute to variations in dietary quality. On the supply side, an increase in food suppliers expands the range of available food options (Huang and Tian, 2019; Ren et al., 2022). On the demand side, the social context of restaurants may influence individuals’ preferences for healthier diets (Levy et al., 2021).
Our results provide several key insights. First, higher restaurant density significantly encourages more frequent eating outside the home (Table 7), consistent with findings of Auchincloss et al. (2021) from the U.S. In the second stage, our results suggest that supply-side factors help explain the inverted U-shaped relationship observed. Specifically, we find a similar inverted U-shaped relationship between restaurant density and dietary diversity (Table 8). It might be due to that increased restaurant density help alter the food supply structure, which in turn, affects residents’ dietary diversity. We also find that neighborhood restaurants have little effect on average calorie intake. This may be related to the mixed effects of restaurants on the consumption of different food categories. As shown in Appendix Table A4, the impact of restaurant density on food consumption varies depending on the type of food. Specifically, before reaching a certain threshold, an increase in restaurant density leads to an overconsumption of calorie-dense meats, while simultaneously reducing the overconsumption of high-calorie cereals. Therefore, these mixed effects explain why the overall impact of restaurant density on average calorie intake is minimal.
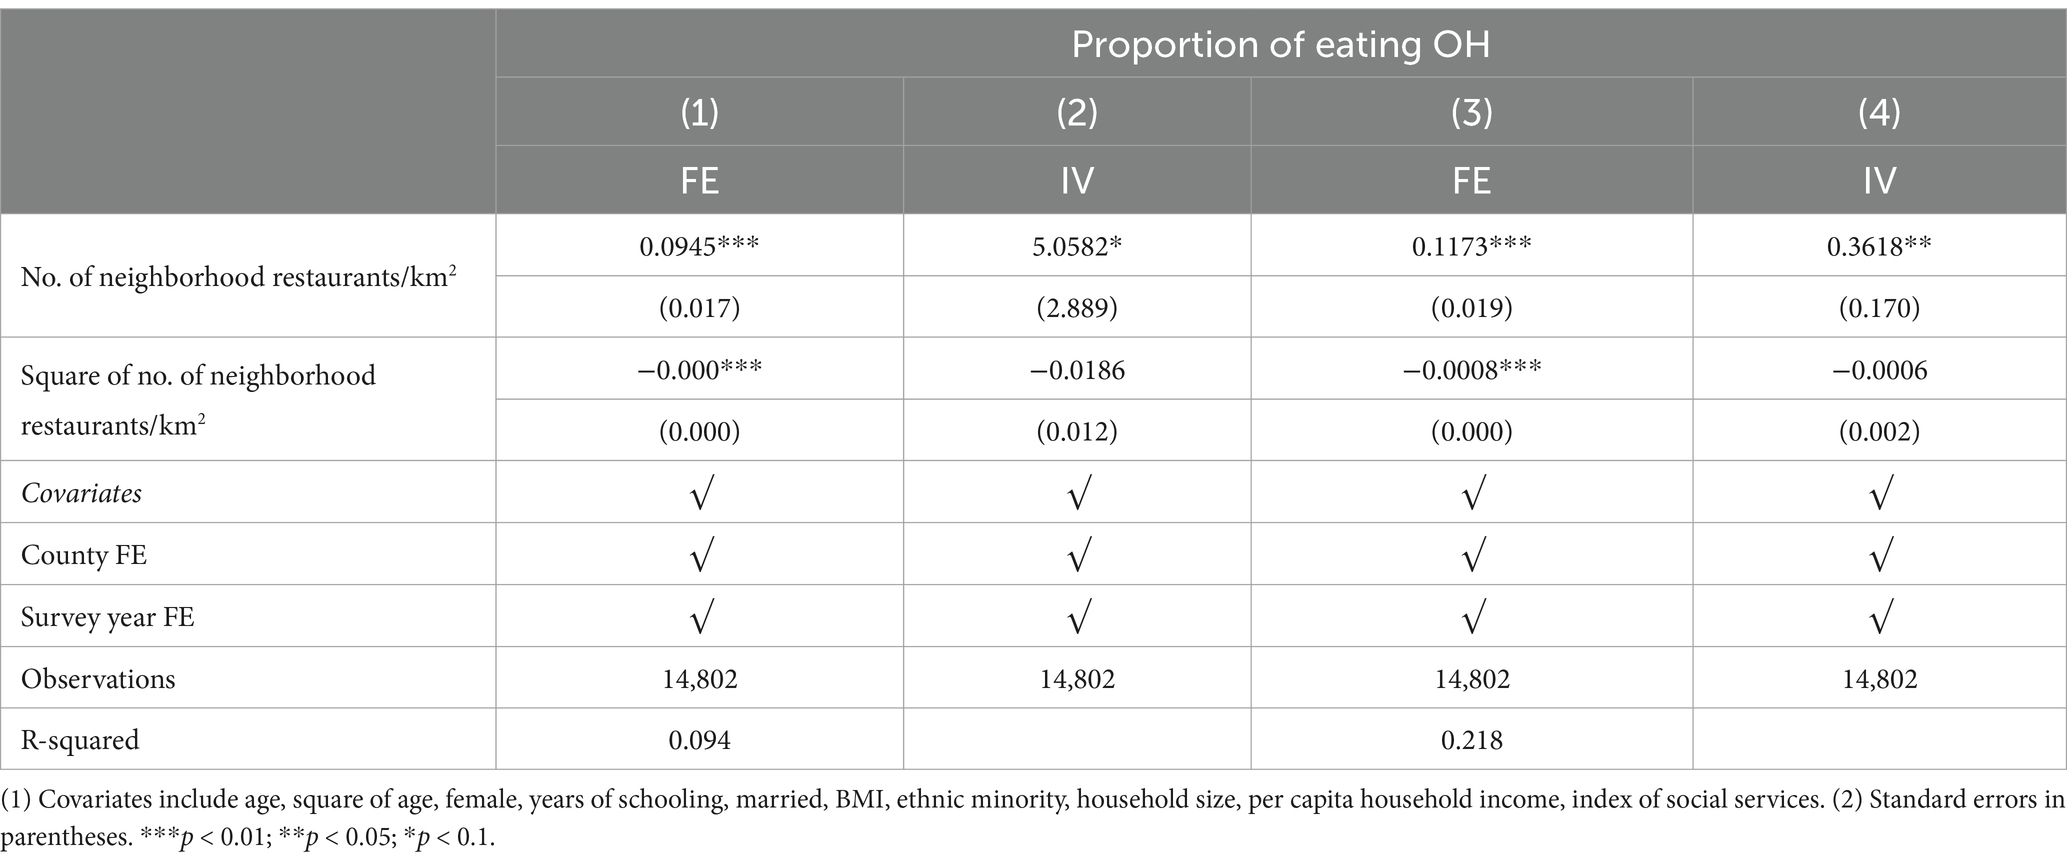
Table 7. Effects of neighborhood restaurant density on adults’ proportion of eating OH.
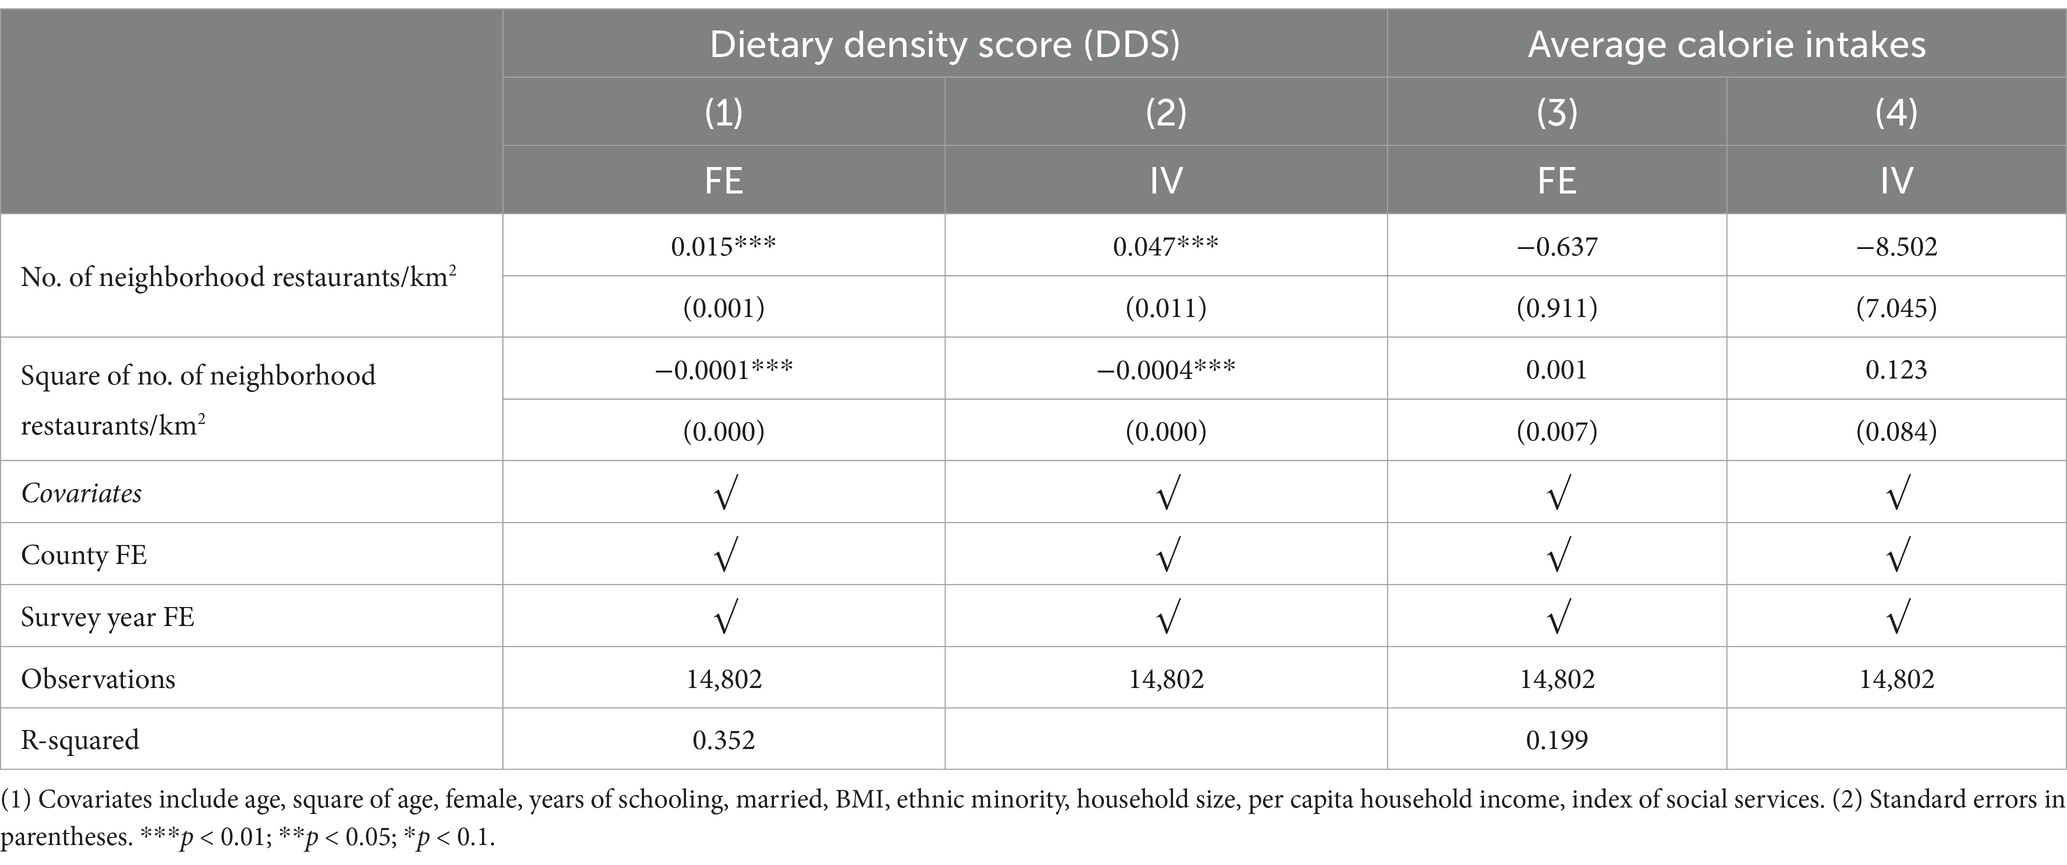
Table 8. Effects of neighborhood restaurant density on adults’ dietary diversity and calorie intake.
However, on the demand side, neighborhood restaurant density does not significantly predict adults’ preferences for a healthy diet (Table 9). It seems that residents’ dietary preferences might be more influenced by cultural and psychological factors (Biermann and Rau, 2020), limiting the influence of changes in the neighborhood food environment on altering these preferences. Overall, our findings suggest that in food deserts, higher restaurant density might lead to a more diverse food supply and enhance dietary diversity. In contrast, in food swamps, the clustering of restaurants contributes to a more monotonous diet. This finding is consistent with our previous results that density of neighborhood restaurant, particularly that of fast-food restaurant, reduces residents’ dietary quality beyond a threshold. These findings collectively enhance our understanding of the inverted U-shaped relationship between restaurant density and dietary quality.
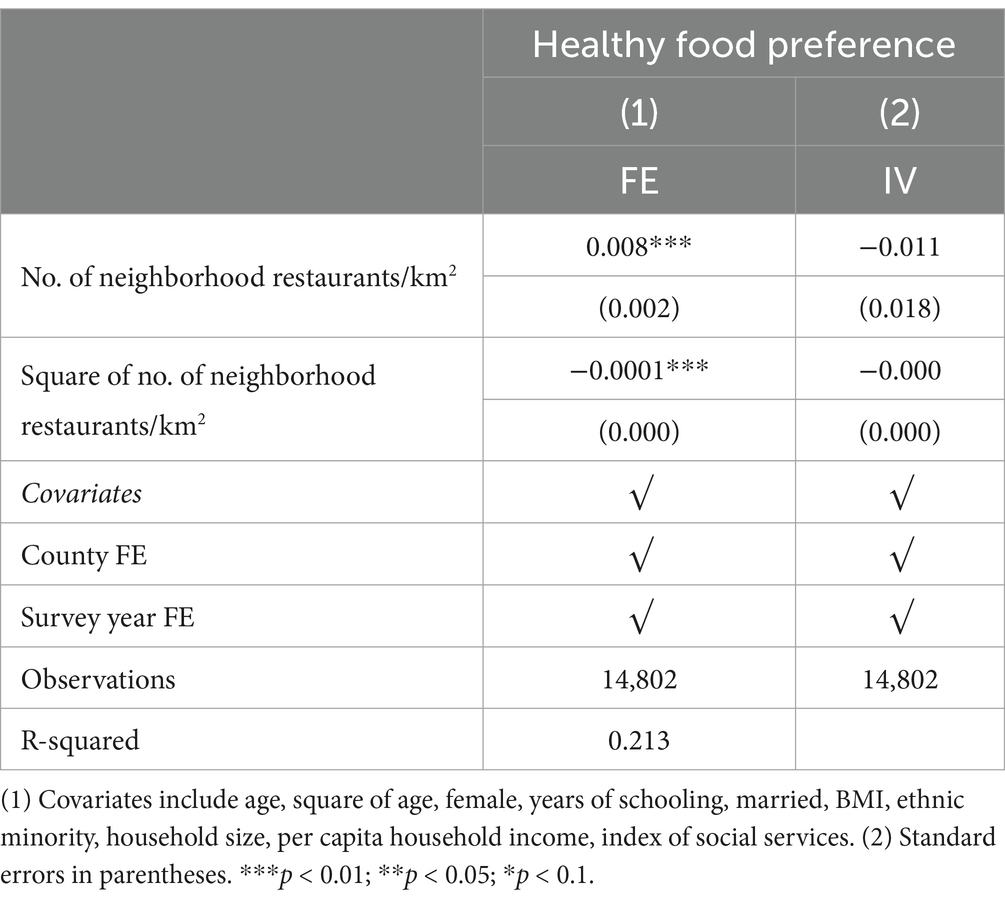
Table 9. Effects of neighborhood restaurant density on adults’ healthy food preference.
5 Conclusion
Promoting dietary transformation and dietary quality improvement constitutes an urgent development challenge for emerging countries undergoing economic growth, which is essential for promoting public health and sustainable development there. In this paper, taking the LASSO-chosen instrumental variable approaches and drawing on the 2004–2011 CHNS data covering 14,802 sample adults, we answer the following interesting questions: Whether higher density of neighborhood restaurant is beneficial for adults’ dietary quality? Whether the impacts differ in sub-groups? What is the potential mechanism underlying the impacts?
We document an inverted U-shaped relationship between restaurant density and adults’ dietary quality. Before reaching the threshold, higher density of neighborhood restaurant promotes the dietary quality, however, restaurant density above the threshold has a negative effect on one’s dietary quality. More precisely, before reaching the threshold, the positive impact of restaurant density on dietary quality is primarily driven by indoor restaurants. However, once the threshold is surpassed, the increase in fast food restaurant, rather than other types of restaurants, contributes to the deterioration of residents’ dietary quality. Moreover, the benefits of restaurant density differ in different sub-groups. Males with higher income and those from eastern China and urban areas experienced a shaper inverted U-shaped relationship than their counterparts. Further mechanism analyses show that restaurant density affects individuals’ diet quality by improving their frequency of eating OH. Furthermore, the similar inverted U-shaped relationships between restaurant density and dietary diversity, help explain why restaurant density fails to benefit adults in the environment of food swamp.
Our findings carry important policy implications for the ongoing dietary transformation in China and other developing countries, emphasizing the role of restaurant access in shaping individual diets. First, in neighborhoods trapped in food deserts, it is essential to improve access to restaurants and other food markets, such as encouraging the establishment of public indoor restaurants, like neighborhood cafeterias, etc. Second, in areas with overconcentrated restaurant densities, it is needed to focus on mitigating the potential negative effects on dietary quality, for example, by promoting a more diverse food supply in restaurants and encouraging healthy competition through differentiated menus. Last but not least, given the negative impact of excessive fast-food restaurants on dietary quality, it is needed to regulate the entry of fast-food restaurants within neighborhood and provide residents with necessary guidance of healthy consumption.
Data availability statement
The datasets presented in this study can be found in online repositories. The names of the repository/repositories and accession number(s) can be found at: https://www.cpc.unc.edu/projects/china.
Ethics statement
The studies involving humans were approved by the guidelines of the Declaration of Helsinki and approved by the Institutional Review Board of the University of North Carolina at Chapel Hill and the National Institute of Nutrition and Food Safety at the Chinese Center for Disease Control and Prevention (approval code: No. 201524, approval date: 20 August 2015). The studies were conducted in accordance with the local legislation and institutional requirements. The participants provided their written informed consent to participate in this study.
Author contributions
YT: Conceptualization, Data curation, Supervision, Writing – original draft. MZ: Data curation, Formal analysis, Software, Writing – original draft. JZ: Data curation, Methodology, Supervision, Writing – original draft. XZ: Conceptualization, Methodology, Supervision, Validation, Writing – review & editing. CL: Formal analysis, Methodology, Supervision, Writing – review & editing.
Funding
The author(s) declare that financial support was received for the research, authorship, and/or publication of this article. The authors acknowledge the financial support from the National Natural Science Foundation of China (grant numbers 72473020, 72261147472, and 71861147003).
Conflict of interest
MZ was employed by Minmetals Capital Company Limited.
The remaining authors declare that the research was conducted in the absence of any commercial or financial relationships that could be construed as a potential conflict of interest.
Generative AI statement
The authors declare that no Generative AI was used in the creation of this manuscript.
Publisher’s note
All claims expressed in this article are solely those of the authors and do not necessarily represent those of their affiliated organizations, or those of the publisher, the editors and the reviewers. Any product that may be evaluated in this article, or claim that may be made by its manufacturer, is not guaranteed or endorsed by the publisher.
Supplementary material
The Supplementary material for this article can be found online at: https://www.frontiersin.org/articles/10.3389/fsufs.2025.1530812/full#supplementary-material
Footnotes
1. ^Some studies show that increased exposure to fast-food restaurants has been linked to lower dietary quality (Burgoine et al., 2016; Moore et al., 2009). For instance, it is shown that the density of fast-food outlet predicts higher total grams of food intake, and more consumption of deep-fried foods (Burgoine et al., 2016). Also, some have revealed the insignificant association between restaurant exposure and healthy eating index (HEI) or unhealthy diet score (Auchincloss et al., 2021; Hoy et al., 2022; Madrigal et al., 2020). Meanwhile, exposing to certain types of restaurants in developing countries, including modern food retailers and local convenience stores, are found to bring dietary benefits (Khonje et al., 2020; Bodor et al., 2008).
2. ^The information on food prices comes from the community survey, where the average food price is calculated by averaging the prices of rice, vegetables, and meat.
3. ^As to the square of density of neighborhood restaurant, the LASSO-chosen IV differs a little, which is interaction of square of near open trade city (<2 h by train) and square of average food prices. Appendix Figure A1 reports the trend of the cross-validation error function CV(λ) as λ varies. The results indicate that as the regularization parameter λ decreases, the cross-validation error value function CV(λ) gradually decreases. The minimum value of CV(λ) is 0.57 when λ = 0.0028, thus the ideal value of the regularization parameter is λ_cv = 0.0028. Additionally, around the optimal value λ_cv., the cross-validation error function CV(λ) remains relatively flat, suggesting that small changes in λ near the optimal value have minimal impact on the model’s predictive performance.
References
Abrahamsson, S. S., Bütikofer, A., and Karbownik, K. (2023). Swallow this: childhood and adolescent exposure to fast food restaurants, BMI, and cognitive ability. Cambridge, Massachusetts: National Bureau of Economic Research, wp31226.
An, R. (2016). Fast-food and full-service restaurant consumption and daily energy and nutrient intakes in US adults. Eur. J. Clin. Nutr. 70, 97–103. doi: 10.1038/ejcn.2015.104
Asirvatham, J., Thomsen, M. R., Nayga, R. M., and Goudie, A. (2019). Do fast food restaurants surrounding schools affect childhood obesity? Econ. Hum. Biol. 33, 124–133. doi: 10.1016/j.ehb.2019.01.011
Auchincloss, A. H., Li, J., Moore, K. A., Franco, M., Mujahid, M. S., and Moore, L. V. (2021). Are neighbourhood restaurants related to frequency of restaurant meals and dietary quality? Prevalence and changes over time in the multi-ethnic study of atherosclerosis. Public Health Nutr. 24, 4630–4641. doi: 10.1017/S1368980021002196
Belloni, A., Chernozhukov, V., and Hansen, C. (2014). Inference on treatment effects after selection among high-dimensional controls. Rev. Econ. Stud. 81, 608–650. doi: 10.1093/restud/rdt044
Belloni, A., Chernozhukov, V., Hansen, C., and Kozbur, D. (2016). Inference in high-dimensional panel models with an application to gun control. J. Bus. Econ. Stat. 34, 590–605. doi: 10.1080/07350015.2015.1102733
Biermann, G., and Rau, H. (2020). The meaning of meat: (un)sustainable eating practices at home and out of home. Appetite 153:104730. doi: 10.1016/j.appet.2020.104730
Bodor, J. N., Rose, D., Farley, T. A., Swalm, C., and Scott, S. K. (2008). Neighbourhood fruit and vegetable availability and consumption: the role of small food stores in an urban environment. Public Health Nutr. 11, 413–420. doi: 10.1017/S1368980007000493
Burgoine, T., Forouhi, N. G., Griffin, S. J., Brage, S., Wareham, N. J., and Monsivais, P. (2016). Does neighborhood fast-food outlet exposure amplify inequalities in diet and obesity? A cross-sectional study. Am. J. Clin. Nutr. 103, 1540–1547. doi: 10.3945/ajcn.115.128132
China Cuisine Association. (2020). Annual report on catering industry development of China. Beijing.
Cummins, S. (2014). Wiley Blackwell encyclopedia of health, illness, behavior, and society. Ref. Rev. 28, 20–21. doi: 10.1108/RR-06-2014-0167
Currie, J., DellaVigna, S., Moretti, E., and Pathania, V. (2010). The effect of fast-food restaurants on obesity and weight gain. Am. Econ. J. Econ. Policy 2, 32–63. doi: 10.1257/pol.2.3.32
Debela, B. L., Demmler, K. M., Klasen, S., and Qaim, M. (2020). Supermarket food purchases and child nutrition in Kenya. Glob. Food. Secur. Agr. 25:100341. doi: 10.1016/j.gfs.2019.100341
Du, W., Su, C., Wang, H., Wang, Z., Wang, Y., and Zhang, B. (2014). Is density of neighborhood restaurants associated with BMI in rural Chinese adults? A longitudinal study from the China health and nutrition survey. BMJ Open 4:e004528. doi: 10.1136/bmjopen-2013-004528
Food and Agriculture Organization of the United Nations. (2011). Guidelines for measuring household and individual dietary diversity. Beijing.
Gao, S., Cuffey, J., Li, G., and Li, W. (2024). Diet in China during substantial economic growth: quality, inequality, trends, and determinants. China Agr. Econ. Rev. 86:102208. doi: 10.1016/j.chieco.2024.102208
Gordon-Larsen, P. (2014). Food availability/convenience and obesity. Adv. Nutr. 5, 809–817. doi: 10.3945/an.114.007070
He, P., Baiocchi, G., Hubacek, K., Feng, K., and Yu, Y. (2018). The environmental impacts of rapidly changing diets and their nutritional quality in China. Nat. Sustain. 1, 122–127. doi: 10.1038/s41893-018-0035-y
He, Y., Fang, Y., and Xia, J. (2018). Update of the Chinese diet balance index:DBI_16. Acta Nutr. Sin. 06, 526–530.
Hoy, M. K., Murayi, T., and Moshfegh, A. J. (2022). Diet quality of frequent fast-food consumers on a non-fast food intake day is similar to a day with fast food, what we eat in America, NHANES 2013-2016. J. Acad. Nutr. Diet. 122, 1317–1325. doi: 10.1016/j.jand.2022.02.007
Hua, Y., Zhang, Z., and Liu, A. (2022). Long-term diet quality and risk of diabetes in a national survey of Chinese adults. Nutrients 14:4841. doi: 10.3390/nu14224841
Huang, Y., and Tian, X. (2019). Food accessibility, diversity of agricultural production and dietary pattern in rural China. Food Policy 84, 92–102. doi: 10.1016/j.foodpol.2019.03.002
Khonje, M. G., Ecker, O., and Qaim, M. (2020). Effects of modern food retailers on adult and child diets and nutrition. Nutrients 12:1714. doi: 10.3390/nu12061714
Levy, D. E., Pachucki, M. C., O’Malley, A. J., Porneala, B., Yaqubi, A., and Thorndike, A. N. (2021). Social connections and the healthfulness of food choices in an employee population. Nat. Hum. Behav. 5, 1349–1357. doi: 10.1038/s41562-021-01103-x
Luo, H., Bian, D., Hong, H., Chen, J., Wang, B., Wang, J., et al. (2015). Application of adjusted dietary balance index to evaluate the dietary quality of adult residents in Xiamen city area. J. Hyg. Res.
Madrigal, J. M., Cedillo-Couvert, E., Ricardo, A. C., Appel, L. J., Anderson, C. A. M., Deo, R., et al. (2020). Neighborhood food outlet access and dietary intake among adults with chronic kidney disease: results from the chronic renal insufficiency cohort study. J. Acad. Nutr. Diet. 120, 1151–1162.e3. doi: 10.1016/j.jand.2019.12.013
Miller, V., Webb, P., Cudhea, F., Shi, P., Zhang, J., Reedy, J., et al. (2022). Global dietary quality in 185 countries from 1990 to 2018 show wide differences by nation, age, education, and urbanicity. Nat. Food 3, 694–702. doi: 10.1038/s43016-022-00594-9
Moore, L. V., Diez Roux, A. V., Nettleton, J. A., Jacobs, D. R., and Franco, M. (2009). Fast-food consumption, diet quality, and neighborhood exposure to fast food: the multi-ethnic study of atherosclerosis. Am. J. Epidemiol. 170, 29–36. doi: 10.1093/aje/kwp090
Murakami, K., Livingstone, M. B. E., and Sasaki, S. (2018). Thirteen-year trends in dietary patterns among Japanese adults in the national health and nutrition survey 2003–2015: continuous westernization of the Japanese diet. Nutrients 10:8. doi: 10.3390/nu10080994
Patel, O., Shahulhameed, S., Shivashankar, R., Tayyab, M., Rahman, A., Prabhakaran, D., et al. (2018). Association between full service and fast-food restaurant density, dietary intake and overweight/obesity among adults in Delhi, India. BMC Public Health 18:36. doi: 10.1186/s12889-017-4598-8
Ren, Y., Zhao, J., Glauben, T., and Castro Campos, B. (2022). Supermarket environment and nutrition outcomes: evidence from rural China. J. Rural. Stud. 92, 79–92. doi: 10.1016/j.jrurstud.2022.03.019
Rogus, S., Athens, J., Cantor, J., and Elbel, B. (2018). Measuring Micro-level effects of a new supermarket: do residents within 0.5 mile have improved dietary behaviors? J. Acad. Nutr. Diet. 118, 1037–1046. doi: 10.1016/j.jand.2017.06.360
Rose, D., Bodor, J., Swalm, C., Rice, J., Farley, T., and Hutchinson, P.. (2009). Deserts in New Orleans? Illustrations of urban food access and implications for policy. Tulane: Tulane University.
Sibhatu, K. T., Krishna, V. V., and Qaim, M. (2015). Production diversity and dietary diversity in smallholder farm households. Proc. Natl. Acad. Sci. 112, 10657–10662. doi: 10.1073/pnas.1510982112
Strupat, C., Farfán, G., Moritz, L., Negre, M., and Vakis, R. (2021). Obesity and food away from home: what drives the socioeconomic gradient in excess body weight? Econ. Hum. Biol. 43:101048. doi: 10.1016/j.ehb.2021.101048
Su, X., Zhu, W., Li, N., Sun, J., Zhu, Y., Liu, T., et al. (2020). Adjusting DBI-2016 to dietary balance index for Chinese maternal women and assessing the association between maternal dietary quality and postpartum weight retention: a longitudinal study. PLoS One 15:e0237225. doi: 10.1371/journal.pone.0237225
Thornton, L. E., Bentley, R. J., and Kavanagh, A. M. (2009). Fast food purchasing and access to fast food restaurants: a multilevel analysis of VicLANES. Int. J. Behav. Nutr. Phy. 6, 28–10. doi: 10.1186/1479-5868-6-28
Tian, X., and Yu, X. (2015). Using semiparametric models to study nutrition improvement and dietary change with different indices: the case of China. Food Policy 53, 67–81. doi: 10.1016/j.foodpol.2015.04.006
Tian, X., Zhong, L., von Cramon-Taubadel, S., Tu, H., and Wang, H. (2016). Restaurants in the neighborhood, eating away from home and BMI in China. PLoS One 11:e0167721. doi: 10.1371/journal.pone.0167721
Usman, M. A., and Haile, M. G. (2022). Market access, household dietary diversity and food security: evidence from eastern Africa. Food Policy 113:102374. doi: 10.1016/j.foodpol.2022.102374
WHO (2017). Ambition and action in nutrition: 2016–2025. Geneva, Switzerland: World Health Organization.
Yang, Y., Wang, G., and Xinchang, P. (2000). China food composition table. Beijing: Beijing Medical University Press.
Zang, J., Yu, H., Zhu, Z., Lu, Y., Liu, C., Yao, C., et al. (2017). Does the dietary pattern of Shanghai residents change across seasons and area of residence: assessing dietary quality using the Chinese diet balance index (DBI). Nutrients 9:3. doi: 10.3390/nu9030251
Keywords: neighborhood restaurant environment, food desert, dietary diversity, dietary quality, diet balance index
Citation: Tang Y, Zhu M, Zong J, Zheng X and Liu C (2025) Impacts of neighborhood restaurant density on adults’ dietary quality: evidence from an IV-LASSO approach in China. Front. Sustain. Food Syst. 9:1530812. doi: 10.3389/fsufs.2025.1530812
Edited by:
Juan Lu, Nanjing Agricultural University, ChinaReviewed by:
Li Zheng, Shanghai Normal University, ChinaShangtong Gao, Renmin University of China, China, in collaboration with reviewer LZ
Ge Wang, Zhejiang University, China
Copyright © 2025 Tang, Zhu, Zong, Zheng and Liu. This is an open-access article distributed under the terms of the Creative Commons Attribution License (CC BY). The use, distribution or reproduction in other forums is permitted, provided the original author(s) and the copyright owner(s) are credited and that the original publication in this journal is cited, in accordance with accepted academic practice. No use, distribution or reproduction is permitted which does not comply with these terms.
*Correspondence: Xuyuan Zheng, emhlbmd4dXl1YW5AZmFmdS5lZHUuY24=
†These authors have contributed equally to this work and share first authorship