- Institute of Agricultural Economics and Development, Chinese Academy of Agricultural Sciences, Beijing, China
Investigating the impact of tillage system on agricultural production and farmer income, particularly in the face of global threats to food security and adverse environmental conditions, holds considerable importance for guiding policy formulation. This study employs a stochastic frontier analysis to estimate the technical efficiency of wheat production, utilizing data from 234 typical farms across 29 countries for the period 2012–2022. The technical efficiency range for wheat production varies from 0.257 to 0.976, with an average value of 0.830. Additionally, the impact of tillage system on technical efficiency and grain revenue is examined using propensity score matching. The findings indicate that there is no significant difference in technical efficiency between conservation tillage and traditional tillage. Furthermore, compared to conservation tillage, traditional tillage leads to higher grain revenue. Policymakers should evaluate technological adoption comprehensively, considering economic, social, and environmental aspects. Special attention should be directed toward assessing the economic benefits for farmers.
1 Introduction
Taking into account the multifaceted impacts of the tillage system (TS) is of great significance for a comprehensive understanding and appreciation of its adaptability. The existing body of research suggests that substantial and far-reaching impacts of tillage systems on soil (Vallejos et al., 2024; Kladivko, 2001; Martínez et al., 2008), crops (Nenge et al., 2025; Husnjak et al., 2002; Yusuf et al., 1999) and the environment (Singh et al., 2024; Abdalla et al., 2013; Oorts et al., 2007).
Tillage systems can be broadly categorized into traditional tillage (TT) and conservation tillage (CT). Conservation tillage has been extensively researched for its positive environmental externalities (Michler et al., 2019; Smith et al., 1998). By adopting practices such as reduced tillage, no tillage, direct seeding, and crop residue cover, conservation tillage significantly reduces soil erosion caused by water and wind, thereby protecting soil and water resources (Unger and McCalla, 1980). Since the introduction of conservation tillage in the early 1960s, the increasing issues of soil erosion, non-point source pollution, and rising fuel costs have led to a growing adoption of conservation tillage (Logan et al., 1991). However, whether conservation tillage are as productive as traditional tillage is a controversial issue (Su et al., 2021).
Recent research comparing traditional tillage and conservation tillage has found adoption of conservation tillage can lead to increased technical efficiency (Aravindakshan et al., 2018; Tanursaz et al., 2021). Studies such as that conducted by Schwab et al. (2002) have shown that the cotton yield under conservation tillage is 16% higher than conventional cultivation. In contrast to earlier findings, however, no evidence of a significant change in technical efficiency with the shift to no tillage was detected (Clovis, 1999; Sankranti and Langemeier, 2004). And crop yields with conservation tillage are either lower than or comparable to those with traditional tillage (Chetan et al., 2017; Stanek Tarkowska et al., 2018). An experiment conducted at the Agricultural Research and Development Station (ARDS) in Turda demonstrated that: Yields in the unconventional systems (minimum tillage) were similar to those achieved in the conventional system, while a slight decrease in yield was observed in the no-tillage system (Filip et al., 2024). It can clearly be seen that previously published studies on the effect of conservation tillage are inconsistent.
Current research affirms the positive environmental effects of conservation tillage, however, the effectiveness of conservation tillage on agricultural production compared to conventional tillage is debated.
The adoption of conservation tillage systems is gradually expanding (Derpsch et al., 2010). However, the choice and adoption of tillage systems are largely self-determined by farmers, although government departments may provide some guiding influence. Whether in developing or developed countries, the primary factor influencing the choice is often based on economic considerations for farmers (Pannell, 1999). To avoid potential economically disastrous consequences, a thorough risk assessment is necessary before transitioning to conservation tillage practices (Allmaras and Dowdy, 1985).
Based on the above, the main objective of this research is to determine whether there are notable differences in technical efficiency for agriculture production between non-traditional and traditional tillage systems, taking wheat production as an example, and to assess the impact of conversion to conservation tillage on farmers’ incomes.
To achieve this goal, this study investigates the impact of tillage systems on wheat production technology efficiency and farmers’ income. Data for this study were obtained from agri benchmark. This paper uses data on wheat production from 234 typical farms globally from 2012–2022. The choice of wheat is due to its status as the world’s largest cereal crop, crucial for the majority of the global population’s food supply. In order to achieve the goal of identifying the differences in agricultural production between two tillage systems, the approach to empirical research adopted for this study was propensity score matching. It can effectively address the selection bias and confounding variables.
This study exhibits remarkable novelty when compared to existing research in the following aspects. Regarding the research focus, previous studies have extensively investigated the impacts of tillage systems on aspects such as soil, crops, and the environment. However, very few studies have focused on the impact of these tillage practices on farmers’ agricultural income and technical efficiency. The current study aims to fill this gap by identifying the differences in technical efficiency for agricultural production between conservation and traditional tillage systems and assessing their impact on farmers’ incomes. While previous research has confirmed the positive role of conservation tillage in the environment, its impacts on agricultural production and household income have remained controversial. This paper presents new evidence to elucidate the impact of conservation tillage on the technical efficiency of agricultural production and farmers’ income.
In terms of geographical scope and sample representation, previous investigations often centered on specific regions, lacking in-depth exploration of a wide range of areas (Langemeier, 2010; Chetan et al., 2016; Demir and Gözübüyük, 2020). In contrast, this study collected data on wheat production from 234 typical farms worldwide from 2012 to 2022. The selection of a large and globally representative sample enables more reliable inferences. This study also represents the first empirical analysis on a global scale to verify the effects of tillage systems on agricultural production. From the perspective of the research method, many existing studies have analyzed the differences between conservation tillage and traditional tillage in terms of crop yield through natural experimental approaches (Cantero Martínez et al., 2007; Jordan et al., 2001). However, this study employs the propensity score matching method for empirical research. This approach can effectively overcome selection bias and confounding variables. Compared with previous methods, it is a distinct and more targeted way to achieve the goal of accurately identifying the differences in agricultural production between the two tillage systems.
The remaining part of the paper proceeds as follows. Section 2 presents the method and data used for this study. Section 3 discusses the estimation results and main findings. Section 4 is concerned with the heterogeneity analysis and further discussion. Finally, section 5 concludes the paper.
2 Materials and methods
2.1 Data
The data used in this research comes from agri benchmark. Agri benchmark is a global, non-profit network of agricultural economists, advisors, producers and specialists in key sectors of agricultural and horticultural value chains. We primarily use data from the agri benchmark Cash Crop Network, which includes agricultural production systems, cost structures and competitiveness of typical farms worldwide. The Standard Operating Procedure (SOP) for identifying typical farms in participating countries is detailed in the Chibanda et al. (2020).
In this study, we analyze wheat production data of 234 typical farms from 29 countries in 2012–2022. The distribution of the sample countries is shown in Figure 1. These include 14 developed countries and 15 developing countries. During the survey period, typical farms maintained a consistent tillage system, with very few farms changing their tillage practices. Among them, 123 farms practiced conservation tillage, while the remaining followed traditional tillage methods.
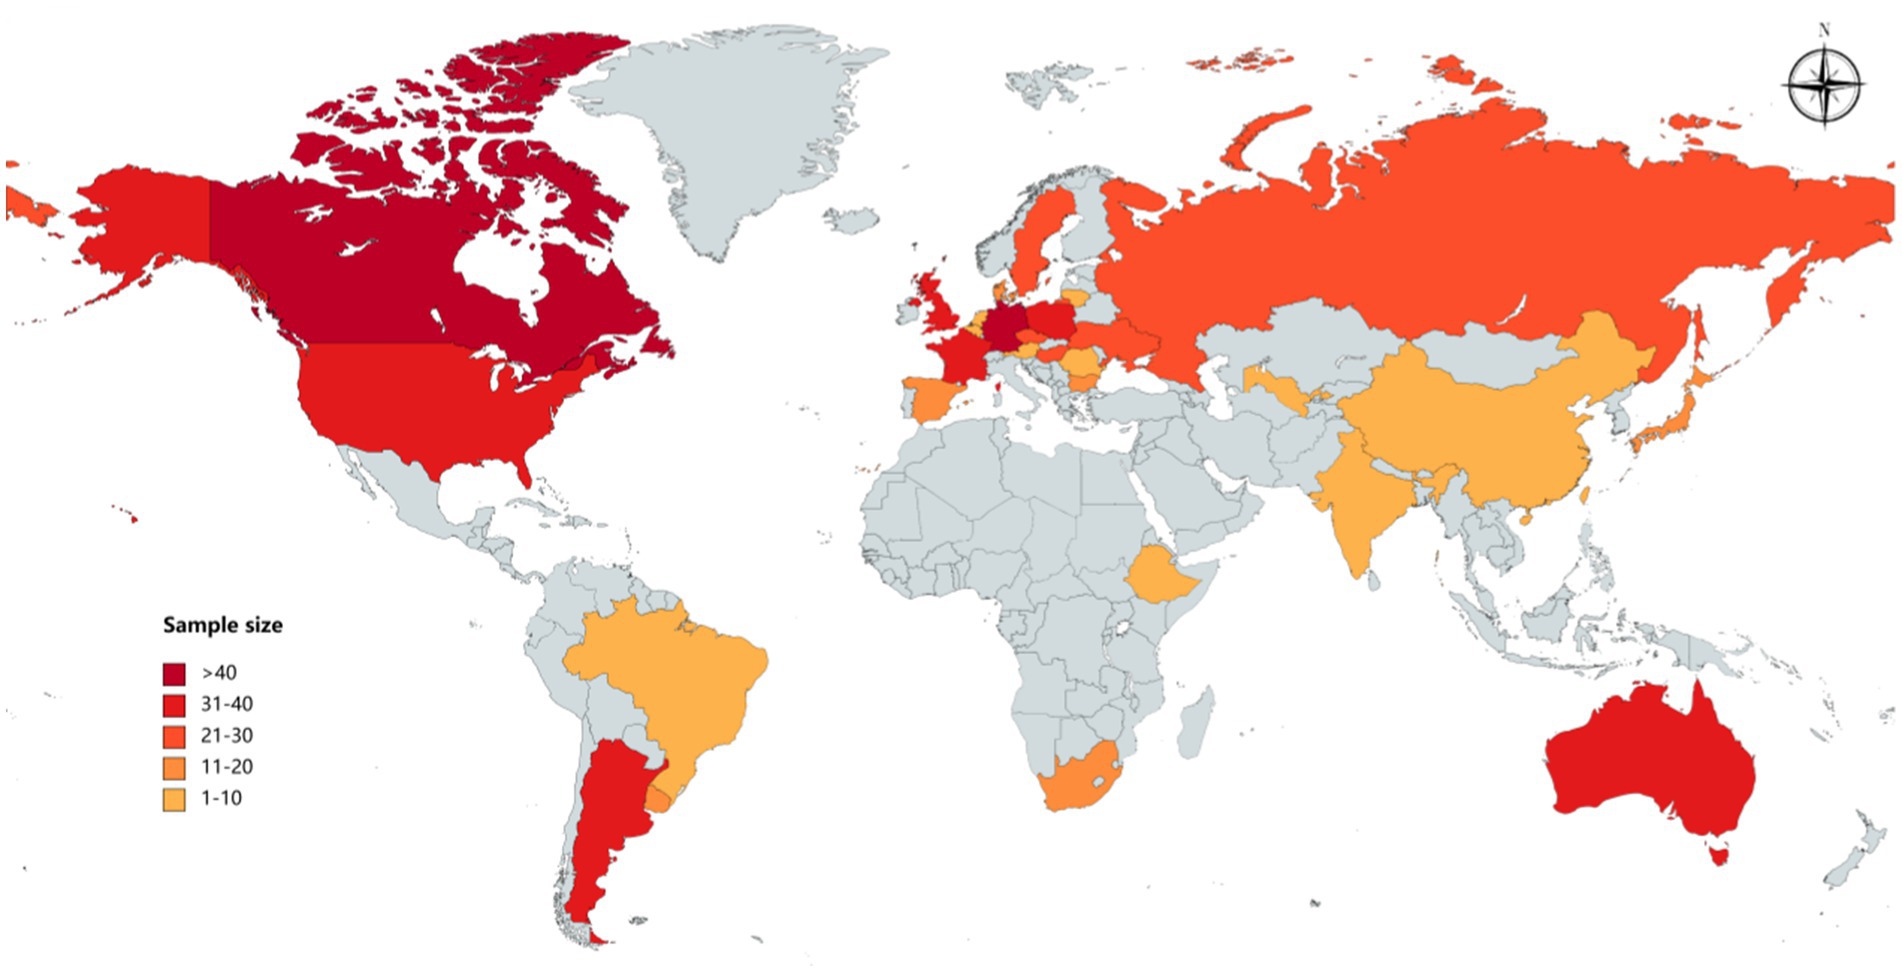
Figure 1. Distribution of sample countries. The figure shows the geographic location of the 29 sample countries. The colors indicate the sample size for each country. Only part of the world map is shown in the figure.
2.2 Methods
2.2.1 TE measures: stochastic frontier model
To verify whether different tillage systems lead to differences in technical efficiency, we first measure the technical efficiency of wheat production on each typical farm. Technical efficiency measurement primarily comprises parametric and non-parametric methods. Parametric methods refer mainly to stochastic frontier analysis, while non-parametric methods refer to data envelopment analysis. This article employs the parameter analysis method for measuring technical efficiency. The use of stochastic frontier analysis is advantageous in overcoming issues arising from noise and uncertainty in real-world data. It is capable of effectively handling random errors in the data, thereby enhancing the accuracy and robustness of technical efficiency assessments. The stochastic frontier production function is generally expressed as Equation (1):
where is the output of farm i in t year; is a vector of inputs; t is time variable; β is a vector of parameters to be estimated; is a random error and ~iid (0, ); denotes technical inefficiency in production process, which is presumed to be non-negative and distributed independently of .
Technical efficiency can be expressed as Equation (2):
The stochastic frontier analysis has two functional forms with the Cobb–Douglas functional form and the translog specification. In order to determine the functional form, the log-likelihood ratio (LR) test is used (Mahmood et al., 2020), as the following Equation (3):
Appendix Table A1 shows the results of the LR test, which rejects the Cobb–Douglas specification at = 5%. The translog specification is more adaptable than the Cobb–Douglas functional form (Shi et al., 2022). In this study, we use the translog production function form to measure the technical efficiency of wheat production. The wheat yield per hectare serves as the output variable, and input variables include labor, capital, and energy. Additionally, considering temporal variations, we introduce a time variable into the model. The specific model is set as follows:2
In Equation (4) is the wheat yield per ha; i refers to farm i; t = 1, 2, …, 11 denotes the year from 2012 to 2022, which captures technical progress as a time trend; is the labor input per ha; is material input per hectare, which is measured by cash costs of seeds, fertilizers and pesticides; is energy input per hectare, including petrol, diesel and others.
2.2.2 Propensity score matching
According to the tillage system adopted by typical farms, samples are divided into treatment groups and control groups, with farms employing conservation tillage as the treatment group. Since the selection of tillage systems on farms is not random and is influenced by local planting traditions and natural conditions, we employ the propensity score matching method to minimize this bias. The advantage of propensity score matching is that it can solve the problem of sample self-selection, thus effectively dealing with the endogeneity problem caused by sample self-selection bias. The propensity score matching method involves three steps: first, calculating the propensity scores by using the logistic model; second, selecting the matching method. Matching algorithms include nearest neighbor, caliper and radius, stratification and interval, kernel and local linear, and weighting. It is important to note that there is no perfect algorithm without weaknesses (Haile et al., 2024). This study selects the nearest neighbor matching, radius (caliper) matching, nearest neighbor matching within calipers and kernel matching within calipers. These methods have different emphasis on the matching quality and quantity of them, with no obvious difference between the advantages and disadvantages, and their differences focus on the consistency of the estimator (Becker and Ichino, 2002); third, estimating of average treatment effect (ATE).
The propensity scores are calculated using the following Equation (5):
where is the propensity score of farm i, Ti denotes whether or not the farm i adopting conservation tillage. If adopting, the value is equal to one or otherwise zero. Xi denotes a set of covariates that affects the outcome. The logistic of Ti is then used as the dependent variable along with j covariates of Ti to perform a logistic regression as shown in Equation (6):
ATT is calculated by the following Equation (7):
where and indicate the technical efficiency of typical farms adopting conservation tillage and conventional tillage, respectively, for conservation tillage and for conventional tillage. indicates the probability of a typical farm adopting conservation tillage, as calculated from the logistic model. represents the technical efficiency of typical farms that adopt conservation tillage when it do not. This is a counterfactual estimate that is unobservable, thus assuming Equation (8):
2.3 Variables setting
2.3.1 Treatment variable
Tillage system. Treatment variable is dummy variable for tillage system, with 1 for conservation tillage and 0 for conventional tillage.
2.3.2 Outcome variables
The outcome variables are technical efficiency (TE) and grain revenue (GR) of wheat production on typical farms.
Technical efficiency. To calculate technical efficiency, wheat yield per hectare was set as the output variable, and the input variables were labor, capital, energy and time variables to reflect the trend of technical efficiency over time.
Grain revenue. All income earned on a typical farm through wheat production.
2.3.3 Selection of covariates
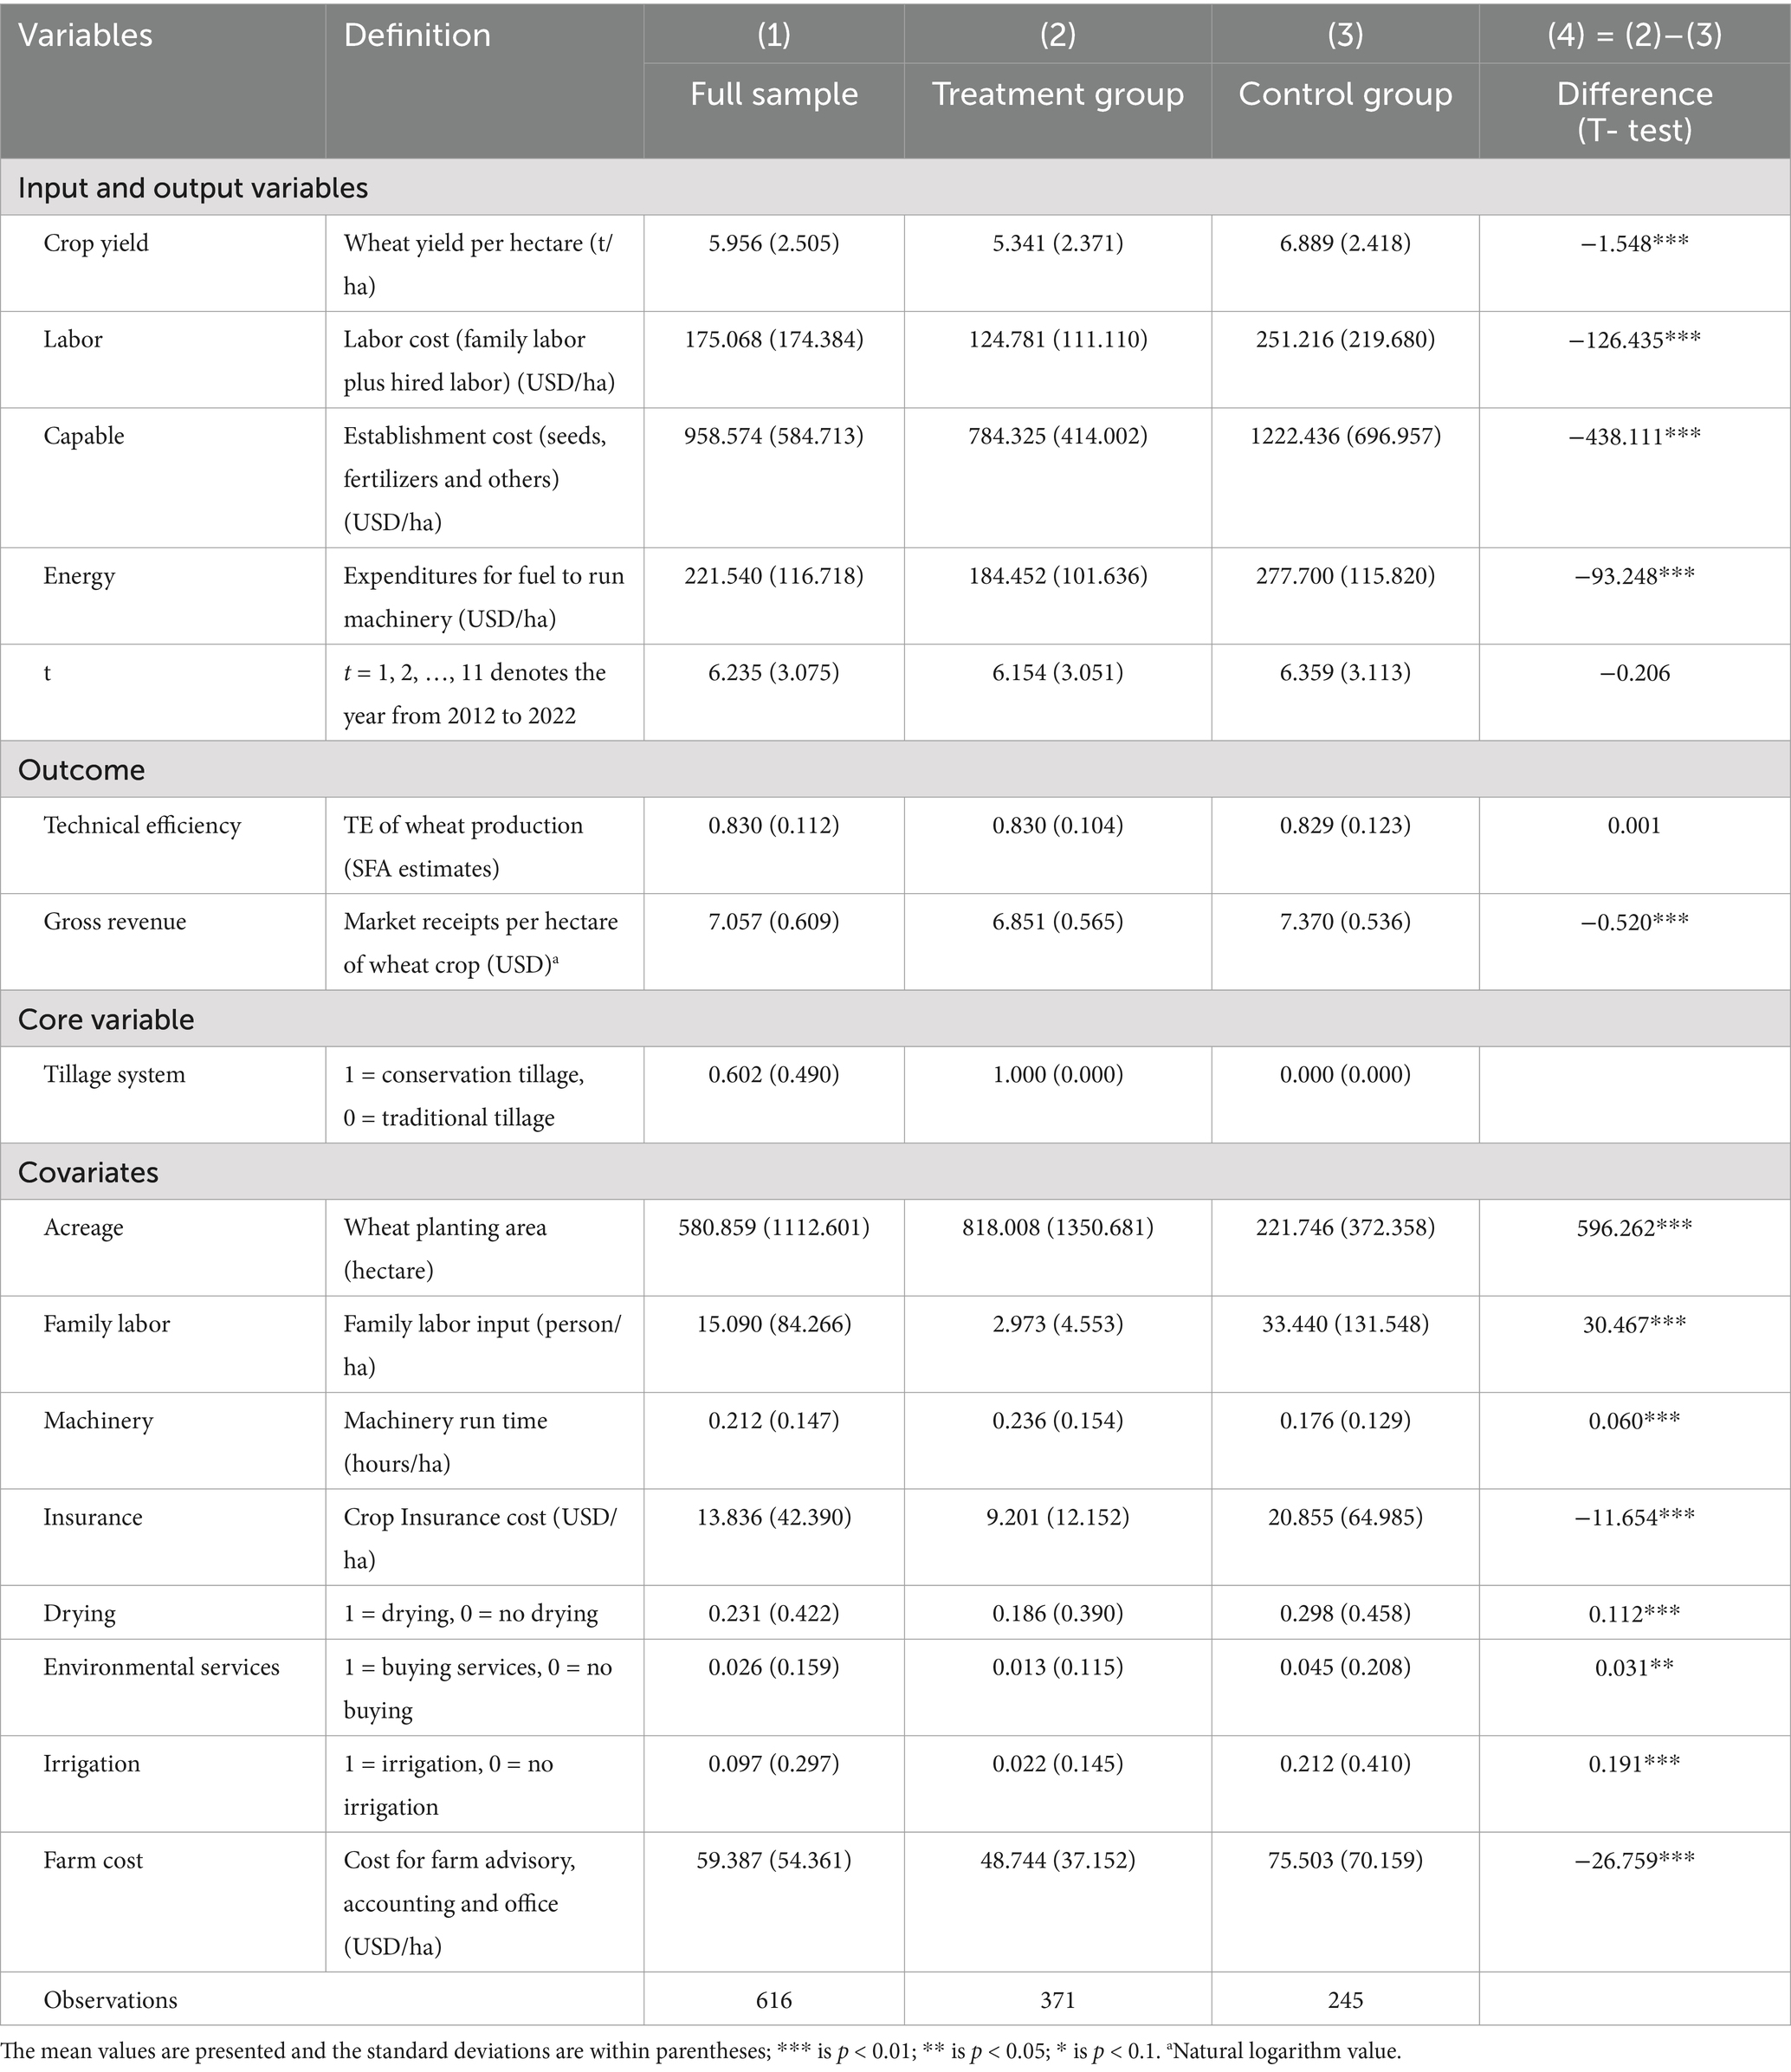
The selection of covariates is used to control for differences in the two sets of outcome variables due to confounding variables. The number of choices should be appropriate; too many variables leads to few matched samples, while too few variables leads to inaccurate matching and thus affects the estimation. In total, eight covariates are selected, including acreage, family labor, machinery, insurance, drying, environmental services, irrigation and farm cost. Table 1 provides definitions and descriptive statistics for all variables.
3 Results and discussion
3.1 TE measures: the result of stochastic frontier model
Table 2 reports the regression results of translog production function. The elasticity coefficients of labor, capital, and energy all pass the T- test significantly, with the coefficient for capital being positive and those for labor and energy being negative. The output elasticities of both capital and the square of capital also pass the T- test. The elasticity coefficients are positive and negative at the 1% level of significance, respectively. This suggests that an increase in inputs related to establishment cost, such as seeds, fertilizers, and pesticides, within a certain range, leads to an improvement in output. However, surpassing the turning point may result in losses and pollution. Additionally, the interaction coefficients between labor and capital, as well as labor and energy, are significantly positive at the 5% level. This indicates that the combination of labor with either capital or energy inputs promotes wheat production.
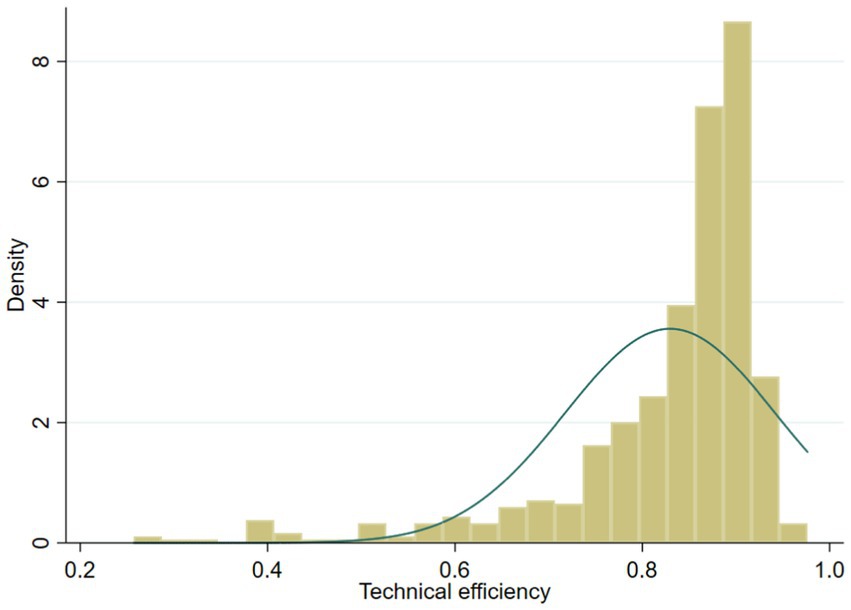
The density distribution of the calculated technical efficiency for typical farms is illustrated in Figure 2. Over the research period from 2012 to 2022, the technical efficiency range for wheat production varies from 0.257 to 0.976, with an average value of 0.830. Approximately 33% of farms exhibit technical efficiency levels below the mean. Farms with technical efficiency above 0.9 constitute 25% of the total, while the proportion within the range of 0.8 to 0.9 is 51%, indicating that over half of the typical farms are technically efficient. The percentage of farms with technical efficiency between 0.7 and 0.8 is 14% and below 0.6 is 10%.
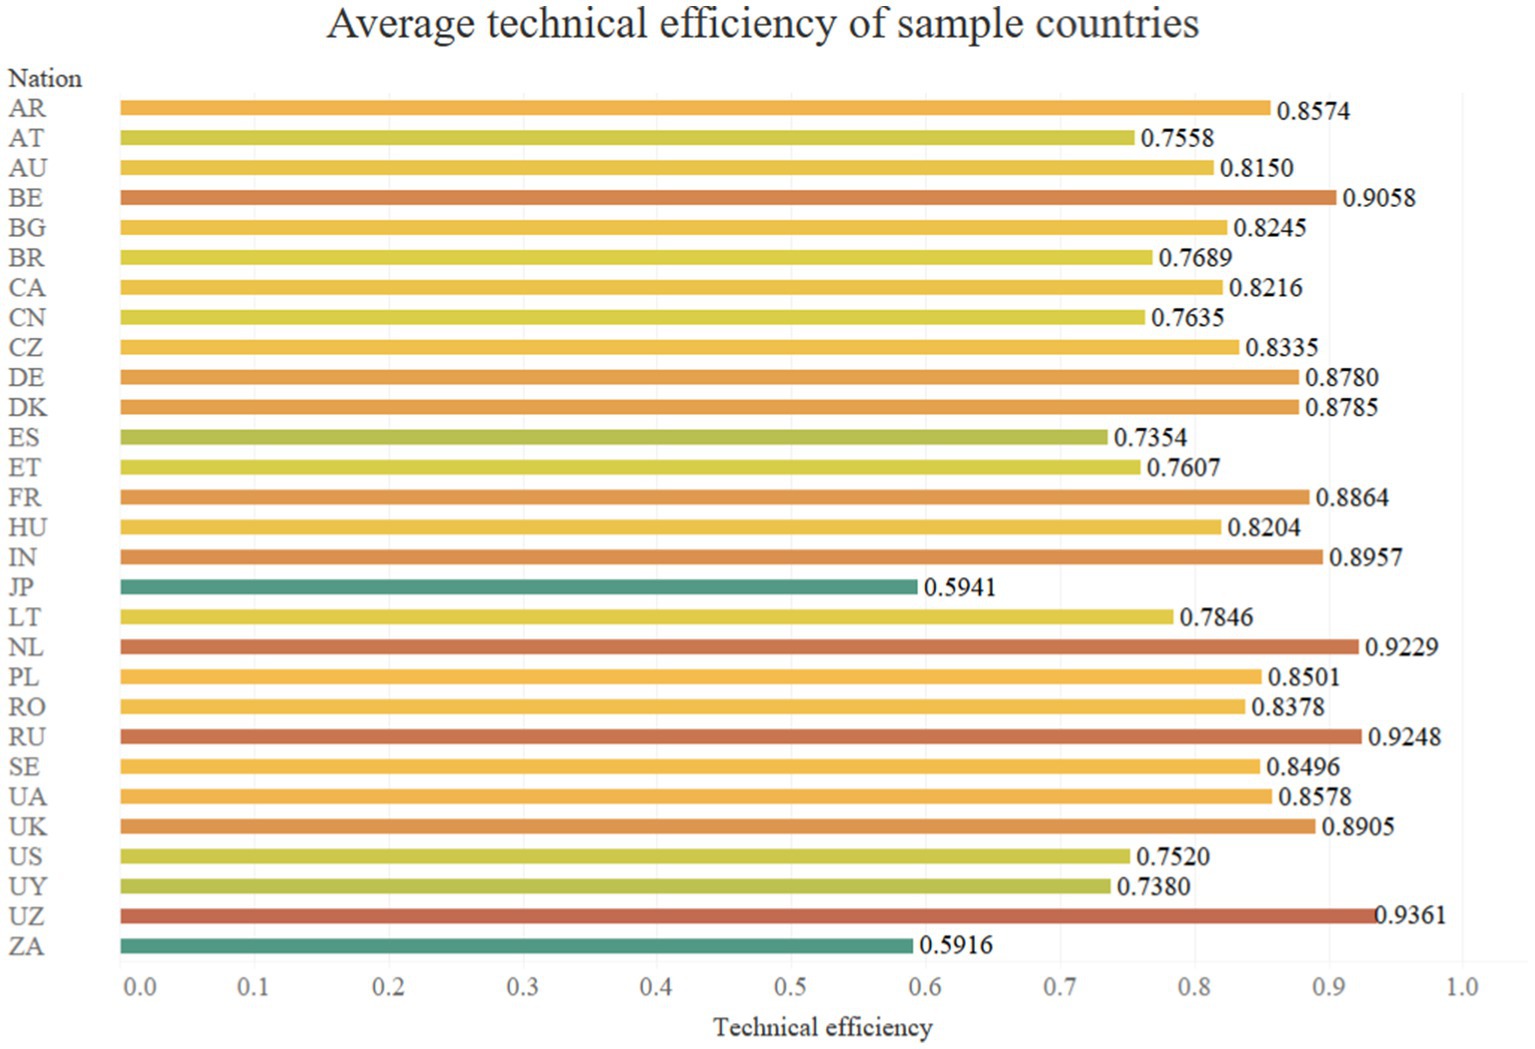
Uzbekistan exhibits the highest technical efficiency in wheat production, reaching 0.94, while South Africa has the lowest at 0.59. Among developed countries, the Netherlands demonstrates the highest technical efficiency at 0.92, whereas Japan has the lowest at 0.59. There are four countries with technical efficiency exceeding 0.9. In addition to Uzbekistan and the Netherlands, there are also Russia and Belgium. The average technical efficiency for the sample countries is 0.82, with 11 countries having an average technical efficiency below this mean. This group includes five developed countries and six developing countries. Figure 3 illustrates the calculated average technical efficiency values for each country in the sample.
3.2 Impact of TS on TE and GR: PSM estimates
3.2.1 Logistic model estimation results
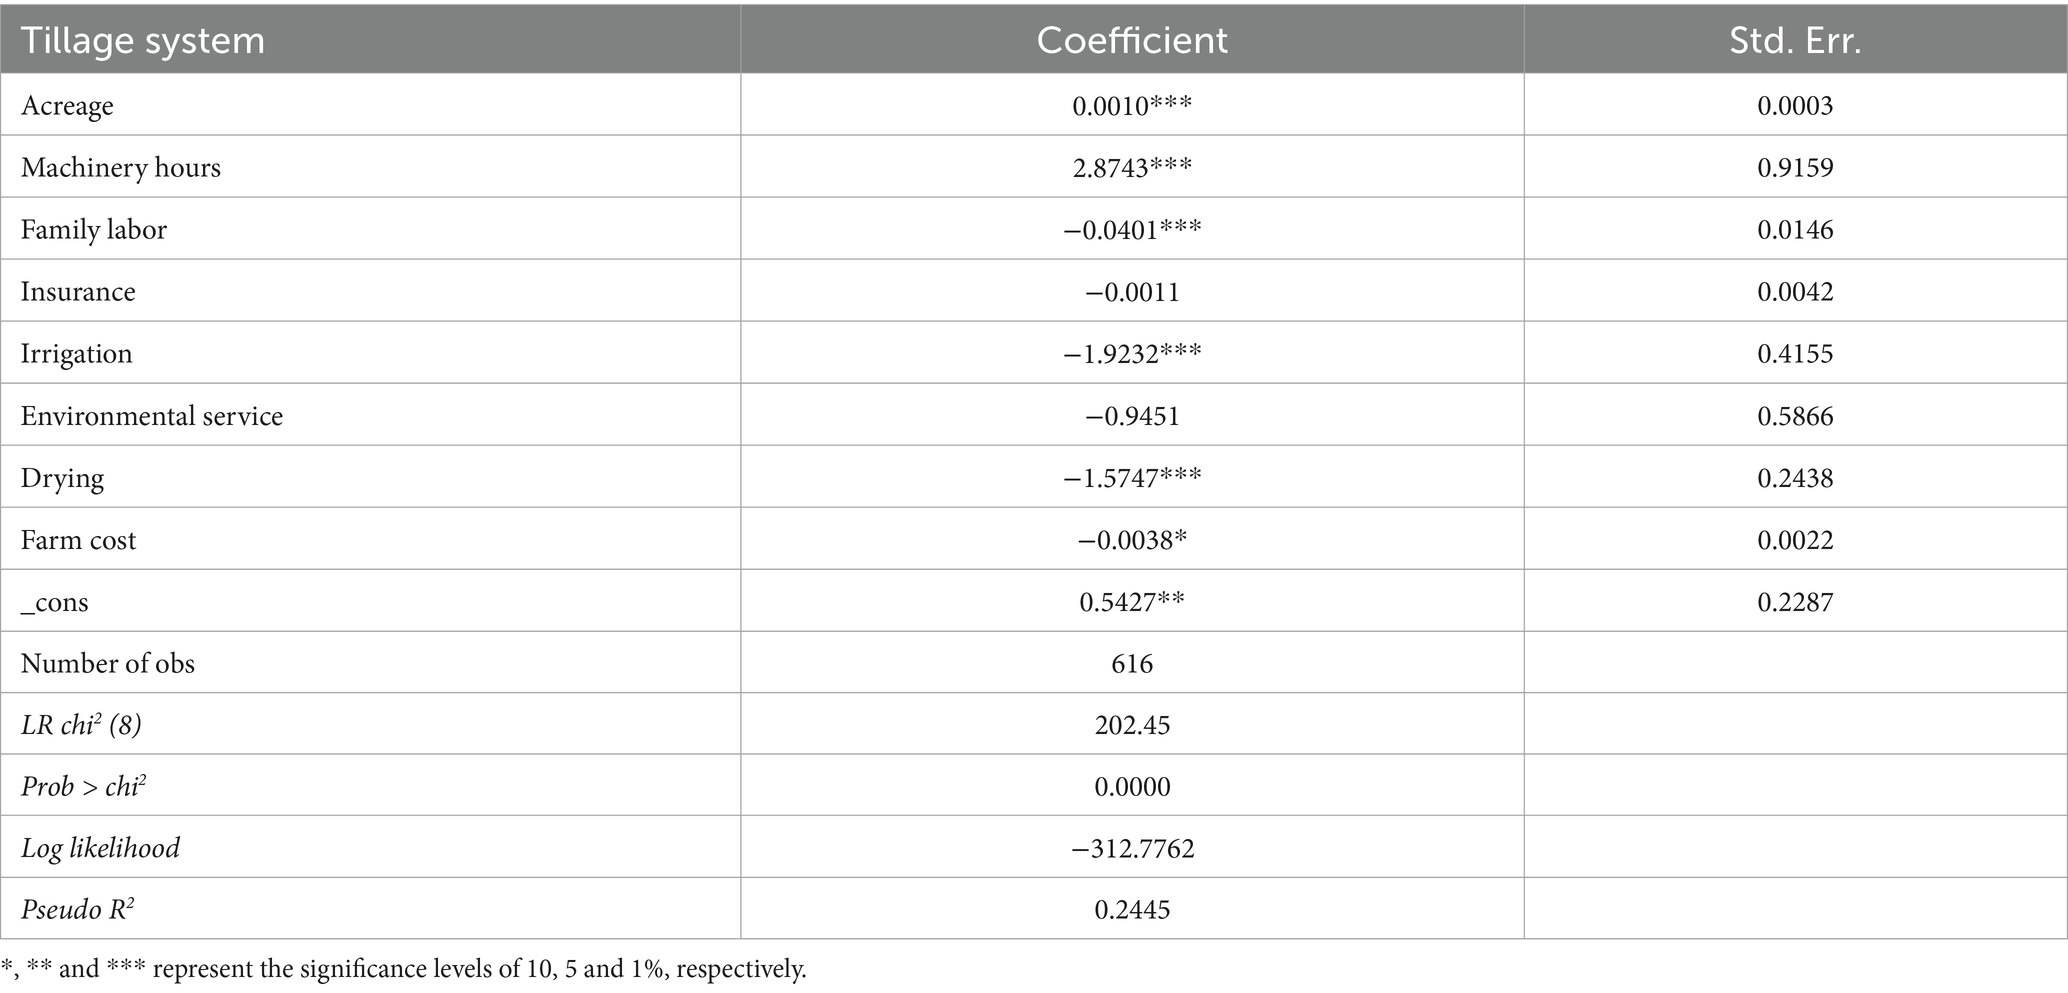
The focus of this study is not concerned with the significance and detailed interpretation of the variables in the model, the main role of the logistic model is to reduce the dimensionality and get the propensity score to facilitate the next step of matching. As can be seen from Table 3, the main factors influencing the tillage system adopted by typical farms are operating area, machinery hours, inputs of family labor, whether or not irrigation is carried out, whether or not drying is carried out and farm cost.
3.2.2 Common support and balance tests
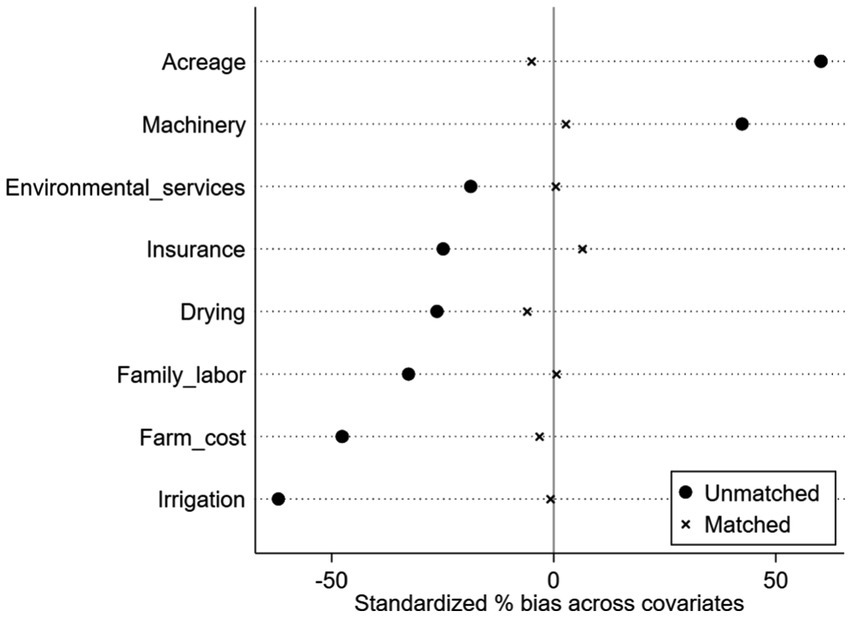
One important purpose of propensity score matching is to balance the distribution of covariates between the treatment and control groups. Therefore, after matching, it is essential to conduct a balance test to ensure that, apart from differences in the outcome variable, there are no significant systematic differences in covariates between the two groups of farms. The results of the balance test using the kernel radius cal (0.05) matching method for before and after matching covariates are presented in Appendix Table A2. The absolute values of standardized deviations for all covariates after matching are below 10%, and the majority of covariates exhibit non-significant differences between the treatment and control groups. This indicates that matching significantly reduces the differences in covariate distribution between the treatment and control groups, thereby mitigating sample self-selection bias and satisfying the balance assumption.
Overall, these results demonstrate that matching significantly reduces the differences in the distribution of covariates between the treatment and control groups, minimizing sample selection bias to the greatest extent. Figure 4 illustrates a substantial reduction in the standardized deviations of covariates before and after matching.
To examine the matching effectiveness, it is essential to test the common support condition. The common support condition posits that there is an overlap between the treatment and control groups, ensuring that both sub-samples share a common region in the propensity score distribution. Figure 5 reveals a substantial overlap of propensity score values. This indicates that the majority of observations fall within the common support region, and during the matching process, only a small number of samples that do not meet the common support condition are lost. This satisfies the common support condition and suggests that the matching is conducted in a region where the majority of observations from both groups share similar propensity score values.
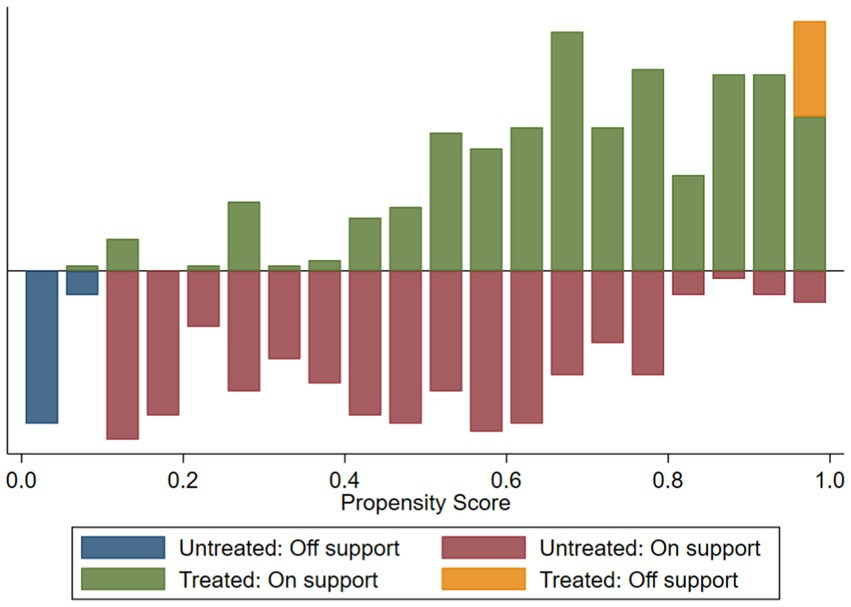
Figure 5. Propensity score distribution and common support. “Untreated” represents the control group, “Treated” represents the experimental group, “Off support” represents the samples whose scores are not within the common value range, which can be understood as the samples that have not been matched with appropriate scores. “On support” represents the samples whose scores are within the common value range.
3.2.3 Average treatment effects on the impact of TS on TE and GR
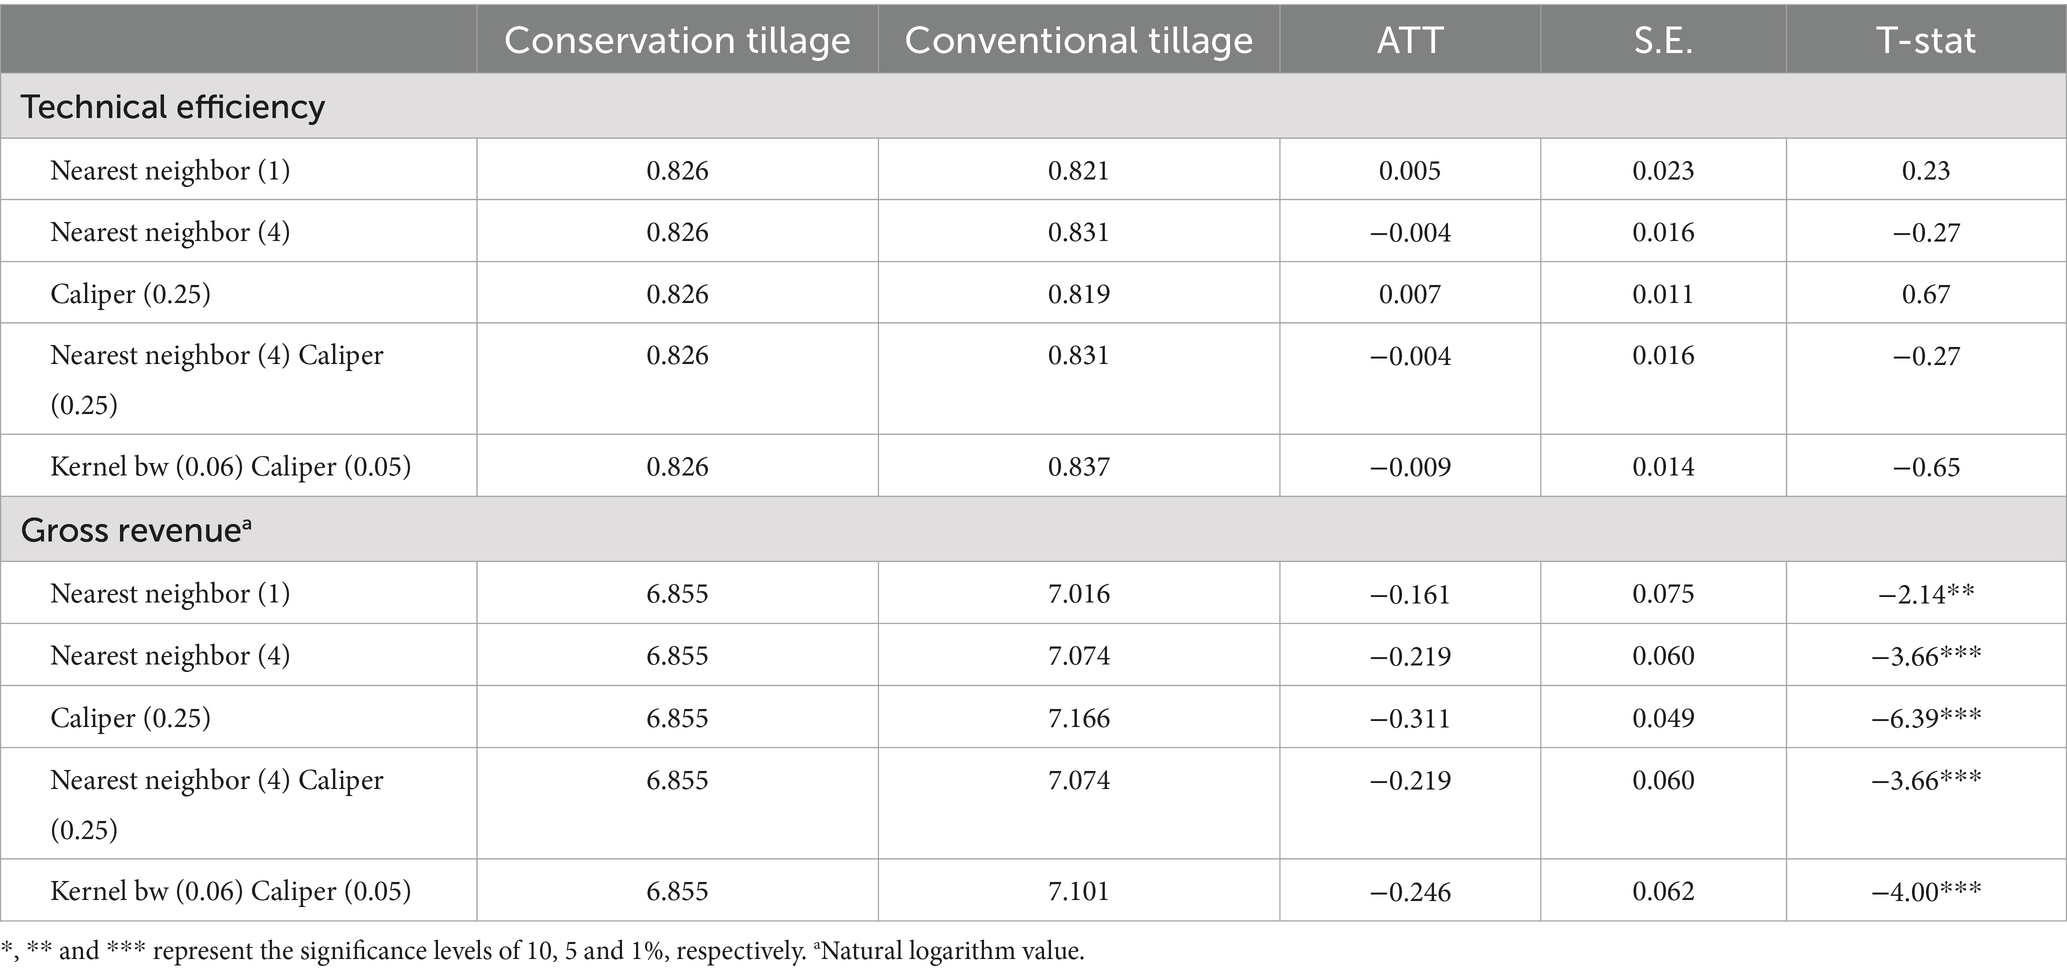
This article systematically examines the impact of different tillage systems on technical efficiency and agricultural income of wheat production. In order to ensure the robustness of the estimation results, we employs not only the nearest-neighbor matching method but also utilizes caliper matching and kernel matching. Overall, the results obtained from employing five different matching methods exhibit similarity, indicating the robustness of the matching outcomes.
As depicted in Table 4, on average, farms adopting conservation tillage exhibit a wheat production technical efficiency of 0.826. Meanwhile, for farms employing traditional tillage, technical efficiency ranges between 0.819 and 0.837. Based on the estimates from the five matching methods, there is no significant difference in technical efficiency between the two groups. It is evident that adopting conservation tillage does not exert a statistically significant enhancing effect on production efficiency. It can be seen that adopting conservation tillage only changes soil coverage, tillage intensity, etc., and there will be no significant improvement in technical efficiency.
Turning now to the evidence on the effect of tillage system on agricultural income, the ATT values passed the test at the 1% significance level for multiple matching methods, with only the nearest neighbor 1:1 matching being significant at the 5% level. Notably, there exists a significant difference in agricultural income between farms adopting conservation tillage and those employing traditional tillage. The estimated ATT values from all five matching methods are negative, ranging from −0.311 to −0.161, suggesting that farms practicing traditional tillage obtain higher production income per hectare compared to those adopting conservation tillage. In conservation tillage, returning straw to the field increases the probability of pests and diseases occurring in the farmland. Although the incidence of diseases is influenced by various factors, the increase in pests and diseases leads to crop yield reduction and quality decline, thereby affecting income.
3.2.4 Robustness analysis
In order to verify the robustness of the research findings, this study employed ordinary least squares (OLS) regression analysis to examine the impact of tillage system on technical efficiency and grain revenue. As shown in Appendix Table A3, with the influence of tillage system on technical efficiency still not statistically significant. However, at a 1% significance level, there is a negative impact on grain revenue. The results obtained using Ordinary Least Squares are consistent with those derived from the Propensity Score Matching (PSM) method used earlier. This further indicates that the differences in technical efficiency between the two tillage systems are not pronounced, and traditional tillage yields higher grain revenue. The results remain robust.
4 Further discussion
This study unveils novel insights into tillage system, offering crucial clues to address the debate between traditional tillage and conservation tillage. In our investigation, we unearthed compelling evidence that traditional tillage is more meaningful in increasing farmers’ income. These findings not only shed light on both tillage systems show comparable technical efficiency, but also challenge prevailing notions in the field.
This finding is consistent with that of Clovis (1999) who did not find any significant differences of wheat production efficiency between zero tillage adopters and non-adopters in northwest Indo-Gangetic Plains. The finding was also reported by Langemeier (2010) who explored wheat production on Kansas farms. What is different, however, is that he believes no-till farms are significantly more cost efficient, with higher operating profit margins.
However, our outcome is contrary to that of Paz et al. (2023) who found significant positive correlation between conservation tillage adoption and technical efficiency of maize growers. Mvumi et al. (2017) also showed that conservation tillage were more efficient compared to conventional tillage in semi-arid Zimbabwe. This differs from the findings presented here.
It is noteworthy that researchers tend to focus on specific countries or regions in their studies, leading to divergent conclusions. There is reason to suspect that contradictory results may arise due to regional differences. Accordingly, we categorized the sample countries into groups based on their economic development levels, distinguishing between developing and developed countries for analysis. The results, as illustrated in Appendix Table A4, indicate a significant impact of tillage system on technical efficiency at a 5% level in developed countries. Furthermore, considering the direction of result disparities, typical farms employing traditional tillage exhibit higher technical efficiency in wheat production. This distinction is less pronounced in developing countries, suggesting that the choice of tillage system has a limited impact on technical efficiency. Examining the influence of tillage system on grain revenue, typical farms in both developed and developing countries experience greater income when adopting traditional tillage.
5 Conclusion
Tillage system plays a crucial role in influencing agricultural production and farmers’ income. However, a comprehensive assessment prior to the implementation of agricultural technology dissemination is imperative. This study utilizes wheat production data from 234 typical farms across 29 countries to investigate the impact of tillage system on technical efficiency and grain revenue. The propensity score matching method is employed to alleviate endogeneity issues arising from sample selection bias. The findings reveal that the influence of tillage system on technical efficiency in agricultural production is not statistically significant, as there is no discernible difference in technical efficiency between conservation tillage and traditional tillage. Conversely, tillage system exert a significant impact on farmers’ income. Specifically, compared to conservation tillage, traditional tillage yield higher grain revenue for farmers.
However, these results were not very encouraging. Prior studies that have noted the importance of conservation tillage, especially in aspect of sustainability agriculture and environment friendly, particularly in the areas of sustainable agriculture and environmental friendliness. Certain countries advocate the implementation of conservation tillage to alleviate the environmental pressures posed by agricultural production. However, many nations continue to grapple with developmental challenges such as food security and farmers’ income.
Therefore, the conclusions drawn in this article should attract the attention of policymakers and farmers alike. From the perspective of policymakers, a comprehensive assessment encompassing economic, social, and environmental dimensions is imperative. The focus should be on achieving current objectives, taking into account local realities and needs as prerequisites for formulating and promoting policies, rather than undertaking extensive promotion based on singular goals and advantages. Furthermore, from the standpoint of farmers, economic returns stand as the primary consideration in choosing farming systems. Additionally, farmers’ cultivation habits, influenced by historical traditions, exhibit inertia, necessitating promotional education to bring about conceptual changes in their approach to transitioning farming practices.
Data availability statement
The raw data supporting the conclusions of this article will be made available by the authors, without undue reservation.
Author contributions
JW: Conceptualization, Data curation, Investigation, Methodology, Software, Writing – original draft, Writing – review & editing, Validation, Visualization. HZ: Data curation, Formal analysis, Project administration, Resources, Writing – review & editing. XH: Funding acquisition, Project administration, Resources, Supervision, Visualization, Writing – review & editing.
Funding
The author(s) declare that financial support was received for the research, authorship, and/or publication of this article. The project was supported by the Agricultural Science and Technology Innovation Program (10-IAED-01-2024).
Acknowledgments
The authors thank agri-benchmark for providing the data.
Conflict of interest
The authors declare that the research was conducted in the absence of any commercial or financial relationships that could be construed as a potential conflict of interest.
Generative AI statement
The authors declare that no Gen AI was used in the creation of this manuscript.
Publisher’s note
All claims expressed in this article are solely those of the authors and do not necessarily represent those of their affiliated organizations, or those of the publisher, the editors and the reviewers. Any product that may be evaluated in this article, or claim that may be made by its manufacturer, is not guaranteed or endorsed by the publisher.
Supplementary material
The Supplementary material for this article can be found online at: https://www.frontiersin.org/articles/10.3389/fsufs.2025.1528564/full#supplementary-material
References
Abdalla, M., Osborne, B., Lanigan, G., Forristal, D., Williams, M., Smith, P., et al. (2013). Conservation tillage systems: a review of its consequences for greenhouse gas emissions. Soil Use Manag. 29, 199–209. doi: 10.1111/sum.12030
Allmaras, R. R., and Dowdy, R. H. (1985). Conservation tillage systems and their adoption in the United States. Soil Tillage Res. 5, 197–222. doi: 10.1016/0167-1987(85)90030-3
Aravindakshan, S., Rossi, F., Amjath-Babu, T. S., Veettil, P. C., and Krupnik, T. J. (2018). Application of a bias-corrected meta-frontier approach and an endogenous switching regression to analyze the technical efficiency of conservation tillage for wheat in South Asia. J. Prod. Anal. 49, 153–171. doi: 10.1007/s11123-018-0525-y
Becker, S., and Ichino, A. (2002). Estimation of average treatment effects based on propensity scores. Stata J. 2, 358–377. doi: 10.1177/1536867X0200200403
Cantero Martínez, C., Angás, P., and Lampurlanés, J. (2007). Long-term yield and water use efficiency under various tillage systems in Mediterranean rainfed conditions. Ann. Appl. Biol. 150, 293–305. doi: 10.1111/j.1744-7348.2007.00142.x
Chetan, F., Chetan, C., Rusu, T., Moraru, P. I., Ignea, M., and Simon, A. (2017). Influence of fertilization and soil tillage system on water conservation in soil, production and economic efficiency in the winter wheat crop. Scientific Papers. Series A. Agron. 60:42–48.
Chetan, F., Teodor, R. U. S. U., Chetan, C., and Moraru, P. I. (2016). Influence of soil tillage upon weeds, production and economical efficiency of corn crop. AgroLife Scientific J. 5:36–43.
Chibanda, C., Agethen, K., Deblitz, C., Zimmer, Y., Almadani, M. I., Garming, H., et al. (2020). The typical farm approach and its application by the Agri benchmark network. Agriculture 10:646. doi: 10.3390/agriculture10120646
Clovis, N. S. (1999). To till or not to till: the question of economic efficiency and tillage systems in a sample of Illinois grain farms. Champaign, IL: University of Illinois at Urbana-Champaign.
Demir, O., and Gözübüyük, Z. (2020). A comparison of different tillage systems in irrigated conditions by risk and gross margin analysis in Erzurum region of Turkey. Environ. Dev. Sustain. 22, 2529–2544. doi: 10.1007/s10668-019-00308-5
Derpsch, R., Friedrich, T., Kassam, A., and Hongwen, L. (2010). Current status of adoption of no-till farming in the world and some of its main benefits. Int. J. Agric. Bio Eng. 3, 1–25. doi: 10.3965/j.issn.1934-6344.2010.01.0-0
Filip, E., Chetan, F., Teodor, R. U., Chetan, C., Agapie, A., Simon, A., et al. (2024). Influence of tillage systems on selected soil characteristics and yield of spring cereals. Life Sci. Sustain. Dev. 5, 21–28. doi: 10.58509/lssd.v5i2.302
Haile, N. Z., Huluka, A. T., and Beyene, A. B. (2024). Impacts of mining projects on food security of households in Ethiopia: empirical evidence from Benishangul-Gumuz region. Front. Sustain. Food Syst. 8:1481827. doi: 10.3389/fsufs.2024.1481827
Husnjak, S., Filipovic, D., and Kosutic, S. (2002). Influence of different tillage systems on soil physical properties and crop yield. Rostlinna Vyroba 48, 249–254. doi: 10.17221/4236-PSE
Jordan, D. L., Barnes, J. S., Bogle, C. R., Naderman, G. C., Roberson, G. T., and Johnson, P. D. (2001). Peanut response to tillage and fertilization. Agron. J. 93, 1125–1130. doi: 10.2134/agronj2001.9351125x
Kladivko, E. J. (2001). Tillage systems and soil ecology. Soil Tillage Res. 61, 61–76. doi: 10.1016/S0167-1987(01)00179-9
Langemeier, M. (2010). Relative technical and cost efficiency of no-till farms. J. Int. Farm Manag. 5, 1–11. doi: 10.22004/ag.econ.345508
Logan, T. J., Lal, R., and Dick, W. A. (1991). Tillage systems and soil properties in North America. Soil Tillage Res. 20, 241–270. doi: 10.1016/0167-1987(91)90042-V
Mahmood, N., Arshad, M., Kächele, H., Ullah, A., and Müller, K. (2020). Economic efficiency of rainfed wheat farmers under changing climate: evidence from Pakistan. Environ. Sci. Pollut. Res. 27, 34453–34467. doi: 10.1007/s11356-020-09673-5
Martínez, E., Fuentes, J. P., Silva, P., Valle, S., and Acevedo, E. (2008). Soil physical properties and wheat root growth as affected by no-tillage and traditional tillage systems in a Mediterranean environment of Chile. Soil Tillage Res. 99, 232–244. doi: 10.1016/j.still.2008.02.001
Michler, J. D., Baylis, K., Arends-Kuenning, M., and Mazvimavi, K. (2019). Conservation agriculture and climate resilience. J. Environ. Econ. Manag. 93, 148–169. doi: 10.1016/j.jeem.2018.11.008
Mvumi, C., Ndoro, O., and Manyiwo, S. A. (2017). Conservation agriculture, conservation farming and conventional tillage adoption, efficiency and economic benefits in semi-arid Zimbabwe. Afr. J. Agric. Res. 12, 1629–1638. doi: 10.5897/AJAR2017.12153
Nenge, A. S., Ibrahim, N., and Adaikwu, A. O. (2025). Analysis of impacts of tillage practices for integrated nutrients management systems on maize performance. Asian J. Plant Soil Sci. 10, 1–11. doi: 10.56557/ajopss/2025/v10i1112
Oorts, K., Merckx, R., Gréhan, E., Labreuche, J., and Nicolardot, B. (2007). Determinants of annual fluxes of CO2 and N2O in long-term no-tillage and traditional tillage systems in northern France. Soil Tillage Res. 95, 133–148. doi: 10.1016/j.still.2006.12.002
Pannell, D. J. (1999). Social and economic challenges in the development of complex farming systems. Agrofor. Syst. 45, 395–411. doi: 10.1023/A:1006282614791
Paz, B., Hailu, A., Rola-Rubzen, M. F., and Rashid, M. M. (2023). Conservation agriculture-based sustainable intensification improves technical efficiency in northern Bangladesh: the case of Rangpur. Aust. J. Agric. Resour. Econ. 68, 125–145. doi: 10.1111/1467-8489.12537
Sankranti, S., and Langemeier, M. R. (2004). Tillage systems, cropping practices, farm characteristics and efficiency. Southern Agric. Econ. Assoc. doi: 10.22004/ag.econ.34632
Schwab, E. B., Reeves, D. W., Burmester, C. H., and Raper, R. L. (2002). Conservation tillage systems for cotton in the Tennessee Valley. Soil Sci. Soc. Am. J. 66, 569–577. doi: 10.2136/sssaj2002.5690
Shi, H., Gao, W., Xu, H., and Chang, M. (2022). Understanding the mechanism of energy poverty affecting irrigation efficiency: evidence from rural China. Environ. Sci. Pollut. Res. 29, 70963–70975. doi: 10.1007/s11356-022-20874-y
Singh, M., Yadav, D. B., Yadav, S., Mor, V., and Poonia, B. S. (2024). Potential of conservation agricultural practices on soil quality, carbon sequestration, salinity management and productivity of rainfed areas: conservation agricultural practices on soil quality. J. Soil Salinity Water Qual. 16, 329–344. doi: 10.56093/jsswq.v16i3.158116
Smith, P., Powlson, D. S., Glendining, M. J., and Smith, J. (1998). Preliminary estimates of the potential for carbon mitigation in European soils through no-till farming. Glob. Chang. Biol. 4, 679–685. doi: 10.1046/j.1365-2486.1998.00185.x
Stanek Tarkowska, J., Czyz, E. A., Dexter, A. R., and Slawinski, C. (2018). Effects of reduced and traditional tillage on soil properties and diversity of diatoms under winter wheat. Int. Agrophys. 32, 403–409. doi: 10.1515/intag-2017-0016
Su, Y., Gabrielle, B., and Makowski, D. (2021). A global dataset for crop production under traditional tillage and no tillage systems. Scientific Data 8:33. doi: 10.1038/s41597-021-00817-x
Tanursaz, A., Bakhshoodeh, M., and Azarm, H. (2021). The effects of conservation tillage on technical efficiency of wheat growers in Dezful county. J. Agric. Sci. Sustain. Product. 31, 331–348. doi: 10.22034/saps.2021.12819
Unger, P. W., and McCalla, T. M. (1980). Conservation tillage systems. Adv. Agron. 33, 1–58. doi: 10.1016/S0065-2113(08)60163-7
Vallejos, A., Iglesias, J. O., Galantini, J. A., and Imhoff, S. (2024). Changes in least limiting water range under different tillage systems and traffic intensities in a subhumid Pampean region. Chilean J. Agric. Anim. Sci. 40, 639–651. doi: 10.29393/CHJAAS40-55CLAS40055
Keywords: tillage system, technical efficiency, wheat production, typical farm, propensity score matching
Citation: Wang J, Zhou H and Hu X (2025) Does tillage system affect agricultural production and farmers’ incomes? Evidence from 234 typical farms in 29 countries. Front. Sustain. Food Syst. 9:1528564. doi: 10.3389/fsufs.2025.1528564
Edited by:
Idowu Oladele, Global Center on Adaptation, NetherlandsReviewed by:
Zhang Yucui, Chinese Academy of Sciences (CAS), ChinaRev. Mohamed Paul Ngegba, Njala University, Sierra Leone
Copyright © 2025 Wang, Zhou and Hu. This is an open-access article distributed under the terms of the Creative Commons Attribution License (CC BY). The use, distribution or reproduction in other forums is permitted, provided the original author(s) and the copyright owner(s) are credited and that the original publication in this journal is cited, in accordance with accepted academic practice. No use, distribution or reproduction is permitted which does not comply with these terms.
*Correspondence: Xiangdong Hu, aHV4aWFuZ2RvbmdAY2Fhcy5jbg==
 Jiamei Wang
 Hui Zhou
 Xiangdong Hu