 Bo Pan
 Yingxin Du3
 Qingbing Chen
 Haiying Li
 Conglin Huang
 Kang Gao
95% of researchers rate our articles as excellent or good
Learn more about the work of our research integrity team to safeguard the quality of each article we publish.
Find out more
ORIGINAL RESEARCH article
Front. Sustain. Food Syst. , 11 February 2025
Sec. Agricultural and Food Economics
Volume 9 - 2025 | https://doi.org/10.3389/fsufs.2025.1521709
This article is part of the Research Topic Harnessing Digital Innovation for Sustainable Agricultural Development View all 13 articles
China, with a long history of cultivating chrysanthemums, is one of the largest producers of cut chrysanthemums in the world. The changes in its export volume of cut chrysanthemums directly affect the supply in the international flower market and exert competitive pressure on other exporting countries of cut flowers. This study characterizes the growth, composition and performance of China’s cut chrysanthemum in the global market using various measures and analytical tools, and provides an empirical investigation on the influencing factors of China’s export competitiveness of cut chrysanthemum. The results show that over the past 16 years, China’s export of cut chrysanthemums has maintained a competitive advantage that peaked in 2019, followed by a gradual decline. Market effects and overall competitiveness had the most significant impact on China’s cut chrysanthemum export growth. China’s export of cut chrysanthemums is associated with the number of new varieties, and China exports more cut chrysanthemums to countries with larger population size, more geographical proximity, and closer diplomatic relations. While we do not find significant effect of the Belt and Road Initiatives, we find that Chinese exporters of cut chrysanthemums tend to choose to export to China’s partners of free trade agreement. This study then provides policy suggestions regarding enhancing the international competitiveness of China’s cut chrysanthemums including promoting innovation strengthening international cooperation.
Chrysanthemum (Chrysanthemum × morifolium Ramat.), is one of the world’s four major cut flowers. As the trade statistics of 2022 shows, they represent 9.77% of the global cut flower trade market, positioning them as the second-largest cut flower species worldwide (Figure 1). It has wide applications in landscaping, home gardening, and the pharmaceutical industry, offering substantial economic and cultural value (Gao et al., 2023). Cut chrysanthemums are famous for their diverse forms and vibrant colors, making them one of the most economically valuable flower crops in the global market (Mekapogu et al., 2022). As consumer demand for diverse and high-quality flowers continues to rise, the market demand for chrysanthemums is also increasing. The plant’s adaptability and cultivability make it a highly promising flower crop, especially in the context of green sustainability and sustainable agriculture. China is one of the prominent actors in the global cut chrysanthemum industry. It has a long history of chrysanthemum cultivation dated back to the 15th Century B.C. Chrysanthemum is not only a renowned flower originating from China (Zhang and Dai, 2009; Chen et al., 2023), but also constitutes the largest share in China’s export of fresh cut flowers (as shown in Figure 1). However, China faces the issue of having a large cultivation area but lower export revenues compared to competitors like the Netherlands and Colombia. Therefore, evaluating China’s position in the global flower market, its competitiveness, and understanding the influencing factors are pre-requisites for promoting the development of China’s chrysanthemum industry.
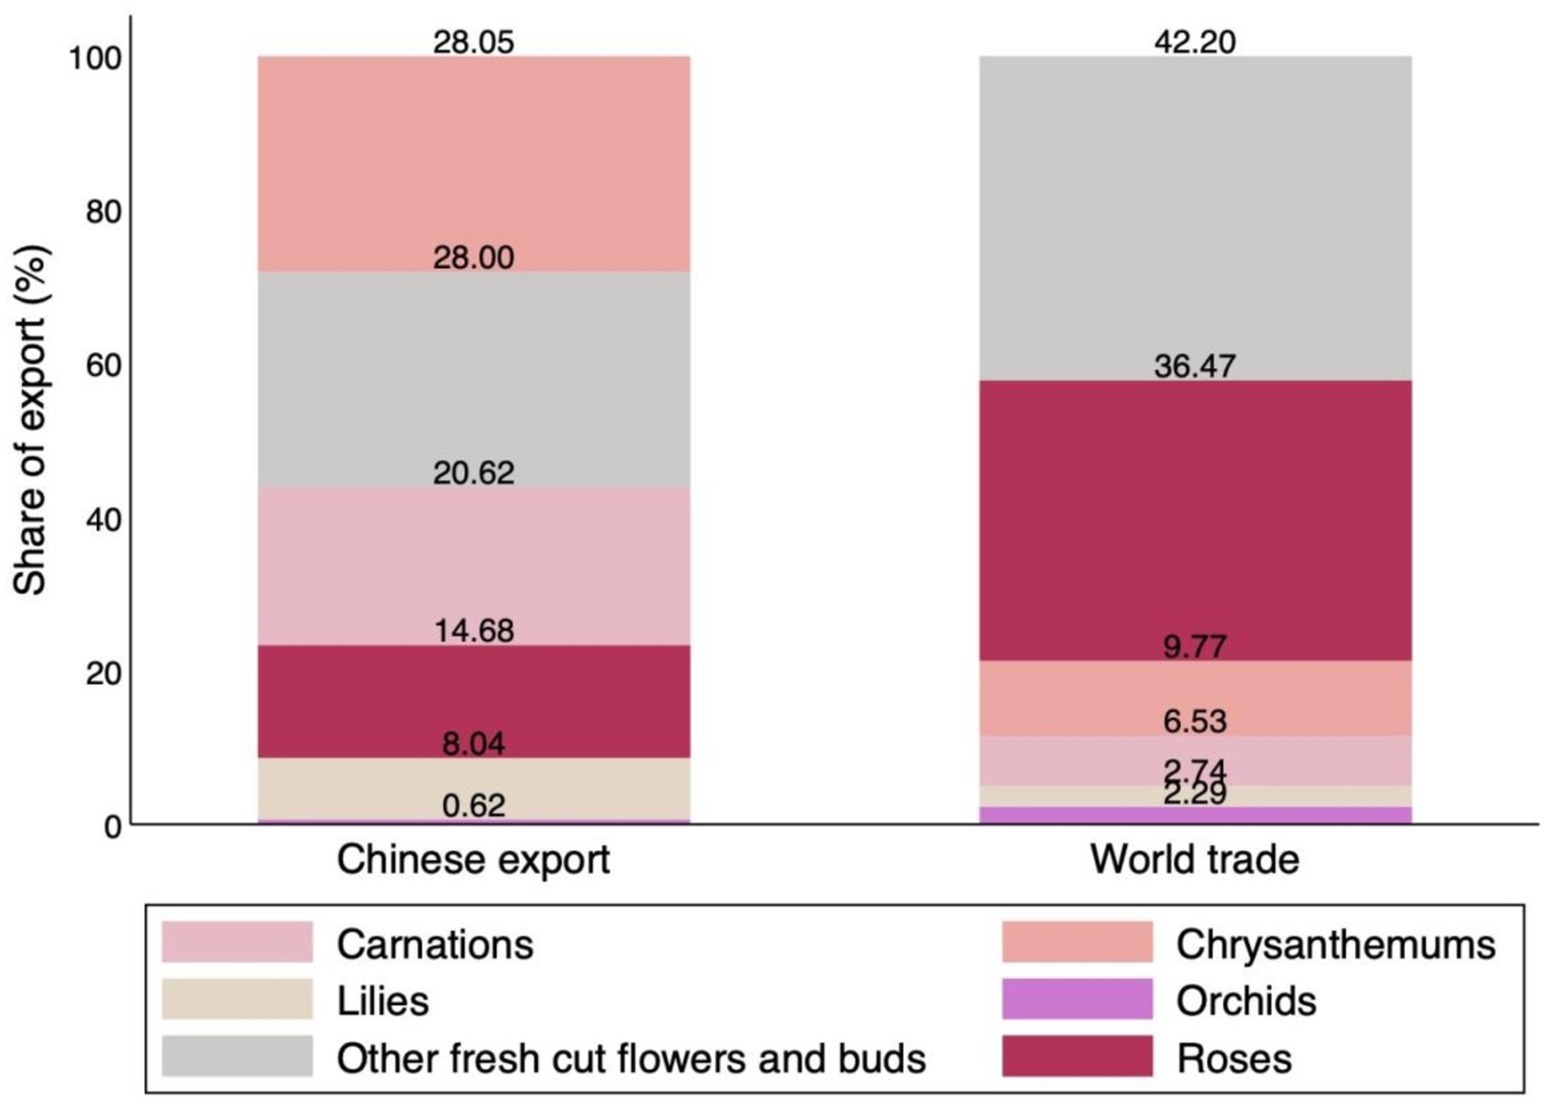
Figure 1. Share of chrysanthemums in trade of fresh cut flowers, 2022. Data source: CEPII BACI.
As global competition intensifies and societal challenges grow, leading flower-producing nations have conducted significant research to explore how to drive the development of the global flower industry. Dutch researchers have examined the characteristics of online flower trade by analyzing export volumes, price trends, and flower varieties, while also considering information technology trade mechanisms and the global value chain context (Patel-Campillo, 2011; Porter, 2003; Steen, 2010). Other researchers have assessed Ecuador’s floral export advantages and policies by analyzing agricultural policies, economic changes, and transportation methods (Vanegas López et al., 2017; Guaita-Pradas et al., 2023). Kenyan researchers have utilized Principal Component Analysis (PCA) to analyze trade trends and market share within Kenyan cut flower industry (Hughes, 2001; Perry, 2012). The research conducted by these major flower-producing nations shares a common goal: to enhance the global competitiveness of their flower industries and consequently, promote the growth of the global flower market. As the most traded flower in China’s cut flower industry, chrysanthemums serve as a key subject of research on international competitiveness and influencing factors. This not only provides theoretical support for China’s flower industry internationalization strategy but also offers a framework for improving the competitiveness of other agricultural products.
Export quantity and value are key indicators for assessing a product’s international competitiveness. The use of mathematical models to analyze these indicators is a common approach for evaluating trade competitiveness and influencing factors. The Revealed Comparative Advantage (RCA) method, introduced by Balassa (1965), is one of the most effective approaches to evaluating global competitiveness and influencing factors. With the growth of trade globalization, this method has been continuously refined, leading to the development of alternative indices such as Total Revealed Comparative Advantage (TRCA) (Tian et al., 2017), Variable Revealed Comparative Advantage (VRCA) (Wu et al., 2019), Normalized Revealed Comparative (NRCA) (Shuai et al., 2022), and Revealed Symmetric Comparative (RSCA) (Laursen, 2015). These indices are widely used in the competitiveness assessments of various agricultural products, including coffee (Jalata, 2021), wheat (Ceylan, 2019), and cinnamon (Sari and Divinagracia, 2021). The Constant Market Share (CMS) model and the Trade Gravity Model are effective tools for analyzing the factors influencing commodity trade competitiveness. The multi-level decomposition of the CMS model helps clarify the export structure of specific products, identify issues in international trade, and provide valuable references for government policy-making and problem-solving. It also aids in forecasting and assessing future trade trends. For instance, Ge Ming and colleagues used the model to identify drivers of China’s agricultural export growth and the reasons behind changes in foreign import demand and industry structure, playing a key role in enhancing the overall competitiveness of Chinese agricultural products (Ge et al., 2024). Additionally, this model has been widely applied in the study of international competitiveness factors for horticultural exports, rare earths, and automobile trade (Lu et al., 2015; Zhao, 2022). In contrast to the CMS model, the Trade Gravity Model incorporates specific factors such as bilateral trade distance, foreign import demand, and trade barriers, making more accurate assessments. This allows for the development of scientific and effective measures to enhance product international competitiveness. The model has also been extensively validated in economic modeling (Fracasso, 2014). The advantages of different mathematical models vary. When used appropriately, these models can play a significant role in promoting the development of international trade for commodities.
Using a single model to analyze export trade in-depth has its limitations. A combination of models is more effective in formulating targeted policy recommendations to promote trade development. This study first calculates the RSCA index of major global cut chrysanthemum exporters to clearly identify China’s market position. Then, using the Gravity model and CMS model, the specific factors influencing China’s cut chrysanthemum import and export trade are identified, which can assist domestic chrysanthemum producers in developing production plans, investment strategies, and marketing tactics. This not only provides valuable insights for governments in formulating trade policies for the flower industry, but also offers a framework and reference for the analysis of other industries.
This study, based on the International Harmonized System (HS codes), retrieved bilateral trade data for cut chrysanthemums (HS 060314) from the CEPII BACI database1, covering the years from 2007 to 2022. We also use a more detailed trade database from General Administration of Customs, People’s Republic of China2 which is available at the level of 8-digit HS codes at a monthly frequency from January 2015 to November 2024. It allows us to compare China’s export of cut chrysanthemums (HS 06031400) with two other major types of chrysanthemum products, namely live plants of chrysanthemums (HS 06029093) and chrysanthemums used primarily in pharmacy (HS 12119015). China’s chrysanthemum breeding data is from the Science and Technology Development Center of the Ministry of Agriculture and Rural Affairs3. For the gravity model analysis, we get data for the explanatory variables from the CEPII gravity database, covering the past 16 years (2007–2022) (Porter, 2012).
First, to fully understand China’s position and export structure of cut chrysanthemum trade in the global flower market, this study conducts a statistical analysis of the foundational data. Based on this, the study employs the Revealed Symmetric Comparative Advantage (RSCA) index to examine China’s comparative advantage in cut chrysanthemum exports over the past 16 years, measuring the changes in China’s trade competitiveness. The RSCA index optimizes the traditional Revealed Comparative Advantage (RCA) by applying symmetry and standardization, addressing potential biases and extreme values. This significantly enhances the objectivity, stability, and accuracy of the research results.
Secondly, after clarifying the international flower market and competitiveness of China’s cut chrysanthemums, we employ a combination of the Constant Market Share (CMS) model and the gravity model to further analyze the reasons behind the export growth and the factors influencing it. The CMS model, through multi-layer decomposition, breaks down export growth into different effects, allowing the identification of key causes of trade changes. Combined with the gravity model, it analyzes the direction and magnitude of each factor’s impact on trade flow at the bilateral trade level, providing valuable evidence for trade policy formulation and business decision-making.
From 2007 to 2022, global exports of cut chrysanthemums reached $12537.052million. The top five exporting countries were the Netherlands, Colombia, Malaysia, China, and Vietnam (Figure 2A). Over this 16-year period, these countries accounted for 89.77% of global exports, creating a trade dominance among the five nations. The Netherlands was the largest exporter of cut chrysanthemums, with its share peaking at 70.37% in 2007. Analysis of the market share of the top five cut chrysanthemum exporting countries from 2007 to 2022 reveals that although the Netherlands remained the largest exporter, its share declined over these 16 years. In contrast, Colombia, Vietnam, and China experienced rapid growth. Specifically, China’s share of global exports increased from 1.45% in 2007 to 3.67% in 2022, it reached its peak in 2019, accounting for total exports. Malaysia’s trade in cut chrysanthemums remained relatively stable, maintaining about a 10% share of global exports throughout this period. Overall, the combined export share of other countries also increased, indicating a gradual shift away from the dominance of the five leading exporters (Supplementary Appendix Table A1). The global cut chrysanthemum market is expected to see the emergence of more major trading nations in the future.
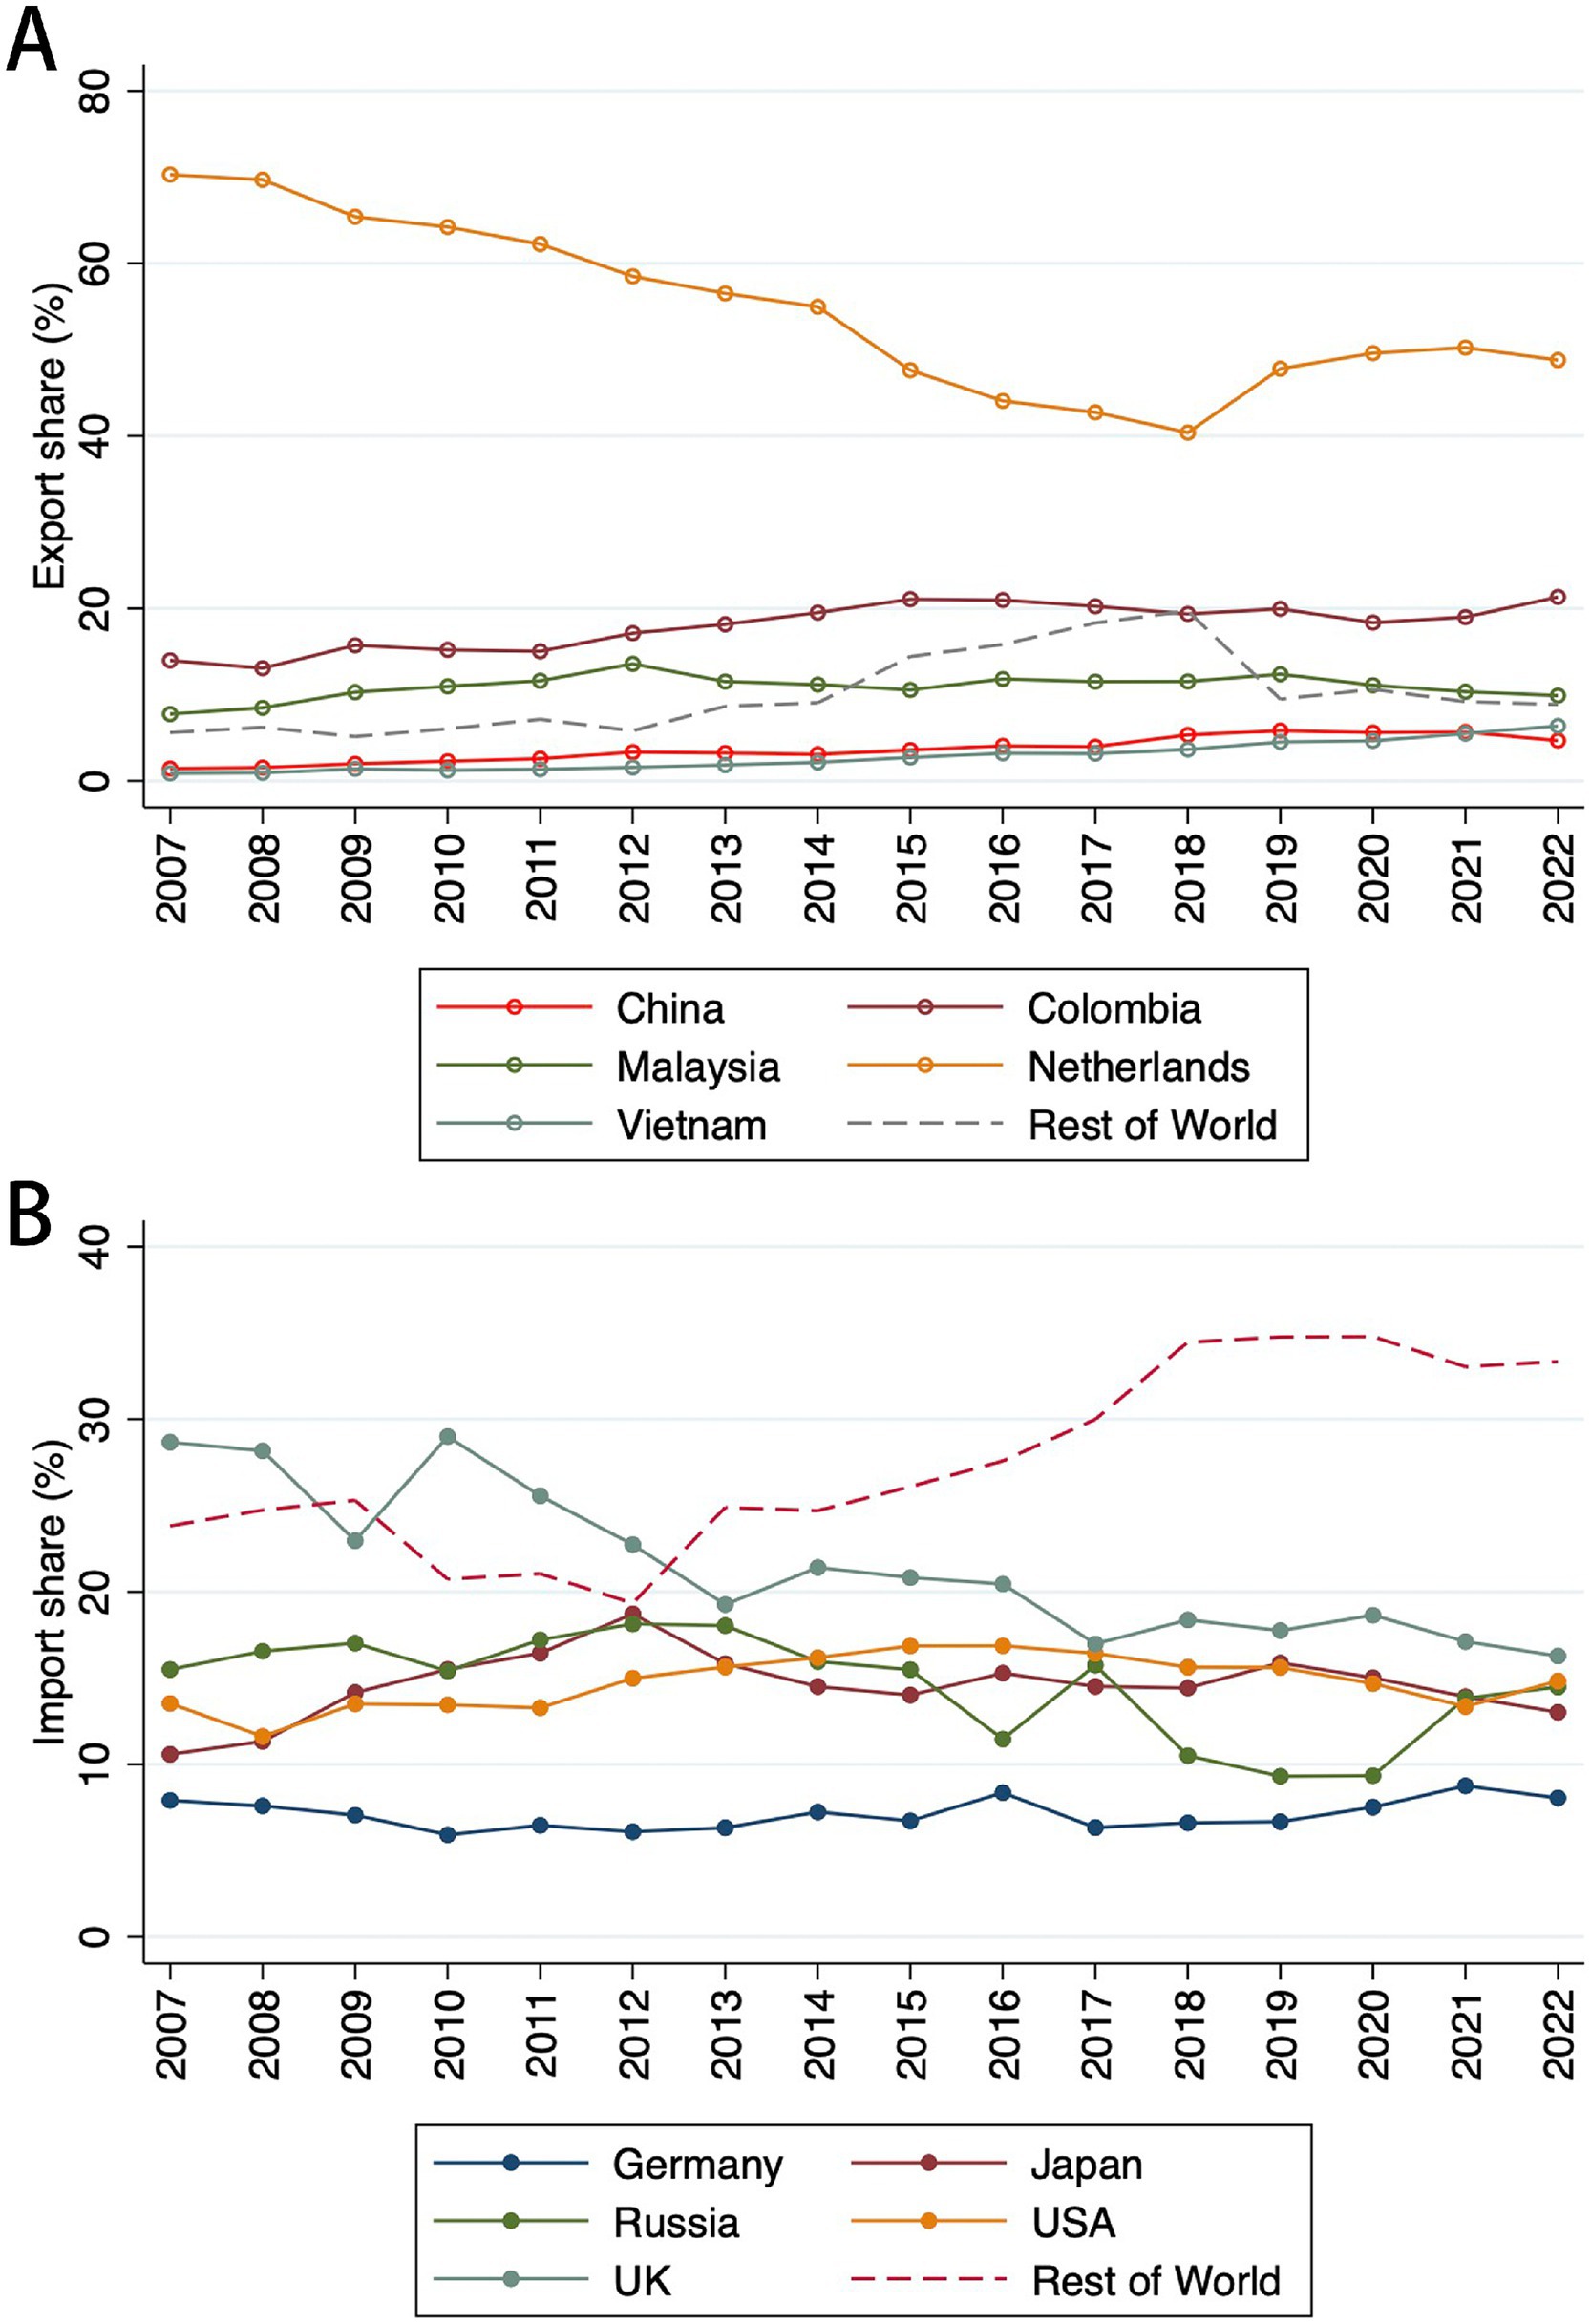
Figure 2. Overview of global cut chrysanthemum trade from 2007 to 2022: export trends (A), import trends (B). Data source: CEPII BACI database.
During the same period, the top five importing countries were the United States, Japan, Russia, and Germany (Figure 2B). These countries accounted for 72.49% of global imports over the 16 years. The import demand for cut chrysanthemums from the United States, Japan, and Germany remained relatively stable, while Russia and the United Kingdom exhibited significant fluctuations. Russia’s import demand increased initially but then declined, whereas the United Kingdom showed a consistent decrease in demand, with its share of global imports falling from 28.71% in 2007 to 21.25% in 2022 (Supplementary Appendix Table A2). The import share of cut chrysanthemums by other countries is on the rise, indicating that new major demand centers are likely to emerge. As potential growth markets for Chinese cut chrysanthemum exports, this presents China with increased export opportunities in the future.
Between 2007 and 2022, the international trade of Chinese cut chrysanthemums experienced significant fluctuations. According to the CEPII BACI database, since 2007, China’s cut chrysanthemum trade has shown a rapid upward trend, growing from $9.35 million in 2007 to $39.13 million in 2022. It peaked in 2021, achieving a remarkable growth of 432.67%. Similarly, imports of cut chrysanthemums into China also showed a rapid growth trend. From a trade balance perspective, China’s export value of cut chrysanthemums has consistently exceeded its import value, maintaining a trade surplus over the 16 years. Based on this trend, the Chinese cut chrysanthemum industry is expected to capture a larger share of the international market in the future (Supplementary Appendix Table B1).
To examine the fluctuations in China’s cut chrysanthemum export market share in key global countries or regions, this study estimates the export market share of China’s cut chrysanthemums over the past 16 years (Figure 3) and calculates the standard deviation of market share changes during this period. Overall, China’s cut chrysanthemums are primarily exported to Japan and South Korea, accounting for over 94% of total exports. Over these 16 years, both South Korea and Japan have seen significant increases in their cut chrysanthemum import volumes. However, Japan’s import share decreased from 92.48% in 2007 to 70.09% in 2022, while the share of China’s cut chrysanthemum exports to South Korea rapidly rose from 2.56% in 2007 to 23.75% in 2022, even surpassing Japan in 2019. Moreover, the import volumes of both Japan and South Korea have exhibited considerable volatility, with fluctuations of 17.05 and 16.49%, respectively. This suggests that changes in the import demand from these countries will directly affect China’s cut chrysanthemum export trade. (Supplementary Appendix Table B2).
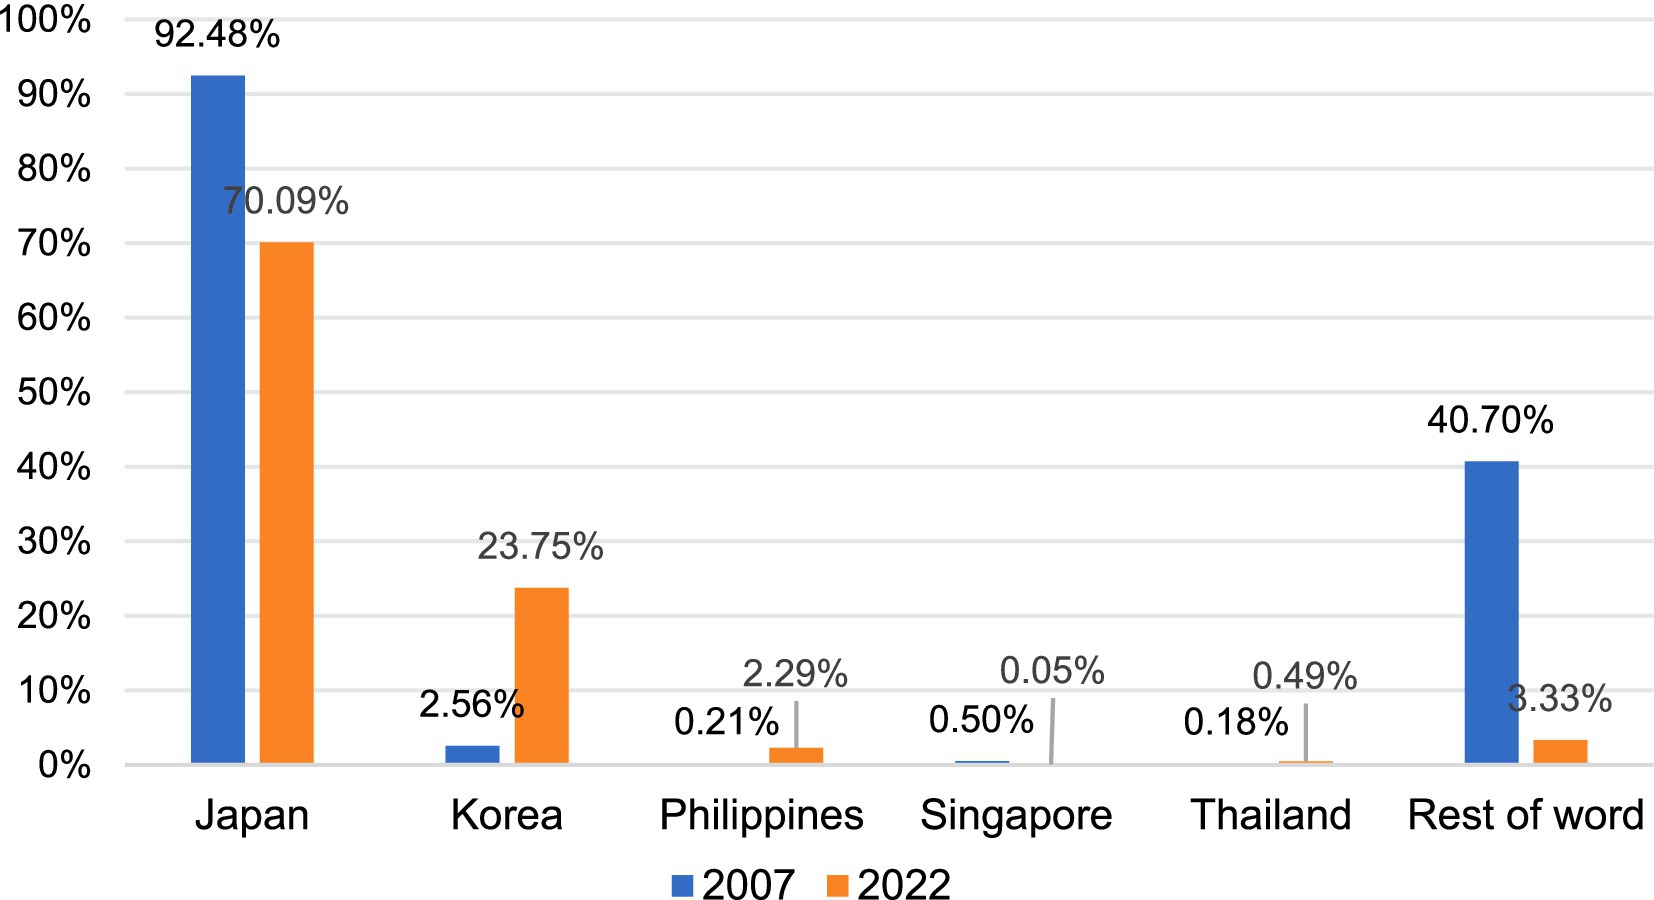
Figure 3. Main trading partners, China’s export of cut chrysanthemum, 2007 and 2022. Data source: CEPII BACI database.
In addition to cut flowers, the export of chrysanthemums also includes the export of plants and medicinal chrysanthemums. Since customs data provides trade statistics at the HS8 level, we can analyze the share and changes of chrysanthemums within the three main categories of flower products. These three categories include cut flowers (Fresh cut chrysanthemums), live plants (Live chrysanthemums plants), and plants or plant parts used for medicinal, aromatic, or pesticidal purposes (Flos chrysanthemums). As global trade data (UNComtrade data) is only available at the 6-digit HS code level, it is not possible to separate chrysanthemums from the latter two categories. Therefore, we examined China’s export share in these three main flower product categories, which indirectly reflects the global market share of Chinese chrysanthemum plants and medicinal chrysanthemums to some extent.
Trade data for the period 2015–2024 shows that exports of cut chrysanthemums and medicinal chrysanthemums account for the majority of all chrysanthemum products, with live chrysanthemums having a smaller share. The overall trend (Figure 4A) indicates an upward trajectory for exports of all three types of chrysanthemum products, with a noticeable decline in all categories during the 2020–2023 period due to the global COVID-19 pandemic. Monthly export data from 2015 to 2024 (Figure 4B) reveals that trade in all three types of chrysanthemum products follows a seasonal pattern, with overall exports in the fall and winter months exceeding those in spring and summer. This pattern can be attributed to the growth characteristics of chrysanthemums, as most regions in China are unable to achieve year-round production, resulting in much lower yields in spring and summer compared to fall and winter. Therefore, improving chrysanthemum production techniques and creating conditions for year-round production are key factors in promoting chrysanthemum exports.
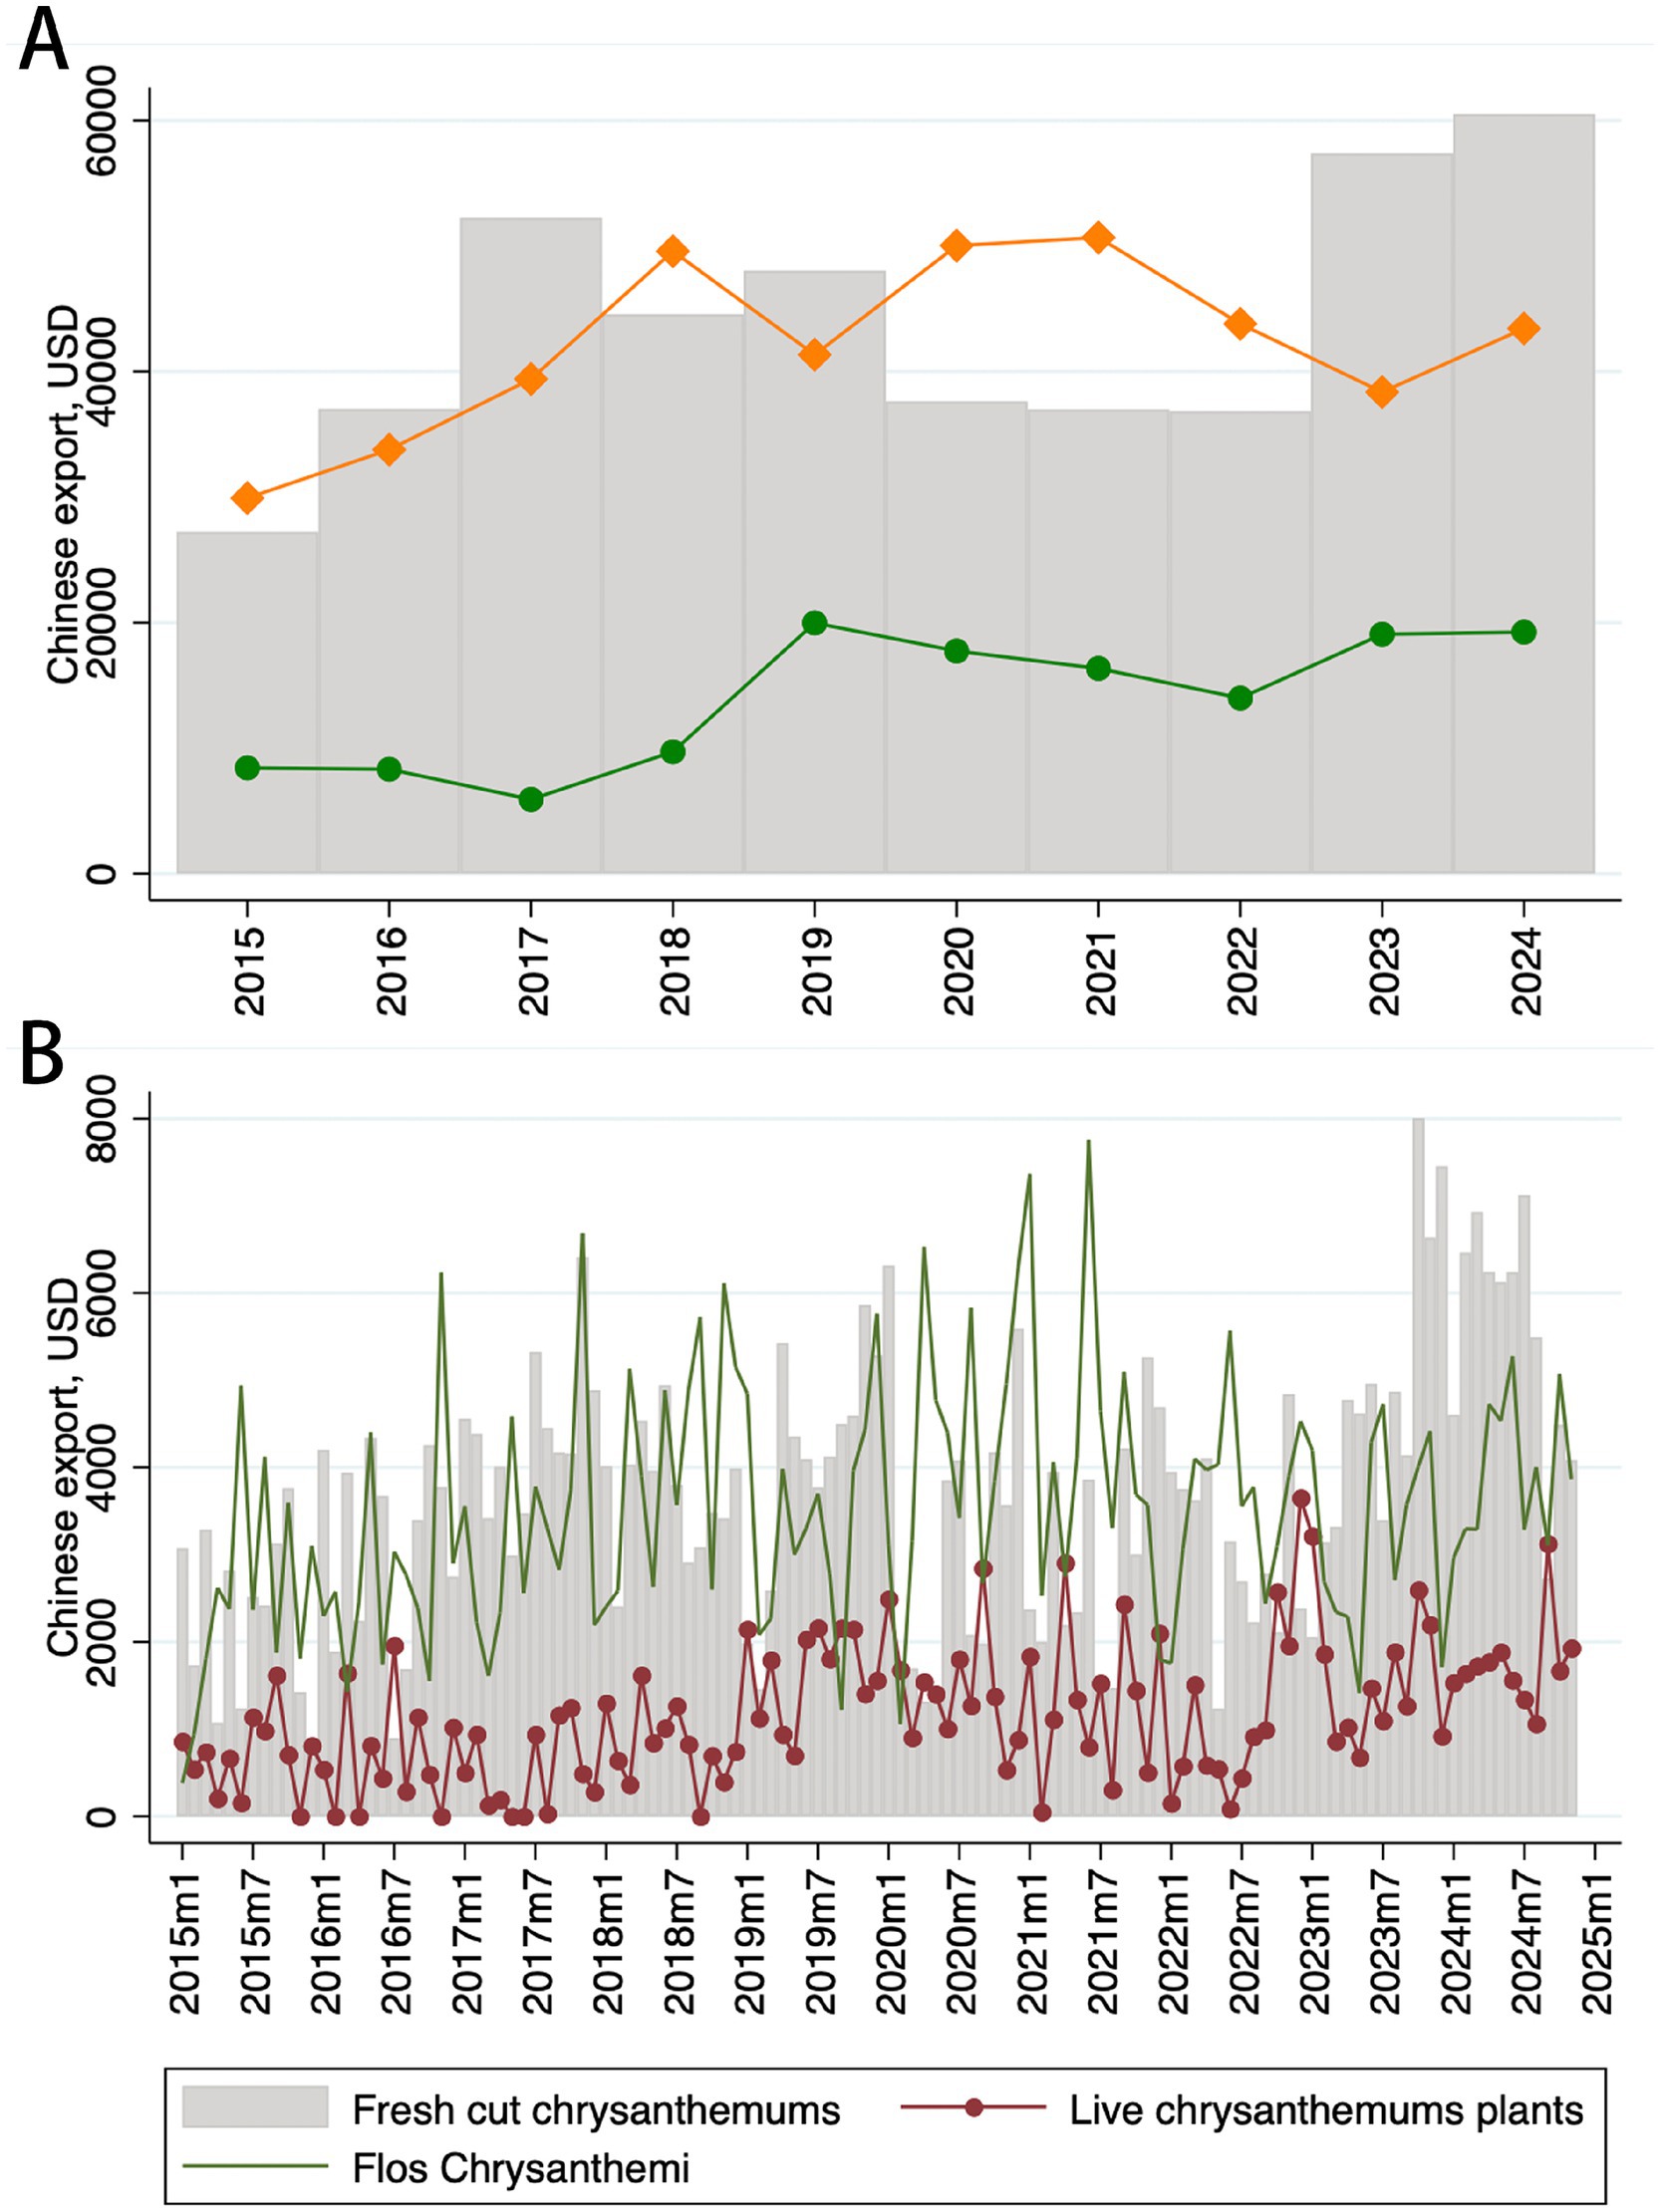
Figure 4. China’s export of three types of chrysanthemums: annual variation (A), monthly changes (B). Data source: General administration of customs, People’s Republic of China.
This study applies Dalum’s method to calculate the Symmetric Revealed Comparative Advantage (RSCA) index using data from the top five cut chrysanthemum exporting countries from 2007 to 2022 (Dalum et al., 1998).
The specific calculation formulas are as follows:
In this context, Xij represents the export value of product i from country j, Xtj denotes the total export value of flowers from country j, Xiw is the total global export value of product i, and Xtw is the total global export value of flowers.
After analyzing the trade situation of major countries in the global cut chrysanthemum trade, it was found that China’s main competitors are the Netherlands, Colombia, Malaysia, and Vietnam. Based on this, it is necessary to further understand China’s position in the global floral trade. Therefore, this study calculates the RSCA indices for the Netherlands, Colombia, Malaysia, Vietnam, and China from 2007 to 2022 (Figure 4).
The study found that, despite the global financial crisis in 2008, the RSCA indices for the five countries were all above zero, indicating a competitive advantage and suggesting that the financial crisis had a minimal impact on the export trade of cut chrysanthemums. Notably, while the Netherlands is the largest exporter of cut chrysanthemums globally, its comparative advantage was relatively weak, with no comparative advantage (RSCA <0) during 2016–2018. In contrast, Malaysia and Vietnam demonstrated a strong comparative advantage, significantly surpassing the Netherlands, Colombia, and China, and remained relatively stable over the 16 years. Colombia’s RSCA index exhibited minimal fluctuations over the 16 years, showing a generally increasing trend. China’s cut chrysanthemum trade has consistently shown a comparative advantage but with the highest volatility. The RSCA value increased rapidly from 0.018 in 2007 to 0.332 in 2013, then sharply fell to 0.15 in 2014. It recovered to previous levels and experienced stable growth from 2015 to 2019, peaking in 2019. However, it declined in 2020 following the global outbreak of COVID-19, indicating a significant negative impact on China’s cut chrysanthemum exports due to the pandemic. Overall, the export of Chinese cut chrysanthemums has shown a rapid growth trend over these 16 years, indicating an increasingly optimized export structure. This suggests significant future breakthroughs and a substantial opportunity for China to capture a larger share of the global cut chrysanthemum market (Supplementary Appendix C).
This model compares a country’s export value, product structure, and market structure with the global export value, product structure, and market structure during the same period, and it decomposes export growth into two levels. The first level of decomposition includes structural effects, competitiveness effects, and second-order effects. The second level further breaks down structural effects into growth effects, market effects, product effects, and structural interaction effects; competitiveness effects are divided into overall competitiveness effects and specific competitiveness effects; and second-order effects are divided into pure second-order effects and dynamic second-order effects (Jepma, 1989).
Since a single product is not influenced by product effects and structural interaction effects, this study excludes these effects based on Jempa’s hierarchical decomposition of the CMS model. The specific calculation formulas and CMS decomposition details can be found in Supplementary Appendix D.
In this study, to accurately assess the market competitiveness of a specific product and develop precise trade strategies, only data based on HS Code 060314 (cut chrysanthemums) was selected as the sample. Trade data was sourced from the CEPII BACI database. In this study, China’s cut chrysanthemum trade refers to the export value from mainland China, excluding exports from Hong Kong, Macao, and Taiwan.
This study spans from 2007 to 2022. According to data from the CEPII BACI database, during this period, China exported cut chrysanthemums to 71 countries. However, only eight countries—Japan, South Korea, the Philippines, Thailand, Singapore, Brunei, Bangladesh, and Malaysia—imported cut chrysanthemums from China every year. Given the long study period, the study period was divided into five intervals, each spanning three years, for separate analysis. (The 2019–2022 period, however, was extended to four years due to the impact of the global COVID-19 pandemic.) This approach aims to better explore the variations in the significance of factors influencing China’s global cut chrysanthemum exports at different times.
Table 1 presents the results of the CMS model for China’s cut chrysanthemums across five periods: 2007–2009, 2010–2012, 2013–2015, 2016–2018 and 2019–2022.
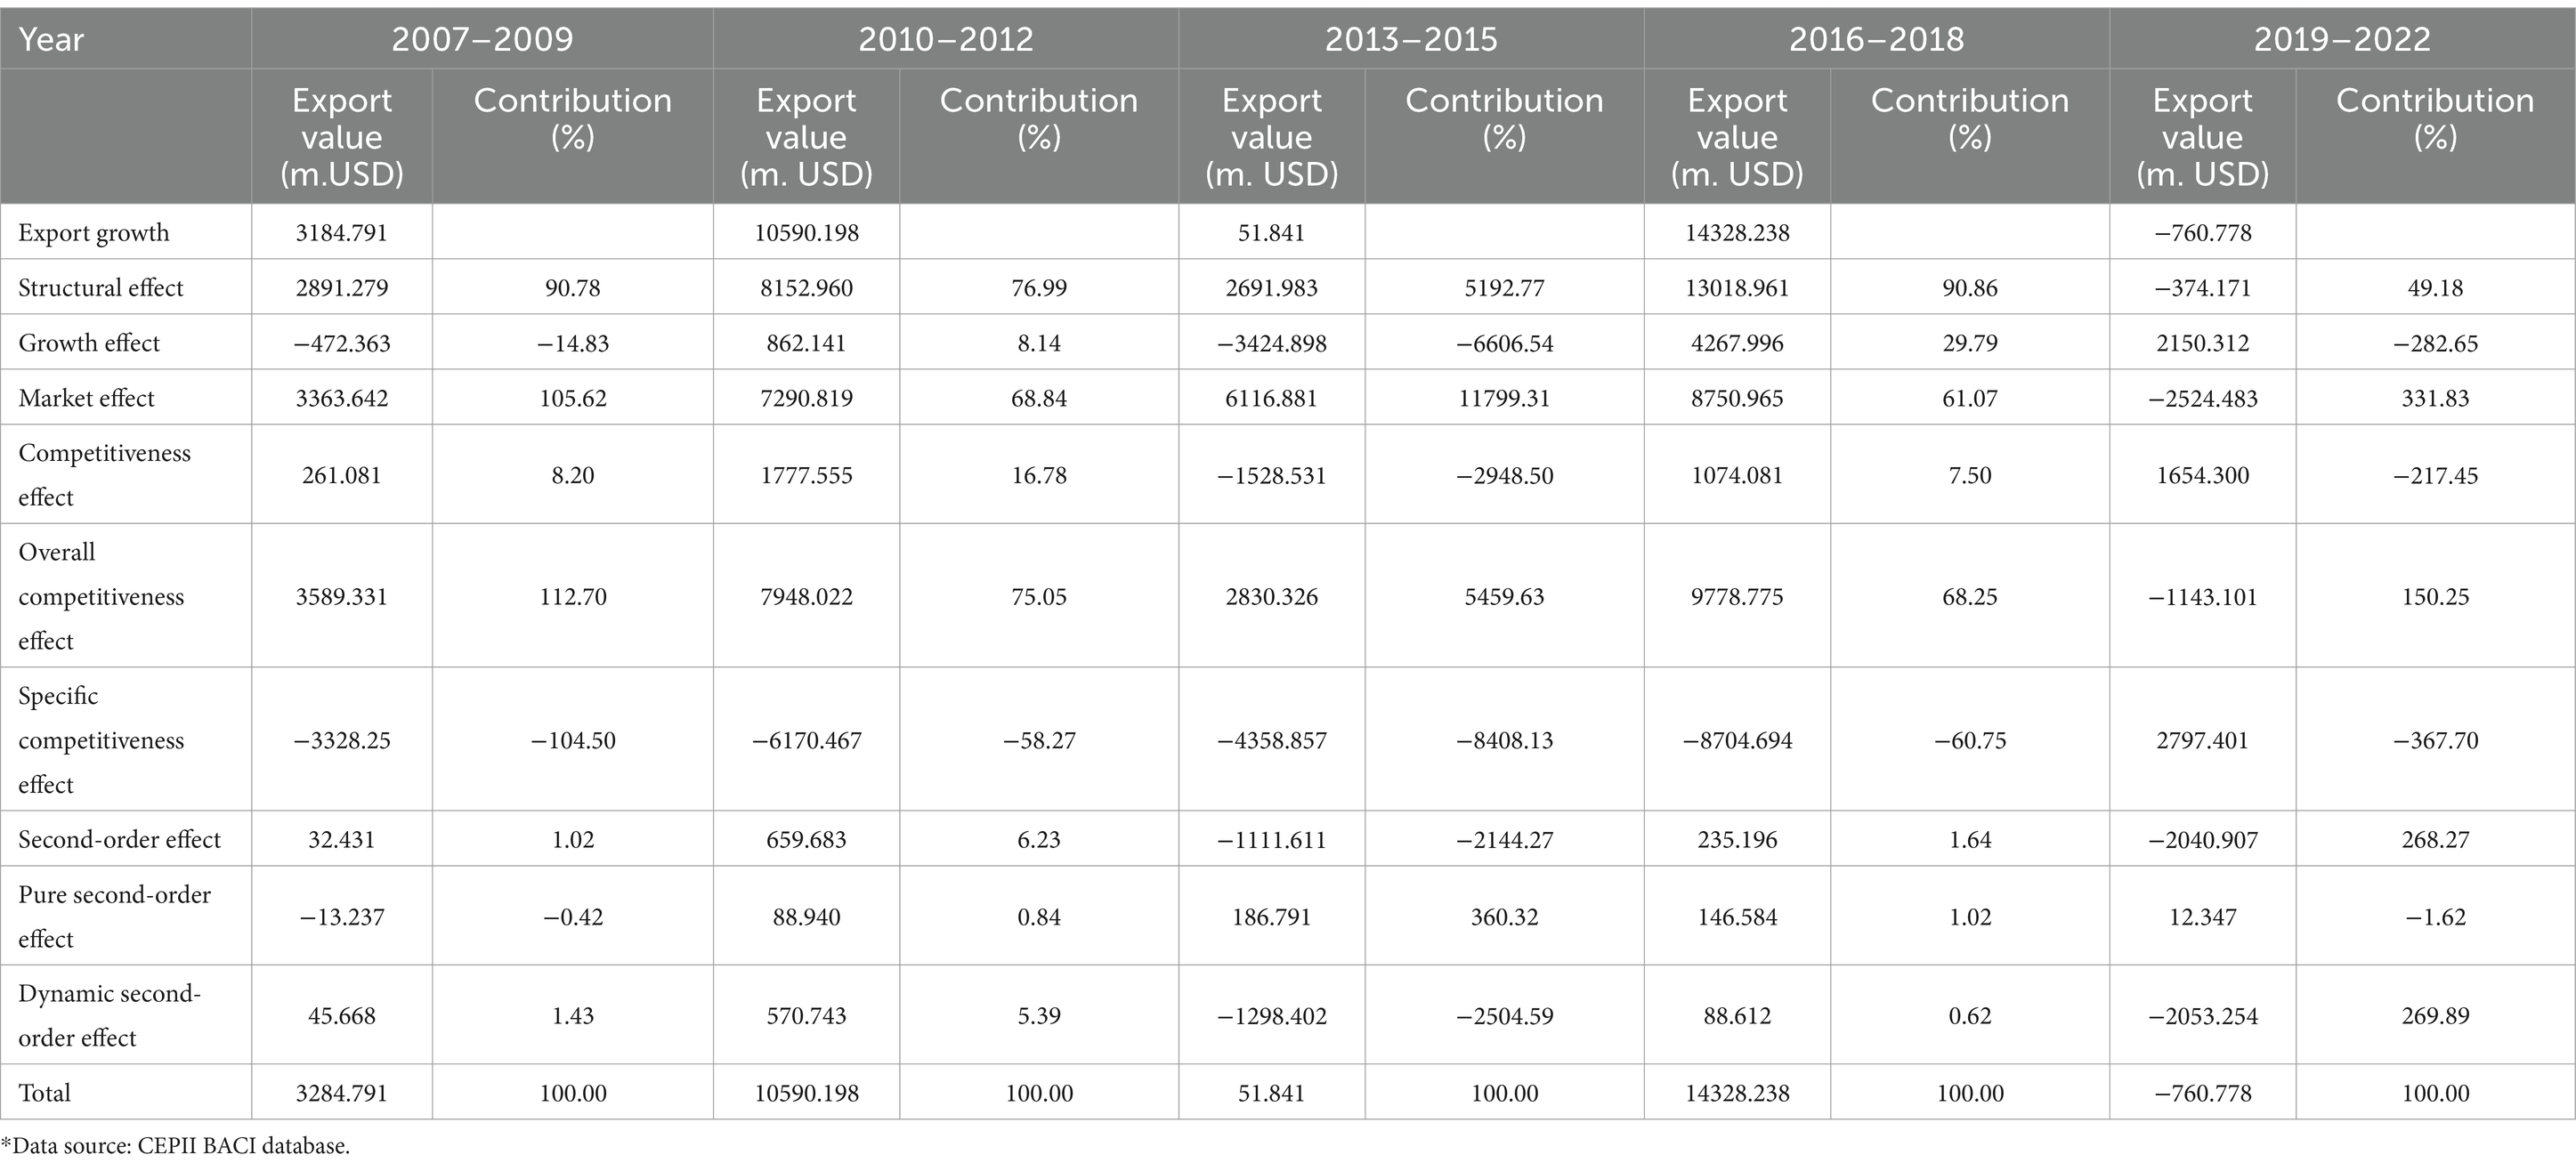
Table 1. Decomposition of export growth of China’s cut chrysanthemum.
The results of the CMS model indicate that: Over the past 16 years, the growth of China’s cut chrysanthemum exports has been highly variable. During the periods of 2013–2015 and 2019–2022, export growth was unstable, with a pattern of decline followed by recovery. However, from 2007 to 2022, the overall trend for cut chrysanthemum export growth has been steadily upward. The growth of China’s cut chrysanthemum exports is influenced by structural effects, competitiveness effects, and second-order effects. Among these, structural effects contribute the most to export growth, followed by competitiveness effects, with second-order effects having the least impact. To understand the reasons behind these results, this study will analyze the structural effects, competitiveness effects, and second-order effects in detail.
The variation in structural effects closely mirrors the fluctuation in export growth, displaying a complex pattern of initial growth, followed by a sharp decline, a subsequent surge, and then a decrease. This pattern closely resembles the changes in the number of patent applications for chrysanthemum breeding and cultivation in China, indicating that innovations in chrysanthemum breeding and cultivation technologies have a positive impact on the development of China’s cut chrysanthemum export trade. The fluctuation in growth effects is more aligned with the degree of fluctuation in structural effects, indicating that the overall increase in global cut chrysanthemum imports has stimulated China’s cut chrysanthemum export trade. In the first four phases, the contribution of market effects to the growth of China’s cut chrysanthemum exports far exceeded that of growth effects. Notably, in the first and third phases, the significant contribution of market effects offset the negative impacts of growth effects. However, in the final phase, the contribution of growth effects surpassed that of market effects. Overall, market effects played a crucial role in driving the growth of China’s cut chrysanthemum exports.
The impact of competitiveness effects on China’s cut chrysanthemum exports is analyzed by observing the dynamic changes in both overall and specific competitiveness effects. Positive competitiveness effects indicate that an increase in overall competitiveness contributes positively to China’s cut chrysanthemum exports, and vice versa. From 2007 to 2012, the competitiveness of China’s cut chrysanthemum exports showed rapid growth. This was followed by a sharp decline during 2013–2015, which was then quickly reversed. Overall competitiveness effects, in the second-order decomposition of various effects, contribute second only to market effects. It is the second most significant factor in enhancing the growth of China’s cut chrysanthemum exports. The contribution value was positive in the first four phases, indicating an overall increase in China’s cut chrysanthemum competitiveness in the global market. However, in the fifth phase, the overall competitiveness was negative. The contribution value of specific competitiveness effects varies across the five phases. From 2007 to 2018, specific competitiveness effects suppressed the growth of China’s cut chrysanthemum exports. In contrast, from 2009 to 2022, specific competitiveness effects drove the growth of cut chrysanthemum exports, offsetting the losses caused by overall competitiveness effects during this period.
The second-order effect represents the growth in exports resulting from the interaction between structural and competitiveness effects, and its analysis serves a corrective function. During the periods of 2013–2015 and 2019–2022, second-order effects had the greatest impact on suppressing the growth of China’s cut chrysanthemum exports. In contrast, during 2007–2009 and 2016–2018, second-order effects had minimal impact on export growth. The period of 2010–2012 saw some positive influence of second-order effects on cut chrysanthemum exports. The pure second-order effects were not significant across the various phases. The impact of second-order effects on China’s cut chrysanthemum exports primarily arises from dynamic second-order effects. Overall, the role of second-order effects in regulating China’s cut chrysanthemum exports is relatively minor.
This study, using data from the Science and Technology Development Center of the Ministry of Agriculture and Rural Affairs (Figure 5), examined the number of new chrysanthemum variety applications in China from 2007 to 2022. Pearson correlation analysis was conducted to assess the relationship between the number of new variety applications and China’s cut chrysanthemum export value. The results indicate a strong positive correlation (r = 0.8345), suggesting that the development of new chrysanthemum varieties significantly contributes to the growth of cut chrysanthemum exports and is a key factor in enhancing China’s trade competitiveness in this sector (Supplementary Appendix E).
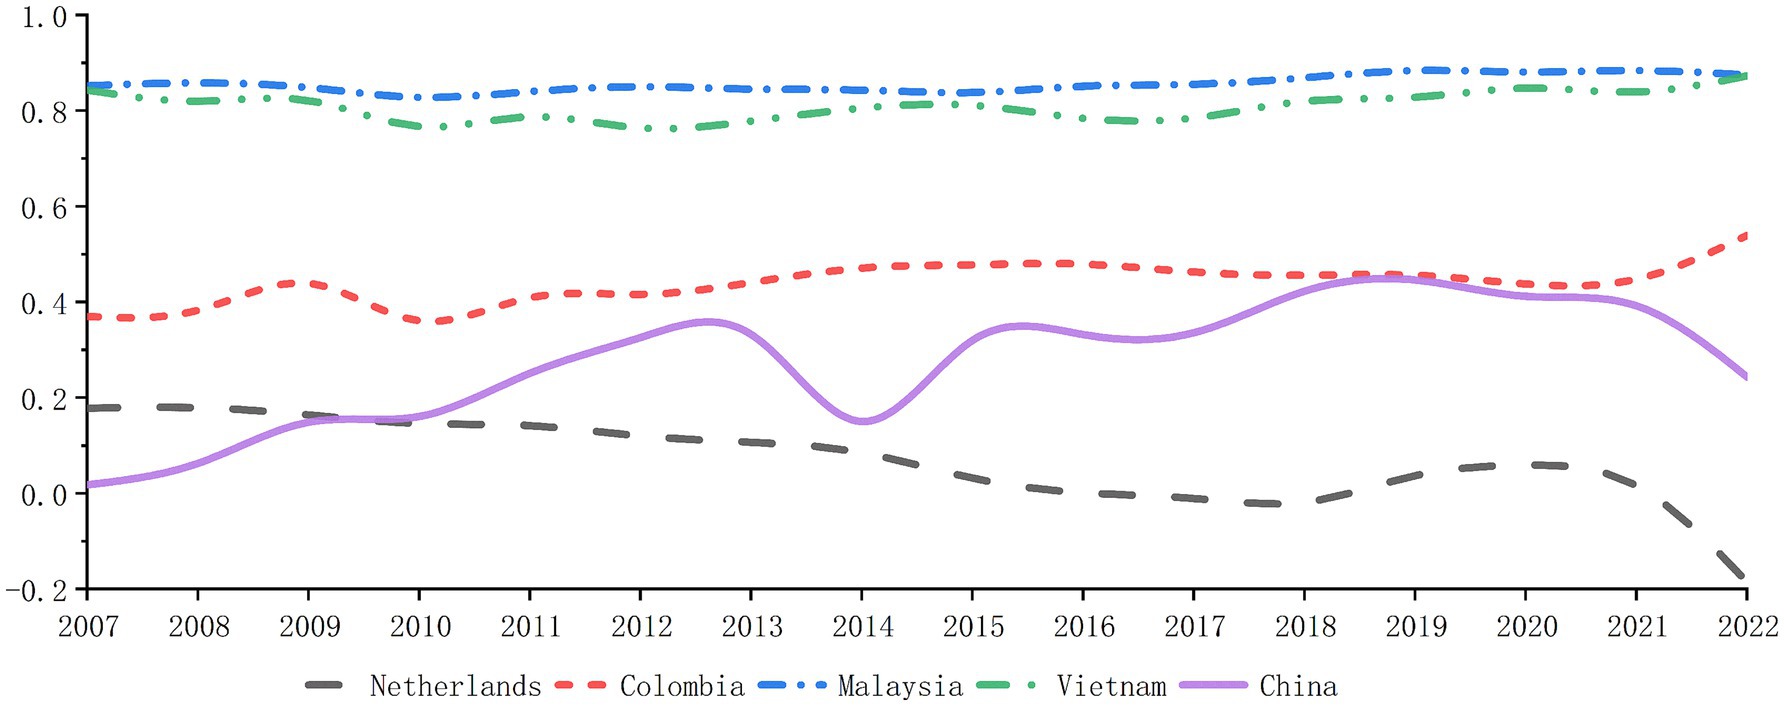
Figure 5. Analysis of the trend of RSCA index for major cut chrysanthemum exporting countries (2007–2022).
The CMS model reveals that market effects and overall competitiveness effects have the most significant impact on the changes in China’s cut chrysanthemum exports. To further analyze the factors influencing China’s cut chrysanthemum exports, this study uses a gravity model of trade with balanced panel data.
The explanatory variables include the GDP and population of the importing countries [Ln (GDP) and Ln (population)], whether the importing country has joined the Belt and Road Initiative [BRI (t)] or has an free trade agreement in force with China [FTA (t)], the importing country’s cut chrysanthemum imports from other countries [Ln (ROW)], whether the importing country is a member of the WTO (WTO_member), the diplomatic relations between the importing countries and China (Diplo_disagreement), the distance between the importing countries and China [Ln (distance)], whether the importing countries and China share a border (Contiguous), and whether they have a common official language (Common_language). Considering the possibility that the trade agreements or the Belt and Road Initiative have a lagged effect on trade, the one-year lag of the FTA and BRI variables are also included [FTA (t-1) and BRI (t-1)]. Three different models are used to test the impact of these indicators on China’s cut chrysanthemum export. The first one uses the natural logarithm of export value as the dependent variable. To consider the zero trade values, we also replace the dependent variable with the natural logarithm of the export value plus one. We also examine the influencing factors on the probability that China has a positive export of cut chrysanthemum to the exporting country in any given year during the sample period. All the regressions include the year fixed effect to control for any China-specific factors such as the GDP of China, as well as any factors that are common to all importing countries such as the exchange rate of the US dollar. The results are shown in Table 2. The following conclusions are drawn from the regression analysis.
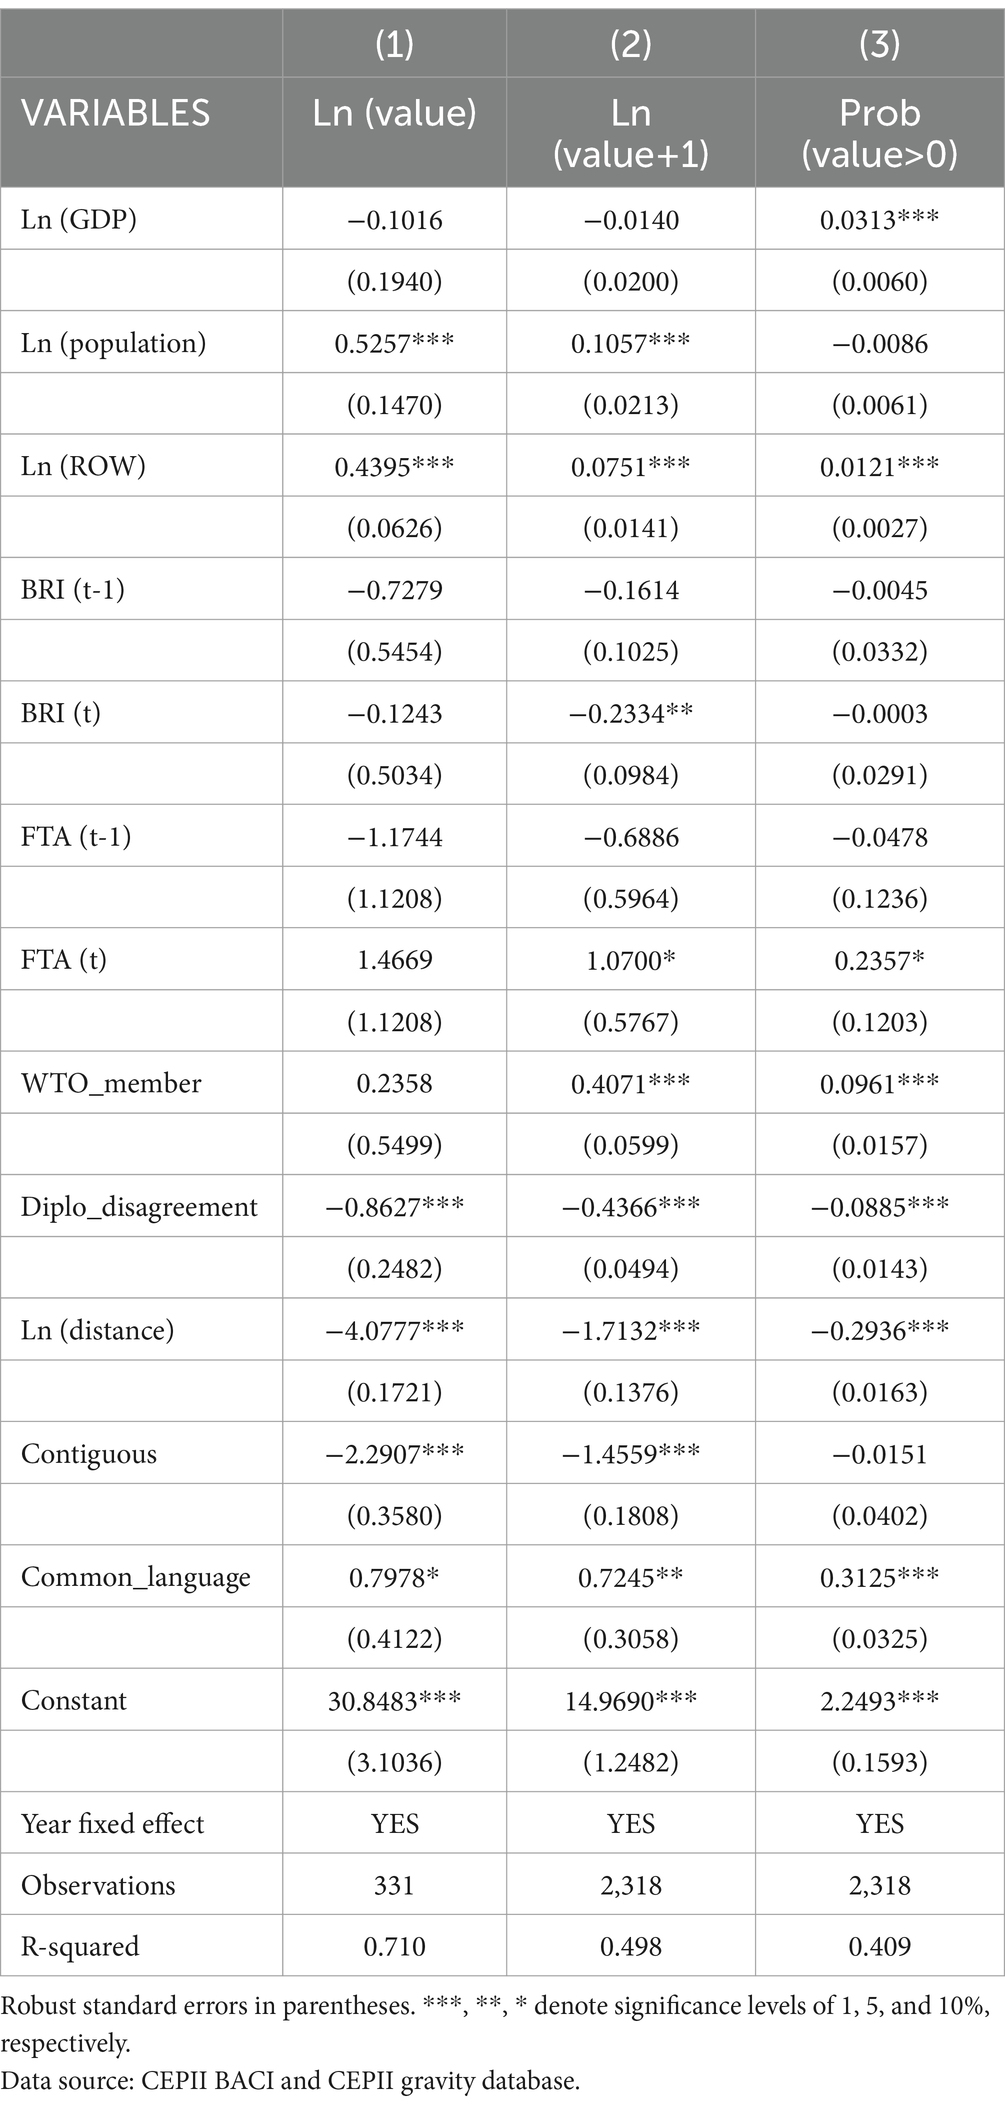
Table 2. The regression results of the gravity model for China’s cut chrysanthemum export.
While the coefficient of the GDP of China’s cut chrysanthemum export destinations is not significantly different from zero, the coefficients for Ln (population) are significantly positive in the first two regressions. This indicates that a larger population size or more imports from other countries of China’s cut chrysanthemum export destinations is associated with larger import of cut chrysanthemum from China. A larger population size of the importing country leads to greater demand for chrysanthemums, thereby enhancing the export of China’s cut chrysanthemum to that country (Figure 6).
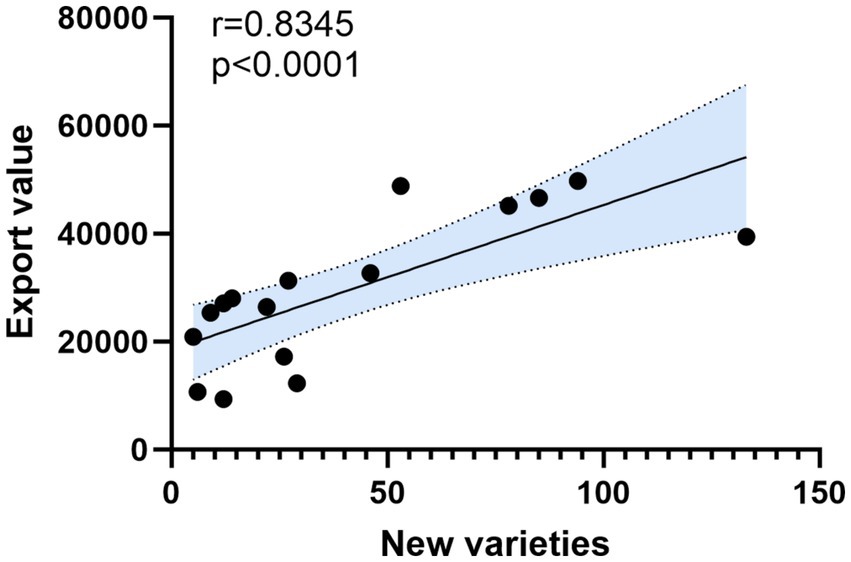
Figure 6. Correlation analysis of new variety applications and cut chrysanthemum export value.
The regression coefficient for the total cut chrysanthemum imports in the importing countries is significantly positive, consistent with the expected direction. Both models’ coefficients pass the 1% significance level test, indicating that for every 1% increase in the cut chrysanthemum imports of China’s export destinations, China’s cut chrysanthemum exports increase by 43.95 and 7.51%. Therefore, Chinese chrysanthemum exporters can adjust their export strategies based on the import levels of cut chrysanthemums in the destination countries to achieve greater export growth.
The regression coefficients for both the distance between the importing countries and China and whether the country shares a border with China are significantly negative, indicating that the geographical distance, as the gravity model indicate, restricts the development of bilateral trade, especially for fresh cut flowers for which fast delivery is crucial. Greater geographical distance increases the trade costs for the exporters, as well as the trade risks and prices, leading to a negative impact on China’s chrysanthemum exports to the destination country.
Besides transportation costs, there are other trade barriers related to trade policies that Chinese exporters need to overcome, such as tariffs and sanitary and phytosanitary (SPS) measures imposed by the importing countries. In Model (2) and Model (3), after considering the zero trade values, the WTO membership and the free trade agreement, which effectively decrease the trade policy barriers of the importing countries, both show significantly positive effect on China’s export of cut chrysanthemums to the importing country. On the other hand, we do not find significant positive effect regarding the participation in the Belt and Road Initiative (BRI), suggesting that even though BRI membership might bring long term benefits to bilateral relations or to the trade of other types of products, it does not have a notable impact on China’s export of cut chrysanthemums.
There are two more interesting variables that are found to have significant effect on China’s export of cut chrysanthemums, Diplo_disagreement and Common_language. The coefficients for diplomatic relations are significantly negative. Since a larger value of the variable Diplo_disagreement means worse diplomatic relations between the importing country and China, this result suggests that improving the bilateral diplomatic relations will enhance China’s export of cut chrysanthemums to the importing country. The coefficients for the common language variable are significantly positive, as common language not only means much less communication costs, but also captures the similarity in culture between the importing country and China, which can affects the consumers’ preference toward Chinese chrysanthemums.
China’s share of the global cut chrysanthemum trade grew from 1.45% in 2007 to 3.67% in 2022, it reached its peak in 2019 (5.83%), showing a strong growth trend. Despite this, China’s export share remains relatively small, with significant room for improvement compared to other leading exporting countries. The export structure analysis reveals that China faces a high concentration in its export markets, with a heavy reliance on Japan and South Korea. This dependency makes China’s exports highly vulnerable to market demand fluctuations. Therefore, reducing reliance on a single market and seeking more stable and diversified markets is crucial for the development of China’s cut chrysanthemum industry.
The RSCA analysis of global cut chrysanthemum competitiveness shows that, while China’s comparative advantage grew significantly from 2007 to 2022, Malaysia and Vietnam exhibited more pronounced and stable comparative advantages in the global market. Moreover, the RSCA index for China’s cut chrysanthemums showed a declining trend after 2014 and again after 2019. A comparison with existing literature reveals that China’s cut chrysanthemum trade is highly sensitive to global economic fluctuations. In 2014, global economic growth slowed, and the outbreak of COVID-19 in 2019 significantly impacted the global economy (Siche, 2020), leading to decreased demand, disrupted supply chains, and export restrictions on flowers (Prantik and Arghya, 2022). During this period, China’s chrysanthemum exports dropped significantly, only beginning to recover after 2023. A study comparing Ethiopia’s flower industry competitiveness before and after the COVID-19 pandemic found that the upward trend in Ethiopia’s comparative advantage slowed significantly after the pandemic. Similarly, flower trade in major flower-producing countries such as the Netherlands, Colombia, Kenya, and Ecuador was also impacted by the global pandemic (Worku et al., 2023), consistent with the findings of this study.
The CMS model analysis of China’s cut chrysanthemum export growth indicates that exports face volatility and instability, primarily influenced by changes in international market demand and production technology. The structural effect plays a dominant role in export growth, particularly the market effect. While the competitiveness effect has generally driven export growth, it experienced a decline during certain periods (such as 2013–2015), and overall competitiveness did not sustain continuous improvement. Additionally, the second-order effects were minimal, primarily reflecting cyclical fluctuations. In analyzing the factors influencing export competitiveness, this study found that China’s cut chrysanthemum trade competitiveness faces several challenges. Firstly, the growth in the GDP of destination countries has not contributed to the growth of China’s trade competitiveness. Although population size and the import value of the destination country positively affect exports, increased transport distance adds to costs and risks. Furthermore, the positive impact of the Belt and Road Initiative on China’s cut chrysanthemum trade competitiveness has been insignificant.
In summary, this study uses the RSCA index to assess China’s comparative advantage in cut chrysanthemum exports. Compared to existing agricultural product competitiveness research (Long, 2021; Hoang, 2020), the RSCA index optimizes the RCA value by applying symmetry and standardization, addressing potential biases and extreme values, thereby making the results more objective, stable, and accurate. This method is particularly important in evaluating the global competitiveness of products in a globalized and complex market environment (Zhou and Tong, 2022). In exploring the factors influencing trade competitiveness, this study adopts the MAS model in conjunction with the gravity model. Compared to existing research, this study takes a more macro-level approach to examine the factors affecting cut chrysanthemum trade competitiveness. This perspective is more beneficial for governments and businesses in formulating solutions to existing issues in international trade.
In global flower trade, government policies play a crucial role in enhancing the export trade and competitiveness of cut chrysanthemums (Vanegas López et al., 2017). In recent years, Vietnam’s cut chrysanthemum trade has grown rapidly, making it one of the top five global exporters. Its policies provide significant insights for China’s trade policy formulation. The Vietnamese government actively supports the agricultural sector by establishing large-scale production bases and integrating product processing with marketing strategies. This approach has effectively improved policy and infrastructure, while creating a transparent, stable, and favorable marketing environment, which has enhanced the competitiveness of businesses within the value chain (Tran and Nguyen, 2018; Angyu et al., 2021). To improve China’s cut chrysanthemum production and quality, several policies have been introduced since 2018, such as promoting “smart agriculture” and “technology-driven agriculture” (Hua, 2021; Liu, 2023). Additionally, in 2020, China signed the Regional Comprehensive Economic Partnership (RCEP) with multiple countries, offering tariff reductions on imports and exports between member states. Furthermore, mechanization has a positive impact on production (Rizwan et al., 2020). China’s government subsidies for purchasing agricultural machinery have greatly contributed to improving productivity and product quality (Yang et al., 2019). However, China’s flower trade still faces challenges such as insufficient variety innovation, low conversion rates of flower technology achievements, gaps in the modernization of production technologies and equipment compared to international standards, an incomplete market circulation system, underdeveloped flower information systems, untapped potential in flower culture, and weak policy support. To address these challenges, this study proposes several policy recommendations aimed at promoting the development of China’s flower industry.
To advance independent innovation in the floral industry, it is essential to integrate domestic research resources, improve the variety innovation mechanisms, strengthen germplasm resource protection, solidify the foundation of seed industry development, and enhance seed production technology and scientific research. In improving the floral industry’s supply chain system, it is crucial to build strengths in the supply chain, cultivate new floral industries and business models, innovate modern floral trading patterns, enhance marketing networks, and optimize logistics and distribution networks. Strengthening technological innovation in the floral industry requires enhancing research, encouraging corporate innovation, emphasizing collaborative efforts, and advancing institutional innovation. Improving floral quality involves optimizing industry structure, increasing the supply of high-quality products, strengthening quality supervision, and fostering brand innovation in the floral sector. To address the lag in the digital development of the floral industry, the government should improve the statistical system for modern floral industries, establish a digital platform, and build an internet infrastructure for the sector. To tap into the potential of Chinese floral culture, it is vital to enhance cultural research and innovation, increase publicity efforts, enrich themed cultural activities, and integrate floral culture into both production and daily life. Furthermore, the government should promote the upgrading of floral consumption by balancing supply and demand dynamics, nurturing new growth points, and strengthening international trade cooperation.
This study aims to accurately assess China’s position and trade competitiveness in the global flower trade, while further exploring the factors that influence the competitiveness of China’s chrysanthemum trade.
To achieve this, the study employs a multi-model approach combining the RSCA index, MAS model, and trade gravity model to conduct statistical analysis of data obtained from the CEPII BACI database. The results of this multi-model analysis reveal that the Netherlands, Malaysia, Colombia, and Vietnam are the largest competitors of China’s cut chrysanthemum exports. From 2007 to 2022, China’s competitiveness in the global flower industry showed rapid growth, with market effects and overall competitiveness having the most significant impact on China’s cut chrysanthemum exports. Factors such as the number of new varieties, the population size of importing countries, and import value positively influence China’s cut chrysanthemum exports, while the geographical distance between countries negatively impacts exports.
The results of this study provide valuable guidance for the development of China’s chrysanthemum industry. First, by analyzing the total export volume and trade value of cut chrysanthemums, this study measures international competitiveness, thereby enhancing the understanding of competitiveness analysis. This study innovatively employs a comparative approach to analyze China’s chrysanthemum industry’s competitiveness in the international flower market from multiple perspectives, thus broadening the research scope. It also provides methodological insights for the assessment of global commodity trade competitiveness and the study of influencing factors. Furthermore, the findings offer deep insights for both academia and the industry in clarifying the positioning, development path, and competitive strategies of China’s chrysanthemum industry in the global market, laying a theoretical foundation for future in-depth research. Additionally, this study reveals the factors influencing cut chrysanthemum trade competitiveness from a macro perspective, offering high-value reference points for the formulation and improvement of import–export trade policies between countries.
Although this study provides a dynamic analysis of China’s cut chrysanthemum trade from a global competitiveness perspective, several limitations remain. First, the granularity and timeliness of data sources represent inherent limitations in research of international trade. Therefore, to provide more timely information and deeper analysis on the trade of cut chrysanthemums, future research on this topic can build upon the analysis presented in this study with more detailed and up-to-date data. For example, firm level data in recent years will allow a more comprehensive investigation into the determinants of China’s export of cut chrysanthemums. Secondly, while this study identified a series of factors that affect China’s chrysanthemums export, the factors influencing China’s global competitiveness in chrysanthemum trade that we consider in this study is far from complete, which is largely due to the availability of data. Future research can explore a broader range of factors from many other perspectives, such as intellectual property protection, protection of new varieties, climate change, cross border e-commerce and so on.
The original contributions presented in the study are included in the article/Supplementary material, further inquiries can be directed to the corresponding author. CEPII-BACI database (https://www.cepii.fr/CEPII/en/bdd_modele/bdd_modele_item.asp?id=37), General Administration of Customs of People’s Republic of China (stats.customs.gov.cn) and Science and Technology Development Center of the Ministry of Agriculture and Rural Affairs (www.nybkjfzzx.cn).
BP: Data curation, Software, Visualization, Writing – original draft. YD: Formal analysis, Methodology, Writing – review & editing. QC: Visualization, Writing – review & editing. YW: Writing – review & editing. LC: Writing – review & editing. HL: Writing – review & editing. CH: Supervision, Writing – review & editing. KG: Funding acquisition, Supervision, Writing – review & editing.
The author(s) declare that financial support was received for the research, authorship, and/or publication of this article. This work was financially supported by the Beijing Natural Science Foundation (6244044), Beijing Science and Technology Association Golden Bridge project (2024) and Science and Technology Department of Sichuan Province (24ZHSF0190).
The authors declare that the research was conducted in the absence of any commercial or financial relationships that could be construed as a potential conflict of interest.
The reviewer YF declared a shared affiliation with the authors BP, HL to the handling editor at the time of review.
The authors declare that no Generative AI was used in the creation of this manuscript.
All claims expressed in this article are solely those of the authors and do not necessarily represent those of their affiliated organizations, or those of the publisher, the editors and the reviewers. Any product that may be evaluated in this article, or claim that may be made by its manufacturer, is not guaranteed or endorsed by the publisher.
The Supplementary material for this article can be found online at: https://www.frontiersin.org/articles/10.3389/fsufs.2025.1521709/full#supplementary-material
Angyu, J., Wei, Z., and Taj, M. K. (2021). Transformation of low added value of Vietnamese agriculture--the path of Sino-Vietnamese agricultural cooperation under adaptive regulation. JEHR J. Educ. Human. Res. Univ. Balochistan 12, 47–65.
Balassa, B. (1965). Trade liberalisation and “revealed” comparative advantage 1. Manch. Sch. 33, 99–123. doi: 10.1111/j.1467-9957.1965.tb00050.x
Ceylan, N. (2019). Revealed comparative advantage of turkish and hungarian wheat sectors. Problemy Rolnictwa Światowego 19, 16–22. doi: 10.22630/PRS.2019.19.3.42
Chen, Q., Gao, K., Xu, Y., Sun, Y., Pan, B., Chen, D., et al. (2023). Research advance on cold tolerance in chrysanthemum. Front. Plant Sci. 14:1259229. doi: 10.3389/fpls.2023.1259229
Dalum, B., Laursen, K., and Villumsen, G. (1998). Structural change in OECD export specialisation patterns: de-specialisation and ‘stickiness’. Int. Rev. Appl. Econ. 12, 423–443. doi: 10.1080/02692179800000017
Fracasso, A. (2014). A gravity model of virtual water trade. Ecol. Econ. 108, 215–228. doi: 10.1016/j.ecolecon.2014.10.010
Gao, K., Chen, Q., Pan, B., Sun, Y., Xu, Y., Chen, D., et al. (2023). Current achievements and future prospects in virus elimination Technology for Functional Chrysanthemum. Viruses 15:1770. doi: 10.3390/v15081770
Ge, M., Jia, H., and Zhao, S. (2024). Constant Maeket share three-level bipolar homogenization model and its application: analysis on driving Factiors of China’s agricultural export growth to countries along the “belt and road” and their contribution rates. Stat. Res. 41, 3–14. doi: 10.19343/j.cnki.11-1302/c.2024.02.001
Guaita-Pradas, I., Rodríguez-Mañay, L. O., and Marques-Perez, I. (2023). Competitiveness of Ecuador’s flower industry in the global market in the period 2016–2020. Sustain. For. 15:5821. doi: 10.3390/su15075821
Hoang, V. V. (2020). Investigating the agricultural competitiveness of ASEAN countries. J. Econ. Stud. 47, 307–332. doi: 10.1108/JES-10-2018-0366
Hua, Y. (2021). Analysis on the influencing factors of China’s flower export trade based on the gravity model under the RCEP background. Times Econ. Trade 18, 58–60. doi: 10.19463/j.cnki.sdjm.2021.08.013
Hughes, A. (2001). Global commodity networks, ethical trade and governmentality: organizing business responsibility in the Kenyan cut flower industry. Trans. Inst. Br. Geogr. 26, 390–406. doi: 10.1111/1475-5661.00031
Jalata, D. H. (2021). Competitiveness and determinants of coffee export in Ethiopia: an analysis of revealed comparative advantage and autoregressive distributed lag model. J. Econ. Sustain. Dev. 12, 43–62. doi: 10.7176/JESD/12-5-05
Jepma, C. J. (1989). Extensions of the constant-market-shares analysis with an application to long-term export data of developing countries. The balance between industry and agriculture in economic development: Proceedings of the eighth world congress of the International Economic Association, Delhi, India. London: Palgrave Macmillan UK, 129–143.
Laursen, K. (2015). Revealed comparative advantage and the alternatives as measures of international specialization. Eurasian Bus. Rev. 5, 99–115. doi: 10.1007/s40821-015-0017-1
Liu, N. (2023). Integration of agriculture and modern technology: research on the current situation and trend of the development of smart agriculture. Rural Revitaliz. Educ. Dev. Seminar 3. doi: 10.26914/c.cnkihy.2023.047512
Long, Y. (2021). Export competitiveness of agricultural products and agricultural sustainability in China. Regional Sustain. 2, 203–210. doi: 10.1016/j.regsus.2021.09.001
Lu, J., Zhang, Y., and Liu, Q. (2015). The CMS model statistical analysis of China 's export growth of horticultural products to Japan. Statics Decision 7, 102–106. doi: 10.3969/j.issn.1003-3890.2011.08.002
Mekapogu, M., Kwon, O.-K., Song, H.-Y., and Jung, J.-A. (2022). Towards the improvement of ornamental attributes in chrysanthemum: recent progress in biotechnological advances. Int. J. Mol. Sci. 23:12284. doi: 10.3390/ijms232012284
Patel-Campillo, A. (2011). Transforming global commodity chains: actor strategies, regulation, and competitive relations in the Dutch cut flower sector. Econ. Geogr. 87, 79–99. doi: 10.1111/j.1944-8287.2010.01102.x
Perry, B D. (2012). The structure and dynamics of cut flower export markets from Kenya and Ethiopia-with particular reference to trade with Norway. Norwegian Institute of International Affairs, Oslo, 26 pp. NUPI Working Paper 797 - ResearchGate. http://hdl.handle.net/11250/277268
Porter, M. (2003). The economic performance of regions. Reg. Stud. 37, 549–578. doi: 10.1080/0034340032000108688
Porter, M. E. (2012). The economic performance of regions[M]//Regional competitiveness. Routledge, 131–160.
Prantik, H, and Arghya, G. (2022). COVID-19 pandemic and resilience in the agricultural sector: a local strategy may solve the global challenges. Agric. Res. 38.
Rizwan, M., Qing, P., Saboor, A., Iqbal, M. A., and Nazir, A. (2020). Production risk and competency among categorized rice peasants: cross-sectional evidence from an emerging country. Sustain. For. 12:3770. doi: 10.3390/su12093770
Sari, E. T., and Divinagracia, M. R. G. (2021). Revealed comparative advantage and constant market share analysis of Indonesian cinnamon in the world market. Int. J. Econ. Policy Emerg. Econ. 14, 187–198. doi: 10.1504/IJEPEE.2021.113583
Shuai, J., Peng, X., Zhao, Y., Wang, Y., Xu, W., Cheng, J., et al. (2022). A dynamic evaluation on the international competitiveness of China's rare earth products: an industrial chain and tech-innovation perspective. Resources Policy 75:102444. doi: 10.1016/j.resourpol.2021.102444
Siche, R. (2020). What is the impact of COVID-19 disease on agriculture? Scientia agropecuaria 11, 3–6. doi: 10.17268/sci.agropecu.2020.01.00
Steen, M. (2010). A world of flowers: Dutch flower auctions and the market for cut flowers. J. Appl. Hortic. 12, 113–121. doi: 10.37855/jah.2010.v12i02.24
Tian, K., Zhu, K., and Yang, C. (2017). Re-estimate revealed comparative advantage based on value added exports and trade heterogeneity: an analysis for China. Chin J. Manag. Sci. 9, 1–10. doi: 10.16381/j.cnki.issn1003-207x.2017.09.001
Tran, T. H. M., and Nguyen, T. H. Y. (2018). Vietnam's agriculture towards sustainable development: opportunities, challenges and solutions in the context of international economic integration nowadays. Bus. Econ. Law 15, 63–70. https://seajbel.com/wp-content/uploads/2018/06/SEAJBEL15_34-1.pdf
Vanegas López, J. G., Merlos García, J. J., and Mayorga Abril, C. M. (2017). Flower export barriers: a comparative study in Colombia, Mexico and Ecuador. Lat. Am. Bus. Rev. 18, 227–250. doi: 10.1080/10978526.2017.1354705
Worku, M. A., Debela, K. L., and Mudde, H. L. M. (2023). Competitive performance of the Ethiopian flower industry from a pre-to post COVID-19 pandemic era (2003-2022): a comparative study. Int. J. Organ. Leadersh. 12, 91–114. doi: 10.33844/ijol.2023.60370
Wu, H. W., Zhang, S. X., and Liu, M. Y. (2019). Research on the trade competitiveness of China and ASEAN from OBOR based on the analysis of improving revealed comparative advantage index. J. Int. Econ. Coop. 6, 53–61.
Yang, Z., Zhang, J., and Zhu, P. X. (2019). Can specialized agricultural services promote small farmers to be involved in modern agriculture? ——based on the Persprctive of technical Efficency. J. Agrotech. 9, 16–26. doi: 10.13246/j.cnki.jae.2019.09.002
Zhang, L., and Dai, S. (2009). Research advance on germplasm resources of Chrysanthemum× morifolium. Chinese Bulletin of Botany 44:526. doi: 10.3969/j.issn.1674-3466.2009.05.002
Zhao, H. (2022). Research on the influencing factors of China;s export of automobiles to Latin America——Analysis based on CMS model and trade gravity model : Central University of Finance and Economics.
Keywords: cut chrysanthemums, international competitiveness, bilateral trade, CMS model, trade gravity model
Citation: Pan B, Du Y, Chen Q, Wang Y, Chen L, Li H, Huang C and Gao K (2025) China’s chrysanthemum in the global market: evaluating the international competitiveness and influencing factors. Front. Sustain. Food Syst. 9:1521709. doi: 10.3389/fsufs.2025.1521709
Edited by:
Siphe Zantsi, Agricultural Research Council of South Africa (ARC-SA), South AfricaReviewed by:
Yongming Fan, North China University of Water Conservancy and Electric Power, ChinaCopyright © 2025 Pan, Du, Chen, Wang, Chen, Li, Huang and Gao. This is an open-access article distributed under the terms of the Creative Commons Attribution License (CC BY). The use, distribution or reproduction in other forums is permitted, provided the original author(s) and the copyright owner(s) are credited and that the original publication in this journal is cited, in accordance with accepted academic practice. No use, distribution or reproduction is permitted which does not comply with these terms.
*Correspondence: Kang Gao, Z2Fva2FuZzIwMTVAYmpmdS5lZHUuY24=; Conglin Huang, Y29uZ2xpbmhAMTI2LmNvbQ==
Disclaimer: All claims expressed in this article are solely those of the authors and do not necessarily represent those of their affiliated organizations, or those of the publisher, the editors and the reviewers. Any product that may be evaluated in this article or claim that may be made by its manufacturer is not guaranteed or endorsed by the publisher.
Research integrity at Frontiers
Learn more about the work of our research integrity team to safeguard the quality of each article we publish.