 Shalander Kumar
 Soumitra Pramanik
 Thomas Reardon3,4
 E. Revathi
94% of researchers rate our articles as excellent or good
Learn more about the work of our research integrity team to safeguard the quality of each article we publish.
Find out more
ORIGINAL RESEARCH article
Front. Sustain. Food Syst. , 04 February 2025
Sec. Land, Livelihoods and Food Security
Volume 9 - 2025 | https://doi.org/10.3389/fsufs.2025.1490050
Our study analyzes the determinants, sources, and levels of protein consumption among 785 households across nine districts in six Indian states in the semi-arid tropics. We found that 80% of these households consumed less protein than recommended and relied on cereals for 60–75% of their protein intake. Notably, even when protein-rich foods are accessible to households, they still consume them insufficiently. We found that their protein intake deficiency is driven by a lack of diversity of protein sources (in particular, legumes, millets, and livestock), as well as by a dearth of women's education and role in household decision-making and low incomes and assets. We advocate for initiatives to raise nutrition awareness, empower women, and adopt a nutrition-centric farming approach.
Household food insecurity is a significant risk factor for malnutrition in dryland regions, particularly in low- and middle-income countries (LMICs) (Militao et al., 2022; Tydeman-Edwards et al., 2018). The persistent challenge of the “triple burden of malnutrition”—the simultaneous prevalence of undernutrition, micronutrient deficiencies, and overnutrition—has added layers of complexity to addressing food insecurity. Ensuring food security, defined as consistent access to sufficient and nutritious food for all, is not only a fundamental human right but also a cornerstone for sustainable development, ecological balance, and social welfare (Burchi and De Muro, 2012; Richardson, 2010). While self-sufficiency in food production has historically been regarded as the principal strategy to achieve food security, evidence suggests that self-sufficiency alone does not guarantee equitable access to food (Koroleva, 2021; Parvis, 2019). Traditionally, food security literature and policies have prioritized energy intake, often overlooking the critical role of protein consumption. This gap is particularly pronounced in regions burdened by high levels of malnutrition, where protein-related deficiencies remain inadequately addressed. Despite significant progress in daily energy intake in several low- and middle-income countries (LMICs), undernutrition, particularly protein and micronutrient insufficiency, remains a widespread and persistent challenge and is one of the major causes of malnutrition (Vissamsetti et al., 2023; Drewnowski, 2024). While extensive research has focused on malnutrition in these regions, there is a notable gap regarding the drivers of protein consumption. The understanding of the drivers of low or inadequate protein consumption in LMICs remains limited (Ghosh et al., 2012; Winichagoon and Margetts, 2017; Andreoli et al., 2021). While research has focused on the impacts of protein underconsumption on health and productivity (Scialabba, 2022), not much evidence is available on a complex interplay of factors that may drive the intake of protein-rich foods (Andreoli et al., 2021; Swaminathan et al., 2012).
Despite advances in food production and income growth, high protein-energy malnutrition (PEM) remains prevalent, especially in rural, semi-arid regions. While prior research highlights income and food availability as primary determinants of dietary quality (Behrman and Deolalikar, 1987; Swaminathan and Bhavani, 2013), emerging evidence suggests that food availability alone does not ensure nutritional adequacy. Factors like cultural norms, gender roles, and household decision-making also shape dietary choices significantly (Kearney, 2010; Chinnakali et al., 2014). This study addresses these overlooked behavioral and socio-cultural drivers by examining the influence of household-level variables—particularly women's education, decision-making autonomy, and local food diversity—on protein intake in rural India.
Our study uses panel household data from a survey of 782 households in the semi-arid tropical (SAT) regions of India. The panel analysis uses data at two points in time to analyze protein consumption patterns and determinants.
This study draws on longitudinal socioeconomic data from the Village Dynamics Studies in South Asia (VDSA)1 project, collected and managed by the International Crops Research Institute for the Semi-Arid Tropics (ICRISAT). These VDSA datasets are rare in rural India. These monthly dataset from 2009 to 2014 provides details on household food consumption as well as socio-economic variables influencing nutrition over time. We focused our analysis on balanced panel data to ensure the comparability of households over time for two specific years: 2011, a typical agricultural year within the period, and 2014, the most recent year. We used data only from households present in the sample in both years. The data cover 18 villages across nine districts in six Indian states—Andhra Pradesh, Gujarat, Karnataka, Madhya Pradesh, Maharashtra, and Telangana (Figures 1, 2). These regions have various cultures, including Hindu, Muslim, and associated tribal communities, each with unique food preferences and taboos affecting protein intake sources, such as legumes, dairy, and animal-based proteins.
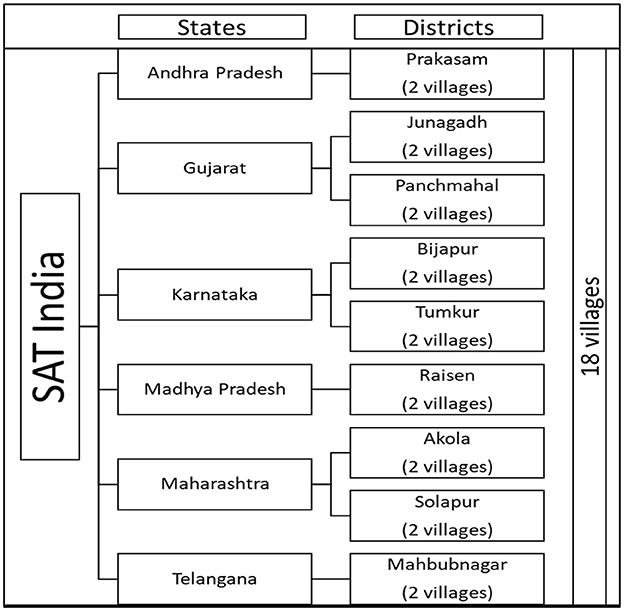
Figure 1. Distribution of ICRISAT SAT Villages. Source: http://vdsa.icrisat.ac.in/.
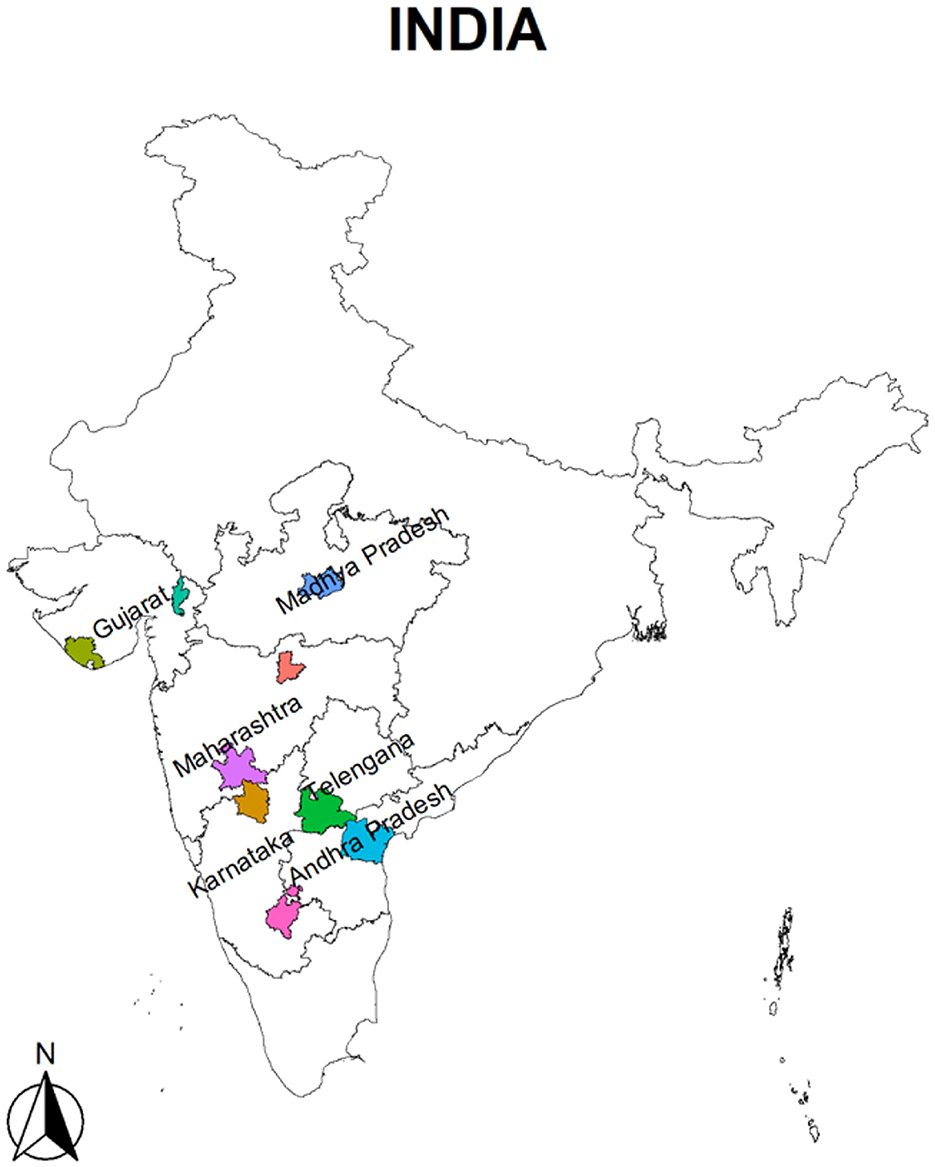
Figure 2. ICRISAT VDSA state wise district's location. Source: Developed using available shapefiles. Each color polygon represents one study district.
The protein content of major food items was calculated using the methods and standards set out in Indian food composition tables (Longvah et al., 2017). Using the monthly consumption data for the years 2011 and 2014, the daily intake of each type of food was calculated from the total weight of the raw food cooked for the household. The consumption unit (CU) for each sample household was calculated based on National Institute of Nutrition (NIN) 1980 which considers specific weights for adult men, adult women, adolescents, and children as mentioned in the Equation 1;
Also, the per-capita protein intake (adult male equivalent for moderate worker) of each household member was estimated using Equation 2.
This study adopted the Recommended Dietary Allowance (RDA) for protein in Gopalan et al. (1980) and ICMR - NIN (2020), which recommended a minimum intake of 60 g per day for an average adult male who is doing at least sedentary work. We utilized this benchmark to classify sample households into three nutritional categories relative to their daily per capita protein consumption. Households meeting at least 90% of this RDA (≥54 g/CU/day) were considered “not deficient”. Those with intake levels between 43 and 54 g/CU/day were classified as “moderately deficient”, while households consuming < 43 g/CU/day were labeled “highly deficient”.
We used balanced-panel probit and OLS regression models, chosen for their suitability in handling binary and continuous outcomes, respectively. We used as working assumptions that household income, food diversity, and education influence protein consumption, aligning with the nutrition literature. We started with a panel probit regression, followed by the computation of marginal effects (dy/dx) for the covariates. The explanatory variables included: (1) education, comprising the education of the household head, the highest educational level within the household and a binary variable for the gender of the most educated individual; (2) per capita household expenditure as a proxy for income; (3) operational landholding size, a proxy for both wealth and capacity for home production of foods including protein sources; (4) crop diversity index and a protein consumption diversity index, which reflects the variety of protein sources in the diet. Income, education and access to diverse protein sources are expected to positively influence protein intake (Drewnowski and Almiron-Roig, 2010).
To investigate whether the above determinants significantly determine protein consumption, we fitted two separate probit regression models. Model 1 examined the conditions under which household income is a positive determinant of protein consumption, whereas Model 2 explored how home production of protein-rich foods impacted protein intake.
We then estimated district-level Ordinary Least Squares (OLS) regression. These analyses posited per capita protein consumption as a function of per capita household income and per capita protein food production on the household's own farm. For the probit models, a household's dependent variable was assigned a value of 1 if the relationship between per capita income and daily protein consumption—or between home-produced protein availability and daily consumption—was statistically significant, and 0 otherwise. We estimated the above regressions per district as well as across districts.
Table 1 presents findings from the analysis of our data averaged over 2011 and 2014 per district for the nine districts in the sample. The table shows per capita daily consumption of protein from all sources (crops, legumes, milk, meat, and eggs) from home production and purchases. Average daily per capita protein intake varied from 38 g/CU/day in Mahbubnagar to 52g/CU/day in Bijapur The shares of home production vs. purchases differ over districts as well: for example, in Prakasam and Mahbubnagar, 84% and 79%, respectively, came from purchased, while in Panchmahal, the 60% was from own-farm sources. The other districts had roughly half-half of home production and purchases. The high share of purchases may surprise in view of the traditional view that farm households produce their own food and purchase little.
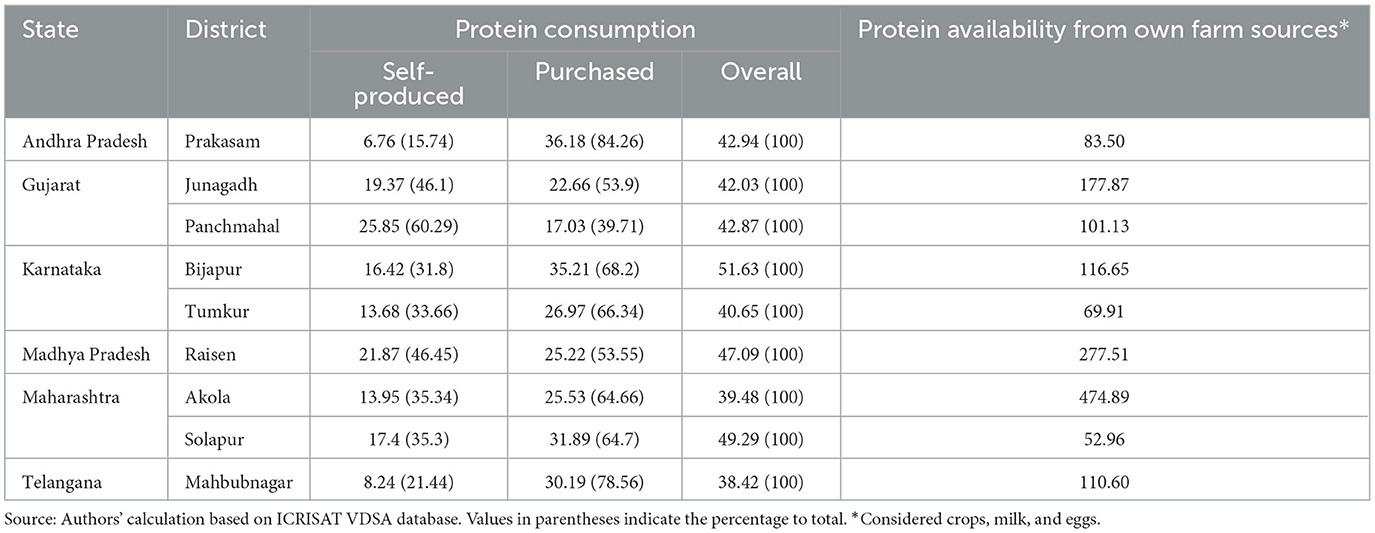
Table 1. Average protein consumption from all sources and availability from home production (g/CU/day) across six states, nine districts in the semi-arid regions of India (2011 and 2014 average).
The per capita availability of protein from own-farm sources exceeded the per capita protein requirement of 60 g per day per person in eight out of nine districts, with availability ranging from 70 to 475 g. Solapur with only 53 g per day. Despite these high levels of protein availability from own farm production, per capita protein consumption across all districts remained far below the recommended 60 g per day, with Solapur, notably, recording the second-highest per capita protein consumption (49 g) despite its relatively low on-farm protein availability (Figure 3). These findings highlight district-level differences between protein availability and actual consumption.
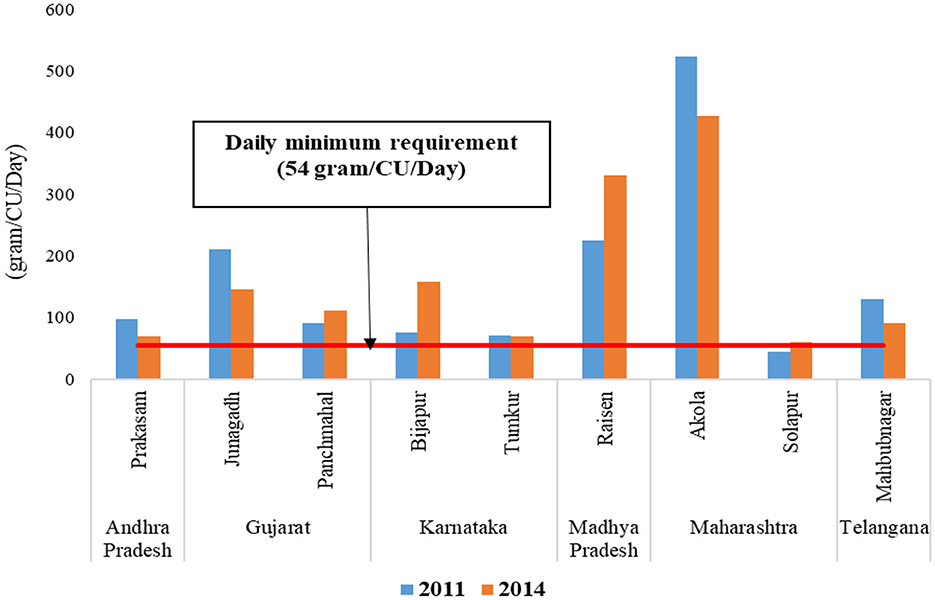
Figure 3. Availability of protein from own farm production across districts: 2011 and 2014.
Table 2 presents the diversification of protein sources within the household's diets across various districts/states Cereals (rice, wheat, maize etc.) and millets were the predominant protein source, accounting for 62–73% of daily protein intake. Pulses, legumes, and nuts formed the second major source of protein consumption in five districts, while in the other four districts, milk and milk products and other animal sources of food were the second most important sources of protein. The share of the second major source varied between 10 and 27 % of the total protein intake. Milk and milk products contributed 27% in Junagadh, Gujarat, and the legumes contributed the 24% in Bijapur, Karnataka. The intake of animal sources, excluding milk products, remains notably low in several districts with Junagadh, Gujarat reporting zero consumption. Districts such as Tumkur in Karnataka and Mahbubnagar in Telangana show higher shares of animal proteins other than milk at 11% and 10%, respectively.
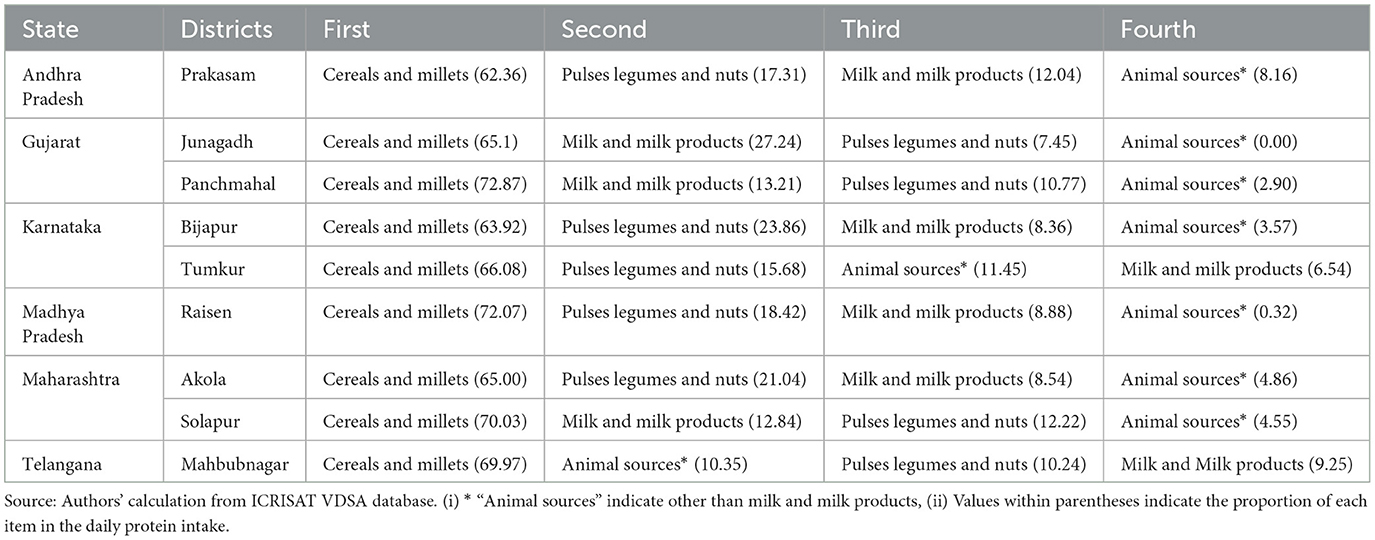
Table 2. Importance and contribution (%) of different sources to households' daily protein consumption, India (2011 and 2014 average).
This dietary composition reflects a reliance on plant-based proteins and minimal animal-source foods in poor, semi-arid zones. Even dairy products did not contribute significantly to protein intake despite their availability.
A large majority of the households were protein-deficient in terms of their daily consumption. At the aggregate level only 18% of the households consumed 54 g or more of protein per day per CU, and the remaining 82% were either moderately or highly protein-deficient in 2011; in 2014, we observed a similar pattern across households (Figure 4). While the percentage of moderately protein-deficient households decreased from 38% in 2011 to 29% in 2014, highly deficient households increased from 44% to 52%. At the district level, household incidence of protein intake deficiency was high in six out of nine districts, with 53% of households highly deficient in Panchmahal to 77% in Mahbubnagar. Three districts performed better: Raisen (19%), Solapur (20%) and Bijapur (25%) in 2014 (Table 3). Protein intake trends between 2011 and 2014 were observed to be mixed. The share of deficient households increased significantly in Prakasam, Mahbubnagar, Tumkur, and Akola districts. At the same time, it significantly decreased in Panchmahal and Raisen, which are relatively low-income districts.
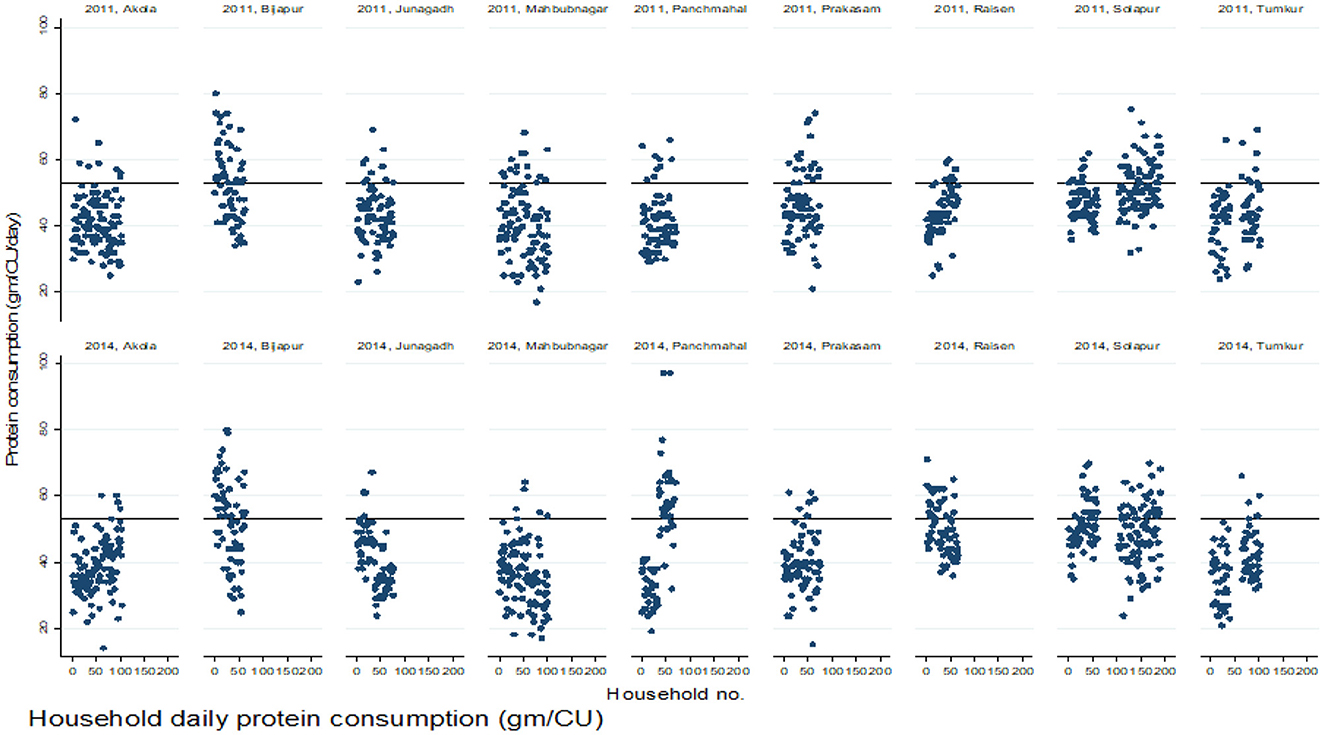
Figure 4. Distribution of households' daily protein consumption across districts: 2011 and 2014.
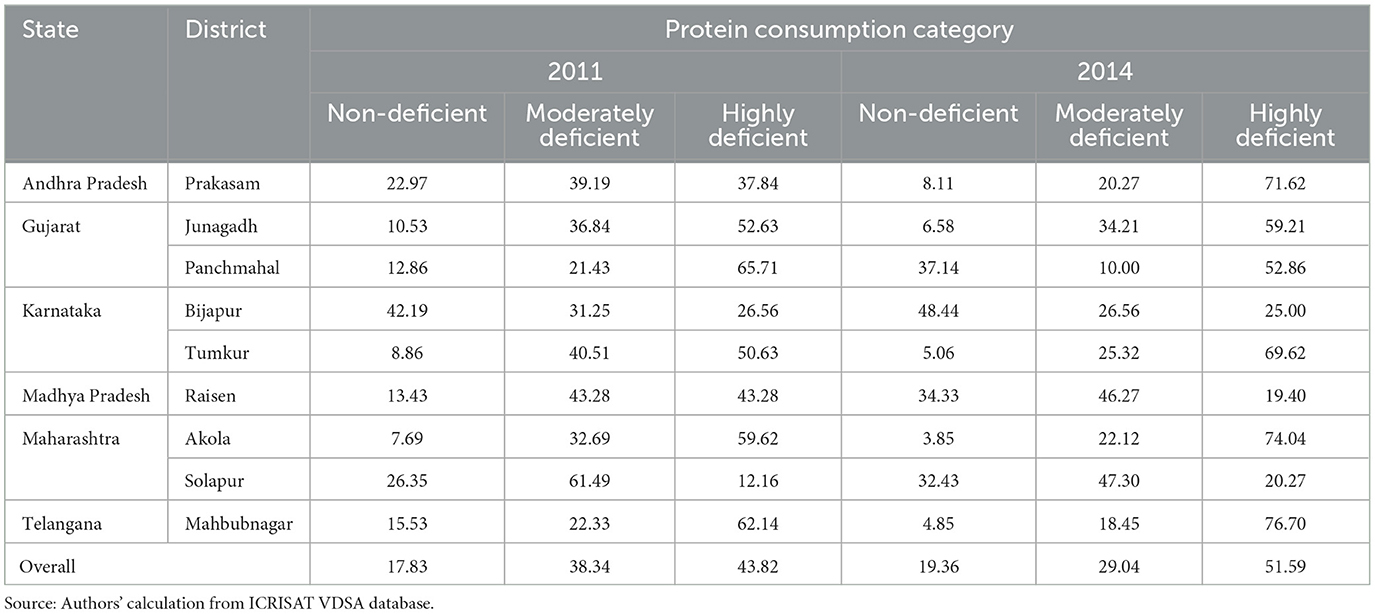
Table 3. District-wise distribution of households (%) across protien consumption categories in terms of its daily intake in 2011 and 2014.
Although the overall share of households in the non-deficient category remained almost unchanged at 18%−19% in 2011 and 2014, a number of individual households, however, moved from one category to another. At the disaggregated level, about 10% of the households moved from the non-deficient to the deficient category during 2011 and 2014; 7% moved from moderately deficient to non-deficient; and 16% moved from moderately protein-deficient to the highly deficient. Four percentage of the households moved from highly deficient to the non-deficient, and 8% to moderate deficient (Table 4). Out of 44% highly deficient households in 2011, 31% remained in the same status and were not able to move to better consumption status. Thus, both trends, movement of households from deficient to less deficient or no-deficiency and non-deficient to deficient co-existed.
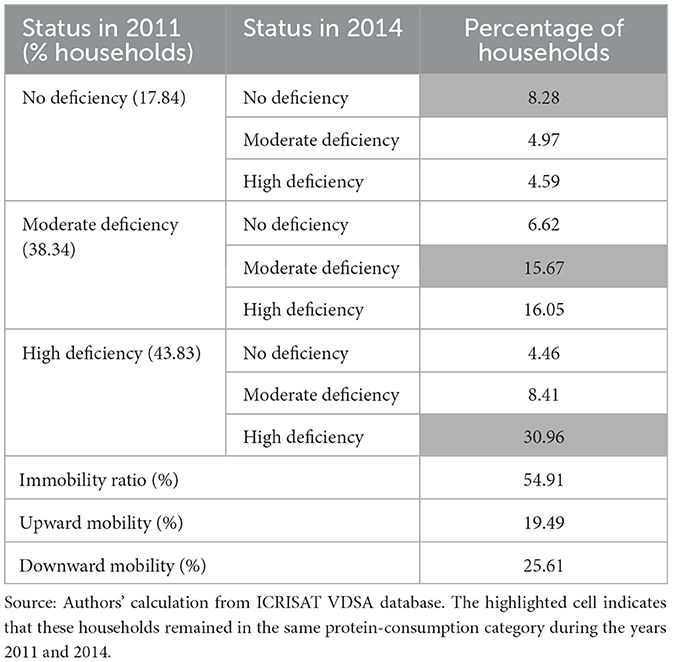
Table 4. Household protein consumption category mobility matrix, India (N = 785).
The study households were classified into four relative income groups (with total expenditure as proxy for income as noted above): “very low income”, “low income”, “medium income”, and “high income”. We found that protein consumption deficiency levels did not significantly vary across the income groups at the aggregate level (Table 5). The households in the higher income group were also highly protein deficient, 27% in 2011 and 49% in 2014. In the low-income group, the incidence of protein deficiency remained high. However, it reduced over time. The share of deficient households across income categories, very low to high income, was in the same range from 56 to 49%. This finding implies that protein consumption levels of households are not in direct relationship with income levels; clearly non-income factors play roles.
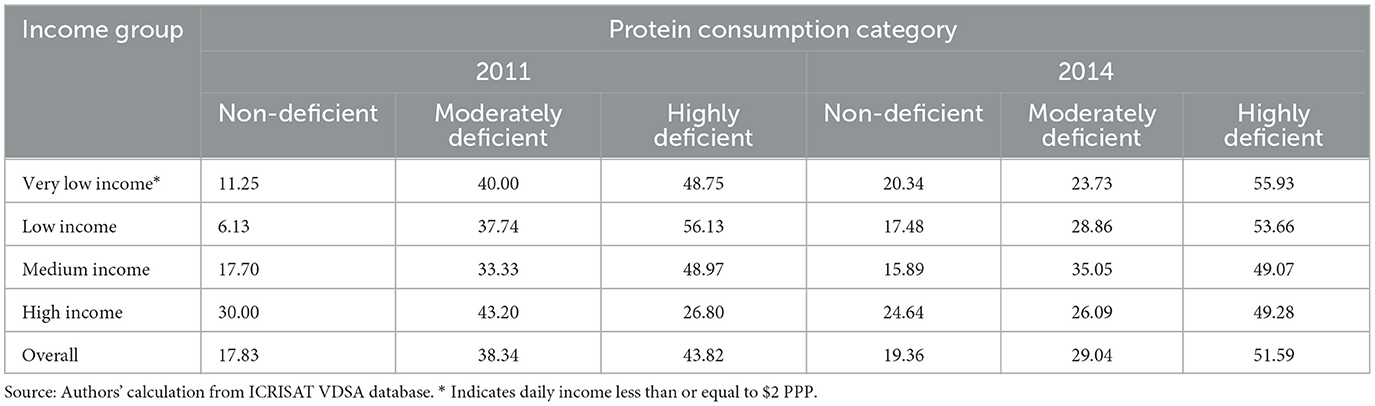
Table 5. Distribution of households (%) across income groups and protein consumption categories.
Social status or caste may influence the nutritional intake of a household. Though 78%−92% households over different social categories showed a deficiency of protein consumption, there was a higher concentration of highly protein-deficient households in the socially and economically backward categories, particularly the Scheduled Tribe (Table 6). The scheduled caste (SC) category's protein consumption was better than the backward category, which is socially and economically better off than the SC category. Thus, the association of protein consumption was not linear even over social categories.
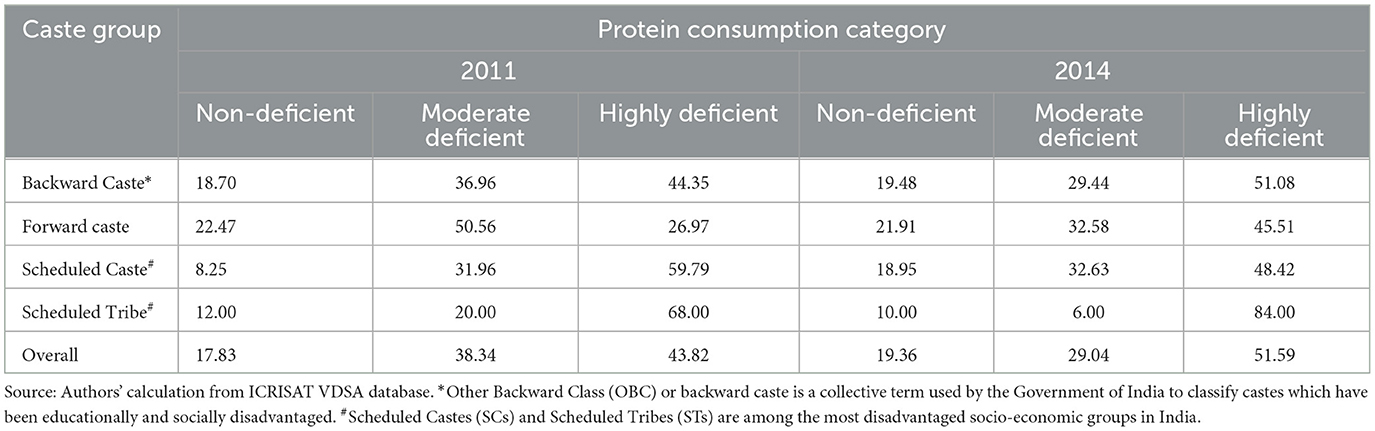
Table 6. Distribution of households (%) across protein consumption categories and social groups.
Table 7 shows the socioeconomic characteristics of small farmer households that may influence protein intake. Family consumption units (adult equivalents), education, protein consumption diversity, the proportion of millets and legumes in the gross cropped area (GCA), and the size of operational landholdings did not change over the 2011–2014 period. The value of farm and non-farm assets and livestock ownership increased, but per capita food expenditure and income, crop diversity, and daily milk availability decreased over the same period.
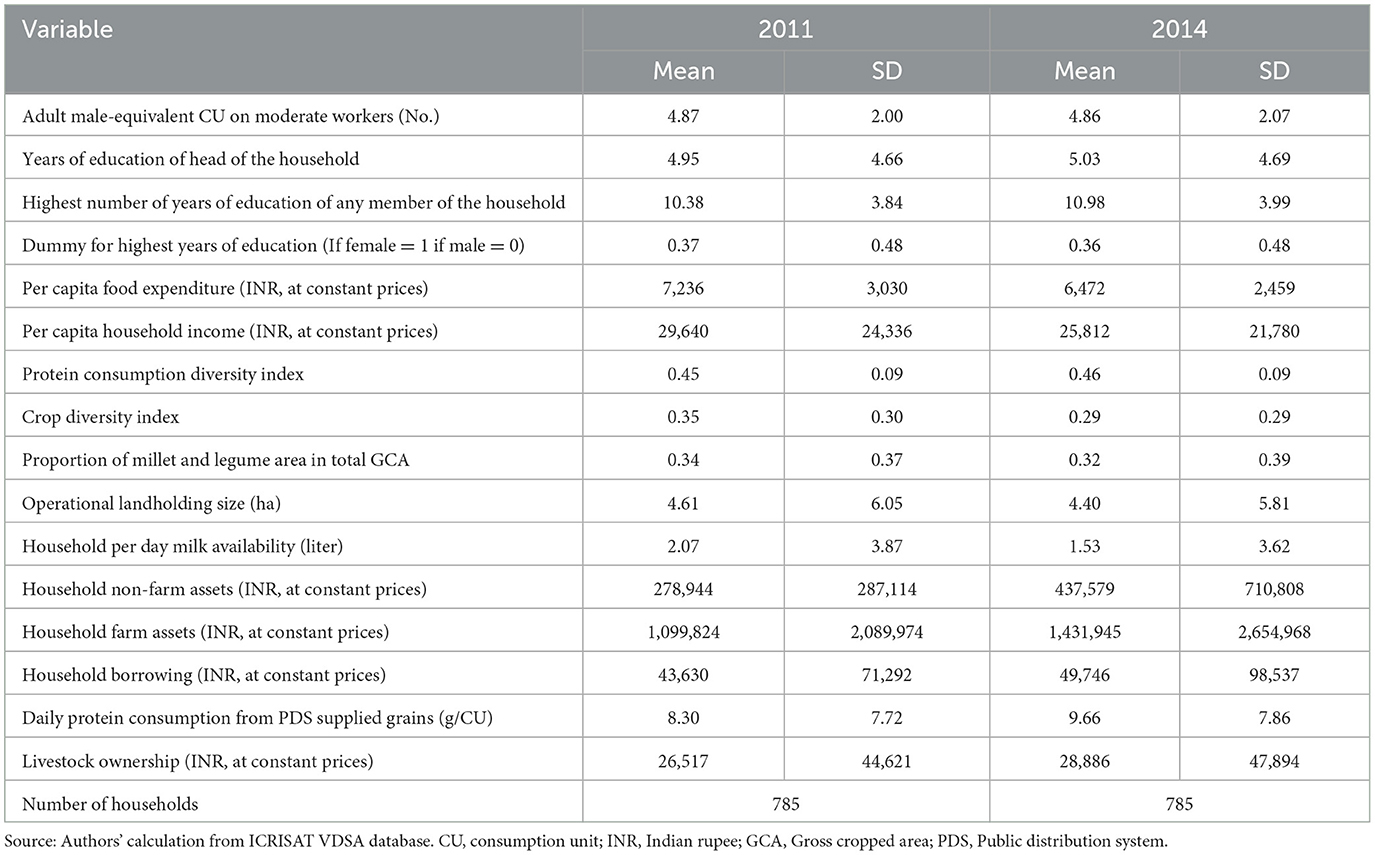
Table 7. Summary statistics of households' relevant characteristics.
Descriptive analysis of household characteristics does not reveal any uniform patterns of association with households' protein consumption intake deficiency or sufficiency levels (Tables 4–7). These findings led us to estimate regression to analyze different socioeconomic drivers that could explain the differential protein intake levels in seemingly similar population samples across household categories and regions. We report these in the next section.
Table 8 shows our estimations of two probit balanced-panel models to examine the association of household income, own farm production, and protein intake as influenced by various other variables.
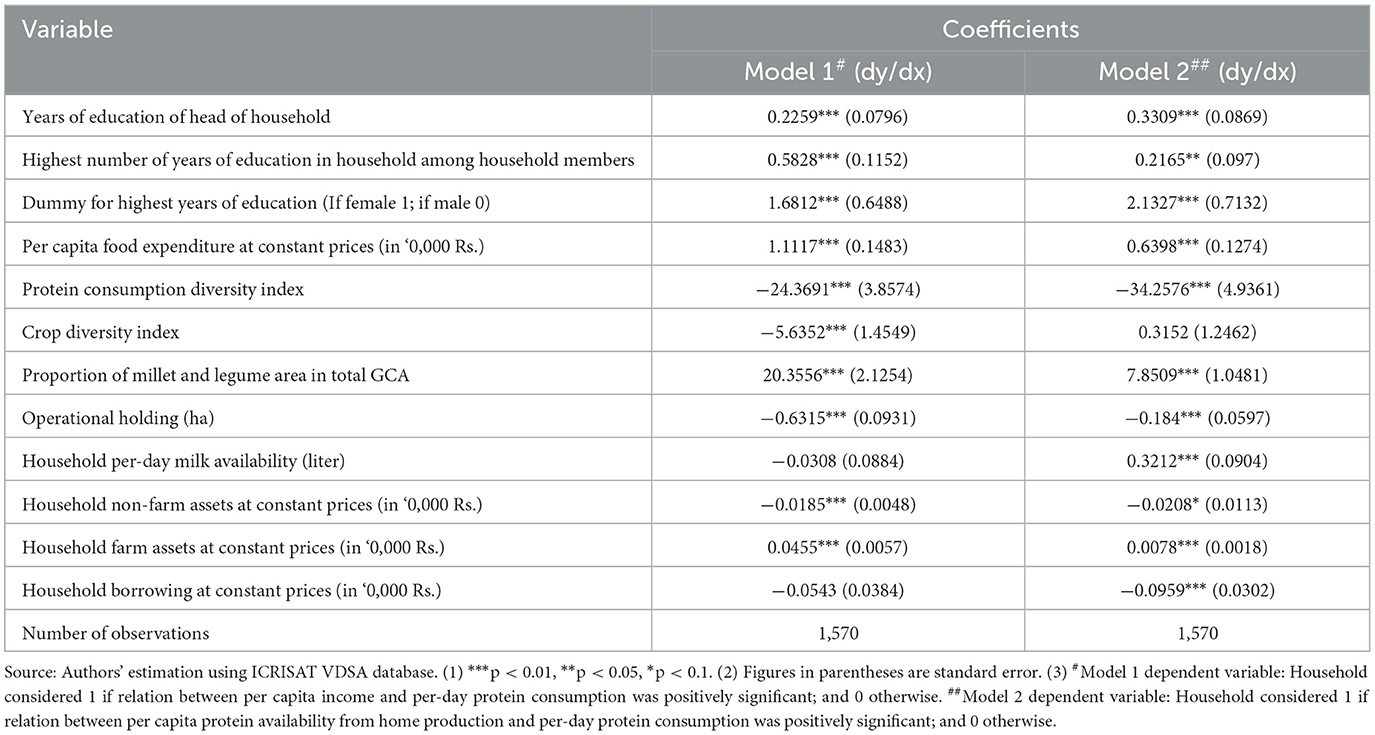
Table 8. A balanced-panel probit regression analysis of the determinants of protein consumption in respect of income and availability, India.
Model 1 reveals that an increase in household income positively correlates with protein intake when the head of the household or any member has a higher level of education. A stronger effect of income on protein intake was observed if the educated member was a female. The diversity of crops grown, particularly millets and legumes, was correlated with higher protein consumption, yet an increased variety in protein sources paradoxically associated with reduced intake when income increases. This might reflect suboptimal food choices, possibly highly processed foods, when income increases. Surprisingly, larger landholdings and ownership of non-farm assets are not correlated with more protein consumption with income increase, debunking a common assumption. However, owning farm assets, which might have supported diverse food production on the farm, contributed positively to protein consumption when linked to income.
Model 2 evaluates how the increase in the production of protein rich food from own farming affects the household's protein intake. The findings suggest that the availability of farm-produced protein does not necessarily correlate with higher protein consumption. Education variables consistently show a positive impact on protein consumption. The cultivation of millets and legumes emerged as a significant factor in both models, underscoring its relevance in dietary improvement. The effect of non-farm assets varies; while lower levels align with better consumption outcomes in relation to income, higher levels correspond with increased protein consumption in relation to farm production availability. Per capita food expenditure and daily milk availability from the household's own production also emerged as significant factors enhancing protein intake.
Contrary to expectations, larger landholdings, higher protein consumption diversity, and higher value of non-farm assets were inversely associated with protein consumption, even in the presence of increased income and availability of farm-produced protein. Increase in farm production of protein rich foods correlated negatively with protein intake where households had high levels of outstanding loans. Similarly increased income, possibly via high protein diversity also had negative affect on protein consumption. Thus, despite a diversified diet, higher access to financial resources and non-farm assets, the households may not necessarily make nutritionally optimal choices even if the farm production of protein foods and income increases.
The study also delved into the determinants of protein consumption at both aggregate and district levels, employing household fixed-effect panel regression analysis (Table 9). The results reveal varied influences across different regions. Household size, measured by the number of consumption units (CU), was inversely related to per capita protein intake in four out of nine districts such as Bijapur, Junagadh, Mahbubnagar, and Solapur, indicating that larger households tend to have lower protein consumption per member. This pattern, however, was not consistent across all districts.
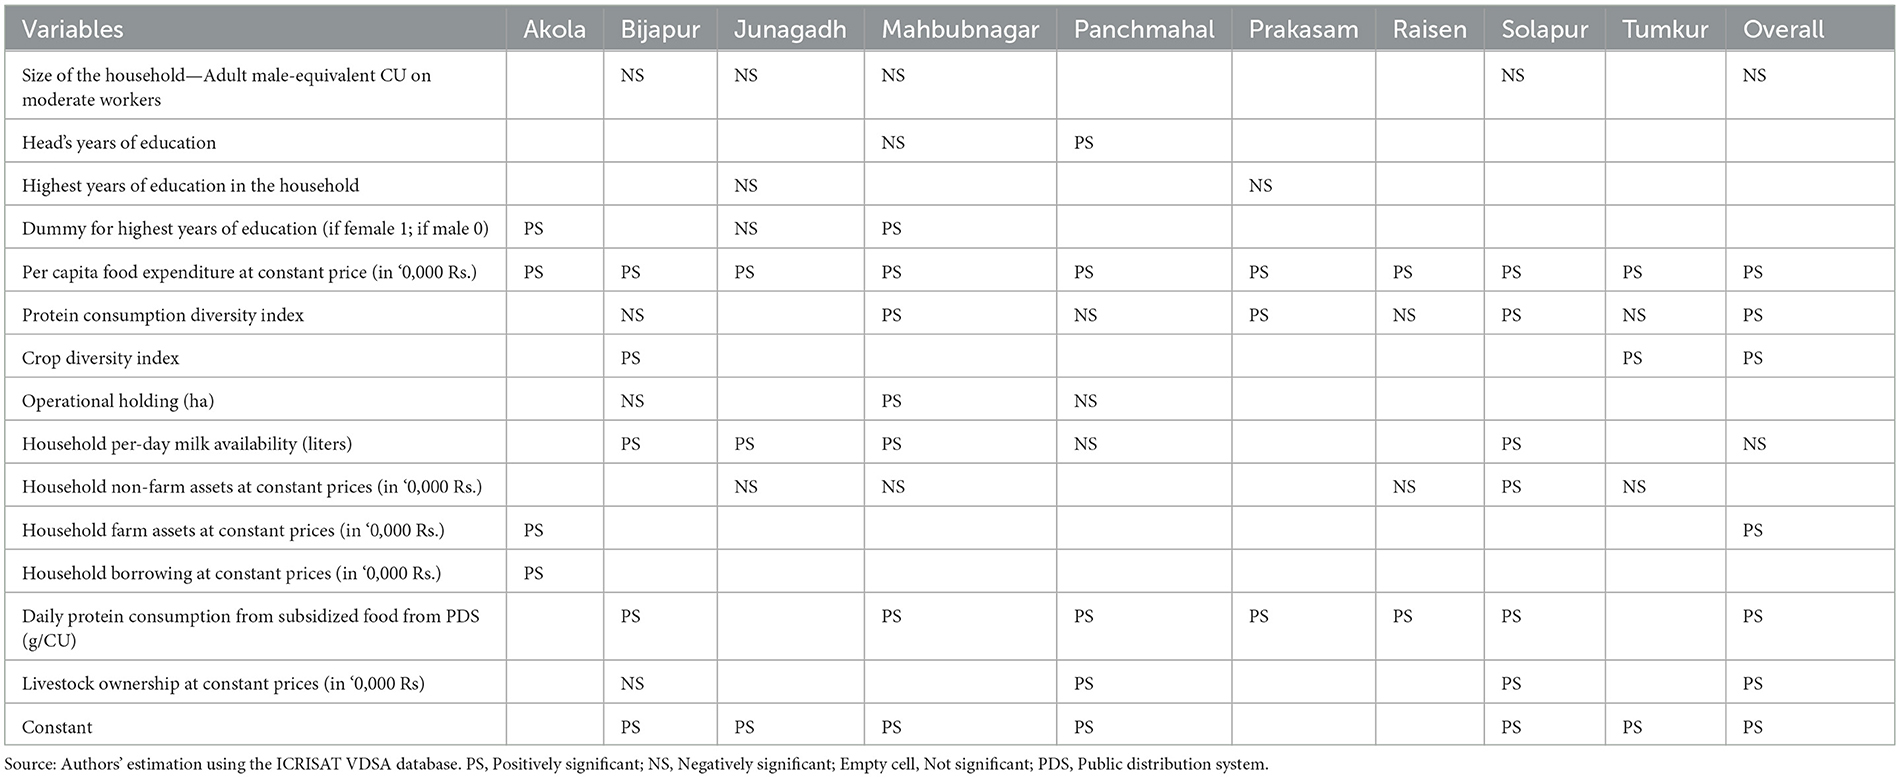
Table 9. Fixed-effect panel regression analysis of the determinants of household per capita daily protein consumption at the disaggregated level.
Educational attainment which on average was 5 years of schooling of the head of the household, had mixed signs on the coefficients; it was a positive determinant in Panchmahal, a less developed district, but its impact was mixed or non-significant in other districts. The highest educational level within a household in some districts was positively associated with protein consumption, particularly when the educated member was female.
Per capita food expenditure consistently predicted higher protein intake across all districts, standing out as a universal positive driver. Crop diversity's impact on protein intake varied, being positive in Bijapur and Tumkur but not significant elsewhere. Contrary to expectations, the protein consumption diversity index was inversely related to protein intake in several districts. This counterintuitive finding suggests that a greater variety of protein sources in the diet does not necessarily equate to higher protein intake. This inconsistency could be attributed to economic constraints, cultural and dietary preferences, nutritional knowledge, or the substitution of protein sources rather than their addition. However, in Mahbubnagar, Prakasam, and Solapur, as well as at the overall study level, a diverse protein diet correlated positively with protein consumption.
Landholding size and non-farm assets showed no clear pattern, affecting protein consumption differently in different districts. Farm assets positively influenced protein intake in only one district, while household borrowings were beneficial in Akola alone, indicating that the relationship between financial resources and nutrition is not straightforward. Protein sourced from subsidized food from government's Public Distribution System (PDS) was a significant positive factor in six districts, underscoring the effectiveness of safety net programs in improving nutrition security.
Finally, livestock ownership positively impacted protein consumption in a few districts. This could be due to livestock's dual role as a source of both nutrition and income, with many households opting to sell rather than consume their livestock products. These findings collectively highlight the complexity of food consumption behaviors and the need for context-specific interventions to improve nutritional outcomes.
The results above show that often most households did not intentionally choose protein-rich foods, resulting in cereals becoming the primary source of protein and contributing 63–73% of total protein intake across the various districts. This could be due to limited awareness of protein-rich food options, economic constraints, or established dietary preferences that favor cereals over other protein sources. Swaminathan et al. (2012) also found cereals as the principal dietary protein source in India, contributing between 55% and 76% of the daily intake. The pulses, legumes, nuts, and dairy products did contribute to dietary protein; however, the consumption of animal-source proteins, barring milk products, was exceptionally low across most districts compared to the national average.
Income analysis reveals that protein deficiency was rampant across 70–80% of households, regardless of their economic condition. This challenges the conventional belief that food availability and income are the primary determinants of consumption. Our findings suggest that the reality is more nuanced, with consumption patterns being influenced by a complex interplay of social, economic, and cultural factors. Education, particularly of women, emerged in our regression results as a pivotal factor in improving protein intake that might have helped them to make better food choices and enhance their capacity to contribute to household's income and food availability. Furthermore, even in districts with robust dairy production, milk intake remained suboptimal, underscoring a general disregard for protein in dietary preferences.
Our fixed-effect panel regression analysis highlights the varied impacts of different determinants on per capita protein intake across districts, with per capita food expenditure being the sole consistent positive influence. Women's educational attainment influenced protein consumption differently across districts. Family size was inversely related to protein intake in certain districts, echoing findings of prior research (Iyangbe and Orewa, 2009; Olarinde and Kuponiyi, 2005), yet this trend was not universal. Factors like crop diversity, landholding size, milk availability through own livestock and asset ownership also emerged as drivers of protein intake, although with differential significance across districts. Our findings reveal that socio-cultural preferences, economic trade-offs, and accessibility barriers complicate this relationship. For example, households in Prakasam with larger landholdings often prioritize cash crop production over protein-rich food cultivation, while in Mahbubnagar, cultural preferences favor cereal consumption over other protein sources. These cases illustrate that income and land size alone are insufficient for guaranteeing adequate protein intake across diverse rural contexts. Also, for instance, in regions like Solapur, cultural norms favoring cereal-based diets complicate the adoption of protein-rich alternatives, despite economic means or farm production capacity.
Paradoxically, access to subsidized cereals through the Public Distribution System (PDS) seemed to strengthen protein consumption. Good access to subsidized cereals might have allowed the households to spend their money on other food varieties contributing to higher protein intake, but it may inadvertently neglect the provision of higher-quality protein sources. Incorporating protein-rich legumes and millets into the PDS, together with nutritional awareness programs could potentially improve the protein intake of low-income rural households.
Our analysis suggests that enhancements in income and food availability are insufficient for improving protein consumption without augmenting the synergistic variables such as education, nutrition awareness (particularly among women), diversification of farming systems to include nutrition-dense crops such as millets and legumes, and dairy animal integration. It also presents robust evidence that “one size does not fit all”. The determinants of protein intake varied across regions (states), necessitating a multifaceted and context-specific approach to address nutrition challenges and protein deficiency.
Traditional food habits, custom norms, and household nutrition awareness appeared to significantly shape food choices within a complex food environment. The potential contribution of nutrient-dense pulses and millet to healthier diets were found to be very high, especially for communities that largely depend on vegetarian food. Besides enhancing consumers' awareness and accessibility to nutritious millets, supportive policies are needed to make these crops remunerative for farmers. The significant impact of Public Distribution System (PDS) cereal supplies on protein intake indicates the potential for increased protein consumption if subsidized legumes are included in the PDS. Historically, agricultural and food policies have focused on alleviating food insecurity in India through enhanced production and accessibility of rice and wheat. The current paradoxical situation of severe deficit in protein consumption despite its availability highlights the immediate need for nutrition-inclusive policies to promote sustainable healthy diets.
Considering that income and food self-sufficiency were not the most limiting factors in protein consumption among the smallholder households, nutritional education and awareness, type of crop diversity, and making food subsidy programs nutrition-sensitive become critical components of an effective nutrition strategy.
This study acknowledges the limitations associated with using older data. While it provides a foundational basis for future research that can incorporate newer datasets to validate or refine our findings, it is important to note that household panel data of this kind is still not readily available. Our recent study of food environment in SAT region (Kumar et al., 2023) indicates that protein consumption at aggregate level remains quite low but its drivers need to be investigated.
Furthermore, although the probit and fixed-effect models employed are methodologically sound, they have inherent limitations. These models may not fully account for unobserved factors or temporal shifts—such as evolving social norms or policy impacts—that affect protein intake. Additionally, the study's reliance on panel data from only 2011 to 2014 limits its capacity to capture longer-term trends amidst ongoing economic and agricultural changes. As a result, while this dataset highlights immediate influences on protein consumption, future research utilizing extended timeframes would enhance our understanding of the evolving socio-economic impacts in rural, semi-arid regions.
The datasets presented in this study can be found in online repositories. The names of the repository/repositories and accession number(s) can be found at: https://vdsa.icrisat.org/.
SK: Conceptualization, Funding acquisition, Methodology, Project administration, Supervision, Validation, Writing – original draft, Writing – review & editing. SP: Conceptualization, Data curation, Formal analysis, Methodology, Software, Validation, Visualization, Writing – original draft. TR: Conceptualization, Writing – review & editing. ER: Writing – review & editing.
The author(s) declare financial support was received for the research, authorship, and/or publication of this article. CGIAR Research Science Program on Innovative Institutions and Policy for Food, Land and Water system transformation through CGIAR Fund Donors and bilateral funding agreements; Feed the Future Food Systems for Nutrition Innovation Lab (FSNIL), and Longitudinal household data collected with financial support from Bill and Melinda Gates Foundation (BMGF).
The authors thank R. Padmaja for her comments on the previous version of the paper. Funding from CGIAR Research Science Program on Innovative Institutions and Policy for Food, Land and Water system transformation through CGIAR Fund Donors and bilateral funding agreements; Feed the Future Food Systems for Nutrition Innovation Lab (FSNIL), and Longitudinal household data collected with financial support from Bill and Melinda Gates Foundation (BMGF) is well acknowledged.
The authors declare that the research was conducted in the absence of any commercial or financial relationships that could be construed as a potential conflict of interest.
All claims expressed in this article are solely those of the authors and do not necessarily represent those of their affiliated organizations, or those of the publisher, the editors and the reviewers. Any product that may be evaluated in this article, or claim that may be made by its manufacturer, is not guaranteed or endorsed by the publisher.
1. ^More information on the VLS-VDSA database and methods of sample selection is available at http://vdsa.icrisat.ac.in/, Walker and Ryan (1990) and Rao et al. (2009).
Andreoli, V., Bagliani, M., Corsi, A., and Frontuto, V. (2021). Drivers of protein consumption: a cross-country analysis. Sustainability 13:7399. doi: 10.3390/su13137399
Behrman, J. R., and Deolalikar, A. B. (1987). Will developing country nutrition improve with income? A case study for rural South India. J. Pol. Econ. 95, 492–507. doi: 10.1086/261469
Burchi, F., and De Muro, P. (2012). A Human Development and Capability Approach to Food Security: Conceptual Framework and Informational Basis. New York, NY: United Nations Development Programme (UNDP). Available at: https://www.undp.org/sites/g/files/zskgke326/files/migration/africa/Capability-Approach-Food-Security.pdf (accessed October 5, 2024).
Chinnakali, P., Upadhyay, R., Shokeen, D., Singh, K., Kaur, M., Singh, A., et al. (2014). Prevalence of household-level food insecurity and its determinants in an urban resettlement colony in North India. J. Health Popul. Nutr. 32, 227–36.
Drewnowski, A. (2024). Alternative proteins in low-and middle-income countries (LMIC) face a questionable future: will technology negate Bennett's law? Curr. Dev. Nutr. 8:100450. doi: 10.1016/j.cdnut.2023.101994
Drewnowski, A., and Almiron-Roig, E. (2010). “Human perceptions and preferences for fat-rich foods,” in Fat Detection: Taste, Texture, and Post Ingestive Effects (Boca Raton: CRC Press), 265–290.
Ghosh, S., Suri, D., and Uauy, R. (2012). Assessment of protein adequacy in developing countries: quality matters. Br. J. Nutr. 108, S77–S87. doi: 10.1017/S0007114512002577
Gopalan, C., Sastri, R. B. V., and Balasubramanian, S. C. (1980). Nutritive Values of Indian Foods., 3rd Edn. New Delhi: Indian Council of Medical Research.
ICMR - NIN (2020). Nutrient Requirements for Indians, the Recommended Dietary Allowances (RDA) and the Estimated Average Requirements (EAR). Hyderabad: Indian Council of Medical Research - National Institute of Nutrition. Available at: https://www.nin.res.in/RDA_Full_Report_2020.html (accessed August 11, 2022).
Iyangbe, C., and Orewa, S. (2009). Determinants of daily protein intake among rural and low-income urban households in Nigeria. Am. Eur. J. Sci. Res. 4, 290–301.
Kearney, J. (2010). Food consumption trends and drivers. Philos. Trans. Royal Soc. B Biol. Sci. 365, 2793–2807. doi: 10.1098/rstb.2010.0149
Koroleva, L. (2021). “Assessment of food self-sufficiency and food independence based on the analysis of production and consumption data,” in IOP Conference Series: Earth and Environmental Science (Bristol: IOP Publishing), 062006.
Kumar, S., Das, A., Kasala, K., Ridoutt, B., Patan, E. K., Bogard, J., et al. (2023). Assessing the rural food environment for advancing sustainable healthy diets: insights from India. J. Agricult. Food Res. 12:100588. doi: 10.1016/j.jafr.2023.100588
Longvah, T., Anantan, I., Bhaskarachary, K., Venkaiah, K., and Longvah, T. (2017). Indian Food Composition Tables. National Institute of Nutrition, Indian Council of Medical Research Hyderabad.
Militao, E. M. A., Salvador, E. M., Uthman, O. A., Vinberg, S., and Macassa, G. (2022). Food insecurity and health outcomes other than malnutrition in southern Africa: a descriptive systematic review. Int. J. Environ. Res. Public Health 19:5082. doi: 10.3390/ijerph19095082
Olarinde, L., and Kuponiyi, F. (2005). Rural livelihood and food consumption patterns among households in Oyo State, Nigeria: implications for food security and poverty eradication in a deregulated economy. J. Soc. Sci. 11, 127–132. doi: 10.1080/09718923.2005.11892504
Parvis, A. R. (2019). Food self-sufficiency and food security at the national and local level in India. Addaiyan J. Arts Human. Soc. Sci. 1, 1–8. doi: 10.36099/ajahss.1.6.1
Rao, G. N., Babu, P. A., and Bantilan, M. C. S. (2009). Dynamics and Development Pathways in the Semi-Arid Tropics: Dokur Village Profile. Research Bulletin no. 23. International Crops Research Institute for the Semi-Arid Tropics.
Richardson, R. B. (2010). Ecosystem services and food security: Economic perspectives on environmental sustainability. Sustain. 2, 3520–3548. doi: 10.3390/su2113520
Scialabba, N. E-. H. (2022). “Livestock food and human nutrition,” in Managing Healthy Livestock Production and Consumption, (Amsterdam: Elsevier), 29–44.
Swaminathan, S., Vaz, M., and Kurpad, A. V. (2012). Protein intakes in India. Br. J. Nutr. 108, S50–S58. doi: 10.1017/S0007114512002413
Swaminathan, M. S., and Bhavani, R. V. (2013). Food production and availability—essential prerequisites for sustainable food security. Ind. J. Med. Res. 138, 383.
Tydeman-Edwards, R., Van Rooyen, F. C., and Walsh, C. M. (2018). Obesity, undernutrition and the double burden of malnutrition in the urban and rural southern Free State, South Africa. Heliyon 4:e00983. doi: 10.1016/j.heliyon.2018.e00983
Vissamsetti, N., Simon-Collins, M., and Lin, S. (2023). Local sources of protein in low-and middle-income countries: how to improve the protein quality? Curr. Dev. Nutr. 7:100333. doi: 10.1016/j.cdnut.2023.102049
Walker, T. S., and Ryan, J. G. (1990). Village and Household Economics in India's Semi-arid Tropics. Johns Hopkins University Press.
Winichagoon, P., and Margetts, B. M. (2017). The Double Burden of Malnutrition in Low-and Middle-Income Countries. Available at: https://www.ncbi.nlm.nih.gov/books/NBK565820/ (accessed November 11, 2022).
Keywords: protein malnutrition, consumption determinants, household fixed effects, nutrition security, semi-arid tropics
Citation: Kumar S, Pramanik S, Reardon T and Revathi E (2025) Links between protein-source diversity, household behavior, and protein consumption inadequacy in the Indian rural semi-arid tropics. Front. Sustain. Food Syst. 9:1490050. doi: 10.3389/fsufs.2025.1490050
Received: 02 September 2024; Accepted: 13 January 2025;
Published: 04 February 2025.
Edited by:
Ademola Braimoh, World Bank Group, United StatesReviewed by:
Marie-Annick Moreau, University College London, United KingdomCopyright © 2025 Kumar, Pramanik, Reardon and Revathi. This is an open-access article distributed under the terms of the Creative Commons Attribution License (CC BY). The use, distribution or reproduction in other forums is permitted, provided the original author(s) and the copyright owner(s) are credited and that the original publication in this journal is cited, in accordance with accepted academic practice. No use, distribution or reproduction is permitted which does not comply with these terms.
*Correspondence: Shalander Kumar, U2hhbGFuZGVyLkt1bWFyQGljcmlzYXQub3Jn
Disclaimer: All claims expressed in this article are solely those of the authors and do not necessarily represent those of their affiliated organizations, or those of the publisher, the editors and the reviewers. Any product that may be evaluated in this article or claim that may be made by its manufacturer is not guaranteed or endorsed by the publisher.
Research integrity at Frontiers
Learn more about the work of our research integrity team to safeguard the quality of each article we publish.