
94% of researchers rate our articles as excellent or good
Learn more about the work of our research integrity team to safeguard the quality of each article we publish.
Find out more
ORIGINAL RESEARCH article
Front. Sustain. Food Syst. , 13 March 2025
Sec. Nutrition and Sustainable Diets
Volume 9 - 2025 | https://doi.org/10.3389/fsufs.2025.1452975
This article is part of the Research Topic Sustainable Diets with Sociocultural and Economic Considerations View all 18 articles
 Surjya Kanta Roy1
 Satyapriya1*
 Rajarshi Roy Burman2
 Sitaram Bishnoi1*Venu Lenin1
 Subhashree Sahu1
 Girijesh Singh Mahra1
 Rahul Singh1Pratibha Joshi1Monika Wason1Sukanya Barua1
 Sujay B. Kademani3
Introduction: India’s food production and utilization status have affected the health and wellbeing of the population and healthcare systems. As a result, women, adolescent girls, and children are suffering anaemia which causes delayed mental and psychomotor development, morbidity, and maternal mortality. Several programs are running i.e. Public Distribution System (PDS), Integrated Child Development Scheme (ICDS) and Mid-Day Meal (MDM) etc. while targeting the vulnerable communities of India to meet their basic food and nutrition requirements.
Methods: The study was conducted in the Bundelkhand region, a nutritionally vulnerable area with a high infant mortality rate and an average Human Development Index score below the national average. A total of 320 respondents from four districts were selected for the study, and are being asked about their preferences of food groups in four meals.
Results: Results showed respondents have a discernible preference for certain foods across the four meals. The most well-liked food groups were “Oil/fat”, “Cereals”, “Roots/tubers” and “Vegetables”. They preferred more food groups to be included in dinner followed by lunch. The study found a strong correlation between the food groups “Cereals”, “Roots/tubers” and “Oil/fat” and the three primary meals of the day, namely breakfast, lunch, and dinner. Fish and meat are preferred during evening meals, serving as a valuable protein source.
Discussion: This trend in food habits is influenced by the cereal-based production systems, cultural norms and social dynamics of India, which needs a major reform.
Almost one-fifth of the world’s population lives in India, and the country itself has gone through a nutrition transition in recent decades, going from underweight to overweight population (Agrawal, 2002; Dandona et al., 2017; Schneider et al., 2020; Popkin et al., 2020; Chaudhary and Sharma, 2023). This has had a devastating impact on the health and wellbeing of the population and on healthcare systems that were already struggling to keep up (Chaudhary and Sharma, 2023; Pingali et al., 2017; Parappurathu et al., 2019). Indian women, adolescent girls, and children face a severe public health challenge due to widespread anaemia (Chaudhary et al., 2019). This condition contributes to delayed mental and psychomotor development, increased morbidity, and maternal mortality (World Health Organization (WHO), 2017). Poor nutrition, particularly iron deficiency, is responsible for over 60 per cent of cases (Kassebaum et al., 2016). More than half of reproductive-age women and children under five are mostly in this vulnerable group (IIPS, 2017). India’s 447 million anaemic people account for almost 25 per cent of the global burden, according to the Global Burden of Disease (GBD) report, 2016 (Kassebaum et al., 2016). Changes in dietary and lifestyle habits have contributed to rising rates of both undernutrition and non-communicable diseases (NCDs) (Misra and Shrivastava, 2013). In India, as elsewhere, noncommunicable diseases are on the rise and now account for a disproportionately high share of deaths among the young (Bernabe et al., 2020; De Onis et al., 2010). A growing number of children and adults are becoming overweight and at risk for diet-related non-communicable diseases (NCDs) like heart disease and diabetes as the availability of foods and beverages high in fat, sugar, and salt increases in the market (Popkin et al., 2020; Chaudhary et al., 2019; De Onis et al., 2010). In 2016, the main risk factors for Disability-Adjusted Life Years (DALYs) were child and maternal malnutrition, air pollution, poor diets, high blood pressure, and high blood glucose, while the leading causes of DALYs included ischaemic heart disease, chronic obstructive pulmonary disease, diarrhoeal diseases, lower respiratory infections, and cerebrovascular disease (Dandona et al., 2017; Dhillon and Kumar, 2022).
The Public Distribution System (PDS), Integrated Child Development Scheme (ICDS), Mid-Day Meal (MDM), National Rural Employment Generation Scheme (NREGS), Rajiv Aarogyasri Health Insurance Scheme (RAJIV), and the Indira Kranthi Patham Project (IKP) are only a few of the social programmes that Narsaiah (2019) suggested might increase citizens’ access to food and healthcare in India. Among these, PDS is one of the most effective and inexpensive programmes to fight hunger in India, which is particularly focused on household food requirements (Roy et al., 2024).
It is dependent on the availability and accessibility of food that shape people’s diverse preferences for food groups (Bishnoi et al., 2018; Sarkar et al., 2015; Green et al., 2016). Most studies investigate the preferences of different food groups that eventually become a person’s dietary habits, but it may be useful to examine their food selection at various daily meals. The effects of selecting food groups on health have been the subject of extensive research (Bhushan et al., 2017). Individuals with a healthy weight and those who are overweight may have different preferences and compensatory mechanisms when foods are easily available. In addition, food composition may play an important role in an individual’s ability to adjust their intake to meet their energy needs. Overall, the food preferences are shaped by a complex interplay of historical, geographical, cultural, political and economical factors, making food choice a multifaceted topic of study. Additionally, food mapping provides valuable insights into agricultural production systems, both of which evolve over time in response to societal preferences. Perceptual Mapping, also known as Positioning Mapping, aids in the comprehension of complex behavioral aspects by classifying them into distinct domains according to their association (Bhattacharyya and Dasgupta, 2014; Ayaz et al., 2009). This method can indirectly enhance dietary awareness by visualizing food preferences within a structured framework. Given this context, the present study aims to explore and analyze the intricate behavioral mechanisms underlying food preferences among rural populations, ultimately representing these findings through a compositional perceptual map.
The study was conducted in Bundelkhand region, considered one of the nutritionally vulnerable areas. According to NIDM, several parts of Bundelkhand are such badly drought-hit that crop failures are common. Around 80% of the total population lives in rural areas, high infant mortality rate in the region (63 per thousand live births) and the average Human Development Index (0.464) is less than the National average (0.632). Amidst the various challenges in the Bundelkhand region, district selection for this study was guided by Multi-Dimensional Poverty Index (MPI) and the inclusion of Aspirational Districts in the Bundelkhand region. Jhansi and Tikamgarh were chosen based on their highest and lowest MPI scores, respectively, while Chitrakoot and Chhatarpur were selected as Aspirational Districts. Within each district, blocks and villages were randomly selected, and a total of 320 respondents were chosen through random sampling. Twelve distinct food groups were identified across four meal categories- Breakfast, Lunch, Snacks and Dinner. Respondents were meticulously asked to indicate their food preferences for each meal using the 24-h recall method, a structure interview designed to capture detailed information on all foods and beverages consumed in the past 24 h. To minimize biases, data collection was carried out on a normal day, avoiding festival periods or special occasions that could influence food choices. All responses were arranged in a 12 × 4 contingency table and further correspondence analysis was used for making perceptual mapping of dietary preferences across the food groups. The correspondence analysis is a widely used technique for visualizing relationships between categorical data, it has inherent limitations, including potential biases in data scaling and an overemphasis on rare events. To ensure representativeness and accuracy, responses were carefully recorded through a structured interview schedule, capturing a diverse range of food preferences. The detailed analysis procedure is outlined below:
• Preparation of data: 12 × 4 Contingency table
• Calculation of expected frequencies:
• Calculation of chi-square statistic:
• Calculation of row and column profiles:
• Singular value decomposition technique: it is a mathematical technique used to decompose the chi-square matrix into its components. This results in eigenvalues and eigenvectors, which represent the dimensions of the analysis.
• Calculation of contributions and association: to measure the degree of association between the categories and the dimensions of the analysis. Contributions measure how much each category contributes to the variation in the analysis, while cosines measure the similarity between categories and dimensions.
• Visualization of results: graphical representation of the perceptual map of dietary preferences across food groups
Compositional perceptual mapping of various food groups about dietary preferences of respondents was mentioned as follows; Table 1 shows how different food groups stack up against the four-meal consumption pattern (breakfast, lunch, snacks, and dinner). Results from a Pearson’s chi-squared test, significant at the 1% level, showed that people have a discernible preference for certain foods across the four meals they eat each day. Foods high in “Oil/fat,” “Cereals,” “Roots/tubers,” and “Vegetables” were the most well-liked across the board. In a similar vein, preferences for the various food groups were highest for “Dinner,” followed by “Lunch,” and then “Breakfast.” The standardized residual values were presented in Figure 1, which also displayed the preference levels for different food groups across the four meals. The blue bar represents a positive residual, indicating that the observed frequency is greater than the expected frequency. This suggests a positive association between the column and row variables. On the other hand, the red bar represents a negative residual, indicating that the observed frequency is less than the expected frequency. This implies a negative association between the column and row variables.
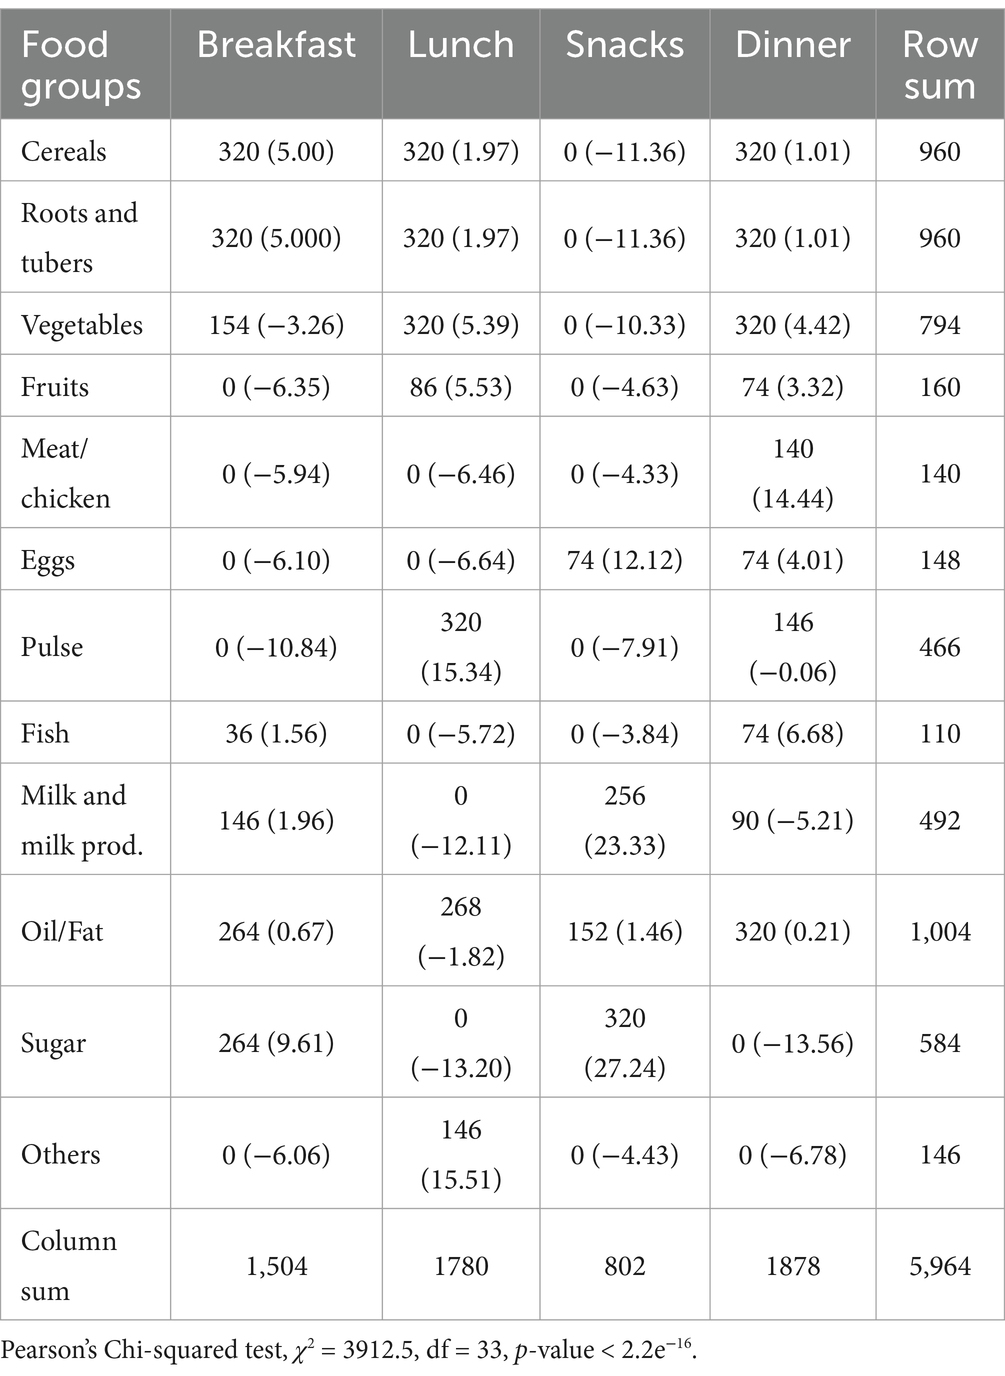
Table 1. Observed frequency and residual values of various food groups in comparison with the consumption of four meals.
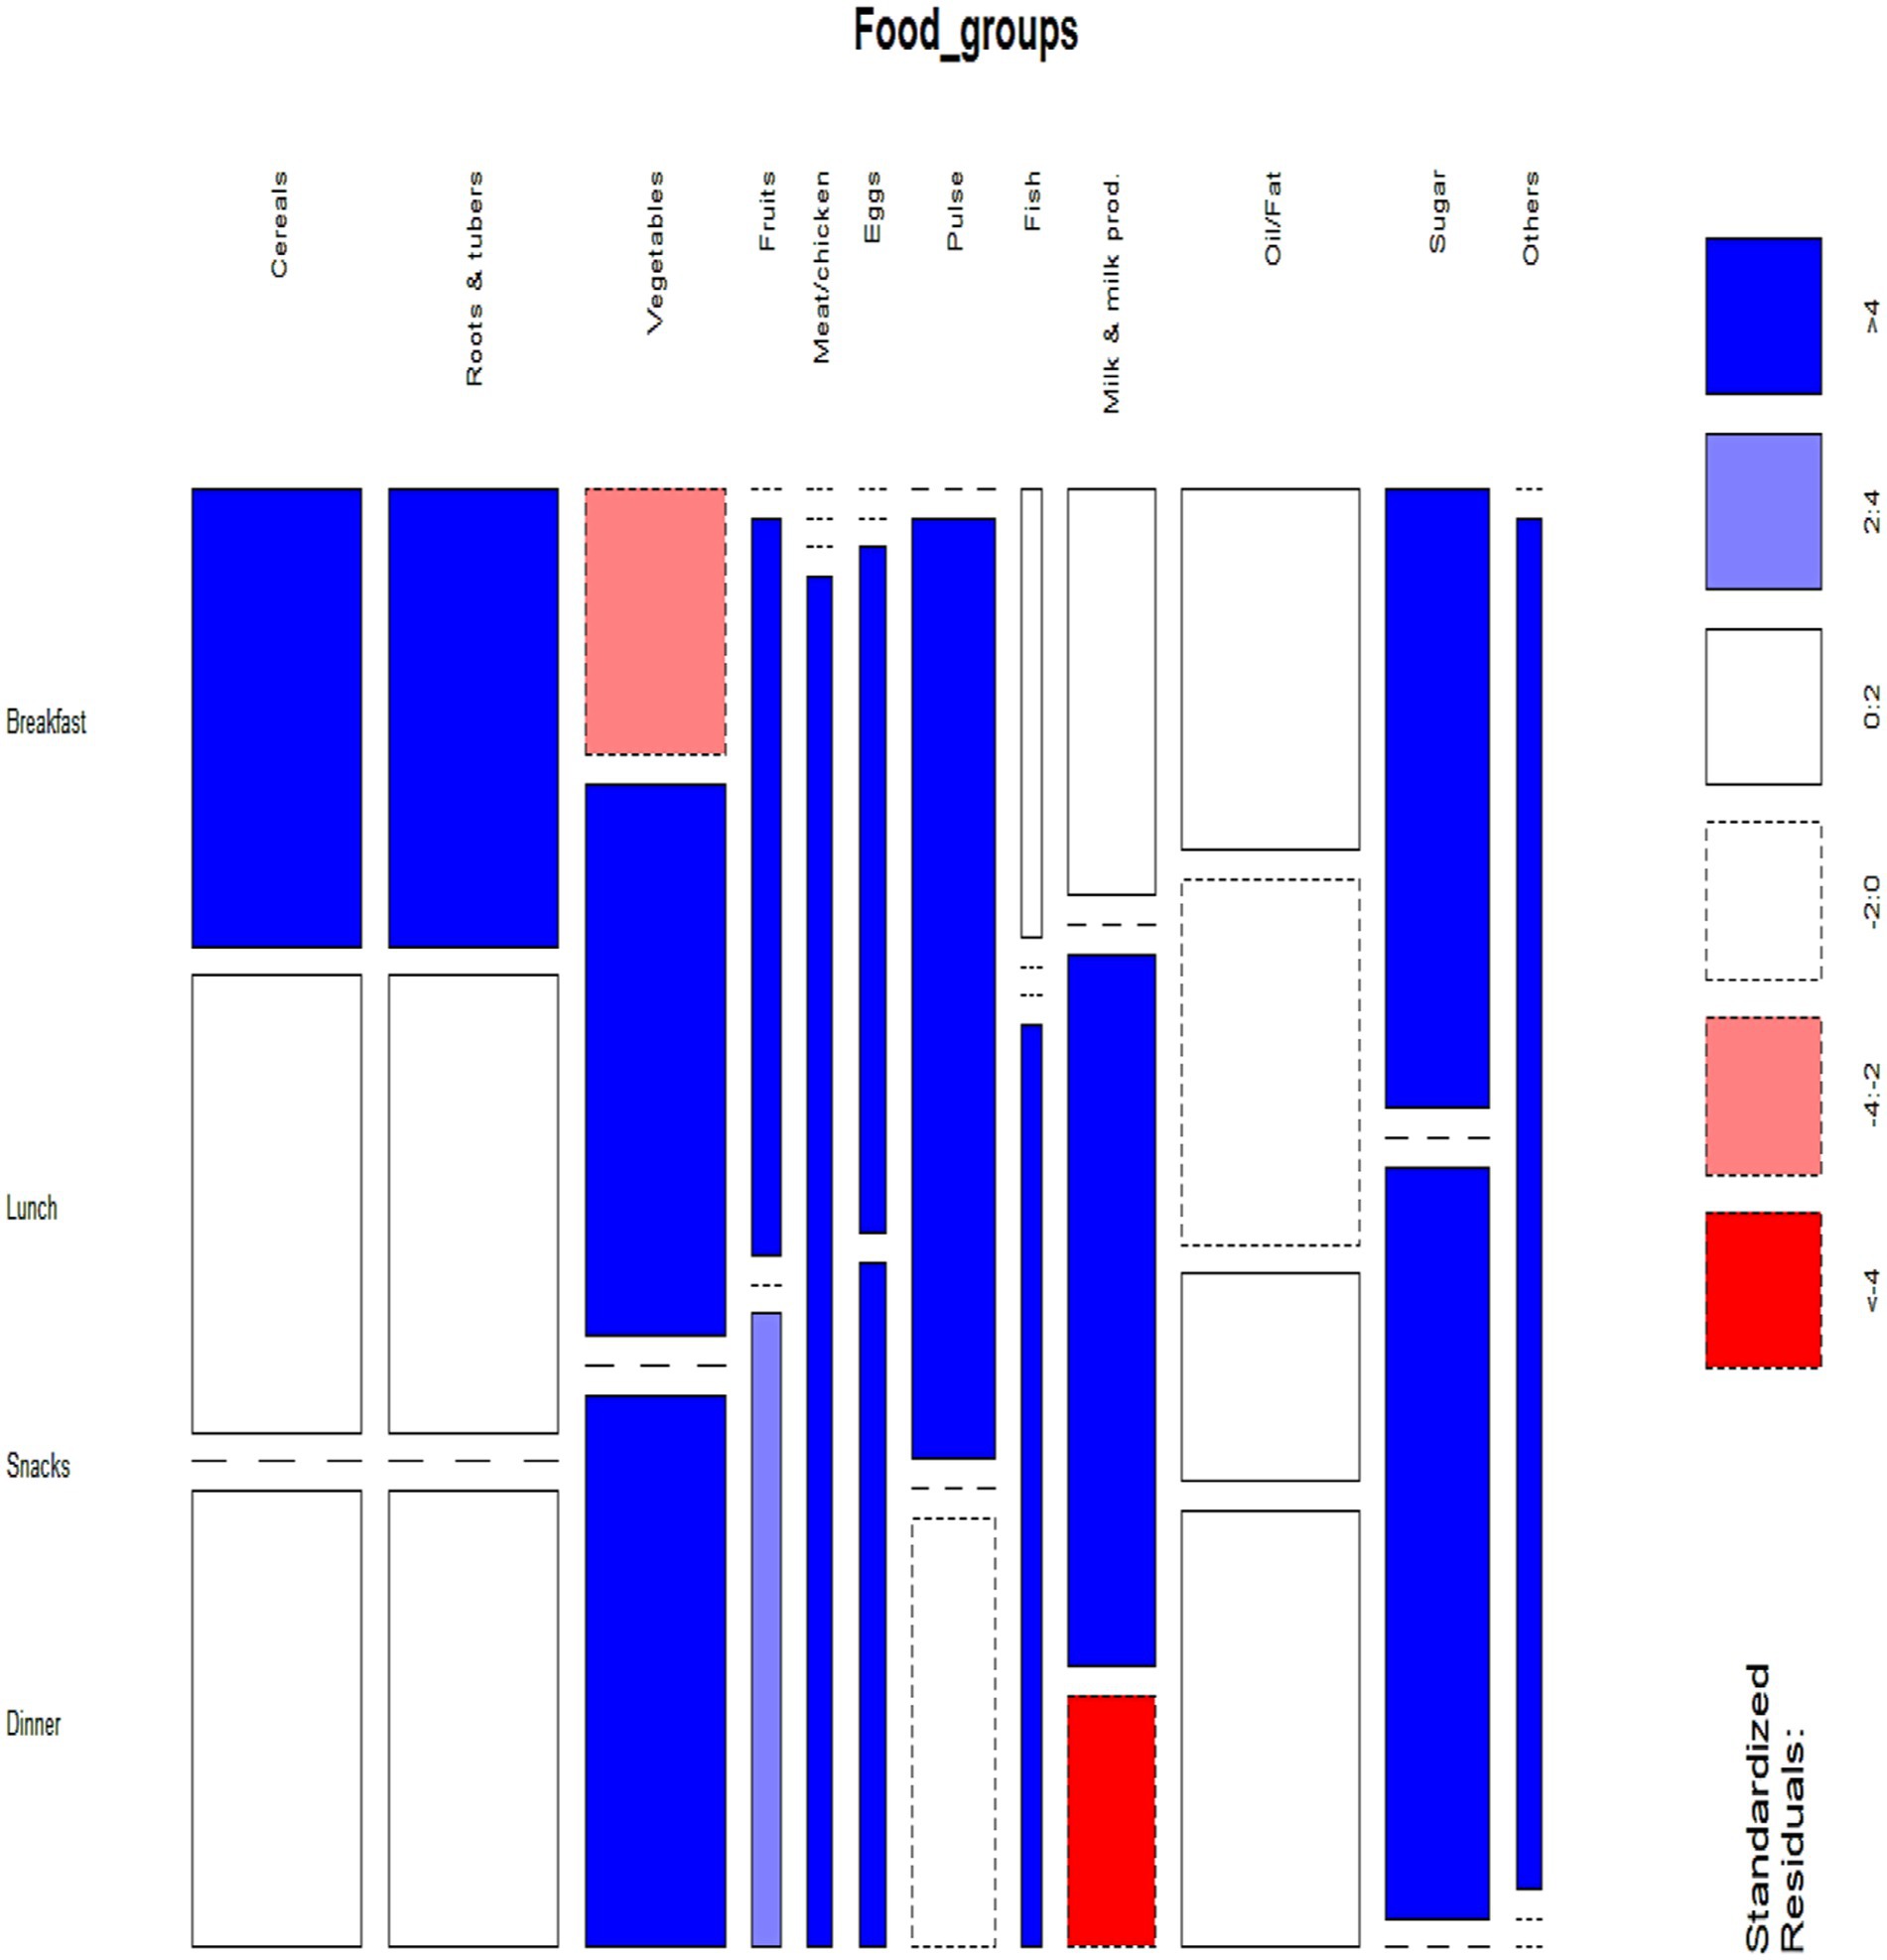
Figure 1. Mosaic plot of standardized residuals of food group preferences.
The correspondence analysis of the contingency table generated a total of three dimensions. The first dimension accounted for 71.41 per cent of the total variance, while the second dimension explained 17.57 per cent and the third dimension explained 11.01 per cent (see Table 2). The combined effect of the first and second dimensions accounted for 88.98 per cent of the total variance. A scree plot is a graphical representation that consistently exhibits a descending curve, depicting the eigenvalues in descending order from the largest to the smallest (Figure 2). Based on the screen plot, it is possible to identify the “elbow” of the graph, which indicates the point where the eigenvalues start to level off. It is recommended to retain as significant the factors or components to the left of this elbow (i.e., the first two dimensions). By choosing the first two dimensions to depict the results of correspondence analysis in a biplot, only 11.01 per cent of the total variance will remain unaccounted for.
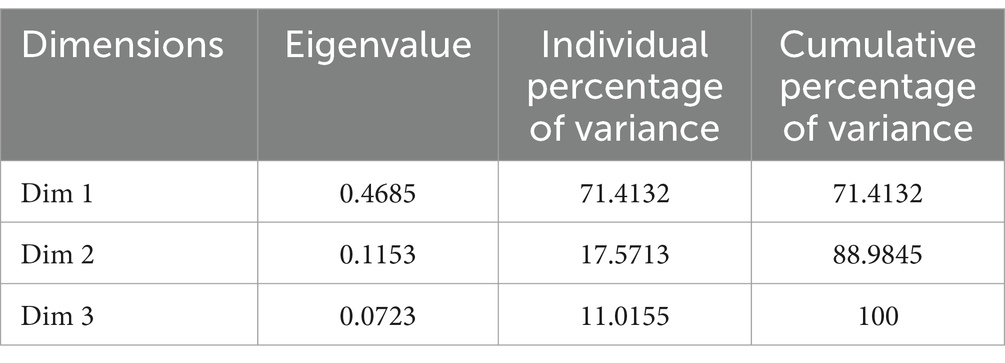
Table 2. Initial eigenvalue of dimensions and percentage of variance explained by dimensions.
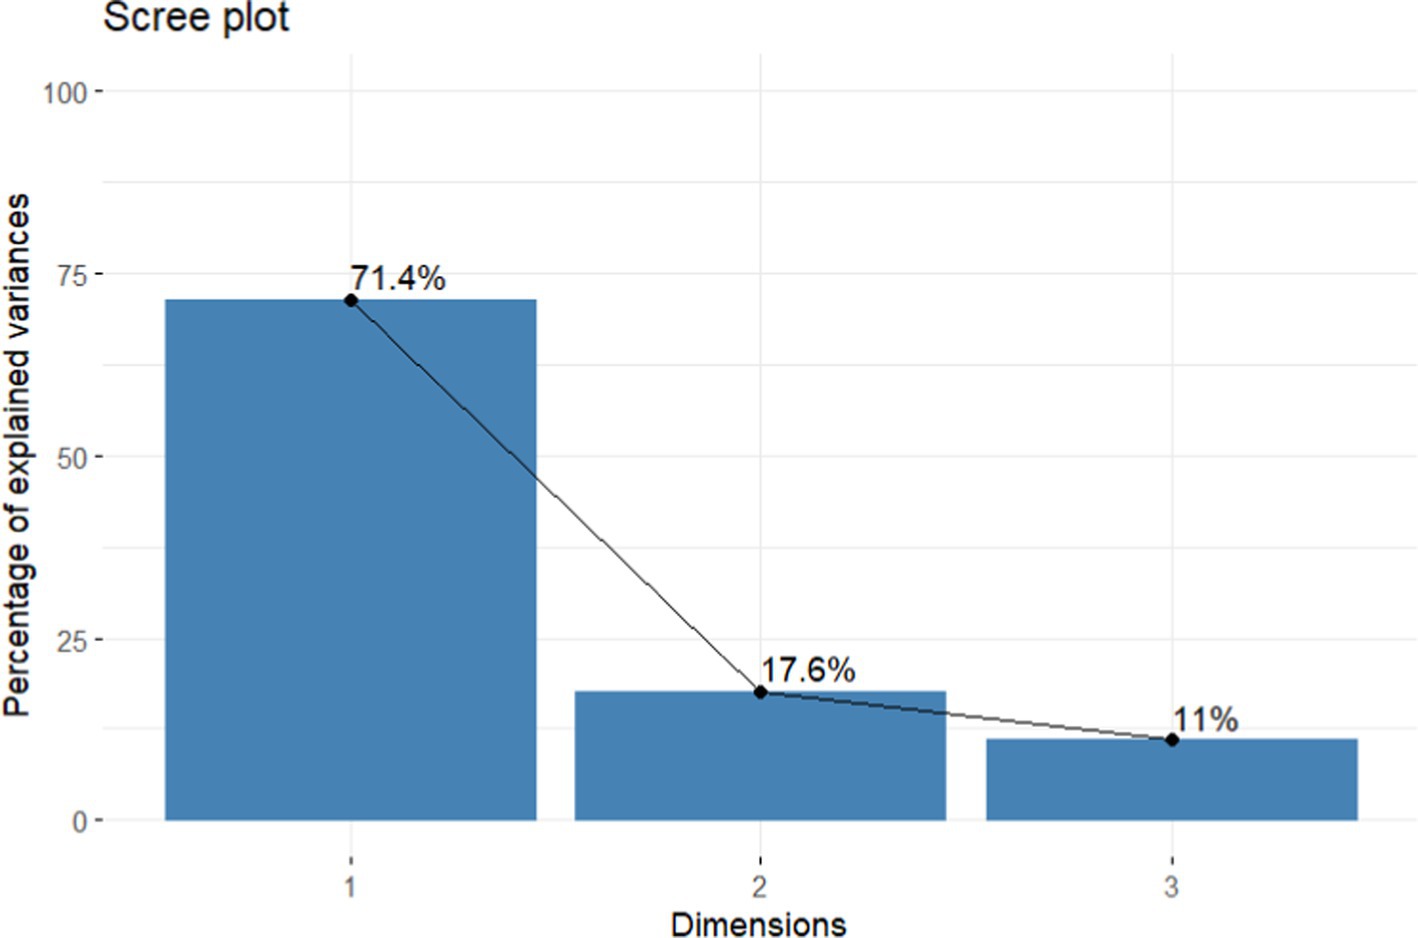
Figure 2. Scree plot of dimensions.
Figure 3 illustrates a strong correlation between the food groups “Cereals,” “Roots/tubers,” and “Oil/fat” and the three primary meals of the day, namely breakfast, lunch, and dinner. Cereals are frequently consumed in rural places, roots and tubers are commonly consumed as accompaniments, and oil and fat are utilized in culinary preparations for all three main meals. These food groups serve as a valuable reservoir of carbohydrates, which play a crucial role in supplying sustained energy throughout the course of the day. Also, food groups commonly referred to as “Sugar,” “Milk/Milk products,” and “Eggs” were frequently linked to the consumption of snacks. Sugar is frequently incorporated into various snack items, including cookies and cakes. Similarly, milk and milk products are commonly utilized in the production of dahi, lassi and ghee. Additionally, eggs are frequently consumed as standalone snacks. The aforementioned food groups serve as valuable sources of nutrients that aid in replenishing the body’s energy levels following a meal or physical exertion. During lunch, the food groups known as “Pulse,” “Fruits,” and “Other” were included. Pulses are frequently consumed as a supplementary dish during lunch, whereas, fruits are commonly consumed as a post-lunch dessert, and the category of “Others” food groups encompasses a diverse range of items including nuts, seeds, and beverages etc. these serve as valuable sources of essential vitamins, minerals, and dietary fiber. The diagram also indicates that the food categories “Fish” and “Meat” were preferred by individuals who consume non-vegetarian items, specifically during dinner. As an example, fish and meat are frequently consumed as the primary dish during evening meals, serving as a valuable protein source, and playing a crucial role in the construction and restoration of bodily tissues.
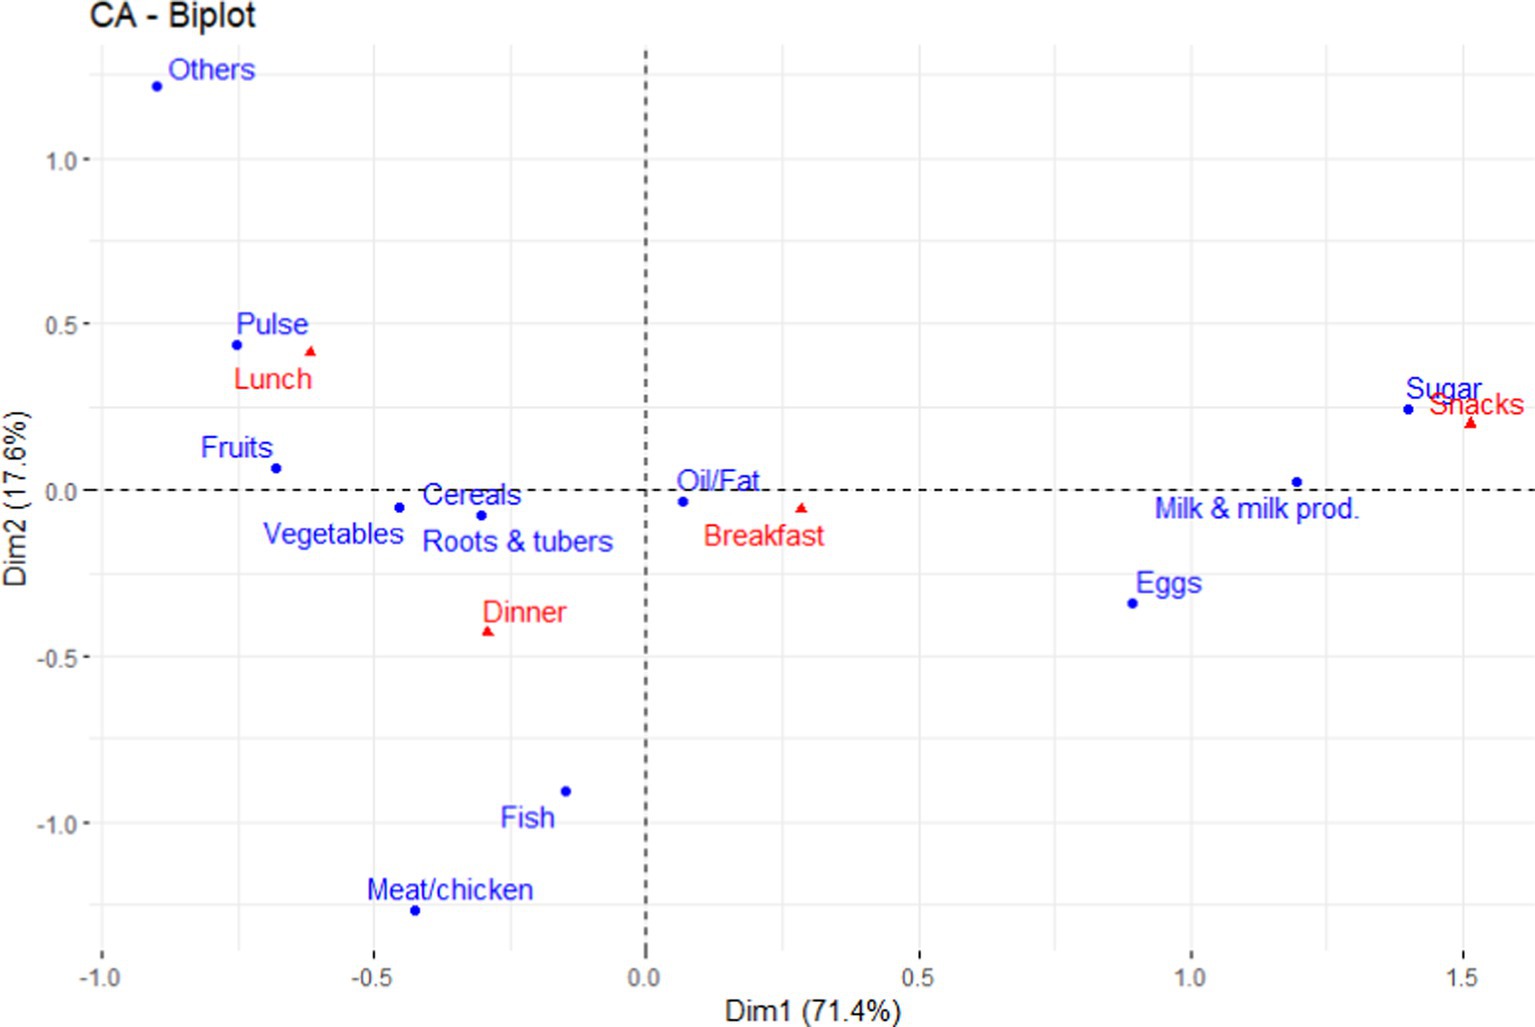
Figure 3. Compositional perpetual map of dietary preferences across the food groups.
Food preferences and choices are shaped by a complex interplay of biological, psychological, sociocultural, and environmental factors (Sobal et al., 2014; Chen and Antonelli, 2020; Vabø and Hansen, 2014). These influences interact dynamically, making food selection a multifaceted and integrated process (Sobal et al., 2014). Historical, geographical, and economic factors further shape dietary habits and agricultural systems, influencing food availability and consumption patterns over time. Food mapping provides valuable insights into how societal preferences drive agricultural production, revealing the evolving relationship between food choices and local food systems. Additionally, contextual factors—such as the time, setting, and social environment of eating—play a crucial role in determining food preferences and dietary patterns (Sobal et al., 2014). A multidisciplinary approach incorporating perspectives from social psychology, archaeology, and nutrition science is essential to fully understand these interactions and address broader issues related to human health and planetary sustainability (Chen and Antonelli, 2020; Vabø and Hansen, 2014). The findings of this study underscore the significance of certain food groups in the diet, namely “Oil/fat,” “Cereals,” “Roots/tubers,” and “Vegetables,” which were consistently preferred across all meals. Research consistently shows supporting of the consumption of these food groups (Cattafesta and Salaroli, 2018; Aburto et al., 2022; Agada and Igbokwe, 2015). Several researches emphasizing the importance of these food groups for achieving a balanced diet (Roy et al., 2024; Jakubowicz et al., 2012; Hunter and Mattes, 2020). The prevalence of these food groups aligns with dietary recommendations, highlighting their essential role in meeting nutritional needs. Research on meal-specific dietary patterns highlights distinct food preferences and nutritional contributions across different meals. Among the main meals, dinner is associated with the highest diet quality, followed by lunch and then breakfast (Murakami et al., 2022). Meal compositions vary significantly, with certain foods predominantly consumed at specific times of the day. For example, bread is a staple of lunch, whereas unprocessed meat is more common at dinner. Additionally, dinner tends to feature a greater variety of vegetables and overall food diversity compared to other meals (Guan et al., 2018). Breakfast patterns can be categorized into “healthy,” “traditional,” and “snack-based” options, while lunch and dinner exhibit greater diversity in food choices (De Oliveira et al., 2015). The distribution of daily energy intake follows a typical pattern: dinner contributes the highest share (40%), followed by lunch (32%), breakfast (21%), and snacks (11%) (Murakami et al., 2022). Understanding these meal-specific patterns is essential for developing targeted dietary guidelines and effective weight management strategies (Guan et al., 2018; De Oliveira et al., 2015). Traditionally, the primary responsibility for food provision within families has rested with mothers, but there has been a noticeable shift in recent times with fathers increasingly becoming involved in feeding their children. This evolution has spurred interest in studying the family unit as a whole (Kähkönen et al., 2021). For instance, Kähkönen and colleagues (Kähkönen et al., 2021) discovered that in a cohort of 3–5-year-old Finnish children, food preferences tended to align more closely with those of the father rather than the mother. Additionally, Erhardt and Olsen (2021) observed that fathers could wield significant influence in shaping children’s dietary habits, particularly in reducing meat consumption. Their study revealed that fathers often exhibit a stronger attachment to meat compared to mothers, and this attachment correlates with higher meat intake among children, often at the expense of vegetable consumption (Erhardt and Olsen, 2021; Laureati, 2022). Pulses—including beans, peas, and lentils—are an essential component of healthy diets due to their rich nutrient profile. These foods are high in protein, fiber, vitamins, and minerals, making them valuable for enhancing diet quality and promoting overall health (Mudryj et al., 2014). Pulses have been shown to positively impact cardiovascular health by improving serum lipid profiles and reducing risk factors for heart disease (Mudryj et al., 2014; Asif et al., 2013). Their high fiber content and low glycemic index make them particularly beneficial for blood glucose regulation in individuals with diabetes (Asif et al., 2013; Havemeier et al., 2017). Additionally, pulses contain bioactive compounds such as enzyme inhibitors, lectins, and phenolic compounds, which exhibit antioxidant and potential anti-cancer properties (Mudryj et al., 2014; Singh et al., 2016). Research further suggests that pulse consumption promotes satiety and supports weight management (Singh et al., 2016). Given their nutritional benefits and sustainability, pulses are highly recommended for inclusion in diets aimed at reducing the risk of chronic diseases while ensuring environmental sustainability (Havemeier et al., 2017). Moreover, the study reveals that dinner is the meal with the highest preference for a variety of food groups, followed by lunch and then breakfast. This observation is consistent with existing research indicating that individuals tend to consume more calories and fat during dinner compared to other meals (Vaughn et al., 2013; Misra and Shrivastava, 2013; Hunter and Mattes, 2020). This trend may be attributed to various factors such as cultural norms, work schedules, and social dynamics surrounding meal times. The depicted results, as shown in Figure 3, are also in line with prior research on dietary patterns in rural India. Cultural, religious, and economic factors strongly influence fish and meat consumption patterns in India. Fish is highly preferred in coastal regions, such as Kerala, where higher-income households allocate a significantly larger portion of their food budget to fish compared to lower-income groups. In middle-sized Indian cities, non-vegetarian food purchases are often planned as weekly family events, with consumers prioritizing quality and freshness (Kumar et al., 2014). While beef and pork consumption is limited due to religious beliefs, chicken is widely accepted across different communities and has become increasingly popular due to its affordability and versatility. Urbanization is further driving the demand for meat products, reflecting shifts in dietary preferences as people migrate to urban centers (Devi et al., 2014). Similar consumption trends are observed in Nigerian fishing communities, where fish consumption among fishing households is nearly double that of non-fishing households, with a strong preference for fresh fish (Gomma and Rana, 2007). Studies by researchers have similarly noted a reliance on cereals in the diet, which could be influenced by factors including affordability, access to the public distribution system (PDS), and cultural preferences (Pingali et al., 2017; Parappurathu et al., 2019; Das et al., 2012). This consistency across studies underscores the persistence of dietary habits within rural communities and the broader socioeconomic and cultural factors shaping food choices (Roy et al., 2024).
In summary, the study contributes to our understanding of dietary preferences and patterns in the context of rural India, emphasizing the importance of specific food groups across meals and highlighting the role of cultural, economic, and logistical factors in shaping dietary behavior. These insights can inform targeted interventions aimed at promoting healthier eating habits and improving nutritional outcomes in rural populations.
Given that cereals constitute a significant portion of our staple diet, it’s natural to exhibit a notable preference for this food group. These preferences across various food groups serve as markers for balanced and nutritious diets, essential for enhancing both physical and mental well-being across all age demographics. The outcomes of our study echo these sentiments. However, it’s crucial to discern the food preferences of Public Distribution System (PDS) beneficiaries, as this insight can guide policymakers in expanding the range of food items available through PDS, thereby enhancing the dietary diversity and nutritional quality for PDS beneficiaries.
The original contributions presented in the study are included in the article/Supplementary material, further inquiries can be directed to the corresponding authors.
The proposal was approved by the Divisional Ethics Review Committee (DERC) of the Division of Agricultural Extension (ICAR - IARI, New Delhi) (Ag. Ext./2022/497). Informed consent was taken from each participant during the interview. To ensure confidentiality, ethics, and privacy, the Declaration of Helsinki principles were maintained throughout the research. The studies were conducted in accordance with the local legislation and institutional requirements.
SR: Conceptualization, Data curation, Investigation, Methodology, Software, Validation, Writing – original draft. Satyapriya: Conceptualization, Data curation, Investigation, Methodology, Writing – original draft. RB: Formal analysis, Resources, Supervision, Writing – review & editing. SiB: Conceptualization, Data curation, Methodology, Writing – original draft. VL: Data curation, Supervision, Writing – review & editing. SS: Data curation, Investigation, Writing – review & editing. GM: Data curation, Methodology, Supervision, Writing – review & editing. RS: Supervision, Writing – review & editing. PJ: Investigation, Visualization, Writing – review & editing. MW: Project administration, Resources, Writing – review & editing. SuB: Data curation, Supervision, Writing – review & editing. SK: Investigation, Resources, Visualization, Writing – review & editing.
The author(s) declare that no financial support was received for the research and/or publication of this article.
The authors declare that the research was conducted in the absence of any commercial or financial relationships that could be construed as a potential conflict of interest.
All claims expressed in this article are solely those of the authors and do not necessarily represent those of their affiliated organizations, or those of the publisher, the editors and the reviewers. Any product that may be evaluated in this article, or claim that may be made by its manufacturer, is not guaranteed or endorsed by the publisher.
The Supplementary material for this article can be found online at: https://www.frontiersin.org/articles/10.3389/fsufs.2025.1452975/full#supplementary-material
Aburto, T. C., Batis, C., Pedroza-Tobías, A., Pedraza, L. S., Ramírez-Silva, I., and Rivera, J. A. (2022). Dietary intake of the Mexican population: comparing food group contribution to recommendations, 2012-2016. Salud Publica Mex. 64, 267–279. doi: 10.21149/13091
Agada, M. O., and Igbokwe, E. M. (2015). Dietary diversity of rural households in north Central Nigeria. Eur J Nutr Food Saf 5, 150–155. doi: 10.9734/EJNFS/2015/14875
Agrawal, PK. Emerging obesity in northern Indian states: A serious threat for health. In Bankik: IUSSP Conference in Bangkok, (2002). Available online at:http://archive.iussp.org/Bangkok2002/S7Agrawal.pdf.
Asif, M., Rooney, L. W., Ali, R., and Riaz, M. N. (2013). Application and opportunities of pulses in food system: a review. Crit. Rev. Food Sci. Nutr. 53, 1168–1179. doi: 10.1080/10408398.2011.574804
Ayaz, A., Karthikeyan, B., Vignesh, S., Teotia, S., and Singh, S. P. (2009). Perceptual mapping of beverages: Coffee and tea. Tiruchirappalli: Bharathidasan Institute of Management.
Bernabe, E., Marcenes, W., Hernandez, C. R., Bailey, J., Abreu, L. G., Alipour, V., et al. (2020). Global, regional, and National Levels and trends in burden of Oral conditions from 1990 to 2017: a systematic analysis for the global burden of disease 2017 study. J. Dent. Res. 99, 362–373. doi: 10.1177/0022034520908533
Bhattacharyya, P. R., and Dasgupta, S. (2014). Perceptual mapping of consumers: a correspondence analysis approach towards consumers of leather products in Calcutta, India. AFBE J. 7:91.
Bhushan, C., Taneja, S., and Khurana, A. (2017). Burden of packaged food on schoolchildren: Based on the CSE survey ‘know your diet. Centre for Science and Environment: New Delhi, India.
Bishnoi, S., Sangeeta, V., Lenin, V., Paul, S., Sahu, S., Singh, P., et al. (2018). An analysis of food accessibility and availability of agricultural households in bundelkhand region of Uttar Pradesh. Soc. Commun. Mobil. Sustain. Develop. 1, 79–85.
Cattafesta, M., and Salaroli, L. B. (2018). Diets high in vegetables, fruits, cereals, and tubers as a protective factor for metabolic syndrome in bank employees. Diabetes Metab Syndr Obes 11, 781–790. doi: 10.2147/DMSO.S184716
Chaudhary, P., Gupta, R., and Verma, R. (2019). Impact of dietary and nutrition education intervention on nutritional knowledge of moderately anemic adolescent girls of kangra district, Himachal Pradesh. J. Commun. Mobil. Sustain. Develop 3, 485–493.
Chaudhary, M., and Sharma, P. (2023). Abdominal obesity in India: analysis of the National Family Health Survey-5 (2019–2021) data. Lancet Reg. Health Southeast Asia 14:100208. doi: 10.1016/J.LANSEA.2023.100208
Chen, P. J., and Antonelli, M. (2020). Conceptual models of food choice: influential factors related to foods, individual differences, and society. Food Secur. 9:1898. doi: 10.3390/FOODS9121898
Dandona, L., Dandona, R., Kumar, G. A., Shukla, D. K., Paul, V. K., Balakrishnan, K., et al. (2017). Nations within a nation: variations in epidemiological transition across the states of India, 1990–2016 in the global burden of disease study. Lancet 390, 2437–2460. doi: 10.1016/S0140-6736(17)32804-0
Das, A., Raychaudhuri, U., and Chakraborty, R. (2012). Cereal based functional food of Indian subcontinent: a review. J. Food Sci. Technol. 49, 665–672. doi: 10.1007/s13197-011-0474-1
De Oliveira, S. R., Fisberg, R. M., Marchioni, D. M., and Troncoso, B. V. (2015). Dietary patterns for meals of Brazilian adults. Br. J. Nutr. 114, 822–828. doi: 10.1017/S0007114515002445
De Onis, M., Blössner, M., and Borghi, E. (2010). Global prevalence and trends of overweight and obesity among preschool children. Am. J. Clin. Nutr. 92, 1257–1264. doi: 10.3945/AJCN.2010.29786
Devi, S. M., Balachandar, V., Lee, S. I., and Kim, I. H. (2014). An outline of meat consumption in the Indian population - a pilot review. Korean J. Food Sci. Anim. Resour. 34, 507–515. doi: 10.5851/KOSFA.2014.34.4.507
Dhillon, P. K., and Kumar, B. (2022). Increased knowledge on physical activity level (PAL) improves blood glucose level (BGL) of adult males with Type-2 diabetes mellitus: a comparative study from border-belt of Indian Punjab. J. Commun. Mobil. Sustain. Develop. 17, 285–292.
Erhardt, J., and Olsen, A. (2021). Meat reduction in 5 to 8 years old children—a survey to investigate the role of parental meat attachment. Food Secur. 10:1756. doi: 10.3390/FOODS10081756
Gomma, A., and Rana, K. (2007). Inter-household and intra-household patterns of fish and meat consumption in fishing communities in two states in Nigeria. Br. J. Nutr. 97, 145–152. doi: 10.1017/S0007114507201734
Green, R., Milner, J., Joy, E. J. M., Agrawal, S., and Dangour, A. D. (2016). Dietary patterns in India: a systematic review. Br. J. Nutr. 116, 142–148. doi: 10.1017/S0007114516001598
Guan, V. X., Probst, Y. C., Neale, E. P., Batterham, M. J., and Tapsell, L. C. (2018). Identifying usual food choices at meals in overweight and obese study volunteers: implications for dietary advice. Br. J. Nutr. 120, 472–480. doi: 10.1017/S0007114518001587
Havemeier, S., Erickson, J., and Slavin, J. (2017). Dietary guidance for pulses: the challenge and opportunity to be part of both the vegetable and protein food groups. Ann. N. Y. Acad. Sci. 1392, 58–66. doi: 10.1111/NYAS.13308
Hunter, S. R., and Mattes, R. D. (2020). “The role of eating frequency and snacking on energy intake and BMI” in Handbook of eating and drinking: Interdisciplinary perspectives. ed. H. L. Meiselman (Cham: Springer International Publishing), 659–678.
IIPS. Annual report of international Institute for Population Sciences (IIPS). International Institute for Population Sciences, Deemed to be University. (2017).
Jakubowicz, D., Froy, O., Wainstein, J., and Boaz, M. (2012). Meal timing and composition influence ghrelin levels, appetite scores and weight loss maintenance in overweight and obese adults. Steroids 77, 323–331. doi: 10.1016/j.steroids.2011.12.006
Kähkönen, K., Sandell, M., Rönkä, A., Hujo, M., and Nuutinen, O. (2021). Children’s fruit and vegetable preferences are associated with their mothers’ and fathers’ preferences. Food Secur. 10:261. doi: 10.3390/FOODS10020261
Kassebaum, N. J., Barber, R. M., Bhutta, Z. A., Dandona, L., Gething, P. W., Hay, S. I., et al. (2016). Global, regional, and national levels of maternal mortality, 1990–2015: a systematic analysis for the global burden of disease study 2015. Lancet 388, 1775–1812. doi: 10.1016/S0140-6736(16)31470-2
Kumar, N., Kapoor, S., Kumar, N., and Kapoor, S. (2014). Study of consumers’ behavior for non-vegetarian products in emerging market of India. J Agribus Dev Emerg Econ 4, 59–77. doi: 10.1108/JADEE-05-2013-0016
Laureati, M. (2022). Determinants of preference and consumption of healthy food in children. Food Secur. 11:203. doi: 10.3390/FOODS11020203
Misra, A., and Shrivastava, U. (2013). Obesity and dyslipidemia in south Asians. Nutrients 5, 2708–2733. doi: 10.3390/nu5072708
Mudryj, A. N., Yu, N., and Aukema, H. M. (2014). Nutritional and health benefits of pulses. Appl. Physiol. Nutr. Metab. 39, 1197–1204. doi: 10.1139/APNM-2013-0557
Murakami, K., Shinozaki, N., Livingstone, M. B. E., Fujiwara, A., Asakura, K., Masayasu, S., et al. (2022). Characterisation of breakfast, lunch, dinner and snacks in the Japanese context: an exploratory cross-sectional analysis. Public Health Nutr. 25, 689–701. doi: 10.1017/S1368980020004310
Narsaiah, M. (2019). Indira Kranthi Patham a poverty eradication Programme in Yadadri Bhongir District of Telangana: A study. Int. J. Multidiscip. Educ. Res. 8, 148–158.
Parappurathu, S., Kumar, A., Bantilan, C., and Joshi, P. K. (2019). Household-level food and nutrition insecurity and its determinants in eastern India. Curr. Sci. 117:71. doi: 10.18520/cs/v117/i1/71-79
Pingali, P., Mittra, B., and Rahman, A. (2017). The bumpy road from food to nutrition security – slow evolution of India’s food policy. Glob. Food Sec. 15, 77–84. doi: 10.1016/J.GFS.2017.05.002
Popkin, B. M., Corvalan, C., and Grummer-Strawn, L. M. (2020). Dynamics of the double burden of malnutrition and the changing nutrition reality. Lancet 395, 65–74. doi: 10.1016/S0140-6736(19)32497-3
Roy, S. K., Satyapriya, L. V., Bishnoi, S., Jha, G. K., Kumar, P., Kademani, S. B., et al. (2024). Nutrient intake disparities among public distribution system beneficiaries in the Bundelkhand region. Curr. Sci. 127:214. doi: 10.18520/CS/V127/I2/214-221
Sarkar, P., Lohith, K. D. H., Dhumal, C., Panigrahi, S. S., and Choudhary, R. (2015). Traditional and ayurvedic foods of Indian origin. J. Ethnic Foods 2, 97–109. doi: 10.1016/J.JEF.2015.08.003
Schneider, P., Popkin, B., Shekar, M., Eberwein, J. D., Block, C., and Okamura, K. S. (2020). Health and economic impacts of overweight/obesity. Human Develop. Perspec., 69–94. doi: 10.1596/978-1-4648-1491-4_CH3
Singh, J., Kanaujia, R., and Singh, N. P. (2016). Pulse phytonutrients: nutritional and medicinal importance. J. Pharm. Nutri. Sci. 6, 160–171. doi: 10.6000/1927-5951.2016.06.04.5
Sobal, J., Bisogni, C. A., and Jastran, M. (2014). Food choice is multifaceted, contextual, dynamic, multilevel, integrated, and diverse. Mind Brain Educ. 8, 6–12. doi: 10.1111/MBE.12044
Vabø, M., and Hansen, H. (2014). The relationship between food preferences and food choice: a theoretical discussion. Int. J. Bus. Soc. Sci. 5:7.
Vaughn, A. E., Tabak, R. G., Bryant, M. J., and Ward, D. S. (2013). Measuring parent food practices: a systematic review of existing measures and examination of instruments. Int. J. Behav. Nutr. Phys. Act. 10:61. doi: 10.1186/1479-5868-10-61
Keywords: Correspondence analysis, dietary preferences, food groups, perceptual mapping, public distribution system
Citation: Roy SK, Satyapriya, Burman RR, Bishnoi S, Lenin V, Sahu S, Mahra GS, Singh R, Joshi P, Wason M, Barua S and Kademani SB (2025) Unveiling the palate: exploring compositional perceptual mapping to analyze dietary preferences across food groups. Front. Sustain. Food Syst. 9:1452975. doi: 10.3389/fsufs.2025.1452975
Edited by:
Li Chai, China Agricultural University, ChinaReviewed by:
Daniela Spina, University of Catania, ItalyCopyright © 2025 Roy, Satyapriya, Burman, Bishnoi, Lenin, Sahu, Mahra, Singh, Joshi, Wason, Barua and Kademani. This is an open-access article distributed under the terms of the Creative Commons Attribution License (CC BY). The use, distribution or reproduction in other forums is permitted, provided the original author(s) and the copyright owner(s) are credited and that the original publication in this journal is cited, in accordance with accepted academic practice. No use, distribution or reproduction is permitted which does not comply with these terms.
*Correspondence: Satyapriya, c2F0eWExMThleHRAZ21haWwuY29t; Sitaram Bishnoi, c3JleHQyMDExQGdtYWlsLmNvbQ==
Disclaimer: All claims expressed in this article are solely those of the authors and do not necessarily represent those of their affiliated organizations, or those of the publisher, the editors and the reviewers. Any product that may be evaluated in this article or claim that may be made by its manufacturer is not guaranteed or endorsed by the publisher.
Research integrity at Frontiers
Learn more about the work of our research integrity team to safeguard the quality of each article we publish.